


Languages
Pages
Legal


CEDI
Working Paper No. 06-04
The Impact of Labor Reallocation and Competitive Pressure on TFP Growth: Firm-Level Evidence from Crisis and Transition Ridden Bulgaria
Ralitza Dimova
June 2006
CED
I DIS
CUS
SIO
N P
APE
R SE
RIES
Centre for Economic Development & Institutions
Brunel University West London
http://cedi.org.uk

1
The Impact of Labor Reallocation and Competitive Pressure on TFP Growth:
Firm-level Evidence from Crisis and Transition Ridden Bulgaria
Ralitza Dimova*
Faculty of Economics and Finance
Brunel Business School
June 20, 2006
* Ralitza Dimova, Faculty of Economics and Finance, Brunel Business School, Brunel University
Uxbridge, Middlesex UB8 3PH, United Kingdom, Phone +44 794782360 Fax: +44 (0)1895
266649

2
The Impact of Labor Reallocation and Competitive Pressure on TFP Growth:
Firm-level Evidence from Crisis and Transition Ridden Bulgaria
ABSTRACT
This paper uses the natural experiment of a macro-financial crisis and radical liberalization in
Bulgaria to explore the impact of labor reallocation and competitive pressure on Total Factor
Productivity (TFP) growth in the manufacturing sector. Our results indicate that labor reallocated
from less efficient to more efficient firms in virtually all industries but the influence of other
within industry characteristics on TFP growth was significantly higher. Furthermore, while
increased competitive pressure had a positive impact on TFP growth among relative laggards in
the respective industries, this impact was more than overwhelmed by the inability of industrial
leaders to leapfrog their competitors.
Keywords: Total factor productivity, employment turnover, competitive pressure, technological
frontier, Bulgaria, Europe

3
ACKNOWLEDGEMENTS
I thank Ira N. Gang, Jozef Konings, Johan Swinnen and Patrick Paul Walsh for helpful
comments. The usual disclaimers apply.

4
1. INTRODUCTION
The link between economic liberalization and Total Factor Productivity (TFP) growth has long
been one of the most prolific areas of microeconomic research in both developed and developing
countries. On the one hand, economists have explored the process of Schumpeterian creative
destruction, whereby key productive resources such as labor move from less productive to more
productive firms as the former downsize and exit and the latter prosper and expand operations
(Olley and Pakes, 1996; Roberts and Tybout, 1996). On the other hand, they have studied the
increase in firm and industrial productivity by way of improvements in X-efficiency, investment
in catching up activities by technologically backward producers and innovation by technological
leaders (Levinsohn, 1993, Nickell, 1996; Aghion and Howitt, 1992; Aghion, Harris and Vickers,
1997).
Although economic theory provides numerous arguments in favour of a positive impact
of liberalization on productivity, empirical evidence is not straightforward. For example, the
question still remains as to whether high job and employment turnover is necessarily efficiency
enhancing and/or simply a reflection of volatile environment and large number of small entrants
that emerge and die out frequently out of inability to graduate and compete with large entrenched
conglomerates (Swanson and Tybout, 1988; Levinsohn, 1999; Roberts and Tybout, 1996).
Similarly, while increased market pressure has often been found to contribute to X-efficiency
improvement (Levinsohn, 1993; Nickell, 1996), doubts remain of whether it also leads to
increased economies of scale and R&D investment in emerging industrial sectors (Rodrik, 1992;
Pack, 1988).
Theoretical and empirical studies on developed economies have recently challenged the
neo-Schumpeterian view that increased competition is likely to discourage innovation by wiping
out the rents of potential investors (Aghion and Howitt, 1992; Rodrik, 1992). They have shown
that a scenario where laggards imitate and catch up with industrial leaders before aspiring for

5
leadership in the future while leaders innovate in order to avoid neck-and-neck competition leads
to a positive link between competition and innovation among firms close to the technological
frontier (Aghion, Harris and Vickers, 1997; Aghion et al, 2001; Konings and Vanderbusche,
2004; Aghion et al, 2005).
Evidence from developing countries, on the other hand, often argues against this logic.
Handoussa, Nishimizu and Page (1986) for instance show that in the process of liberalization in
Egypt, once-and-for-all improvement in TFP took place as a result of movement of relatively
inefficient firms towards the technological frontier. TFP improvement ceased once these less
efficient firms reached the frontier, while the firms that were originally at the frontier failed to
improve their technological performance.
This paper attempts to throw light on some unanswered questions by exploring the
potential impacts of two important consequences of post-crisis liberalization in Bulgaria on TFP,
namely increased employment turnover and competitive pressure. We find the Bulgarian volatile
environment of 1995-2001 particularly interesting due to the clear demarcation of a lacklustre
pre-crisis period, macro-financial crisis and post-crisis rapid liberalization. While the CEE
countries that joined the European Union (EU) in 2004 reached the trough of their output loss in
1991-92 and were able to contain inflation by 1993; Bulgaria’s GDP continued to fall through
1993, and hyperinflation was witnessed as late as 1997. This lacklustre performance relative to
most other CEE countries was largely a result of the absence of reform until the macro-financial
crisis of 1996-97, accompanied by one of the most dramatic mid-1990 depressions in the history
of the CEE economies.
In reaction to the crisis the government initiated radical reforms that targeted both
macroeconomic stability and structural changes. By the end of the 1990s, explicit subsidies
reached a level below the EU average of 1.7 percent (World Bank, 2001) and the private sector’s
contribution increased to 70 percent of the GDP (Commission of the European Communities,
2001, IMF, 1999, 2000). The denationalization of public property was supplemented by high

6
level of internal and external liberalization of the economy i, such that by 1998 Bulgaria was
ranked in the top 5 percentile among IMF member countries in terms of liberalization.
Liberalization was rewarded by significant FDI inflow, the inflow during 1997-99 alone
exceeding by 80 percent the entire stock of FDI attracted during the 1991-96 period (World Bank,
2001).
These positive developments did not remove the doubts associated with industrial revival
and TFP growth. For example, while the net job destruction in more advanced CEE economies
like Hungary and Poland, reached an equilibrium level of approximately zero, in Bulgaria, during
1997-2001, net job destruction continued to be positive and significant, raising doubts about the
Schumpeterian character of labor reallocation (Bilsen and Konings, 1998; Garibaldi, Makovec
and Stoyanova, 2001; Rutkowski, 2003, Havlik, 2004). Agency problems as a result of a
suboptimal mix of mass and cash privatization strategies (Miller and Petranov, 2000), together
with one of the most impressive incidences of credit crunch among the CEE economies raise
further questions about the ability of firms to survive increased internal and external competition
and embark on productivity enhancing policies (IMF, 2002). In other words, the Bulgarian
experience provides an interesting natural experiment for the analysis of labor reallocation and
increased competitive pressure on TFP growth at the firm and industry level.
Our results indicate that in the environment of macro-financial crisis and structural
reform in Bulgaria labor reallocated from less efficient to more efficient firms in virtually all
manufacturing sectors but the influence of other within industry characteristics on TFP growth
was significantly higher. Furthermore, while increased competitive pressure had a positive impact
on TFP growth among relative laggards in the respective industries, this impact was more than
overwhelmed by the inability of industrial leaders to leapfrog their competitors.
The rest of the paper is organized as follows. Section 2 outlines the conceptual
framework and empirical specification for our analysis of the two different post-liberalization
determinants of TFP growth-employment reallocation and competitive pressure. The data is
7
described in some detail in Section 3. The results from decomposing productivity into labor
reallocation and non-reallocation factors are reported in Section 4, while Section 5 highlights the
regression results from our analysis of the impact of increased competitive pressure on TFP
growth. Section 6 concludes.
2.ANALYTICAL PARADIGM
2.1. Productivity decompositions
Suppose that the average unweighted firm-level productivity for an industry in period t
is tP_
. If we denote the deviation of the productivity of the i-th firm from this average by ti PP_
−
the difference would be positive for firms that are more productive than the average, and negative
for firms less productive than the average. Let, on the other hand, the deviation of the
employment weight of the i-th firm in the industry from the employment weight of the average
firm in the industry be _
ti WW − .
As demonstrated by Olley and Pakes (1996), the weighted average productivity of the
industry would be given by the following:
[1] ))((___
titiitt PPWWPP −−Σ+=
If the covariance ))((__
titii PPWW −−Σ is positive, firms whose productivity is higher than
average account for the majority of the employment in the industry, and vice versa in the case
when the cross product is negative.
The Olley-Pakes decomposition indicates whether or not more productive firms are gaining
at the expense of the less productive firms. But it does not differentiate between the individual
contribution of resource reallocation and factors that are not related to resource reallocation on
8
productivity growth. This dual impact of liberalization on firm-level productivity is captured by
the Griliches-Regev decomposition.
Suppose that a firm’s productivity changes from tP to 1+tP between periods t and t+1, while
its weight within the industry changes from tW to 1+tW . This would lead to a change in the firm’s
contribution to the industry’s productivity from tt PW to 11 ++ tt PW . Griliches and Regev (1995)
argued that since this change in the firm’s contribution to the industry’s productivity can be
accounted for by a change in the firm’s productivity and/ or a change in the firm’s weight, the
following relationship must hold:
[2] dWPWdPPWPW tttt +=−++ 11
where dP refers to a change in productivity, given the weight of the firm within the industry
(W), and dW refers to a change of the firm’s weight within the industry, given its productivity (P).
It is easy to see that the overall productivity of an industry can increase either because of
an increase in the productivity of an average firm belonging to the industry, or because of the
increase in the share/ weight of the more productive firms within the industry. If, for example,
resources, in our case labor, reallocate towards more productive firms within the industry,
industrial productivity would increase on account of the “between” changes in productivity. If, on
the other hand, liberalization and the ensuing competition render the firms more productive, the
increase in the overall (weighted) productivity of the industry follows on account of “within” firm
changes in the industry.
2.2. The impact of competitive pressure on TFP growth
In trying to disentangle the remaining developing country dilemmas related to the impact
of competitive pressure on TFP growth, we use a fairly stylized empirical model, a direct

9
empirical counterpart of some of the cutting edge recent theories of the impact of competition and
distance from the technological frontier on TFP growth (Griffithh, Redding and Simpson, 2003;
Konings and Vanderbussche, 2004; Aghion et al, 2005):
[3] 13210 −+∆+∆+=∆ itjtjtit DISTHERFIMPTFP ββββ
ititjtitjt DISTHERFDISTIMP ηββ +∆+∆+ −− 1514 **
where itTFP∆ stands for the change in itTFP between each two successive years.
jtIMP∆ and jtHERF∆ are the respective changes in import penetration and industrial market
concentration, which are stylized measures of product market competition from abroad and in the
domestic market (Roberts and Tybout, 1996; Tybout, 2000).
We also define a variable capturing the distance between each firm and the technological
leader in a given national sector j, namely the ratio of firm i’s TFP relative to the maximum TFP
level in sector j (Griffith, Redding and Simpson, 2002; Konings and Vanderbussche, 2004;
Aghion et al, 2005):
[4] j
iij MaxTFP
TFPDIST = ,
In the two extreme cases, a distance close to 1 indicates that a domestic firm is close to the
technological frontier in the respective industrial sector of the national economy, while a distance
of 0 indicates that it is significantly less efficient than the domestic technological leader. By
interacting this variable with our measures of internal and foreign product market competition, we
attempt to identify differential influence of product market competition on the behaviour of firms
belonging to different positions of the national technological frontier.

10
As argued at the outset, the hypotheses related to this specification are not
straightforward. To begin with, there are arguments to suggest that increased product market
competition exerts downward pressure on costs, reduces slack, provides incentives for efficient
organization of production and even drives innovation forward (Nickell 1996; Levinsohn, 1993).
When increased competitive pressure is a result of an inflow of superior imports from abroad,
technological diffusion may lead to a further boost in TFP growth (Eaton and Kortum, 1996,
1997; Bernard and Jones, 1996). In other words, 1β >0 and 2β >0.
These arguments are challenged by theories that allow for either backward bending labor
supply curve of incumbent entrepreneurs (Corden, 1974) or absence of a frictionless entry and
exit into the industry (Rodrik, 1992) both of which place significant barriers to the rationalization
of production. Improved corporate governance and innovation could be further aggravated in an
environment of macroeconomic instability and credit crunch, which precludes the adequate
financing of innovative activities (Rodrik, 1992; Aghion et al, 2005A; Aghion et al, 2006). In
sum, both theoretical and empirical evidence provide support to insignificant or even negative
values of 1β and 2β .
While the direction of the immediate impact of increased competitive pressure on TFP
growth is therefore difficult to predict, recent theories of imitation and innovation argue in favour
of TFP growth among firms closest to the technological frontier, i.e. 4β >0, 5β >0 (Aghion et al,
1997; Aghion et al, 2001; Aghion et al, 2005A). Specifically, in an environment where laggards
are capable of imitating and hence moving in a step-by-step fashion towards the technological
leader, the threat of neck-and-neck competition pushes the leader to innovate. In the specific case
of a boost in foreign competition, mature domestic firms close to the technological frontier are
likely to benefit from the efficiency enhancing pressure of increased imports, even if enhanced
foreign competition may hurt domestic laggards (Konings and Vanderbussche, 2004).
11
While these theories have found a sound empirical backing in the context of developed
economies we are not aware of tests of these hypotheses in the context of a developing country.
This omission is surprising, as a case could easily be made for their rejection in a less developed
context. For instance, while firms close to the technological frontier in developed countries are
also close to the world technological frontier and hence capable of benefiting from efficiency
enhancing neck-and-neck competition with foreign products, firms at the national frontier of a
developing country may be far away from the world technological frontier and incapable of either
innovating or imitating sufficiently to reach the world technological leader. They may therefore
face higher probability of being displaced by imports or foreign investors in the domestic market
than leapfrog these foreign competitors, especially in the case when macroeconomic instability
and credit crunch makes the financing of new projects difficult. In other words, we allow for the
possibility of rejection of the hypothesis of a positive impact of both increased competitive
pressure in general, and improved innovative activities of firms close to the national technological
frontier in particular, in the context of a less developed economy.
3. DATA
The data for the analysis have largely been obtained from the Amadeus data base ii which we use
for our production function estimations. Following the established practice related to TFP
estimations based on the Amadeus data base (Konings, VanCayseele and Warsynski, 2005 and
Konings and Vanderbussche, 2004) we use the firm level annual value of operating revenues as a
proxy for output; the value of firm level tangible fixed assets as a proxy for fixed capital; and the
number of employees and material costs, as proxies for the labor and intermediate inputs,
respectively. The Amadeus data were also used to generate Herfindahl indices for all NACE 2-
digit industries. These indices are a stylized proxy for the degree of domestic competition at the
industry level. The Amadeus data were supplemented with import penetration indices obtained

12
from the National Statistical Institute of Bulgaria, import penetration being the stylized proxy for
competition from foreign firms at the industry level.
Despite the absence of change in criteria for inclusion of firms in the Amadeus data base,
our original sample indicates a 10-time increase in the number of firms between 1995 and 2001.
This trend is inconsistent with the anecdotal evidence of a rather low level of entry of de novo
firms in the Bulgarian manufacturing sector (Rutkowski, 2003) and might therefore be indicative
of a high degree of shedding of existing firms into numerous micro affiliates, not necessarily
indicative of corresponding job creation and productivity enhancement iii. To find an answer to
this apparent puzzle, we experimented with the data using four different types of samples, namely
(i) a full sample, (ii) a sample cleaned from outliers, (iii) a sample restricted to firms of more than
1 employee each, and (iv) a sample restricted to firms of more than 10 employees each.
While our results across these three different sets of estimates are not contradictory, we
obtain the best fit and highest level of consistency across specifications with the use of the sample
of 10 or more employees, and hence report the results based on this sample. The sample
restriction is consistent with the conventional practice in employment and productivity related
studies around the world and is comparable to studies based on official national databases of
population of firms in emerging economies. Most importantly, it allows us to distinguish
conventional firms or entrepreneurs from self-employed/ own account individuals whose
behaviour is typically indicative of hidden unemployment (Leidholm and Mead, 1987; Earle and
Sakova, 2000). In each year, our working sample of firms that hire at least 10 employees covers
more than 60 percent of the Bulgarian industrial employment (see Appendix 1 for comparison of
the coverage of the restricted Amadeus sample used with national statistics; for further
comprehensive overviews of the data see Konings, VanCayseele and Warsynski, 2005 and
Klapper, Laeven and Rajan, 2003).
The main disadvantage of the Amadeus data set is the difficulty in appropriately
identifying entering and exiting firms and basing the analysis explicitly on the contribution of
13
those firms to productivity growth (Klapper, Laeven and Rajan, 2003). For example, as
companies exit or stop reporting their financial statements, Amadeus reports the status of these
companies as “not available or missing” for 4 years, and they are removed from the database after
the 5th year of non-reporting; such that the 2001 data base does not include firms that exited prior
to 1998. This peculiarity is unlikely to bias our results, given the relatively few incidents of
bankruptcy in the Bulgarian manufacturing sectors prior to the crisis of 1996-97 and the ensuing
radical liberalization (Commission of the European Communities, 2001, World Bank, 2001).
However, it certainly precludes the explicit focus on the impact of entry and exit on productivity,
moreover that a large number of missing observations on the date of incorporation, makes it
difficult to properly record new entries.
This latter problem is further exacerbated by the fact that even when this information is
available, we are unable to ascertain whether the date of incorporation accounts for the actual
entry of a new firm in the industry or is a result of a merger or splitting of firms into different
entities. We therefore concentrate on employment reallocation and productivity trends in
predominantly surviving firms, many of which entered the market between 1995 and 2001 and a
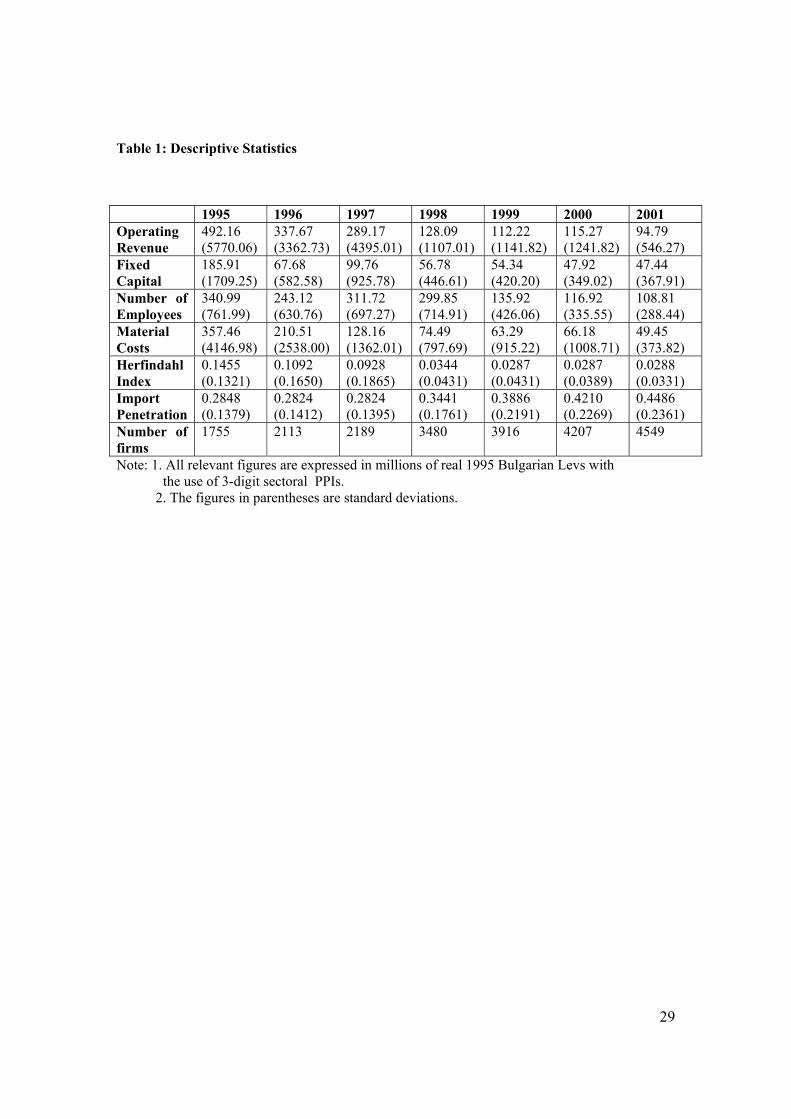
few of which exited the market during the same period. The descriptive statistics, based on an
unbalanced panel of 5885 Bulgarian firms are reported in Table 1. All relevant variables
(operating revenues, fixed capital and material costs) are expressed in terms of the 1995 real
levels of the Bulgarian national currency, i.e., the lev, with the use of 2-digit sectoral PPIs
obtained from the National Statistical Institute. They indicate the following:
<< Insert Table 1 about here>>
• Operating revenues in the Bulgarian manufacturing sector declined monotonically over
time and this trend was followed by downward adjustment of the value of material costs.
At the same time, the manufacturing sector saw fixed capital fluctuations. Specifically, in

14
the crisis year 1996, the mean value of fixed capital declined by 67 percent. In 1997, it
saw a slight recovery, perhaps as a result of investment inflow during the privatization. It
then continued to fall till 2001.
• An average firm in the Bulgarian manufacturing sector experienced reduction in its
number of employees, implying large scale redundancies subsequent to structural reform.
The only period which saw a slight increase in average employment was the crisis period
1996-1997, an observation, consistent with the finding of Rutkowski (1999) and Dimova,
Gang and Landon-Lane (2004) in that (state- owned) firms created jobs and provided a
buffer for significant proportion of the population during the crisis.
• The statistics also highlight an impressive increase in the extent of both domestic and
foreign competition in the Bulgarian manufacturing sector in the aftermath of the crisis
and radical structural reform. Specifically, during 1995-2001, the Herfindahl index
declined from 0.1455 to 0.0288 and the import penetration index increased from 0.2848
to 0.4486.
The data were first used to generate Total Factor Productivity (TFP) estimates as a residual
from production function estimation. To calculate TFP, we use the Levinsohn-Petrin (2003)
methodology, which has several advantages over alternative methodologies. A brief overview of
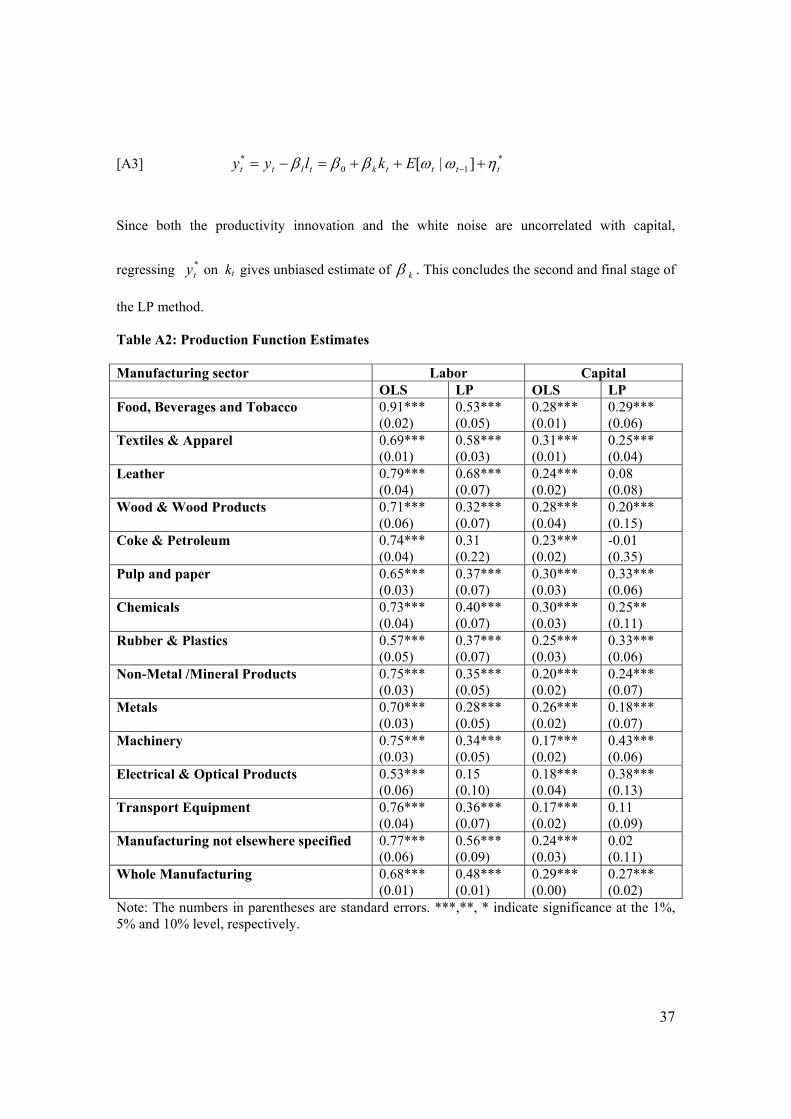
the methodology, justification of its use and OLS and LP production function estimates for both
the manufacturing sector as a whole and individual industries, are reported in Appendix II. A
comparison of the OLS and LP coefficient estimates indicate that these estimates move in the
direction of successful elimination of the expected simultaneity bias (e.g., Pavcnik, 2002;
Konings and DeLoecker, 2006). Specifically, Table A1 indicates that the OLS estimates of the
labor variable are generally overestimated vis-à-vis the LP estimates, while the OLS estimates of
the capital variable are in general underestimated when compared to the LP estimates. This
pattern is consistent with the theoretical assumption that the freely variable labor is typically easy
to adjust by hiring more labor when a positive shock takes place and shedding labor when a

15
negative shock takes place. At the same time, firms with higher capital stock are more likely to
remain in the market when a negative shock takes place thus leading to a negative bias of the
OLS estimate of capital. We therefore go on to derive TFP as the residual from our LP production
function and base the rest of our analysis on this productivity measure.
<< Insert Figure 1 about here>>
Figure 1 highlights the development of (the median) TFP over time. We observe a
significant TFP decline over the crisis period of 1996-97, followed by substantial recovery in the
immediate aftermath of the crisis, possibly on account of macro stabilization and FDI inflow, and
then a new trough in the environment of massive liberalization before reaching a relative stability
at a level lower than that preceding the crisis. It will become clear from the description of our
decomposition results that the intra-industry trends in TFP growth are consistent with this general
trend. In sum, although the short span of the panel precludes generalization about the long run
impact of liberalization on TFP, our preliminary look at the TFP evolution does indicate an
absence of recovery at least half a decade subsequent to the macro-financial crisis and initiation
of radical structural reform, including a massive FDI inflow. The rest of the paper is devoted to
the explanation of this phenomenon.
4. DECOMPOSITION RESULTS
As a first step in our analysis we use the Olley-Pakes and Griliches-Regev
decomposition, in order to account for the potential influence of resource reallocation on TFP
growth in the context of economic liberalization. To recapitulate, both methodologies are based
on a weighted measure of productivity with the weight indicating the share of industrial labor by
firms belonging to different portions of the industrial productivity distribution. By choosing the
share of industrial employment we concentrate on the reallocation of labor across firms of
different productivity levels. A positive covariance term in the Olley-Pakes decomposition
indicates reallocation of employment towards more productive firms in the respective industries,

16
while a larger absolute value of the between than within component of the Grilichev-Regev
decomposition indicates a higher impact of labor reallocation, as opposed to firm and industry
factors, on growth in total factor productivity.
<<Insert Table 2 about here>>
Table 2 reports the Olley-Pakes decomposition results. Column 1 in Table 2 highlights
the respective weighted productivity measures in each industry and year (the left-hand side
variable in equation [1]), column 2 highlights the unweighted productivity measures (the first
right-hand side term in equation [1]) and column 3 highlights the covariance term (the second
right-hand side term in equation [1]) Except for the electrical and optical equipment sector in the
immediate aftermath of the crisis, namely the values of – 0.0243 in 1997 and -0.2439 in 1998, the
covariance term in the Olley-Pakes decomposition is positive for each year and industry in
Bulgaria. This indicates that labor reallocated towards more productive firms in the
manufacturing sector during the whole period. Note that our productivity measure is total factor
productivity. Hence labor reallocation towards more productive firms in our context indicates
labor reallocation towards technologically more advanced firms within the respective industries.
In other words, the Olley- Pakes results are consistent with the assumption of productivity
enhancing and skill upgrading process of creative destruction in the Bulgarian manufacturing
sector in the context of liberalization.
Our Olley-Pakes results also support our preliminary evidence that an average
manufacturing firm in Bulgaria experienced total factor productivity decline in the majority of
sectors and years. For instance, the weighted value of TFP in the food industry declines from 6.16
in 1995 to 5.67 in 2001, while the weighted value of TFP in the electric and optical industry
declines from 5.34 in 1995 to 4.69 in 1998 before recovering to 5.24 in 2001. In virtually all
industries the post 1999 values of TFP are lower than the respective values in 1995.
<< Insert Table 3 about here>>

17
To explore this phenomenon further we take a look at the determinants of the weighted
component of total factor productivity change with the use of our Grilichev- Regev
decomposition, the results from which are reported in Table 3 iv. Column 3 of Table 3 highlights
the change in the weighted value of the productivity variable (the left-hand side variable in
equation [2]) Column 1 reports the between value of the productivity decomposition (the first
right- hand side term in equation [2]) while column 2 reports the within value of the productivity
decomposition (the second right-hand side term in equation [2]).
These results indicate that in all industries and years the absolute value of the within
component is significantly higher than the absolute value of the between component. For
example, in the wood industry the 1995-1996 between term of 8.03E-09 is substantially lower
than the within term of -0.1641. In other words, total factor productivity growth, in the majority
of the cases negative, was primarily driven by characteristics other than labor reallocation. The
impact of the efficiency inhibiting within characteristics often overwhelmed the positive impact
of efficiency enhancing labor reallocation between each two successive years. In sum, the
decomposition results provide further support to our earlier statement that in 1995-2001 Bulgaria
continued to be in a state of transition disequilibrium and productivity enhancement and
technological upgrading by way of X-efficiency improvements and investment in R&D were yet
to come. It is therefore important to address explicitly the direct impact of within industry factors
like increased competitive pressure on total factor productivity.
5. REGRESSION RESULTS
The estimates based on equation [3] and the respective Huber-White standard errors,
after controlling for industry and firm effects, are reported in Table 4. The first column of Table
4 reports the coefficient estimates from the base specification. The impact of yearly dummy
variables is included in column 2, thus accounting among other things for the impact of

18
macroeconomic volatility on TFP growth. Finally, the impact of both yearly and industry
dummies is accounted for in column 3.
To recapitulate, the theoretical literature provides us with soft hypotheses that the
pressure from both domestic and foreign competition has a positive impact on TFP growth
( 1β >0, 2β >0) and is likely to be strongest among firms closest to the industrial technological
leader ( 4β >0, 5β >0; 4β > 1β , 5β > 2β ). We allow for the rejection of these hypotheses in a
less developed economy context, especially one marked by macroeconomic instability and credit
crunch.
<< Insert Table 4 about here>>
Looking first at the results from the base equation, reported in column 1, we see that the
coefficient of the change in import penetration variable is + 1.85 and significant at the 1% level,
while the coefficient of the change in Herfindahl index is –0.6694 and once again significant at
the 1% level. In other words, the increase in both foreign competitive pressure by way of imports
and domestic competitive pressure by way of a decrease in industrial concentration have a
positive impact on firm-level TFP growth. These observations are consistent with theories and
evidence of a positive impact of increased competitive pressure on TFP growth by way of either
X-efficiency improvement or imitation and technological diffusion.
At the same time, the coefficient of the interaction term of the change in the import
penetration variable with our measure of distance from the technological frontier is –2.6416. As
our distance variable takes higher values the closest a firm is to the technological leader this
indicates that firms closest to the frontier are the ones most hurt by increased import penetration.
Indeed, the difference of -0.78 between the coefficient of the interaction term of the import
penetration variable and the distance variable (-2.64) and the coefficient of the un-interacted
import penetration variable (1.86) highlights a net negative impact of 0.78 of increase in import
penetration on the TFP growth of firms closest to the industrial technological leaders.

19
The results on the net impact of increase in domestic competition on firms close to the
technological frontier convey a similar message. Specifically, the coefficient of the interaction
term between the change in the Herfindahl index variable and the distance from the frontier
variable is +1.55. The net effect of a decrease in industrial concentration (or increase in domestic
product market competition) of 0.88 (1.55-0.6699) thus indicates that firms closest to the
technological leader were the one hurt most from the increase in domestic competition.
Once we control for year and industry effects (columns 2 and 3 of Table 4) we see that
the direct positive impact of import penetration on growth in TFP decreases (from 1.86 in column
1 to 1.31 in column 3), while the positive impact of increase in domestic competition on TFP
growth increases (from 0.6699 in column 1 to 1.01 in column 3). At the same time the net
negative impact of increased foreign competition on firms closest to the technological leader goes
up to 1 once yearly effects are taken into account (column 2), and to 1.04 once both yearly and
industrial effects are taken into account (column 3). The same is true for the net negative impact
of increased domestic competition on TFP growth, with the difference between the coefficients of
the interaction term of change in the Herfindahl index and the non-interacted change in
Herfindahl index variable increasing from 0.88 in column 1 to 1.7 in column 2 and 1.33 in
column 3.
The observations related to the impact of competition on firms near the technological
frontier in Bulgaria contradict evidence from developed economies, which shows that firms
closest to the technological frontier are the ones most likely to realize fully the positive impact of
increased competitive pressure. As argued in section 2, these contradictions are not difficult to
explain in the context of a less developed country. It is plausible to assume that the technological
gap between domestic and overseas competitors in Bulgaria is large enough such that the firms on
the national technological frontier lag behind foreign competitors enough to be discouraged to
catch up with the world leader and the catching up process is likely to be especially difficult in
the context of macroeconomic uncertainty and credit market failure. This, while a more liberal
20
economic environment may have made it easier for laggards to imitate and improve their
corporate governance enough to move towards the respective national leaders, firms that have
reached the local frontier and exhausted the domestic technological capacity may find it difficult
to leapfrog their superior foreign competitors.
External trade statistics are not inconsistent with this logic. They indicate that in the
1990s Bulgarian firms faced significant (and indeed increasing) competition from technologically
superior overseas products and this may have decreased their incentives to innovate or even
forced them to downsize and exit the market. Specifically, in the second half of the 1990s and the
beginning of the 2000s, imports from OECD countries, such as EU member states and the USA
took a significant proportion of the Bulgarian import basket. For example, between 1997 and
2001 imports from main OECD partner countries increased from 26.7 to 36 %. During the same
period, the proportion of technologically superior products such as chemicals, manufactured
goods and machinery and equipment was highest and indeed increased from 45.3 to 57.5
(Commission of the European Communities, 2004). The same argument could be brought
forward vis-a-vis the increase of internal competition. It is plausible that the entry of foreign
multinationals hit hardest the potential domestic competitors, close enough to the domestic
technological frontier but still lagging behind the foreign entrants.
Before concluding it is perhaps worthwhile highlighting several potential econometric
problems, despite the fact that, as emphasized on several occasions, our specification is a direct
and fairly stylized empirical counterpart of a widely used theoretical model. To begin with, one
could argue that the results may be driven by a high level of correlation by our different measures
of product market competition, namely import penetration and the Herfindahl index. However, in
our case, the correlation coefficient of only 0.10 between these variables indicates that this
argument does not hold. The correlation coefficient between either of these variables and the
distance from the frontier variable is even smaller, less than 1%, and the absence of
multicollinearity is further obviated by the relatively low value of the Rsq, which is similar to that

21
of similar studies of changes in TFP based on comparable sample sizes (Pavcnik, 2002; Konings
and Vanderbussche, 2004).
To avoid the possible endogeneity of our distance from the frontier variable, we have
taken the lagged value of this variable. At the same time, the endogeneity of the changes in
Herfindahl index and import penetration index is unlikely, given that our left hand side variable is
measured at the firm level, while these two right hand side variables are measured at the industry
level v. Finally, the possibility of unobserved heterogeneity/ fixed effects is accounted for by
estimating our model in first differences.
6. CONCLUDING REMARKS
The different channels through which liberalization can stimulate firm and industry level TFP
growth have long been of significant interest to economists. But although economic theory has
almost unambiguously supported a positive link between a fairly liberalized environment and
increase in productivity, empirical evidence has failed to reach a consensus. To begin with,
although few economists disagree that liberalization stimulates a better allocation of resources in
developed economies, it is argued that crisis- prone less developed industrial settings may
contribute to the exit of fairly efficient producers and survival of fairly inefficient producers in
the context of liberalization Furthermore, while there is evidence to suggest that increased
competitive pressure improves the innovative potential of at least frontier firms in developed
economies, evidence from developing countries often argues against this logic.
In this paper we address some of the controversies related to the impact of liberalization
on TFP growth in a less developed country by exploring the impact of labor allocation and
increased competitive pressure on TFP growth in the Bulgarian manufacturing sector. We find
that while in the environment of rapid liberalization labor reallocated from less efficient to more
efficient firms in virtually all manufacturing sectors, the impact of labor reallocation on TFP
growth was negligible compared to the influence of other within industry factors. Furthermore,
22
although both foreign and domestic competition had a positive impact on the TFP growth of
relative laggards in the domestic industries, this positive impact was more than overwhelmed by
the failure of domestic leaders to innovate and boost their TFP. This pattern is consistent with
experience of other liberalizing developing countries like Egypt and Yugoslavia which find that
while liberalization can stimulate the improved performance of firms in general, it doesn’t
necessarily improve the ability of national technological leaders to leapfrog (foreign) competition.
The failure of firms in developing countries to innovate is especially easy to explain in the
context of macroeconomic instability and credit crunch, which often precludes the sponsoring of
new projects.
Despite the failure to find evidence of a growth in TFP in the context of rapid
liberalization of the Bulgarian economy, even in the aftermath of structural reform and significant
inflow of FDI, our results cannot be interpreted as arguments against liberalization even amidst
macro-financial instability. On the one hand, we do find evidence in favor of improved allocative
efficiency and productivity-improving practices at least among laggards in the domestic
industries. One the other hand, the short span of the period under consideration and inevitable fir
a single study failure to capture all possible components of liberalization such as increased export
potential and import of cheaper inputs, makes our analysis somewhat restrictive. Our results, and
indeed similar evidence from other developing countries, do indicate however that any policy
making effort to enhance the long term growth potential of a developing country should take
seriously into account the capability of firms to push the national technological frontier forward.

23
i In compliance with its World Trade Organization (WTO) commitment Bulgaria reduced its tariff
rates to an average of 27 percent, and the import surcharge was removed a year ahead of schedule
on January 1, 1999. During the same year, around 85 percent of the Bulgarian imports from the
EU were not subject to tariffs. The tariff rate on the remaining products decreased to 30 percent
of the basic rate in 2000, 15 percent of the basic rate in 2001 and was finally reduced to zero in
2002. The process of liberalization was further institutionalized by way of enactment of the
Protection of Competition Act, leading to the harmonization of Bulgaria’s competition policy
with that of the EU.
ii The data base is collected and distributed by Bureau Van Dijk, a firm listed on the Brussels
Stock exchange, specialized in harmonizing company account data for European firms. Before
1999 the Amadeus set was available in annual CDROM editions including information on the
medium and large European companies, i.e. those satisfying at least one of the following criteria:
employment greater than 100, or total assets of more than 8 million USD, or sales exceeding 16
million USD. Since 1999 the coverage of the Amadeus data set has increased to encompass small
and medium enterprises.
iii We thank Paul Walsh for this explanation, based on on-going research at Trinity College
Dublin, Ireland. The authors are able to establish whether newly registered firms are really de
novo firms, or affiliates of former conglomerates, which have registered as separate entities. The
preliminary results indicate that the absence of productivity changes in the aftermath of increase
in the number of firms in the economy is indeed driven by an absence of increase in productive
heterogeneity due to the fact that traditional firms have simply split into several different entities.

24
iv Note that the changes in the weighted value of TFP reported in column 3 of Table 3 are the
respective differences in the weighted TFP values reported in column 1 of Table 2 between each
two successive years.
v Specifically, while both the industrial concentration and import penetration may be driven by
the distribution of firm characteristics that determine industry level TFP, they are unlikely to be
driven by individual TFP changes at the firm level.

25
REFERENCES
Aghion, P and Howitt, P. (1992). A model of growth through creative destruction. Econometrica,
60, 323-51.
Aghion, P., Angeletos, G., Banerjee, A. and Manova, K. (2005A). Volatility and growth: credit
constraints and productivity-enhancing investment. NBER Discussion Paper no. 11349.
http://www.nber.org/papers/w11349.pdf
Aghion, P., Bloom, N., Blundell, R., Griffithh, R. and Howitt, P. (2005). Competition and
innovation: an inverted-U relationship. The Quarterly Journal of Economics, 120, 701-
28.
Aghion, P., Comin, D. and Howitt, P. (2006). When does saving matter for economic growth?
Mimeo. Harvard University:
http://post.economics.harvard.edu/faculty/aghion/papers/When_Does_Domestic_Saving.
Aghion, P., Harris, C and Vickers, J. (1997). Competition and growth with step-by-step
innovation: an example. European Economic Review, 41, 771-82.
Aghion, P., Harris, C., Howitt, P and Vickers, J. (2001). Competition, imitation and growth with
step-by-step innovation. The Review of Economic Studies, 68, 467-92.
Bernard, A. and Jones, C. (1996). Comparing apples to oranges: productivity convergence and
measurement across industries and countries. American Economic Review, 86, 1216-38.
Bilsen, V. and Konings, J. (1998). Job creation, job destruction and growth in newly established,
privatized and state owned enterprises in transition economies: survey evidence from
Bulgaria, Hungary and Romania. Journal of Comparative Economics, 26, 429-45.
Commission of the European Communities (2001). Regular report on Bulgaria’s progress towards
accession: http://ec.europa.eu/comm/enlargement/report2001/bu_en.pdf
Commission of the European Communities (2004). Statistical Yearbook of the Candidate
Countries.
26
Corden, M. (1974). Trade policy and economic welfare. Oxford: Oxford University Press.
Earle, J. and Sakova, S. (2000). Business start-ups or disguised unemployment? Evidence on the
character of self-employment in transition economies. Labor Economics, 7, 575-601.
Eaton, J. and Kortum, S. (1996). Trade in ideas: productivity and patenting in the OECD. Journal
of International Economics, 40, 251-78.
Garibaldi, P. Makovec, M. and Stoyanova, G. (2001). From transition to EU accession. The
Bulgarian labor market during the 1990s. World Bank Technical Paper no. 494. The
World Bank, Washington D.C. USA.
Griffith, R. Redding, S. and Simpson, H. (2002). Production convergence and foreign ownership
at the establishment level. CEPR DP 3765. www.cepr.org/pubs/dps/DP3765.asp
Griliches , Z. and Mareisse, J. (1998). Production functions: The search of identification.
Econometrics and Economic Theory in the Twentieth Century. The Ragnar Frisch
Centennial Symposium, Cambridge University Press, 169-203.
Griliches, Z. and Regev. H. (1995). Firm productivity in Israeli Industry 1979-1988. Journal of
Econometrics, 65, 175-203.
Handoussa, H. Nishimizu, M and Page, J.M (1986). Productivity change in Egyptian public
sector industries after the “opening”, 1973-79. Journal of Development Economics, 20,
53-74.
Havlik, P. (2004). Structural change, productivity and employment in the new EU member states.
Research project commissioned by EU DG Employment, Social Affairs and Equal
Opportunities, Contract No. VC/2003/0367:
http://ec.europa.eu/employment_social/employment_analysis/restruct/struct_change_case
_en.pdf
International Monetary Fund (2002). Bulgaria: Selected issues and statistical appendix. IMF
Country Report no. 02/173. International Monetary Fund, Washington D.C. USA.

27
Klapper, L., Laeven, L., and Rajan, R. (2004). Business environment and firm entry: evidence
from international data, NBER DP 10380. http://www.nber.org/papers/W10380
Konings, J. and DeLoecker, J. (2006). Job reallocation and productivity growth in a post-socialist
country: evidence from Slovenian manufacturing. European Journal of Political
Economy, 22, 388-408.
Konings, J. and Vanderbussche, H. (2004). Antidumping protection and productivity growth of
domestic firms. CEPR DP. 4620: www.cepr.org/pubs/dps/DP4620.asp
Konings, J., VanCayseele, P. and Warzynski, F. (2005). The effects of privatization and
competitive pressure on firms’ price-cost margins: micro evidence from emerging
economies, Review of Economics and Statistics, 87, 124-34.
Leidholm, C. and Mead, D. (1987). Small-scale industries in developing countries: empirical
evidence and policy implications. International Department Paper 9, Agricultural
Economics Department, Michigan State University.
Levinsohn, J. (1993). Testing the imports-as-market-discipline hypothesis. Journal of
International Economics, 35, 1-22.
Levinsohn, J. (1999). Employment responses to international liberalization in Chile. Journal of
International Economics, 47, 321-344.
Levinsohn, J. and Petrin, A. (2003). Estimating production functions using inputs to control for
unobservables. Review of Economic Studies, 47, 321-44.
Marshack, J. and Andrews, W. (1944). Random simultaneous equations and the theory of
production. Econometrica, 12, 143-205.
Miller, J. and Petranov, S. (2000). The first wave of mass privatization in Bulgaria and its
immediate aftermath. Economics of Transition, 8, 225-50.
National Statistical Institute (2005). Statistical Yearbook of Bulgaria.
Nickell, S. (1996). Competition and corporate governance. Journal of Political Economy, 104,
724-46.

28
Olley, S and Pakes, A (1996). The dynamics of productivity in the telecommunications
equipment industry. Econometrica, 64, 1263-97.
Pack, H. (1988). Industrialization and Trade. In H. Chenery and T.N. Shrinivasan (Eds.),
Handbook of development economics. Amsterdam: Elsevier Publishers Company.
Pavcnik, N. (2002). Trade liberalization, exit and productivity improvement: evidence from
Chilean plants. Review of Economic Studies, 69, 245-276.
Roberts, M and Tybout, J. (1996). Industrial evolution in developing countries: Micro patterns of
turnover, productivity and market structure. New York: Oxford University Press.
Rodrik, D. (1992). Closing the productivity gap: does trade liberalization help? In G. Hellener
(Ed.), Trade policy, industrialization and development. Oxford: Clarendon Press.
Rutkowski, J. (2003). Why is unemployment so high in Bulgaria? Policy Research Working
Paper no. 3017, The World Bank, Washington D.C. USA.
Swanson, E. and Tybout, J. (1998). Industrial bankruptcy determinants in Argentina. Journal of
Banking and Finance, 7, 1-27.
Tybout, J. (2000). Manufacturing firms in developing countries: how well they do, and why?
Journal of Economic Literature, 38, 11-44.
World Bank (2001). Bulgaria: the dual challenge of transition and accession. Country study of the
poverty reduction and economic management unit for Europe and Central Asia region of
the World Bank, Washington D.C., USA.
29
Table 1: Descriptive Statistics
1995 1996 1997 1998 1999 2000 2001 Operating Revenue
492.16 (5770.06)
337.67 (3362.73)
289.17 (4395.01)
128.09 (1107.01)
112.22 (1141.82)
115.27 (1241.82)
94.79 (546.27)
Fixed Capital
185.91 (1709.25)
67.68 (582.58)
99.76 (925.78)
56.78 (446.61)
54.34 (420.20)
47.92 (349.02)
47.44 (367.91)
Number of Employees
340.99 (761.99)
243.12 (630.76)
311.72 (697.27)
299.85 (714.91)
135.92 (426.06)
116.92 (335.55)
108.81 (288.44)
Material Costs
357.46 (4146.98)
210.51 (2538.00)
128.16 (1362.01)
74.49 (797.69)
63.29 (915.22)
66.18 (1008.71)
49.45 (373.82)
Herfindahl Index
0.1455 (0.1321)
0.1092 (0.1650)
0.0928 (0.1865)
0.0344 (0.0431)
0.0287 (0.0431)
0.0287 (0.0389)
0.0288 (0.0331)
Import Penetration
0.2848 (0.1379)
0.2824 (0.1412)
0.2824 (0.1395)
0.3441 (0.1761)
0.3886 (0.2191)
0.4210 (0.2269)
0.4486 (0.2361)
Number of firms
1755 2113 2189 3480 3916 4207 4549
Note: 1. All relevant figures are expressed in millions of real 1995 Bulgarian Levs with the use of 3-digit sectoral PPIs.
2. The figures in parentheses are standard deviations.

30
Figure 1: TFP Evolution
4.7
4.8
4.9
5
5.1
5.2
5.3
5.4
1995 1996 1997 1998 1999 2000 2001
year
TFP TFP

31
year Weighted Unweighted Covariance year Weighted Unweighted Covariance
1995 6.1570 5.8670 0.2900 1995 5.8189 5.2768 0.54211996 6.3105 5.6588 0.6517 1996 5.8232 5.0222 0.80101997 5.8998 5.4606 0.4392 1997 5.3675 4.8221 0.54541998 5.9226 5.6209 0.3017 1998 5.6609 5.3863 0.27461999 5.7816 5.1615 0.6201 1999 5.4327 5.0510 0.38172000 5.6836 5.1035 0.5800 2000 5.5532 5.1980 0.35522001 5.6737 5.0425 0.6312 2001 5.4423 5.0535 0.3888
1995 5.3155 5.0518 0.2637 1995 5.6598 5.2048 0.45501996 5.6564 5.1715 0.4849 1996 5.7529 5.1924 0.56051997 5.3191 5.0143 0.3048 1997 5.4016 4.8379 0.56371998 5.3387 5.0831 0.2555 1998 5.4503 5.0625 0.38781999 5.2174 4.8278 0.3897 1999 5.2653 4.9442 0.32112000 5.3584 4.9571 0.4013 2000 5.2037 4.8752 0.32852001 5.3172 4.9049 0.4122 2001 5.4267 4.8890 0.5378
1995 5.4848 5.2940 0.1908 1995 6.0384 5.2140 0.82441996 5.9173 5.4790 0.4383 1996 6.3544 5.4624 0.89201997 5.5594 5.2266 0.3328 1997 6.1231 5.2221 0.90111998 5.0886 4.9728 0.1159 1998 5.9888 5.3916 0.59721999 5.1089 4.7847 0.3242 1999 5.6466 5.1719 0.47472000 5.2822 4.8072 0.4750 2000 6.0534 5.2344 0.81902001 5.2777 4.8215 0.4562 2001 5.9388 5.1524 0.7864
1995 5.7123 5.2801 0.4322 1995 5.5659 5.0735 0.49241996 5.8245 5.1160 0.7085 1996 5.8087 5.2388 0.57001997 5.4760 5.2141 0.2619 1997 5.5726 5.0356 0.53711998 5.4950 5.3005 0.1945 1998 5.7154 5.3490 0.36641999 5.1433 4.8726 0.2707 1999 5.6123 5.1534 0.45892000 5.2283 4.8055 0.4228 2000 5.5350 5.1752 0.35982001 5.3355 4.7908 0.5448 2001 5.6041 5.1295 0.4747
1995 5.6114 5.4883 0.1231 1995 5.3433 5.1795 0.16381996 5.7212 5.3709 0.3503 1996 5.2947 5.1603 0.13441997 5.4113 5.3703 0.0410 1997 5.0039 5.0283 -0.02431998 5.8532 5.8492 0.0040 1998 4.6943 4.9382 -0.24391999 5.6168 5.2851 0.3317 1999 5.1042 5.0984 0.00582000 5.6007 5.2674 0.3333 2000 5.1558 5.1360 0.01982001 5.5163 5.1271 0.3891 2001 5.2426 5.2358 0.0067
1995 7.0253 6.3448 0.6805 1995 5.4470 5.0932 0.35381996 6.5414 6.0288 0.5126 1996 5.7021 5.0188 0.68331997 7.0811 6.0657 1.0154 1997 5.0433 4.6547 0.38871998 6.6001 6.0446 0.5555 1998 5.0387 4.8045 0.23421999 6.7274 5.9801 0.7473 1999 5.1165 4.8196 0.29692000 7.0876 6.0710 1.0166 2000 5.1473 4.8180 0.32942001 6.8652 5.7000 1.1652 2001 5.3289 4.9037 0.4251
1995 6.1219 5.5914 0.5305 1995 5.2983 5.2095 0.08881996 6.5532 5.8093 0.7439 1996 5.0973 4.9581 0.13921997 6.1735 5.4894 0.6841 1997 4.8407 4.7372 0.10361998 5.9618 5.4966 0.4651 1998 4.7051 4.6807 0.02441999 5.7907 5.1761 0.6146 1999 4.7021 4.5221 0.18002000 6.1136 5.2963 0.8173 2000 4.9366 4.7332 0.20342001 6.0072 5.1795 0.8277 2001 4.8969 4.5832 0.3137
Chemicals
Leather & Leather Products
Wood & Wood Products
Pulp, Paper, Publishing
Coke & Refined Petroleum
Electrical & Optical
Transport Equipment
Manufacturing n.e.s.
Table 2: Olley- Pakes Decomposition
Rubber and Plastics
Non-Metallic, Mineral
Metallurgy
Machinery & Equipment
Food, Beverages & Tobacco
Textiles and Apparel

32
year between within total year between within total
1995-96 -7.49E-08 -0.2082 -0.2082 1995-96 2.20E-08 -0.2546 -0.25461996-97 8.10E-08 -0.1982 -0.1982 1996-97 -5.98E-08 -0.2001 -0.20011997-98 -2.54E-08 0.1604 0.1604 1997-98 5.99E-08 0.5642 0.56421998-99 -2.29E-08 -0.4594 -0.4594 1998-99 6.66E-08 -0.3353 -0.33531999-00 -3.86E-09 -0.0580 -0.0580 1999-00 5.80E-09 0.1470 0.14702000-01 2.37E-08 -0.0610 -0.0610 2000-01 -3.84E-08 -0.1445 -0.1445
1995-96 -1.13E-08 0.1197 0.1197 1995-96 2.75E-08 -0.0124 -0.01241996-97 -5.96E-09 -0.1572 -0.1572 1996-97 -4.01E-08 -0.3545 -0.35451997-98 9.24E-10 0.0688 0.0688 1997-98 4.13E-08 0.2246 0.22461998-99 -1.74E-09 -0.2553 -0.2553 1998-99 -6.53E-08 -0.1183 -0.11831999-00 -6.99E-09 0.1293 0.1293 1999-00 -5.24E-08 -0.0690 -0.06902000-01 2.21E-08 -0.0522 -0.0522 2000-01 3.92E-08 0.0138 0.0138
1995-96 1.86E-08 0.1849 0.1849 1995-96 6.00E-08 0.2484 0.24841996-97 -1.68E-08 -0.2524 -0.2524 1996-97 -9.18E-08 -0.2403 -0.24031997-98 -2.84E-08 -0.2538 -0.2538 1997-98 4.66E-08 0.1696 0.16961998-99 1.01E-07 -0.1881 -0.1881 1998-99 -4.46E-08 -0.2197 -0.21971999-00 4.60E-08 0.0225 0.0225 1999-00 1.16E-07 0.0625 0.06252000-01 -1.11E-07 0.0142 0.0142 2000-01 -9.94E-08 -0.0820 -0.0820
1995-96 8.03E-09 -0.1641 -0.1641 1995-96 5.70E-09 0.1653 0.16531996-97 -2.29E-08 0.0981 0.0981 1996-97 -4.67E-08 -0.2032 -0.20321997-98 -3.80E-08 0.0864 0.0864 1997-98 4.19E-08 0.3135 0.31351998-99 2.62E-08 -0.4280 -0.4280 1998-99 -1.53E-08 -0.1956 -0.19561999-00 2.40E-08 -0.0670 -0.0670 1999-00 3.71E-08 0.0218 0.02182000-01 -1.68E-08 -0.0148 -0.0148 2000-01 -3.18E-08 -0.0458 -0.0458
1995-96 1.13E-08 -0.1174 -0.1174 1995-96 -5.55E-08 -0.0192 -0.01921996-97 -6.87E-09 -0.0006 -0.0006 1996-97 8.58E-08 -0.1320 -0.13201997-98 8.56E-09 0.4790 0.4790 1997-98 -6.25E-08 -0.0901 -0.09011998-99 1.42E-08 -0.5641 -0.5641 1998-99 -8.41E-08 0.1602 0.16021999-00 -7.41E-08 -0.0178 -0.0178 1999-00 9.69E-08 0.0376 0.03762000-01 6.11E-08 -0.1402 -0.1402 2000-01 -3.31E-08 0.0998 0.0998
1995-96 8.79E-09 -0.3160 -0.3160 1995-96 1.04E-08 -0.0744 -0.07441996-97 -7.43E-08 0.0369 0.0369 1996-97 -4.65E-08 -0.3641 -0.36411997-98 9.78E-08 -0.0211 -0.0211 1997-98 -1.35E-08 0.1498 0.14981998-99 3.52E-08 -0.0645 -0.0645 1998-99 -1.84E-08 0.0151 0.01511999-00 2.01E-07 0.0909 0.0909 1999-00 9.35E-08 -0.0016 -0.00162000-01 -3.32E-07 -0.3710 -0.3710 2000-01 -1.16E-07 0.0858 0.0858
1995-96 5.64E-08 0.2178 0.2178 1995-96 9.97E-08 -0.2514 -0.25141996-97 -4.21E-08 -0.3199 -0.3199 1996-97 -9.50E-08 -0.2210 -0.22101997-98 2.85E-08 0.0072 0.0072 1997-98 -2.90E-08 -0.0565 -0.05651998-99 -2.64E-08 -0.3205 -0.3205 1998-99 8.99E-08 -0.1586 -0.15861999-00 -1.51E-08 0.1202 0.1202 1999-00 -1.91E-08 0.2111 0.21112000-01 1.76E-08 -0.1168 -0.1168 2000-01 -3.06E-08 -0.1500 -0.1500
Electrical & Optical
Rubber and Plastics
Non-Metallic, Mineral
Metallurgy
Machinery & Equipment
Transport Equipment
Manufacturing n.e.s.
Table 3: Griliches-Regev Decomposition
Food, Beverages, Tobacco
Textiles & Apparel
Leather
Wood
Pulp, Paper, Publishing
Coke & Petroleum
Chemicals

33
Table 4: Regression Results
∆TFP 1 2 3
CONSTANT 0.5182***
(0.0339)
0.6945***
(0.0364)
1.0331***
(0.0585)
∆IMP 1.8585***
(0.3800)
1.5122***
(0.4025)
1.3071***
(0.4084)
∆HERF -0.6694**
(0.3314)
-1.2785***
(0.3581)
-1.0073***
(0.3304)
DIST it - 1 -0.9633***
(0.0562)
-0.8983***
(0.0565)
-1.3488***
(0.0715)
∆IMP* DIST it - 1 -2.6416***
(0.5997)
-2.5081***
(0.6418)
-2.3494***
(0.6530)
∆HERF* DIST it - 1 1.5511**
(0.6644)
2.9753***
(0.7189)
2.3406***
(0.6625)
Years No Yes*** Yes***
Industries No No Yes***
Rsq 0.0549 0.1050 0.1306
N Observations 11562 11562 11562
Note: ***, ** and * indicate significance at the 1%, 5% and 10 % level, respectively. The figures in brackets are standard deviations.

34
Appendix I
Table A1: Representativeness of the Amadeus Sample
Year N. Employees Amadeus sample used**
N. Employees Manufacturing*
% Representativeness
1995 531615 770421 69 1996 509581 728106 70 1997 449809 720285 62 1998 427588 689748 62 1999 524511 615829 85 2000 483232 562331 86 2001 477242 609460 78
* Data source: National Statistical Institute (2005) Statistical Yearbook of Bulgaria. ** The Amadeus sample used includes firms with at least 10 employees.
35
Appendix II
One of the most controversial issues in estimating production functions is the appropriate
treatment of the correlation between unobservable productivity shocks and input levels
(Marshack and Andrews, 1994; Griliches and Mareisse, 1998). Specifically, firms facing positive
productivity shocks are likely to respond by increasing their input use, while firms facing
negative productivity shocks are likely to decrease their use of inputs. It is evident that OLS
estimates of the production function would be biased and result in biased estimates of total factor
productivity.
The literature dealing with this problem, has been trying to find an appropriate instrument
which is correlated with the productivity shock, but not correlated with the rest of the inputs to
the production function. One of the most popular methodologies, the Olley-Pakes (1996) (OP)
methodology uses the inverted function of investments as an instrument for unobservable
productivity shocks. It is challenged by Levinsohn and Petrin (2003), which we find more
appropriate in our case for several reasons. First, investments, used as part of the OP method,
involve substantial adjustment costs and may therefore not respond smoothly to a productivity
shock, violating the consistency condition (Levinsohn and Petrin, 2003). The smooth adaptability
in our case is likely to be further aggravated by underdeveloped credit and financial markets,
especially in the volatile economic environments of the Bulgarian economy in 1995 through
2001. Secondly, the non-negativity of investments is a crucial precondition for inverting the
investment function as part of the OP exercise. However, in our data samples, five percent of the
Bulgarian firms report zero or negative investments in at least one of the years. Hence, the use of
the OP methodology would involve a high degree of sample truncation, which we avoid with the
choice of the alternative Levinsohn- Petrin (2003) (LP) methodology. This methodology uses
material costs instead of investments as instrument for the unobserved productivity shock.
Let the Cobb-Douglas function that we wish to estimate be:

36
[A1] tttmtktlt mkly ηωββββ +++++= 0 ,
where yt is the logarithm of firm’s output, lt and mt are the logarithms of freely variable inputs
labor and intermediate inputs and kt is the logarithm of state variable capital. The error term is
decomposed into two components, the transmitted productivity component or shock ωt and white
noise ηt. It is obvious that the simultaneity problem mentioned earlier arises from the
contemporaneous correlation of ωt with the input choices, producing biased OLS estimates.
The firm’s demand for intermediate inputs is:
),( tttt kmm ω=
Under monotonicity conditions it can be inverted:
),( tttt mkωω =
One can then rewrite [A1] as:
[A2] tttttktlt mkkly ηφβββ ++++= ),(0 .
where ttkttt kmk ηββφ ++= 0),( . Robinson (1988) shows that this equation can be used to
obtain consistent estimate of lβ . Based on Robinson (1988) and OP, LP use a third-order
polynomial approximation in kt and mt in place of ),( ttt mkφ in deriving the consistent labor
estimate. This concludes the first stage of the LP estimation methodology.
In the second stage the coefficient of capital kβ is estimated. Since capital enters
(.)φ twice, a more complete model is needed to identify kβ . OP and LP assume that tω follows a
first-order Markov process and capital does not respond immediately to productivity innovations
over last period expectations. Taking output net of labor gives:
37
[A3] *10
* ]|[ ttttktltt Eklyy ηωωβββ +++=−= −
Since both the productivity innovation and the white noise are uncorrelated with capital,
regressing *ty on kt gives unbiased estimate of kβ . This concludes the second and final stage of
the LP method.
Table A2: Production Function Estimates Manufacturing sector Labor Capital OLS LP OLS LP Food, Beverages and Tobacco 0.91***
(0.02) 0.53*** (0.05)
0.28*** (0.01)
0.29*** (0.06)
Textiles & Apparel 0.69*** (0.01)
0.58*** (0.03)
0.31*** (0.01)
0.25*** (0.04)
Leather 0.79*** (0.04)
0.68*** (0.07)
0.24*** (0.02)
0.08 (0.08)
Wood & Wood Products 0.71*** (0.06)
0.32*** (0.07)
0.28*** (0.04)
0.20*** (0.15)
Coke & Petroleum 0.74*** (0.04)
0.31 (0.22)
0.23*** (0.02)
-0.01 (0.35)
Pulp and paper 0.65*** (0.03)
0.37*** (0.07)
0.30*** (0.03)
0.33*** (0.06)
Chemicals 0.73*** (0.04)
0.40*** (0.07)
0.30*** (0.03)
0.25** (0.11)
Rubber & Plastics 0.57*** (0.05)
0.37*** (0.07)
0.25*** (0.03)
0.33*** (0.06)
Non-Metal /Mineral Products 0.75*** (0.03)
0.35*** (0.05)
0.20*** (0.02)
0.24*** (0.07)
Metals 0.70*** (0.03)
0.28*** (0.05)
0.26*** (0.02)
0.18*** (0.07)
Machinery 0.75*** (0.03)
0.34*** (0.05)
0.17*** (0.02)
0.43*** (0.06)
Electrical & Optical Products 0.53*** (0.06)
0.15 (0.10)
0.18*** (0.04)
0.38*** (0.13)
Transport Equipment 0.76*** (0.04)
0.36*** (0.07)
0.17*** (0.02)
0.11 (0.09)
Manufacturing not elsewhere specified 0.77*** (0.06)
0.56*** (0.09)
0.24*** (0.03)
0.02 (0.11)
Whole Manufacturing 0.68*** (0.01)
0.48*** (0.01)
0.29*** (0.00)
0.27*** (0.02)
Note: The numbers in parentheses are standard errors. ***,**, * indicate significance at the 1%, 5% and 10% level, respectively.

38
Top Related