


Languages
Pages
Legal


Copperbelt Energy Corporation Plc
H1 Results Presentationfor the period ended 30 June 2016
www.cecinvestor.com
Contents
Page
Zambia review 5Economic 6Operational & regulatory 7
Nigeria review 8Economic 9Operational 10
Health, Safety, Environment & Social 12
Financial results 13
CEC Group trend analysis 14
CEC Group profit & loss 15
Group financial position 16
Zambian financial results 17CEC Plc 18CEC Plc financial snap shot 19Telecoms 20
Nigerian Operations 21AEDC Plc and NSP 22 – 23
Financial Comparison – Zambia / Nigeria 24
Outlook & strategy 28
www.cecinvestor.com 1

Your presenters
www.cecinvestor.com 2
Owen SilavweManaging Director
Mutale MukukaChief Financial Officer
Statements in this presentation (including all other media) that are not historical facts or
information may be forward-looking statements.
These forward-looking statements are based on information available at the time the
statements are made and/or management's belief as of that time with respect to
future events and involve risks and uncertainties that could cause actual results and
outcomes to be materially different. Important factors that could cause such
differences include, but are not limited to the loss of key customers, the disruption to
operations, economic conditions, political conditions, regulatory issues and reduction in
demand.
Forward looking statements
3

CEC Group structure
www.cecinvestor.com 4
KANN Utility
SPV
Shiroro Hydro (NG)
CECA SL Generation
SPV
Abuja DiscoGeneration Project
CEC Africa
CEC Plc
Zambian Energy Corp
Ireland (ZECI)ZCCM – IH
Institutional & Retail
Investors
75%
60%
100%
50.1%
100%
100%
20%52% 28%
Nigeria Mauritius
Sierra Leone
Projects in developmentOperating assets
Key:
North South Power
20%
CEC Liquid Telecom
Hai Telecoms
Kabompo Hydro50%
100%
100%
CEC Africa Hydro
100%
Investment assets
Zambian Operations
Nigerian Operations

CEC Group
ZAMBIA
Summary Economic & Business
Overview
www.cecinvestor.com 5

Overview: Zambian operations & regulation
Operations & Operating Environment
– The business has continued to operate under the partial force majeure, accessing only 70%
of the power requirements under the Bulk Supply Agreement (BSA). Balance of supplies is
being met from supplies from SAPP
– Power supplies to the other customer categories was not materially impacted. Therefore,
domestic wheeling was on budget
– International power trading continues to be one of the key focus areas for the business,
increasing by 254% compared to the same period last year and is making up for the loss of
sales in Zambia
– Telecoms unit, CEC Liquid Telecom, has continued to be profitable on account of
increased customer acquisition, backed by more fibre build and services roll out
Environment & Regulation
– Low commodity prices for copper have led to some of the Company’s mine customers
scaling back on operations, leading to a drop in local power sales by 16%
– The new tariff of USc 10.35 kWh, passed by government, has been implemented effective 1
Jan 2016 though few customers are paying at the increased tariff
– The 2014 ERB tariff increase remains disputed and the matter is still in the courts of law
www.cecinvestor.com 7

CEC Group
NIGERIA
Summary Economic & Business
Overview
www.cecinvestor.com 8
4%
6%
8%
10%
12%
14%
20
11
20
12
20
13
20
14
20
15
20
16
E
20
17
E
20
18
E
20
19
E
20
20
E
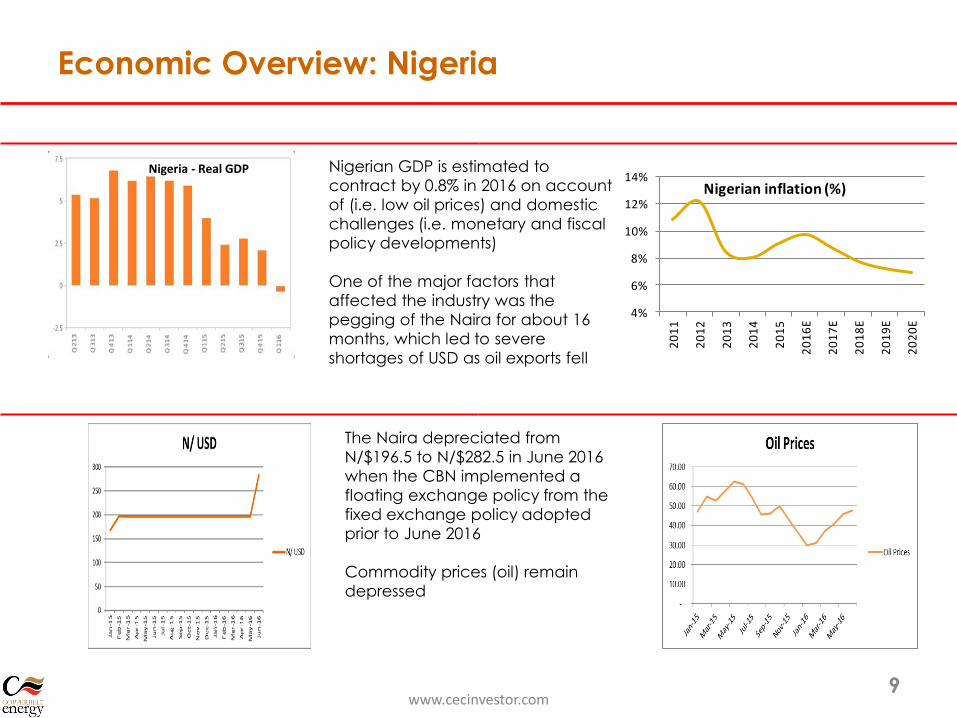
Nigerian inflation (%)
Economic Overview: Nigeria
www.cecinvestor.com9
Nigerian GDP is estimated to
contract by 0.8% in 2016 on account
of (i.e. low oil prices) and domestic
challenges (i.e. monetary and fiscal
policy developments)
One of the major factors that
affected the industry was the
pegging of the Naira for about 16
months, which led to severe
shortages of USD as oil exports fell
The Naira depreciated from
N/$196.5 to N/$282.5 in June 2016
when the CBN implemented a
floating exchange policy from the
fixed exchange policy adopted
prior to June 2016
Commodity prices (oil) remain
depressed
Nigeria - Real GDP
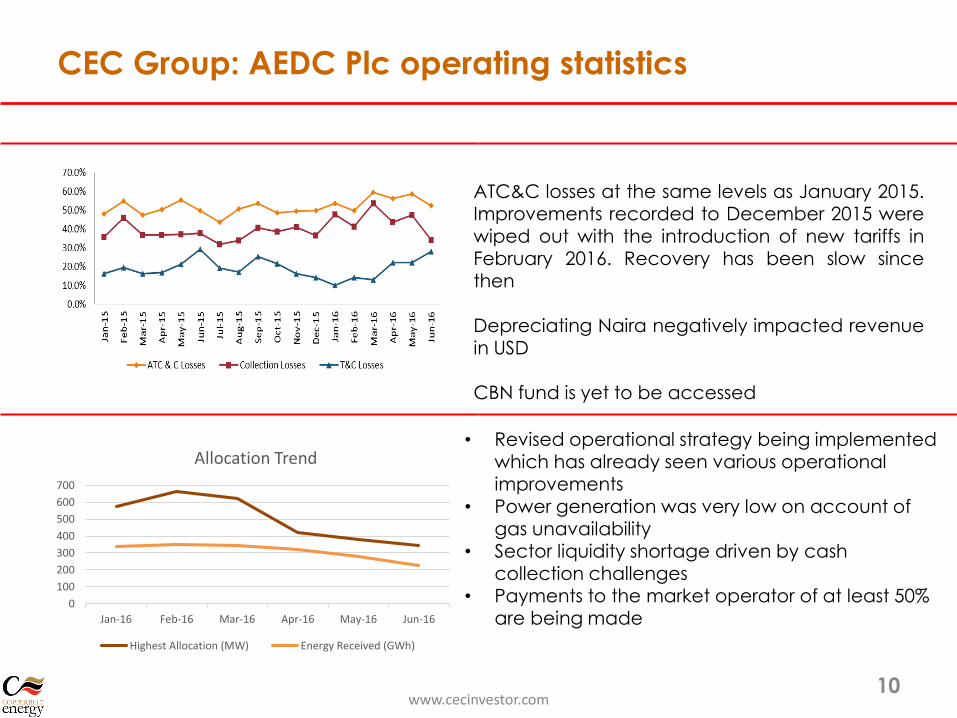
CEC Group: AEDC Plc operating statistics
www.cecinvestor.com10
ATC&C losses at the same levels as January 2015.Improvements recorded to December 2015 werewiped out with the introduction of new tariffs inFebruary 2016. Recovery has been slow sincethen
Depreciating Naira negatively impacted revenuein USD
CBN fund is yet to be accessed
0
100
200
300
400
500
600
700
Jan-16 Feb-16 Mar-16 Apr-16 May-16 Jun-16
Allocation Trend
Highest Allocation (MW) Energy Received (GWh)
• Revised operational strategy being implemented which has already seen various operational improvements
• Power generation was very low on account of gas unavailability
• Sector liquidity shortage driven by cash collection challenges
• Payments to the market operator of at least 50% are being made
CEC Group
Health, Safety, Environment & Social
www.cecinvestor.com 11
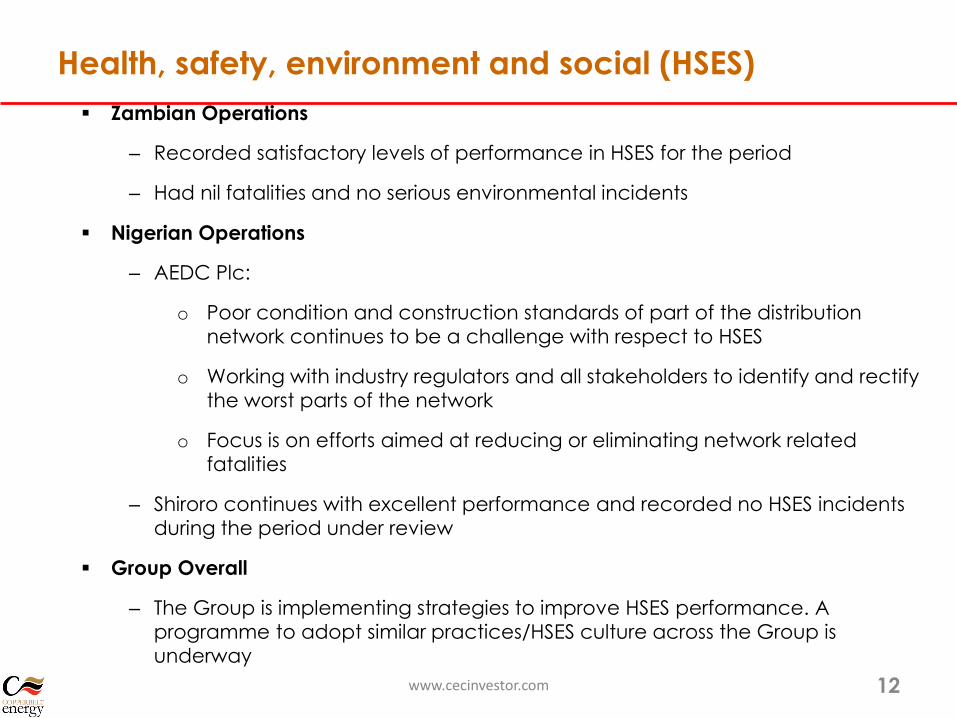
Health, safety, environment and social (HSES)
Zambian Operations
– Recorded satisfactory levels of performance in HSES for the period
– Had nil fatalities and no serious environmental incidents
Nigerian Operations
– AEDC Plc:
o Poor condition and construction standards of part of the distribution
network continues to be a challenge with respect to HSES
o Working with industry regulators and all stakeholders to identify and rectify
the worst parts of the network
o Focus is on efforts aimed at reducing or eliminating network related
fatalities
– Shiroro continues with excellent performance and recorded no HSES incidents
during the period under review
Group Overall
– The Group is implementing strategies to improve HSES performance. A
programme to adopt similar practices/HSES culture across the Group is
underway
www.cecinvestor.com 12
CEC Group
Group Financial Results
www.cecinvestor.com 13
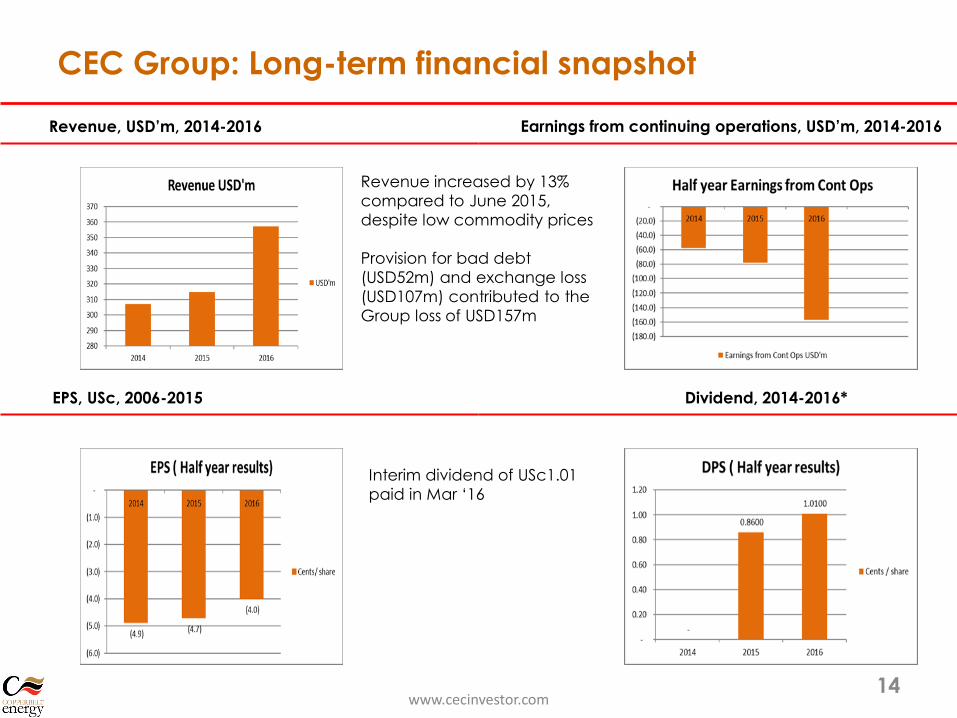
Earnings from continuing operations, USD’m, 2014-2016
Dividend, 2014-2016*
Revenue, USD’m, 2014-2016
EPS, USc, 2006-2015
CEC Group: Long-term financial snapshot
www.cecinvestor.com14
Revenue increased by 13%
compared to June 2015,
despite low commodity prices
Provision for bad debt
(USD52m) and exchange loss
(USD107m) contributed to the
Group loss of USD157m
Interim dividend of USc1.01
paid in Mar ‘16
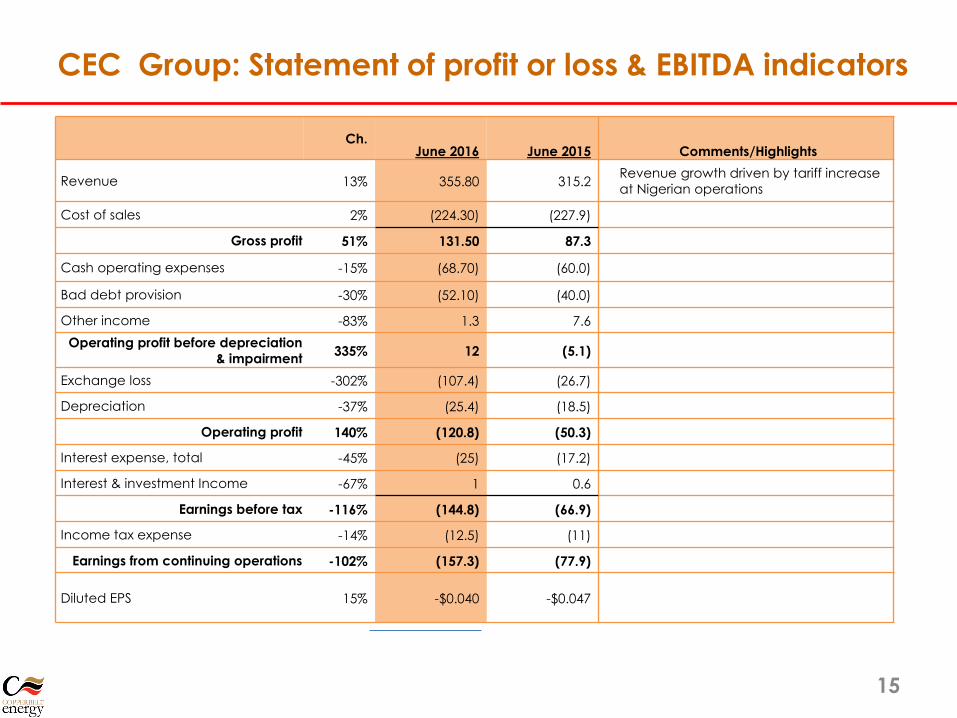
CEC Group: Statement of profit or loss & EBITDA indicators
15
Ch.June 2016 June 2015 Comments/Highlights
Revenue 13% 355.80 315.2 Revenue growth driven by tariff increase
at Nigerian operations
Cost of sales 2% (224.30) (227.9)
Gross profit 51% 131.50 87.3
Cash operating expenses -15% (68.70) (60.0)
Bad debt provision -30% (52.10) (40.0)
Other income -83% 1.3 7.6
Operating profit before depreciation
& impairment335% 12 (5.1)
Exchange loss -302% (107.4) (26.7)
Depreciation -37% (25.4) (18.5)
Operating profit 140% (120.8) (50.3)
Interest expense, total -45% (25) (17.2)
Interest & investment Income -67% 1 0.6
Earnings before tax -116% (144.8) (66.9)
Income tax expense -14% (12.5) (11)
Earnings from continuing operations -102% (157.3) (77.9)
Diluted EPS 15% -$0.040 -$0.047
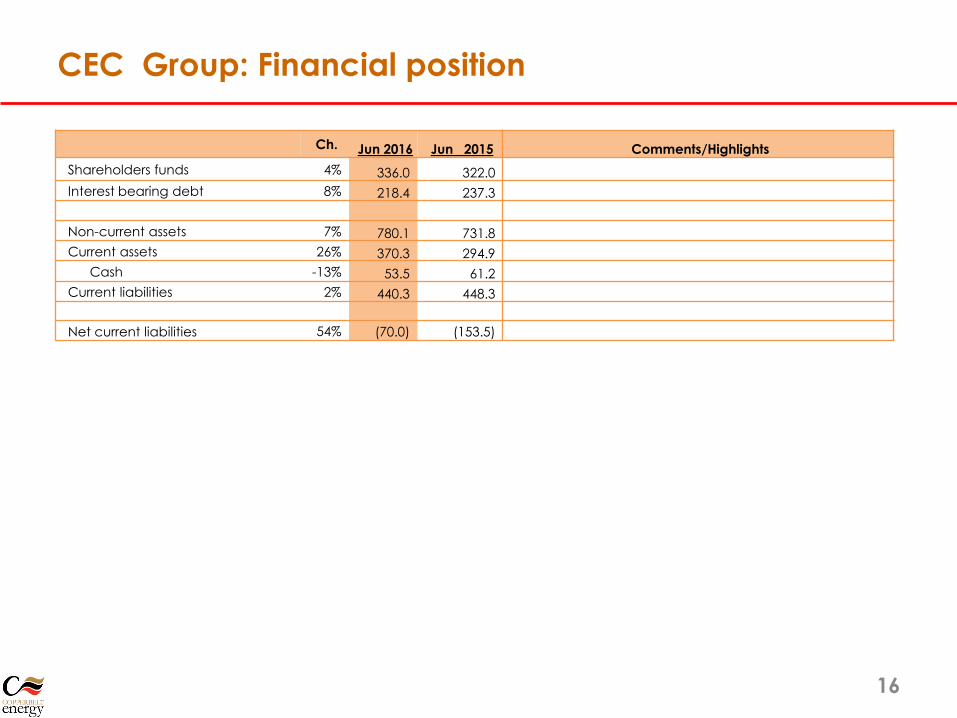
CEC Group: Financial position
16
Ch. Jun 2016 Jun 2015 Comments/Highlights
Shareholders funds 4% 336.0 322.0
Interest bearing debt 8% 218.4 237.3
Non-current assets 7% 780.1 731.8
Current assets 26% 370.3 294.9
Cash -13% 53.5 61.2
Current liabilities 2% 440.3 448.3
Net current liabilities 54% (70.0) (153.5)

CEC Group
Financial results – Zambian Operations
www.cecinvestor.com 17
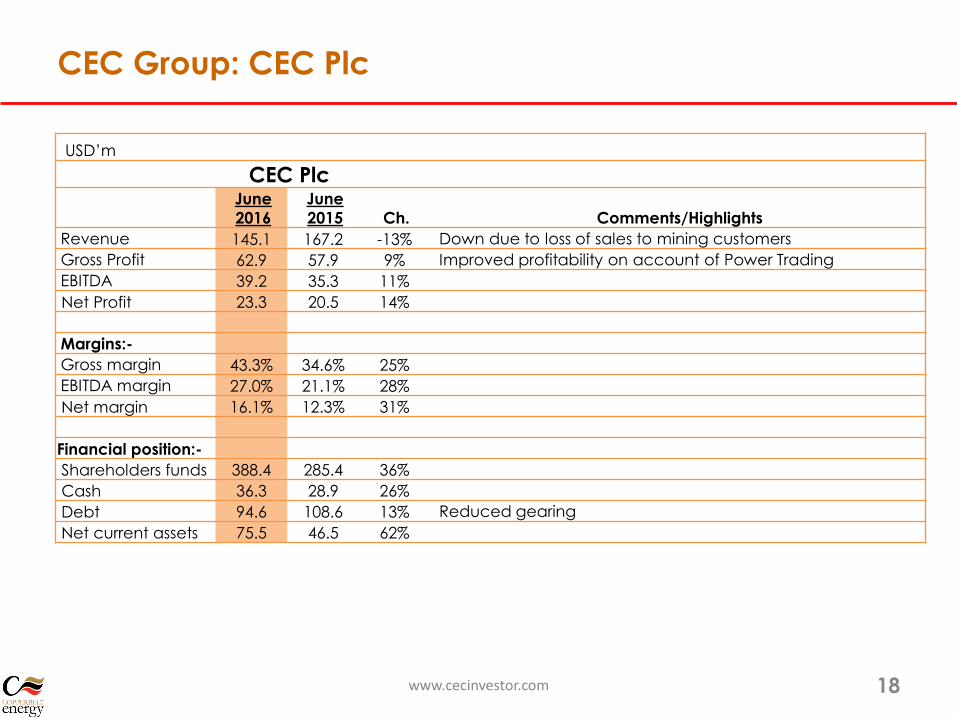
CEC Group: CEC Plc
USD’m
CEC PlcJune
2016
June
2015 Ch. Comments/Highlights
Revenue 145.1 167.2 -13% Down due to loss of sales to mining customers
Gross Profit 62.9 57.9 9% Improved profitability on account of Power Trading
EBITDA 39.2 35.3 11%
Net Profit 23.3 20.5 14%
Margins:-
Gross margin 43.3% 34.6% 25%
EBITDA margin 27.0% 21.1% 28%
Net margin 16.1% 12.3% 31%
Financial position:-
Shareholders funds 388.4 285.4 36%
Cash 36.3 28.9 26%
Debt 94.6 108.6 13% Reduced gearing
Net current assets 75.5 46.5 62%
www.cecinvestor.com 18

CEC Plc: Long-term financial snapshot
www.cecinvestor.com19
e
n/15
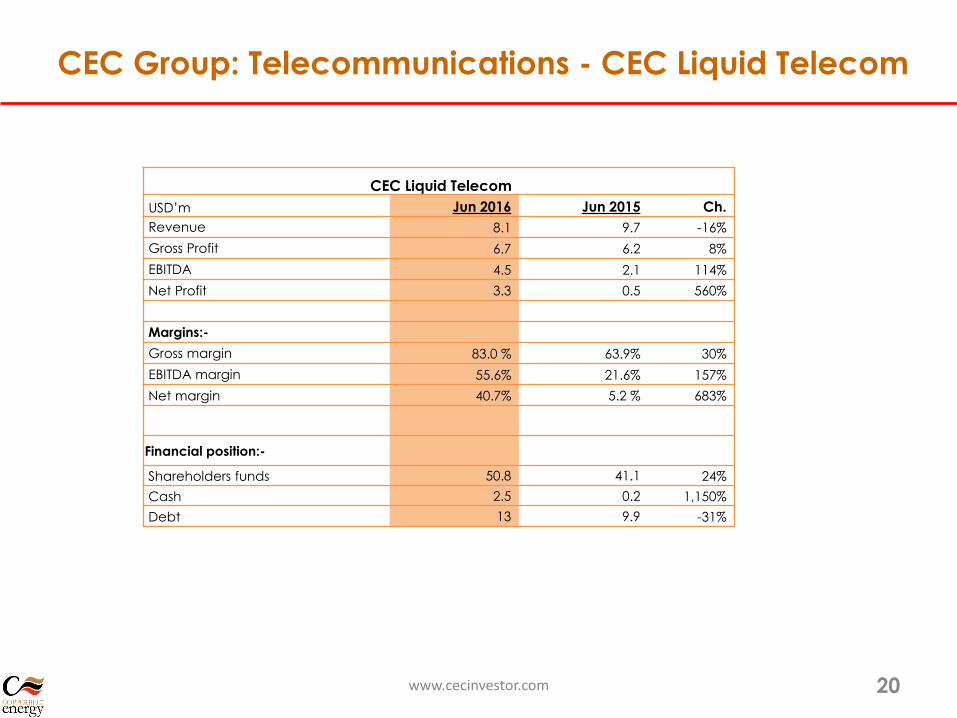
CEC Group: Telecommunications - CEC Liquid Telecom
www.cecinvestor.com 20
CEC Liquid Telecom
USD’m Jun 2016 Jun 2015 Ch.
Revenue 8.1 9.7 -16%
Gross Profit 6.7 6.2 8%
EBITDA 4.5 2.1 114%
Net Profit 3.3 0.5 560%
Margins:-
Gross margin 83.0 % 63.9% 30%
EBITDA margin 55.6% 21.6% 157%
Net margin 40.7% 5.2 % 683%
Financial position:-
Shareholders funds 50.8 41.1 24%
Cash 2.5 0.2 1,150%
Debt 13 9.9 -31%

CEC Group
Financial results – Nigerian Operation
www.cecinvestor.com 21
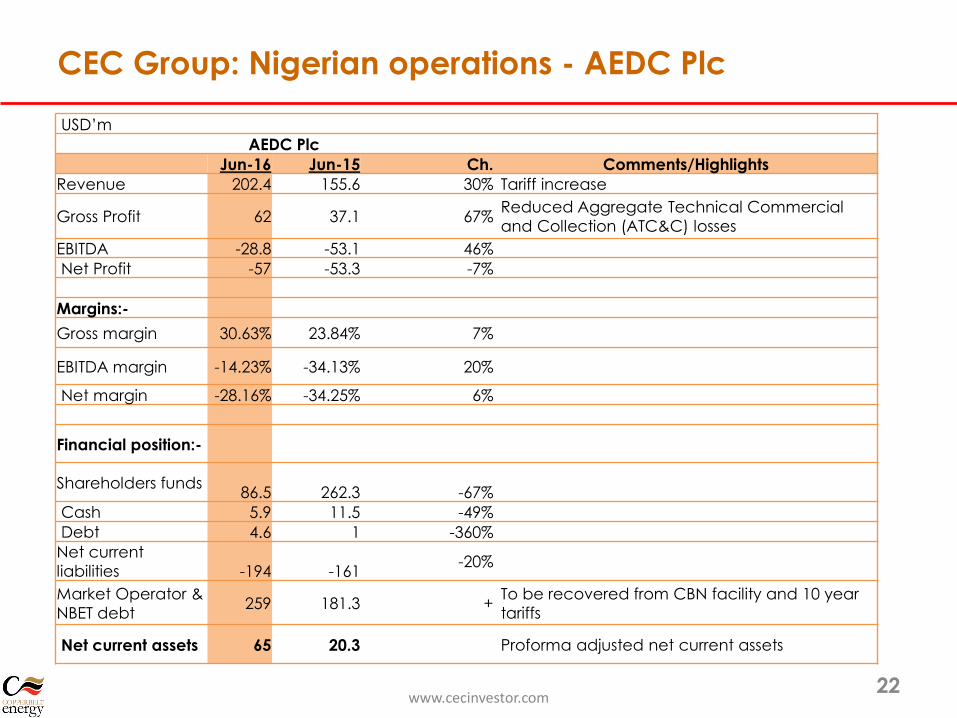
CEC Group: Nigerian operations - AEDC Plc
www.cecinvestor.com22
USD’m
AEDC Plc
Jun-16 Jun-15 Ch. Comments/Highlights
Revenue 202.4 155.6 30% Tariff increase
Gross Profit 62 37.1 67%Reduced Aggregate Technical Commercial
and Collection (ATC&C) losses
EBITDA -28.8 -53.1 46%
Net Profit -57 -53.3 -7%
Margins:-
Gross margin 30.63% 23.84% 7%
EBITDA margin -14.23% -34.13% 20%
Net margin -28.16% -34.25% 6%
Financial position:-
Shareholders funds86.5 262.3 -67%
Cash 5.9 11.5 -49%
Debt 4.6 1 -360%
Net current
liabilities -194 -161-20%
Market Operator &
NBET debt259 181.3 +
To be recovered from CBN facility and 10 year
tariffs
Net current assets 65 20.3 Proforma adjusted net current assets
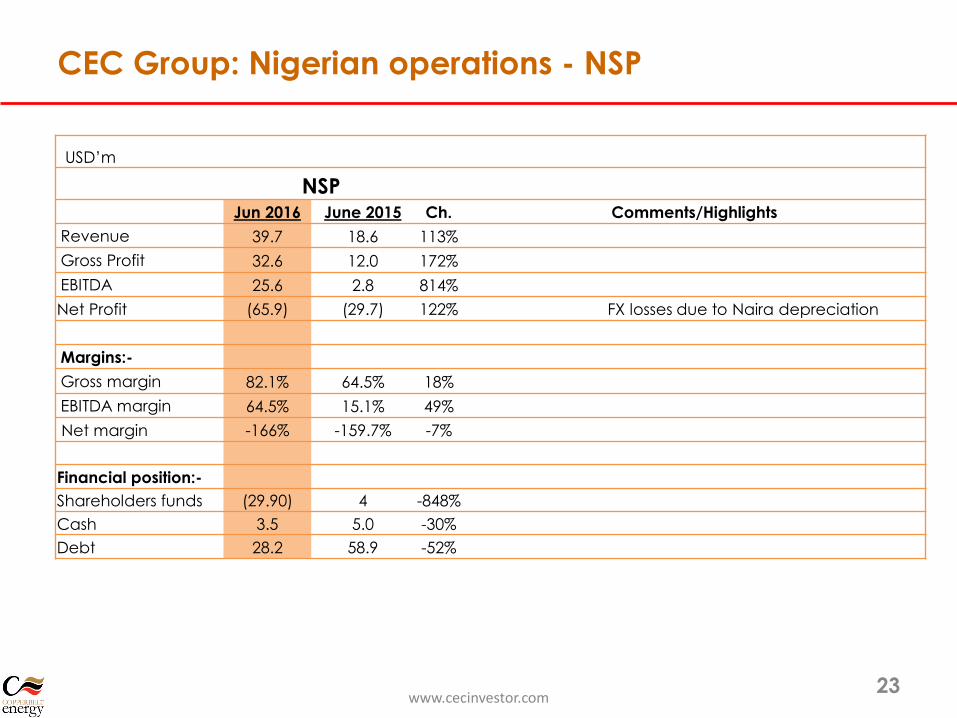
CEC Group: Nigerian operations - NSP
www.cecinvestor.com23
USD’m
NSPJun 2016 June 2015 Ch. Comments/Highlights
Revenue 39.7 18.6 113%
Gross Profit 32.6 12.0 172%
EBITDA 25.6 2.8 814%
Net Profit (65.9) (29.7) 122% FX losses due to Naira depreciation
Margins:-
Gross margin 82.1% 64.5% 18%
EBITDA margin 64.5% 15.1% 49%
Net margin -166% -159.7% -7%
Financial position:-
Shareholders funds (29.90) 4 -848%
Cash 3.5 5.0 -30%
Debt 28.2 58.9 -52%
CEC Group
Financial results –
Comparison Zambian & Nigerian Operations
www.cecinvestor.com 24
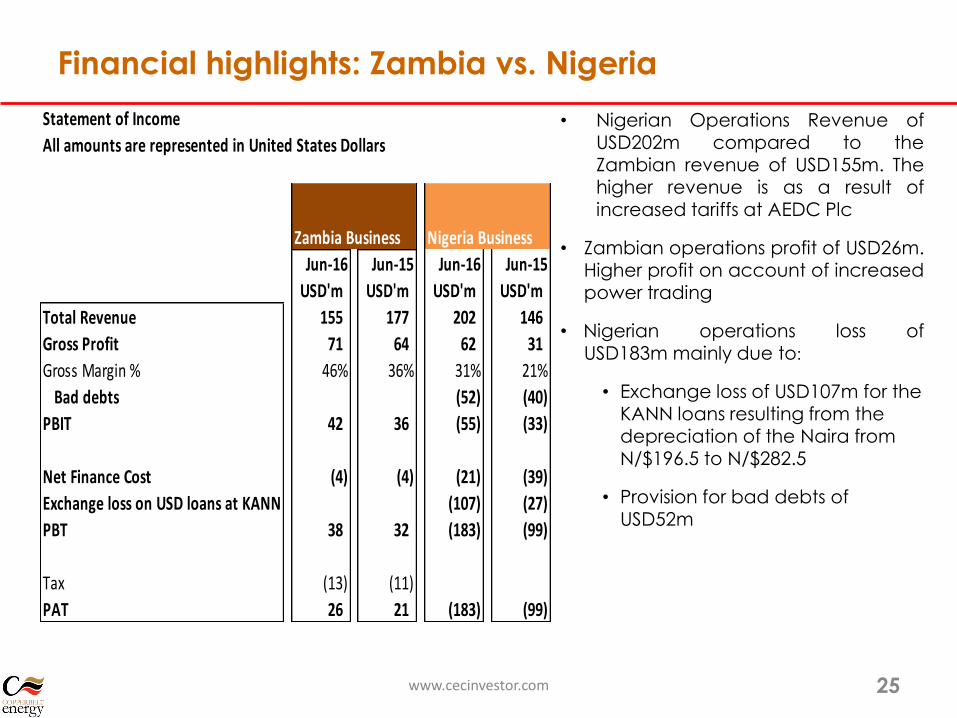
Financial highlights: Zambia vs. Nigeria
25
• Nigerian Operations Revenue ofUSD202m compared to theZambian revenue of USD155m. Thehigher revenue is as a result ofincreased tariffs at AEDC Plc
• Zambian operations profit of USD26m.Higher profit on account of increasedpower trading
• Nigerian operations loss ofUSD183m mainly due to:
• Exchange loss of USD107m for the KANN loans resulting from the depreciation of the Naira from N/$196.5 to N/$282.5
• Provision for bad debts of USD52m
www.cecinvestor.com
Statement of Income
All amounts are represented in United States Dollars
Jun-16 Jun-15 Jun-16 Jun-15
USD'm USD'm USD'm USD'm
Total Revenue 155 177 202 146
Gross Profit 71 64 62 31
Gross Margin % 46% 36% 31% 21%
Bad debts (52) (40)
PBIT 42 36 (55) (33)
Net Finance Cost (4) (4) (21) (39)
Exchange loss on USD loans at KANN (107) (27)
PBT 38 32 (183) (99)
Tax (13) (11)
PAT 26 21 (183) (99)
Zambia Business Nigeria Business

Financial highlights: Zambia vs. Nigeria
26
• Total current liabilities for the Nigerian business includes USD259m relating to the market operator’s (MO) bill
• Efforts to seek senior debt for capital expenditure underway
• Sector liquidity shortfall negatively impacting on the operation’s ability to meet the full bill to the Market Operator
• Currency mismatch between the cash-flows and UBA loan obligation remains key risk
www.cecinvestor.com

Outlook & strategy
www.cecinvestor.com 27

Strategy & Outlook
28
Business Growth Strategy Exploring opportunities that can be integrated with the core business, with a focus on
Southern Africa
Opportunities being explored include power trading growth, embedded generation, transmission reinforcement
Work with other sector players to resolve tariff issues in Zambia
Projects Underway Progress the 128MW CECA SL project to financial close
Nigerian Assets Address the currency mismatch Manage the over-leverage at KANN Restructure the facility to align the repayments to cash flows Work with Government on regulation and liquidity challenges Operational improvements
Market Cap Undervalued The Board and management believe the current market cap does not represent ‘fair
value’ for the group The Board and management appreciate that the power sector issues in Nigeria and the
limited liquidity in the stock, may be impacting valuation CEC is currently evaluating options to unlock value for shareholders (which may include
a restructuring of the group, and/or a listing on the JSE) and has appointed financial advisors to assist in this regard

Q&A
www.cecinvestor.com 29

Thank You
www.cecinvestor.com 30
Top Related