


Languages
Pages
Legal

1
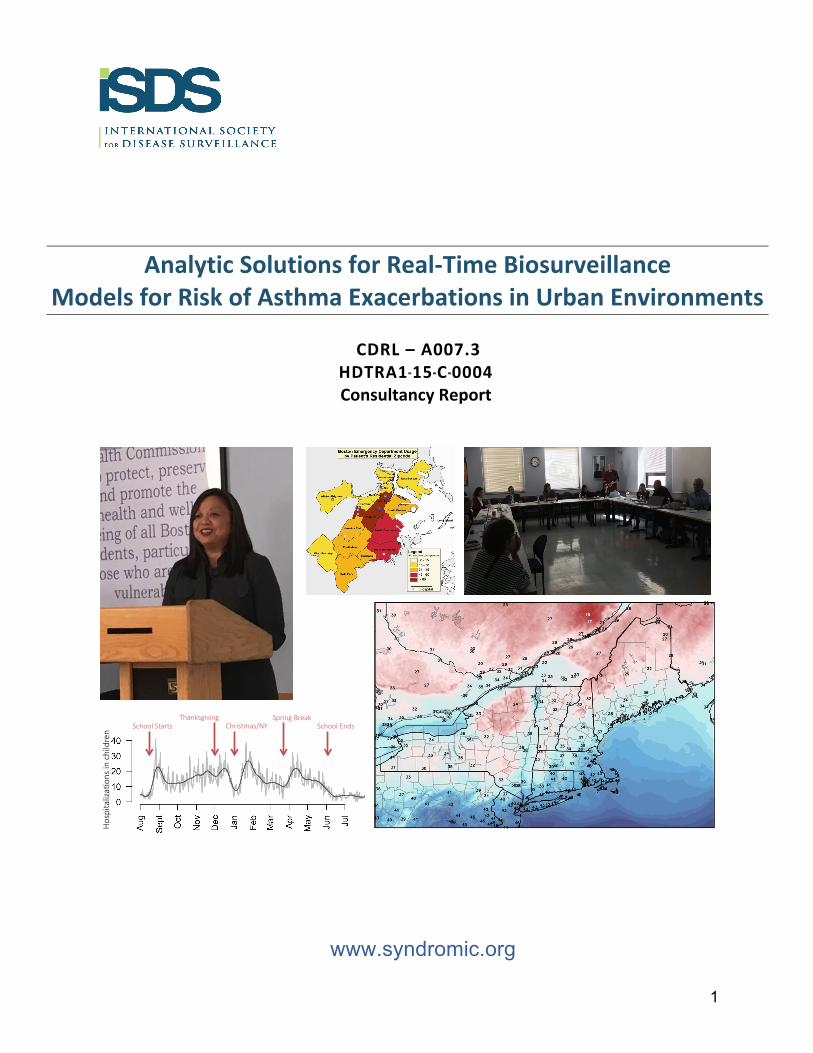
Analytic Solutions for Real-‐Time Biosurveillance Models for Risk of Asthma Exacerbations in Urban Environments
CDRL – A007.3
HDTRA1-‐-‐-‐15-‐-‐-‐C -‐-‐-‐0004 Consultancy Report
www.syndromic.org
• Real-time Mesoscale Analysis (RTMA) – Assimilates many sources of weather data – Creates surface weather analyses (temperature, humidity, winds,
pressure, cloud, visibility) – 2.5 km horizontal resolution updated hourly
Gridded Analyses
http://mag.ncep.noaa.gov/
Example of NOAA RTMA Temperature Analysis
Asthma exacerba8ons are associated with the school calendar
School Starts Thanksgiving
Christmas/NY Spring Break
School Ends
Hos
pita
liza8
ons
in c
hild
ren

2
Analytic Solutions for Real-‐Time Biosurveillance:
Models for Risk of Asthma Exacerbations in Urban Environments Consultancy Report
Table of Contents
I. Acknowledgements 3
II. ISDS and Analytic Solutions for Real-‐Time Biosurveillance 4
III. The Boston Use Case 5
IV. Agenda 5
V. Evaluation Results 9
VI. Next Steps 11
Appendices
Appendix A: Use Case 12
Appendix B: Summary of Notes 14
Appendix C: Forecasting Boston Slides 18
Appendix D: The Asthma Problem in Boston Slides 20
Appendix E: Syndromic Surveillance Slides 21
Appendix F: Weather Observations and Forecasts Slides 28
Appendix G: NOAA/National Weather Service Air Quality and Weather Predictions Slides 31
Appendix H: A Discrete Event Simulation Model of Pediatric Asthma Exacerbations Slides 37
Appendix I: Epidemics of the “Common Cold” and the Dynamics of Severe Asthma Exacerbation Slide 40
Appendix J: Disease Prediction Slides 45
Appendix K: Toward Asthma Air Aware Day Alert for Houston, TX Slides 49
Appendix L: Bayesian Network Approaches Slides 53

3
I. Acknowledgements
ISDS is extremely grateful to the Boston Public Health Commission (BPHC) for spearheading the development of the use case and for providing the event venue. We thank all the participants for contributing their tremendous subject matter expertise to the discussion. This work supported by contract # HDTRA1-‐15-‐C-‐0004 to ISDS from the Defense Threat Reduction Agency (DTRA). Opinions expressed do not necessarily reflect the views of DTRA, BPHC, or the ISDS Membership. Models for Risk of Asthma Exacerbations in Urban Environments: Consultancy Participants
Participant Affiliation Email Steven Babin JHU Applied Physics Laboratory [email protected] Anna Buczak JHU Applied Physics Laboratory [email protected] Eugene Barros BPHC [email protected] Howard Burkom JHU Applied Physics Laboratory [email protected] Robyn Cohen Boston Medical Center [email protected]
Rosalind Eggo London School of Hygiene and Tropical Medicine [email protected]
Kathy Ensor Rice University [email protected] Elizabeth Flood Massachusetts Dept. of Public Health [email protected] Marcelle Goggins ISDS [email protected] Julia Gunn BPHC [email protected] Haig Iskenderian MIT Lincoln Laboratory [email protected] Jonathan Levy BU School of Public Health [email protected] Monica Valdes Lupi BPHC [email protected] George Mathew MIT Lincoln Laboratory [email protected] PJ McCann BPHC [email protected] Anjali Nath BPHC [email protected] Ian Painter University of Washington [email protected]
Wanda Phipatanakul Harvard Medical School, Boston Children’s Hospital
Margaret Reid BPHC [email protected] Sam Scarpino University of Vermont [email protected] Snehal Shah BPHC [email protected] Ivanka Stajner NOAA [email protected] Karen Stark Digital Infuzion [email protected] Laura Streichert ISDS [email protected] Judy Wang Mayor’s Office of New Urban Mechanics, City
of Boston [email protected]
Fuyuen Yip CDC [email protected]
4
II. ISDS and Analytic Solutions for Real-‐Time Biosurveillance The International Society for Disease Surveillance (ISDS) is a 501©(3) organization with a mission to advance the science and practice of health surveillance worldwide. In health surveillance we include the overlapping fields of public health surveillance, animal health surveillance, zoonotic disease surveillance, and surveillance of the environment to monitor health threats and provide situational awareness. ISDS advances its mission through a broad portfolio of activities involving multi-‐stakeholder collaborations to provide capacity-‐building assistance to members and the surveillance community worldwide; actively shape national and international health surveillance policy; and expand our global surveillance Community of Practice (CoP).
ISDS fills the need for a practical forum and coordinating mechanism for collaboration among subject matter experts (SMEs) from stakeholder groups that may normally not interact but who, when brought together, enable innovative approaches to problems and solutions that are not possible by any one group alone. The objective of the Analytic Solutions for Real-‐Time Biosurveillance project is to advance analytic capabilities in real-‐time biosurveillance (BSV) by expediting next-‐generation solutions to currently intractable problems through focused consultancies that join end-‐user problem owners from civilian and military public health agencies with solution developers in academia, industry, and government. This approach helps to clarify key gaps in surveillance capabilities and to develop the requirements for knowledge management, algorithms, models, visualizations, and other solutions to address these gaps. For more information about this project, see: http://www.syndromic.org/cop/analytic-‐solutions/isds-‐consultancies
5
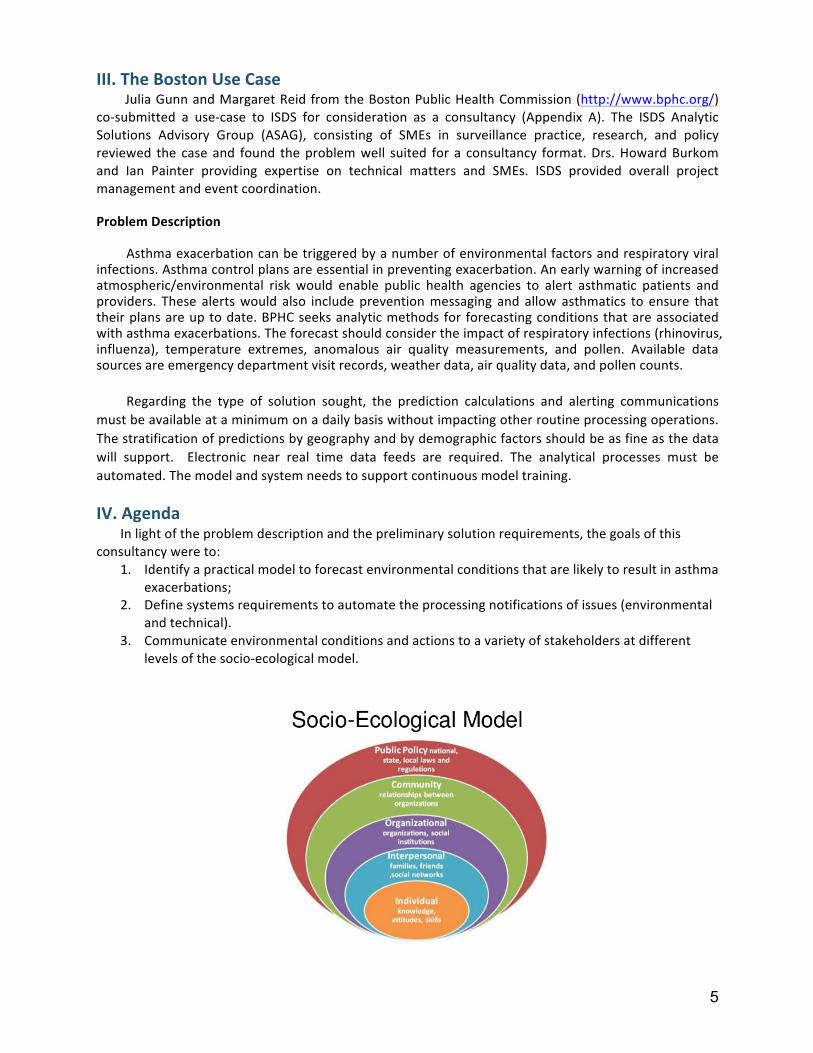
III. The Boston Use Case Julia Gunn and Margaret Reid from the Boston Public Health Commission (http://www.bphc.org/)
co-‐submitted a use-‐case to ISDS for consideration as a consultancy (Appendix A). The ISDS Analytic Solutions Advisory Group (ASAG), consisting of SMEs in surveillance practice, research, and policy reviewed the case and found the problem well suited for a consultancy format. Drs. Howard Burkom and Ian Painter providing expertise on technical matters and SMEs. ISDS provided overall project management and event coordination. Problem Description Asthma exacerbation can be triggered by a number of environmental factors and respiratory viral infections. Asthma control plans are essential in preventing exacerbation. An early warning of increased atmospheric/environmental risk would enable public health agencies to alert asthmatic patients and providers. These alerts would also include prevention messaging and allow asthmatics to ensure that their plans are up to date. BPHC seeks analytic methods for forecasting conditions that are associated with asthma exacerbations. The forecast should consider the impact of respiratory infections (rhinovirus, influenza), temperature extremes, anomalous air quality measurements, and pollen. Available data sources are emergency department visit records, weather data, air quality data, and pollen counts. Regarding the type of solution sought, the prediction calculations and alerting communications must be available at a minimum on a daily basis without impacting other routine processing operations. The stratification of predictions by geography and by demographic factors should be as fine as the data will support. Electronic near real time data feeds are required. The analytical processes must be automated. The model and system needs to support continuous model training. IV. Agenda
In light of the problem description and the preliminary solution requirements, the goals of this consultancy were to:
1. Identify a practical model to forecast environmental conditions that are likely to result in asthma exacerbations;
2. Define systems requirements to automate the processing notifications of issues (environmental and technical).
3. Communicate environmental conditions and actions to a variety of stakeholders at different levels of the socio-‐ecological model.
6
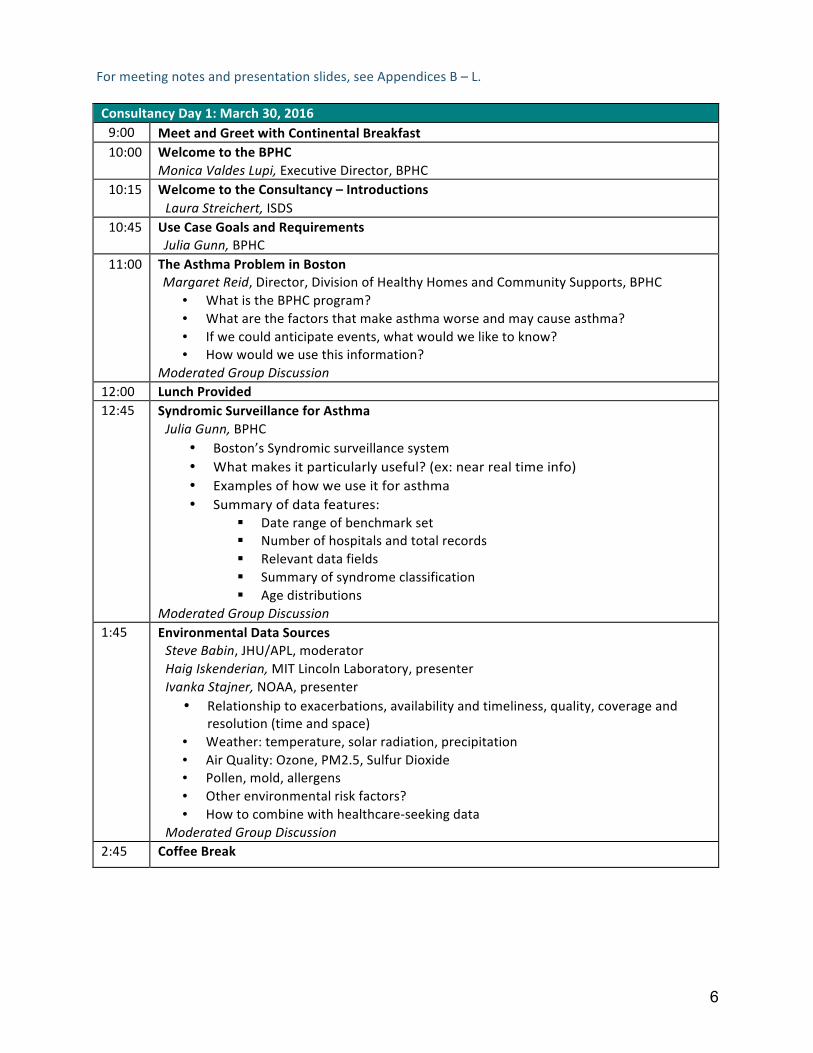
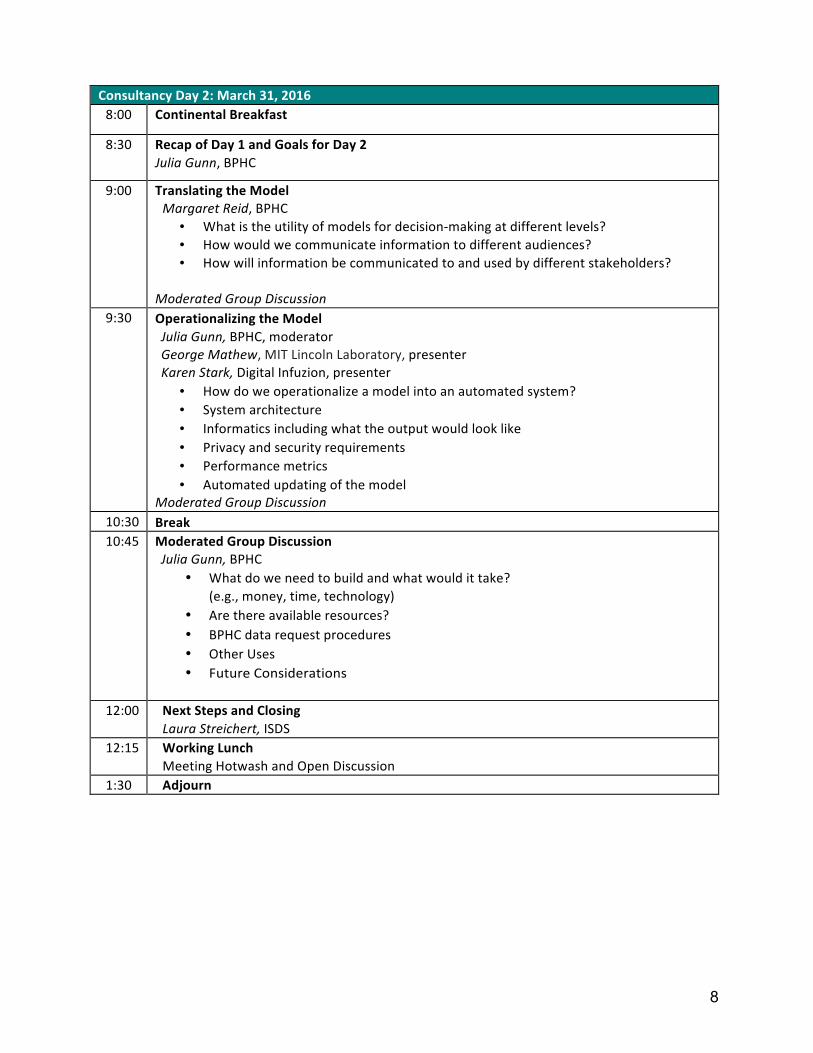
For meeting notes and presentation slides, see Appendices B – L. Consultancy Day 1: March 30, 2016 9:00 Meet and Greet with Continental Breakfast 10:00 Welcome to the BPHC
Monica Valdes Lupi, Executive Director, BPHC 10:15 Welcome to the Consultancy – Introductions
Laura Streichert, ISDS 10:45 Use Case Goals and Requirements
Julia Gunn, BPHC 11:00 The Asthma Problem in Boston
Margaret Reid, Director, Division of Healthy Homes and Community Supports, BPHC • What is the BPHC program? • What are the factors that make asthma worse and may cause asthma? • If we could anticipate events, what would we like to know? • How would we use this information?
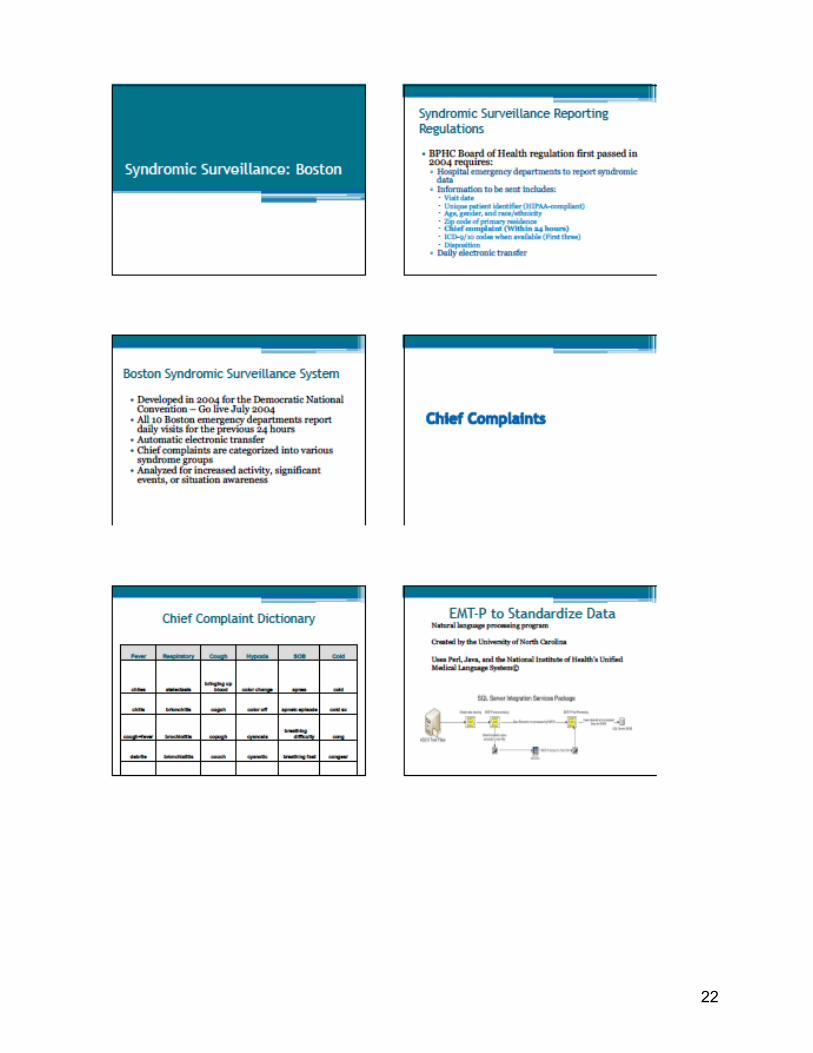
Moderated Group Discussion 12:00 Lunch Provided 12:45 Syndromic Surveillance for Asthma
Julia Gunn, BPHC • Boston’s Syndromic surveillance system • What makes it particularly useful? (ex: near real time info) • Examples of how we use it for asthma • Summary of data features:
§ Date range of benchmark set § Number of hospitals and total records § Relevant data fields § Summary of syndrome classification § Age distributions
Moderated Group Discussion 1:45 Environmental Data Sources
Steve Babin, JHU/APL, moderator Haig Iskenderian, MIT Lincoln Laboratory, presenter Ivanka Stajner, NOAA, presenter
• Relationship to exacerbations, availability and timeliness, quality, coverage and resolution (time and space)
• Weather: temperature, solar radiation, precipitation • Air Quality: Ozone, PM2.5, Sulfur Dioxide • Pollen, mold, allergens • Other environmental risk factors? • How to combine with healthcare-‐seeking data
Moderated Group Discussion 2:45 Coffee Break

7
3:00 Modeling Approaches Howard Burkom, JHU/APL, moderator, presenter Rosalind Eggo, London School of Hygiene and Tropical Medicine, presenter Kathy Ensor, Rice University, presenter Anna Buczak, JHU/APL, presenter Jon Levy, Boston University School of Public Health, presenter
• Basic concept • Past applications • Advantages, disadvantages, obstacles for exacerbation risk modeling in City of
Boston with available data Moderated Group Discussion
4:30 Group Discussion Determining utility, practicality, cost, timeliness, availability, and relevance.
• How can it be brought to bear on asthma? Are there other criteria? • Are there data sources that meet the criteria that we have not yet
considered? 4:45 Wrap-‐Up and Plan for Day 2 5:00 Adjourn 6:30 Group Dinner – Teranga Restaurant, 1746 Washington St, Boston, MA 02118
3.2 3.2 3.5 4
2.9 3.8
3.1
5.3
7.7
6.3 6.4 6.0 5.2
4.4
0 1 2 3 4 5 6 7 8 9
13-Sep 20-Sep 27-Sep 4-Oct 11-Oct 18-Oct 25-Oct
Per
cent
age
of E
D V
isit
s
Week Ending
Percentage of ED Visits for Respiratory Distress Syndrome in Patients < 18 Years of Age
2013
2014
8
Consultancy Day 2: March 31, 2016 8:00 Continental Breakfast
8:30 Recap of Day 1 and Goals for Day 2 Julia Gunn, BPHC
9:00 Translating the Model Margaret Reid, BPHC
• What is the utility of models for decision-‐making at different levels? • How would we communicate information to different audiences? • How will information be communicated to and used by different stakeholders?
Moderated Group Discussion
9:30 Operationalizing the Model Julia Gunn, BPHC, moderator George Mathew, MIT Lincoln Laboratory, presenter Karen Stark, Digital Infuzion, presenter
• How do we operationalize a model into an automated system? • System architecture • Informatics including what the output would look like • Privacy and security requirements • Performance metrics • Automated updating of the model
Moderated Group Discussion 10:30 Break 10:45 Moderated Group Discussion
Julia Gunn, BPHC • What do we need to build and what would it take?
(e.g., money, time, technology) • Are there available resources? • BPHC data request procedures • Other Uses • Future Considerations
12:00 Next Steps and Closing
Laura Streichert, ISDS 12:15 Working Lunch
Meeting Hotwash and Open Discussion 1:30 Adjourn
9
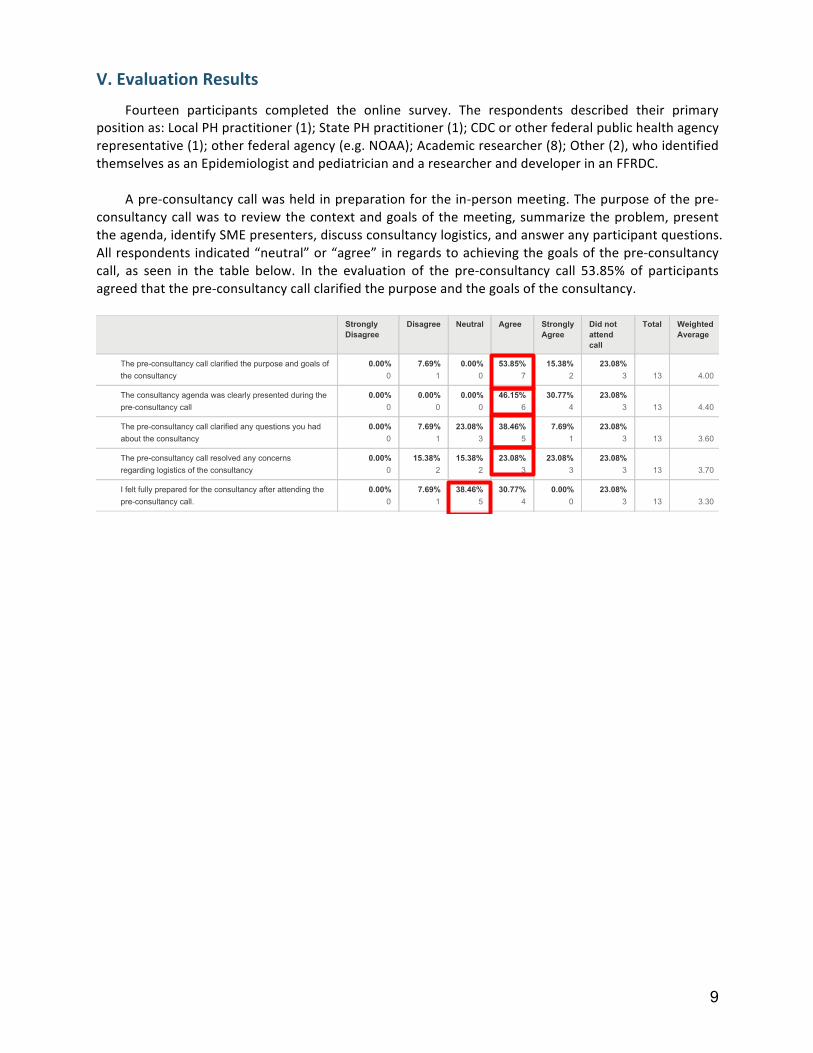
V. Evaluation Results
Fourteen participants completed the online survey. The respondents described their primary position as: Local PH practitioner (1); State PH practitioner (1); CDC or other federal public health agency representative (1); other federal agency (e.g. NOAA); Academic researcher (8); Other (2), who identified themselves as an Epidemiologist and pediatrician and a researcher and developer in an FFRDC.
A pre-‐consultancy call was held in preparation for the in-‐person meeting. The purpose of the pre-‐consultancy call was to review the context and goals of the meeting, summarize the problem, present the agenda, identify SME presenters, discuss consultancy logistics, and answer any participant questions. All respondents indicated “neutral” or “agree” in regards to achieving the goals of the pre-‐consultancy call, as seen in the table below. In the evaluation of the pre-‐consultancy call 53.85% of participants agreed that the pre-‐consultancy call clarified the purpose and the goals of the consultancy.
�:�;�����������������-��/�������1
����������(��(�����1��-��;��83�������('
3���-��������464�:
������������ ����������
# ##"
� :%"
�
# ##"
$� 6$"
$
�$ �6"
�� #6"
�
�
��
�
�4
# ##"
# ##"
# ##"
!: �$"
�
�# ��"
�
�� #6"
�
�
��
�
�4�
# ##"
� :%"
�
�� #6"
�
�6 !:"
�
� :%"
�
�� #6"
�
�
��
�
�4�
# ##"
�$ �6"
�$ �6"
�� #6"
�
�� #6"
�
�� #6"
�
�
��
�
�4$
# ##"
� :%"
�
�6 !:"
�
�# ��"
�
# ##"
�� #6"
�
�
��
�
�4�
+-�
���8(������
+-�
(�������('
+-�
���8(������
+-�
���8(������
<�/����/���'
��������/��
� � � � � $ � � �
!
!
!
!
�
� �����1�'
���1���
���1��� ����� 1��� �����1�'
1���
�������
�����
(��
+��� 7��1-���
5��1�
?���1)�A6��!�����6'�6����6��)�7��"�����1�)1�!����"�����!��7
����6��!�����6'
?���6��!�����6'�����"��(�!�6���)�'�1)�!����"�"�)�������
1)�A6��!�����6'�6���
?���1)�A6��!�����6'�6����6��)�7��"���'�B��!����!�'�����"
����������6��!�����6'
?���1)�A6��!�����6'�6����)�!����"���'�6��6�)�!
)���)"��������!��6!��7�����6��!�����6'
%�7����7���'�1)�1�)�"�7�)�����6��!�����6'��7��)������"�������
1)�A6��!�����6'�6���4
�����
������������� ������������� ���� ��������������� �������������

10
When evaluating how well the consultancy objectives were met during the meeting, the participants deemed all of the objectives to be “partially” or “fully” met, as seen in the table below. 75% of participants indicated that the objectives of “describing the asthma problem in Boston” and “understanding the features and availability of environmental data sources,” were fully met.
One of the primary functions of ISDS and the Boston consultancy is to bring together SMEs from
different fields and mechanize multi-‐stakeholder collaborations. After attending the consultancy, 83% of participants indicated that they would contact another consultancy attendee; 42% of participants are interested in requesting syndromic surveillance data from the BPHC; and 75% of participants responded that they would look into the data sources presented at the meeting.
Open-‐ended responses to—What did you gain from attending this consultancy?—included:
• Limited understanding of asthma problem in Boston • Appreciation for asthma problem in Boston • Better understanding of models • The role of colds in asthma • Very interesting information from a variety of engaging presenters • Excellent ideas for implementation for Houston. • Better understanding of existing data sources -‐Path forward to better utilize BPHC syndromic
data • I very much enjoyed learning from and listening to the diverse talks and appreciating the
complexity of this project.
Open-‐ended responses to— What worked well during the consultancy? — included: • Ample time for free discussion during and after talks • A good group • Most of it -‐ meeting flowed well and content was compelling • It was a great (somewhat eclectic) group of scientist and well-‐organized program. • Experts were willing to share their work and opinion
# ##"
!� :�"
�
$# ##"
�
6 ��"
�
�
�
# ##"
�: :�"
�$ ##"
�
6 ��"
�
�
�
6 ��"
�
$6 ��"
$
�� ��"
�
# ##"
�
�
# ##"
!� :�"
�
$6 ��"
$
# ##"
�
�
# ##"
�$ ##"
�
�$ ##"
�
# ##"
�
�
# ##"
�$ ##"
�
:: :�"
�
6 ��"
�
�
�
# ##"
$# ##"
�
!� :�"
�
6 ��"
�
�
�
# ##"
$# ##"
�
!� :�"
�
6 ��"
�
�
�
�: :�"
$6 ��"
$
�: :�"
6 ��"
�
�
�
� ,)=�(��5�����
��������
,)=�(��5�
������'����
,)=�(��5�
/���'����
�����������/��
�-�����(������
+���
?��"�!6)��������1����������������7���������������0�"���)�!,�7�6��)!�����
�D�6�)������!��0�����/�!���4
?��"�!6)���������!��0��1)����0����/�!���
?��"�!6)������(�/�!���������6��������9�00�!!����(���"��!��������7�)0�������7
���'�6���"�����6�1����7�6��)!�������)����)��!��0������6,!4
?��"�!6)��������1����)�!��7�!'�")�0�6�!�)�������6��7�)��!��0��!�)�������6����
/�!���4
?����"�)!���"�����7����)�!���"������������'��7�����)��0������"����!��)6�!�:�4�4;
(�����);�1�)��6������"���<
?��1)�!����)�!���!��7���!�01����7�0�"��!�7�)��!��0��!�)�������6�4
?��"�!6)����!�)������!�7�)��)��!���������0�"���7�)��!��0�4
?��"�!6)����7��6�������)�B��)�0���!�7�)��1�)���������������0�"������/�!���4
?��1)���"�������)����)���"�)!���"�����7���(�����6��!�����6'�(�),�7��!���������
�������)0�����!��7�����/��!�)�������6���6�!'!��0�:/�E�<4
�����
������������� ������������� ���� ��������������� �������������
11
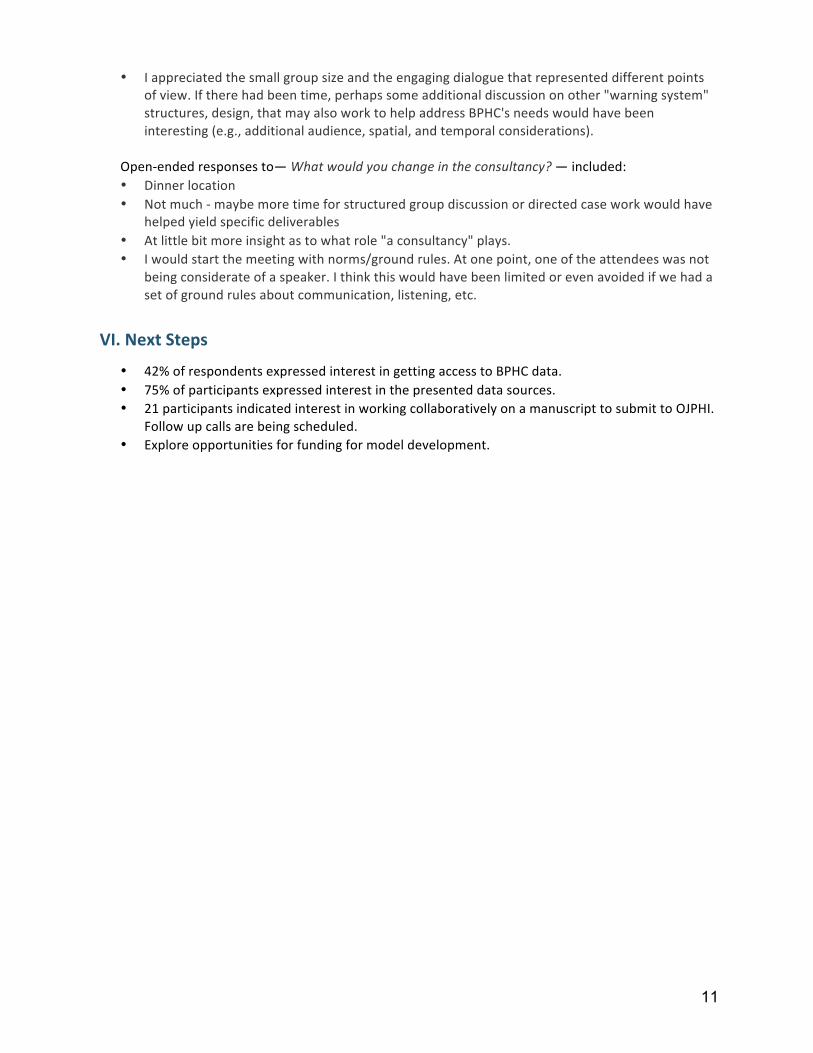
• I appreciated the small group size and the engaging dialogue that represented different points of view. If there had been time, perhaps some additional discussion on other "warning system" structures, design, that may also work to help address BPHC's needs would have been interesting (e.g., additional audience, spatial, and temporal considerations).
Open-‐ended responses to— What would you change in the consultancy? — included: • Dinner location • Not much -‐ maybe more time for structured group discussion or directed case work would have
helped yield specific deliverables • At little bit more insight as to what role "a consultancy" plays. • I would start the meeting with norms/ground rules. At one point, one of the attendees was not
being considerate of a speaker. I think this would have been limited or even avoided if we had a set of ground rules about communication, listening, etc.
VI. Next Steps
• 42% of respondents expressed interest in getting access to BPHC data. • 75% of participants expressed interest in the presented data sources. • 21 participants indicated interest in working collaboratively on a manuscript to submit to OJPHI.
Follow up calls are being scheduled. • Explore opportunities for funding for model development.
12
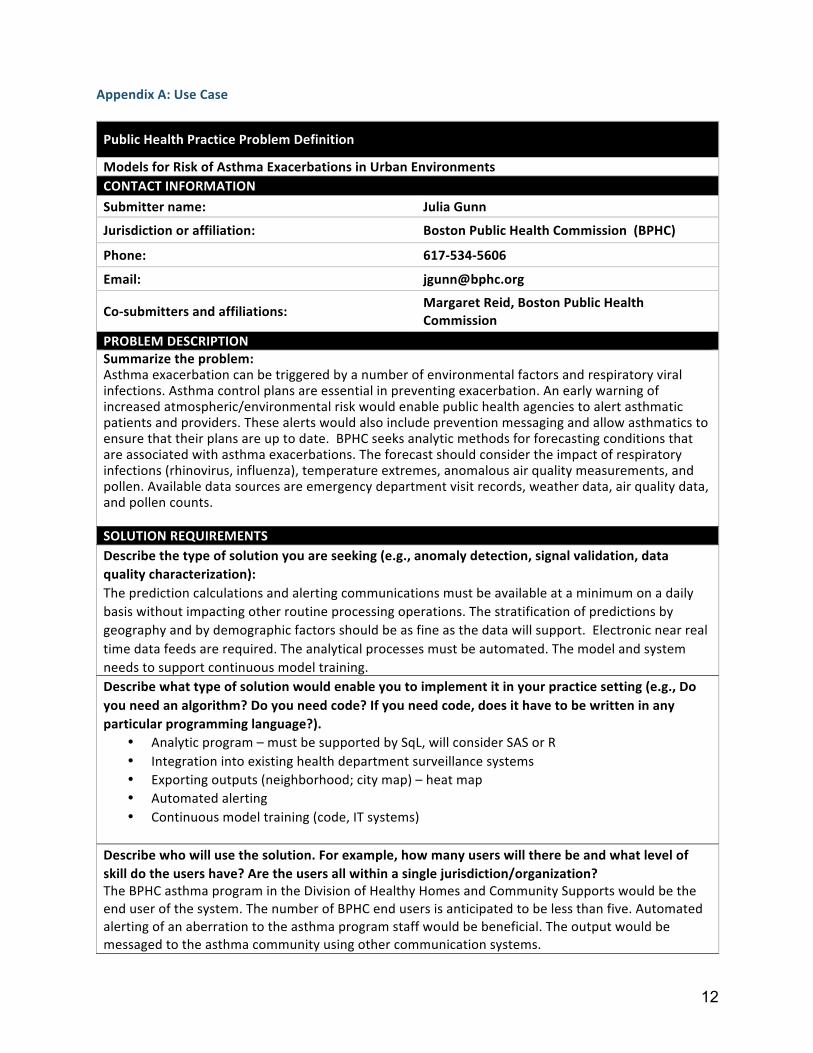
Appendix A: Use Case
Public Health Practice Problem Definition
Models for Risk of Asthma Exacerbations in Urban Environments CONTACT INFORMATION Submitter name: Julia Gunn
Jurisdiction or affiliation: Boston Public Health Commission (BPHC)
Phone: 617-‐534-‐5606
Email: [email protected]
Co-‐submitters and affiliations: Margaret Reid, Boston Public Health Commission
PROBLEM DESCRIPTION Summarize the problem: Asthma exacerbation can be triggered by a number of environmental factors and respiratory viral infections. Asthma control plans are essential in preventing exacerbation. An early warning of increased atmospheric/environmental risk would enable public health agencies to alert asthmatic patients and providers. These alerts would also include prevention messaging and allow asthmatics to ensure that their plans are up to date. BPHC seeks analytic methods for forecasting conditions that are associated with asthma exacerbations. The forecast should consider the impact of respiratory infections (rhinovirus, influenza), temperature extremes, anomalous air quality measurements, and pollen. Available data sources are emergency department visit records, weather data, air quality data, and pollen counts. SOLUTION REQUIREMENTS Describe the type of solution you are seeking (e.g., anomaly detection, signal validation, data quality characterization): The prediction calculations and alerting communications must be available at a minimum on a daily basis without impacting other routine processing operations. The stratification of predictions by geography and by demographic factors should be as fine as the data will support. Electronic near real time data feeds are required. The analytical processes must be automated. The model and system needs to support continuous model training. Describe what type of solution would enable you to implement it in your practice setting (e.g., Do you need an algorithm? Do you need code? If you need code, does it have to be written in any particular programming language?).
• Analytic program – must be supported by SqL, will consider SAS or R • Integration into existing health department surveillance systems • Exporting outputs (neighborhood; city map) – heat map • Automated alerting • Continuous model training (code, IT systems)
Describe who will use the solution. For example, how many users will there be and what level of skill do the users have? Are the users all within a single jurisdiction/organization? The BPHC asthma program in the Division of Healthy Homes and Community Supports would be the end user of the system. The number of BPHC end users is anticipated to be less than five. Automated alerting of an aberration to the asthma program staff would be beneficial. The output would be messaged to the asthma community using other communication systems.
13
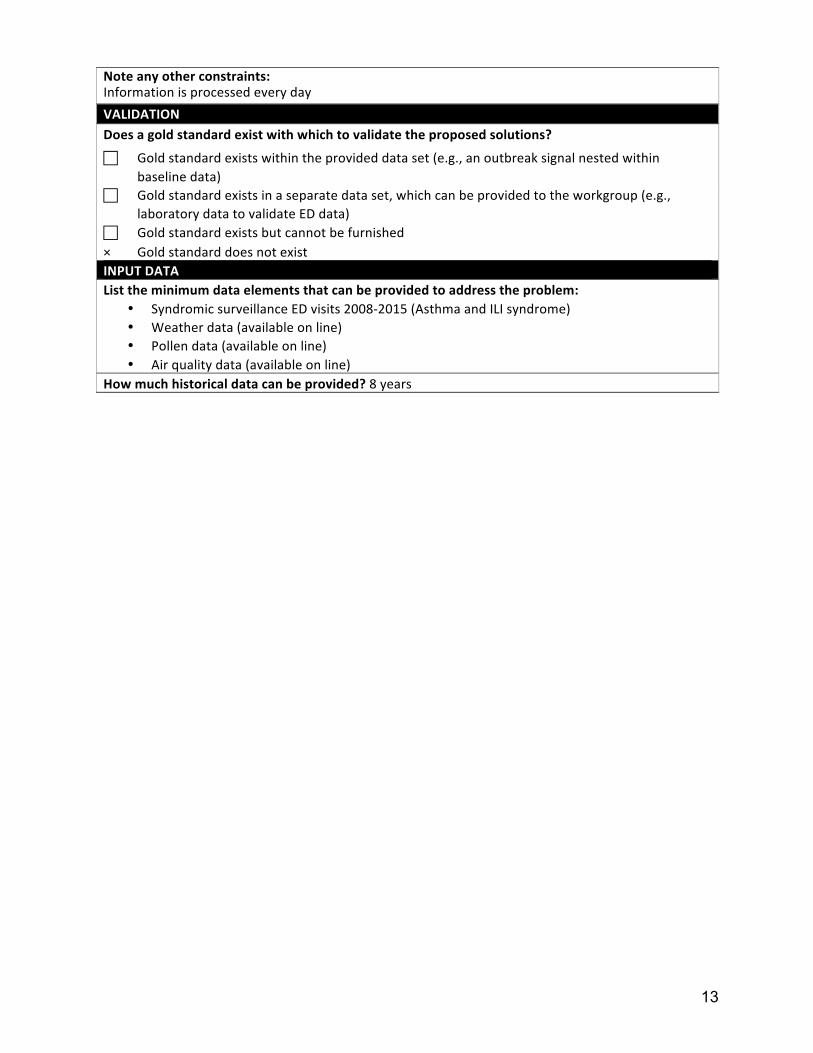
Note any other constraints: Information is processed every day VALIDATION Does a gold standard exist with which to validate the proposed solutions?
! Gold standard exists within the provided data set (e.g., an outbreak signal nested within baseline data)
! Gold standard exists in a separate data set, which can be provided to the workgroup (e.g., laboratory data to validate ED data)
! Gold standard exists but cannot be furnished × Gold standard does not exist INPUT DATA List the minimum data elements that can be provided to address the problem:
• Syndromic surveillance ED visits 2008-‐2015 (Asthma and ILI syndrome) • Weather data (available on line) • Pollen data (available on line) • Air quality data (available on line)
How much historical data can be provided? 8 years
14
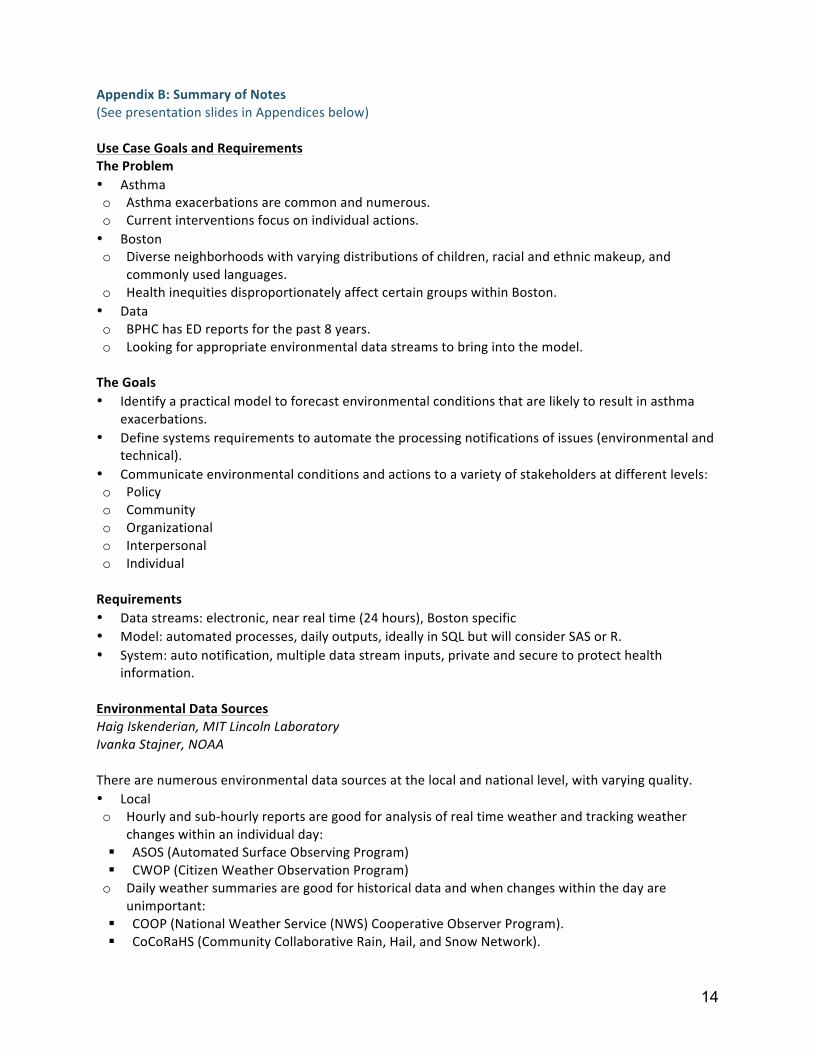
Appendix B: Summary of Notes (See presentation slides in Appendices below) Use Case Goals and Requirements The Problem • Asthma o Asthma exacerbations are common and numerous. o Current interventions focus on individual actions. • Boston o Diverse neighborhoods with varying distributions of children, racial and ethnic makeup, and
commonly used languages. o Health inequities disproportionately affect certain groups within Boston. • Data o BPHC has ED reports for the past 8 years. o Looking for appropriate environmental data streams to bring into the model. The Goals • Identify a practical model to forecast environmental conditions that are likely to result in asthma
exacerbations. • Define systems requirements to automate the processing notifications of issues (environmental and
technical). • Communicate environmental conditions and actions to a variety of stakeholders at different levels: o Policy o Community o Organizational o Interpersonal o Individual
Requirements • Data streams: electronic, near real time (24 hours), Boston specific • Model: automated processes, daily outputs, ideally in SQL but will consider SAS or R. • System: auto notification, multiple data stream inputs, private and secure to protect health
information.
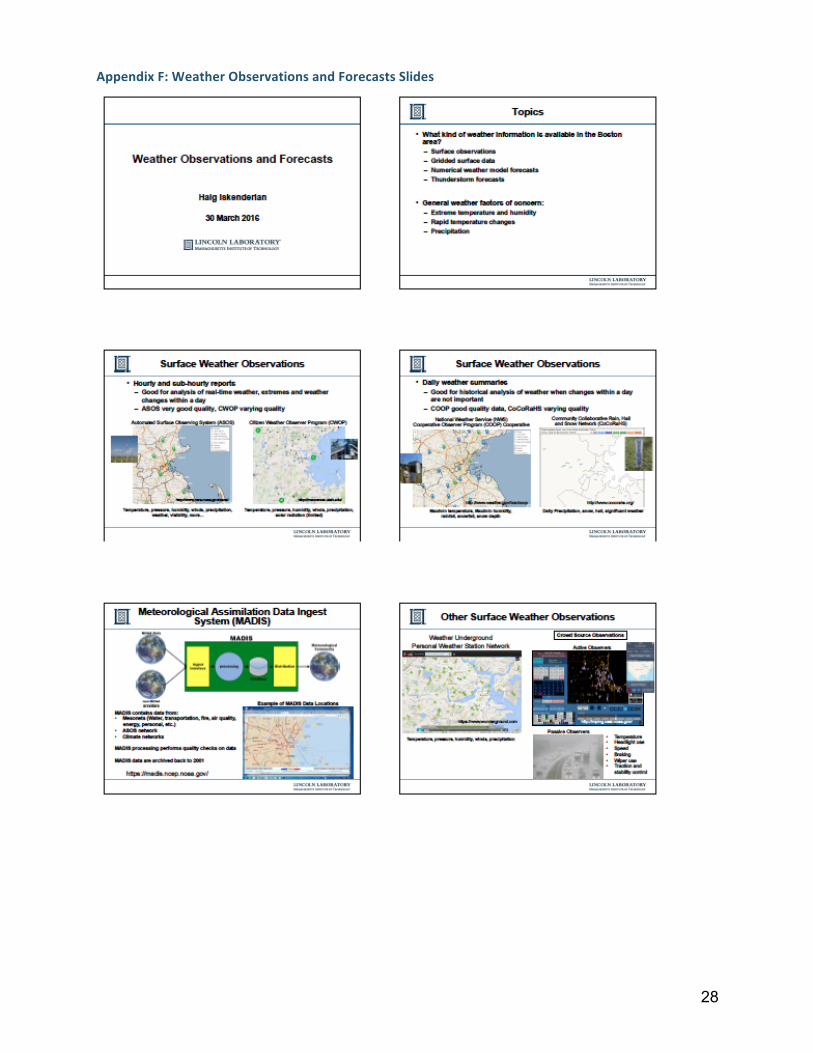
Environmental Data Sources Haig Iskenderian, MIT Lincoln Laboratory Ivanka Stajner, NOAA There are numerous environmental data sources at the local and national level, with varying quality. • Local o Hourly and sub-‐hourly reports are good for analysis of real time weather and tracking weather
changes within an individual day: § ASOS (Automated Surface Observing Program) § CWOP (Citizen Weather Observation Program) o Daily weather summaries are good for historical data and when changes within the day are
unimportant: § COOP (National Weather Service (NWS) Cooperative Observer Program). § CoCoRaHS (Community Collaborative Rain, Hail, and Snow Network).
15
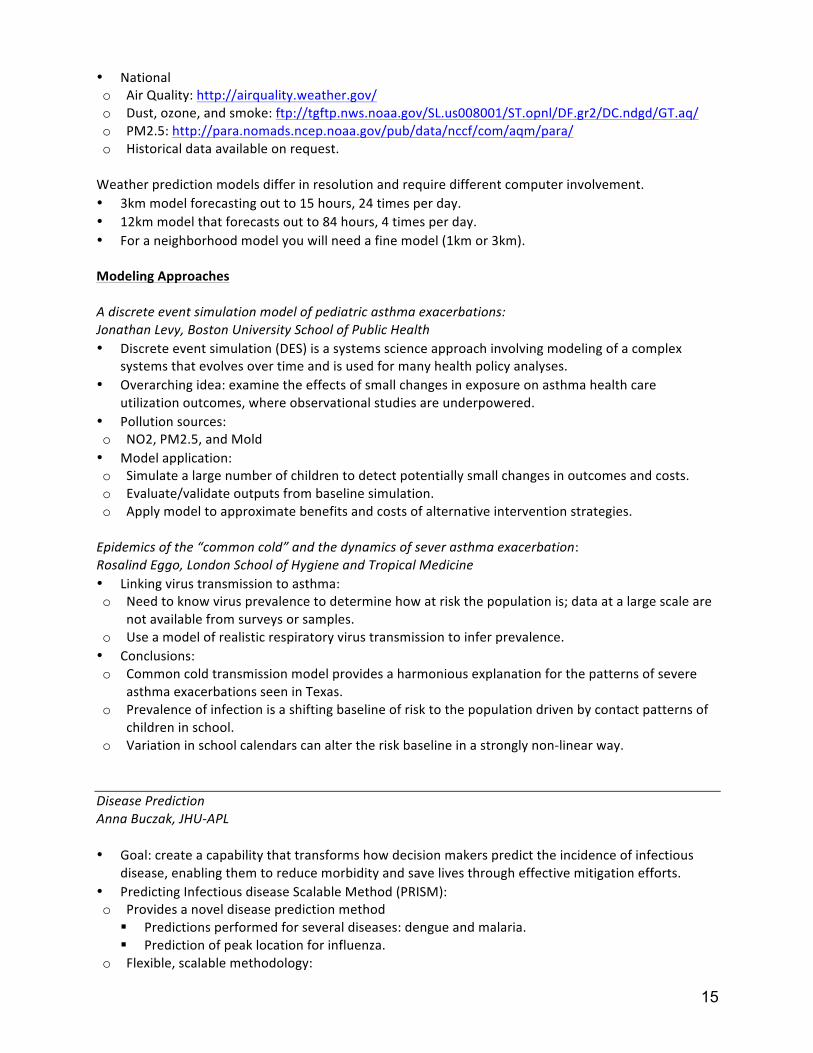
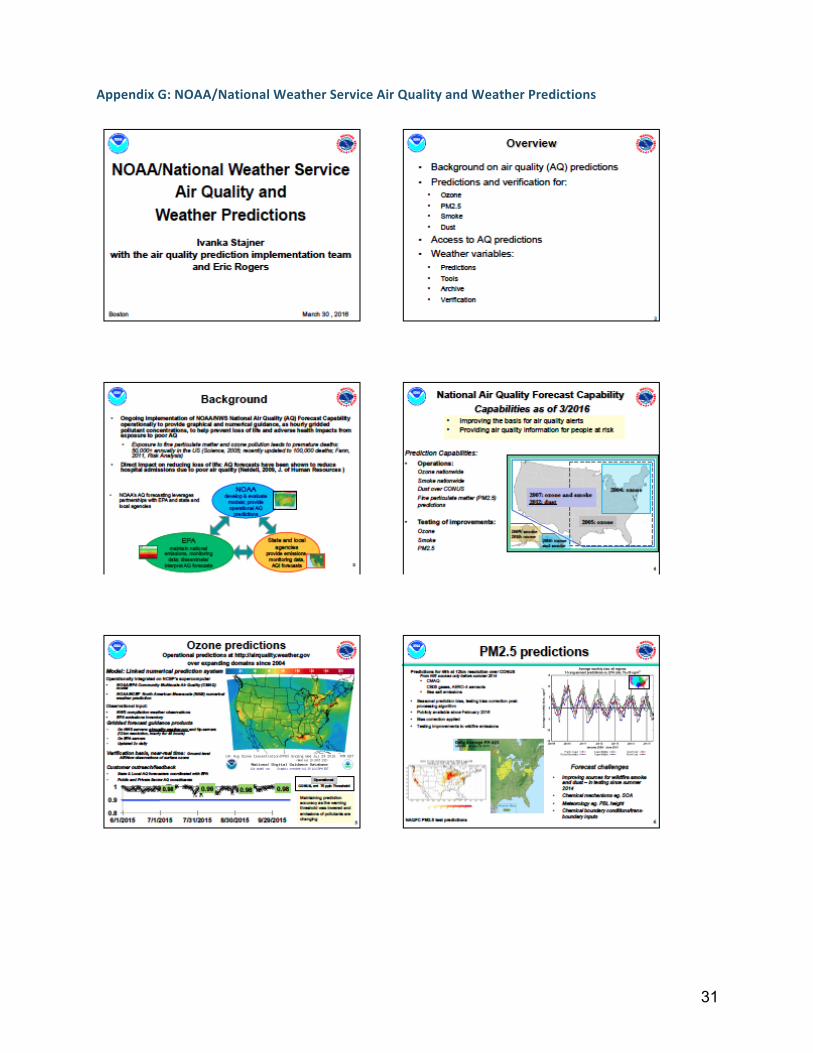
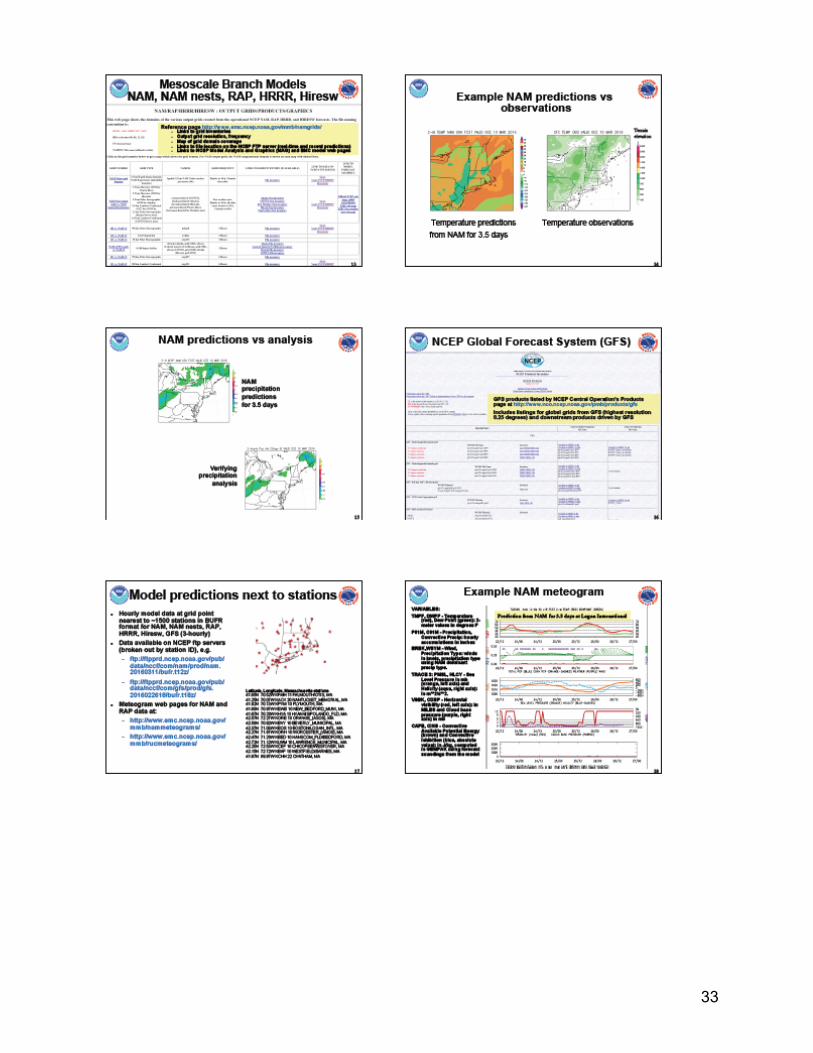
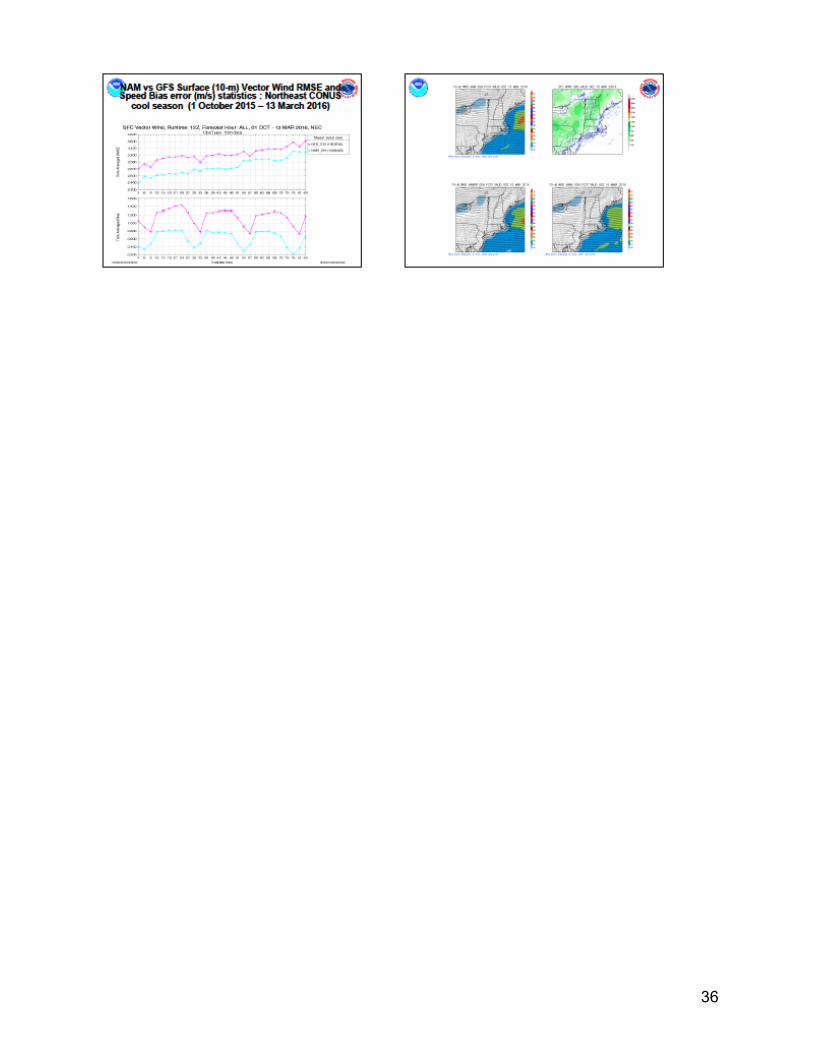
• National o Air Quality: http://airquality.weather.gov/ o Dust, ozone, and smoke: ftp://tgftp.nws.noaa.gov/SL.us008001/ST.opnl/DF.gr2/DC.ndgd/GT.aq/ o PM2.5: http://para.nomads.ncep.noaa.gov/pub/data/nccf/com/aqm/para/ o Historical data available on request.
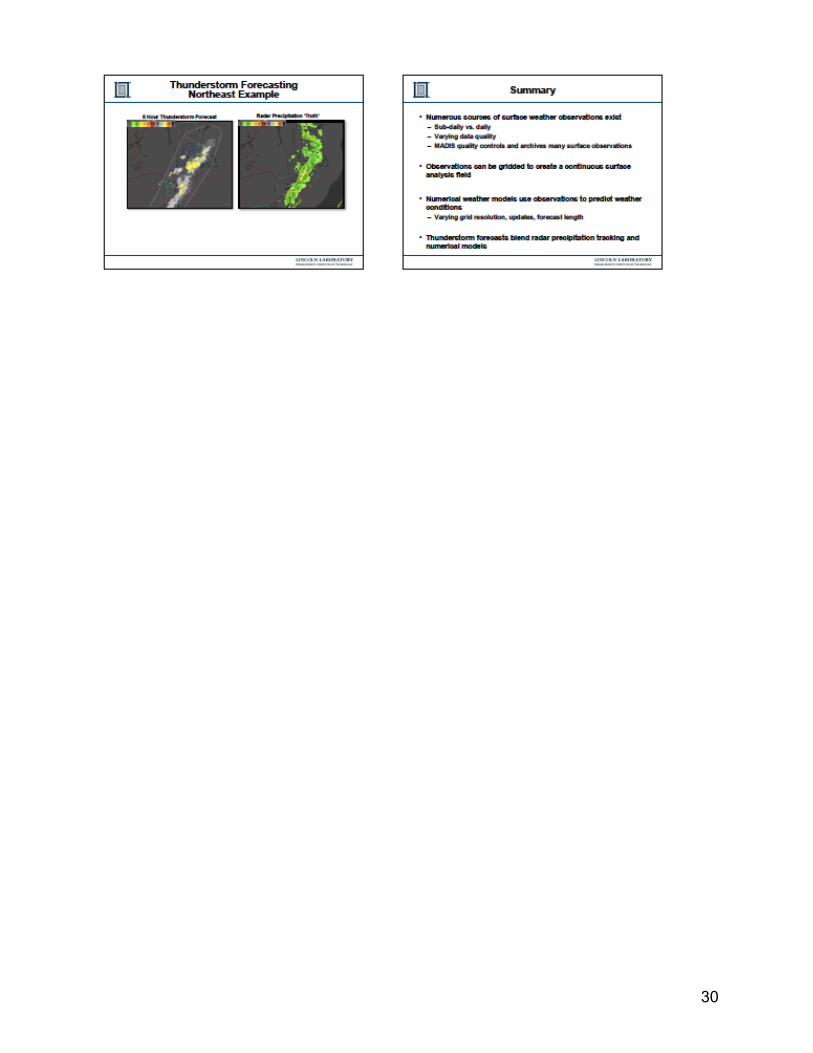
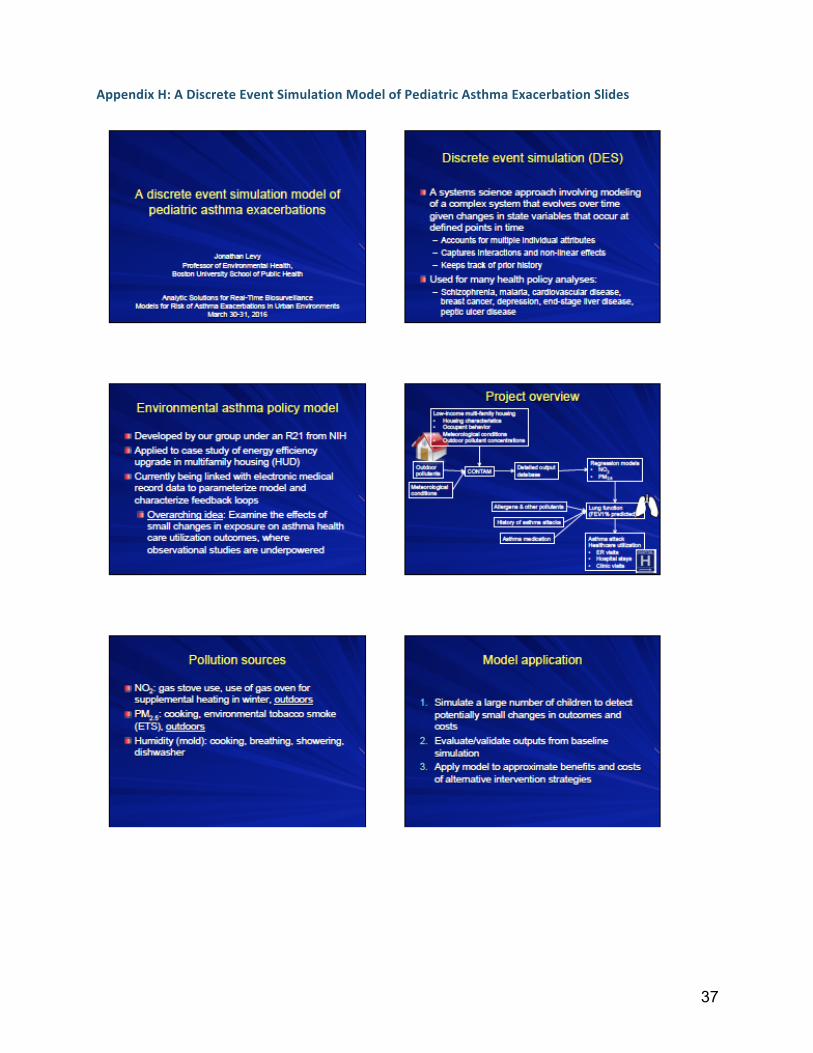
Weather prediction models differ in resolution and require different computer involvement. • 3km model forecasting out to 15 hours, 24 times per day. • 12km model that forecasts out to 84 hours, 4 times per day. • For a neighborhood model you will need a fine model (1km or 3km). Modeling Approaches A discrete event simulation model of pediatric asthma exacerbations: Jonathan Levy, Boston University School of Public Health • Discrete event simulation (DES) is a systems science approach involving modeling of a complex
systems that evolves over time and is used for many health policy analyses. • Overarching idea: examine the effects of small changes in exposure on asthma health care
utilization outcomes, where observational studies are underpowered. • Pollution sources: o NO2, PM2.5, and Mold • Model application: o Simulate a large number of children to detect potentially small changes in outcomes and costs. o Evaluate/validate outputs from baseline simulation. o Apply model to approximate benefits and costs of alternative intervention strategies.
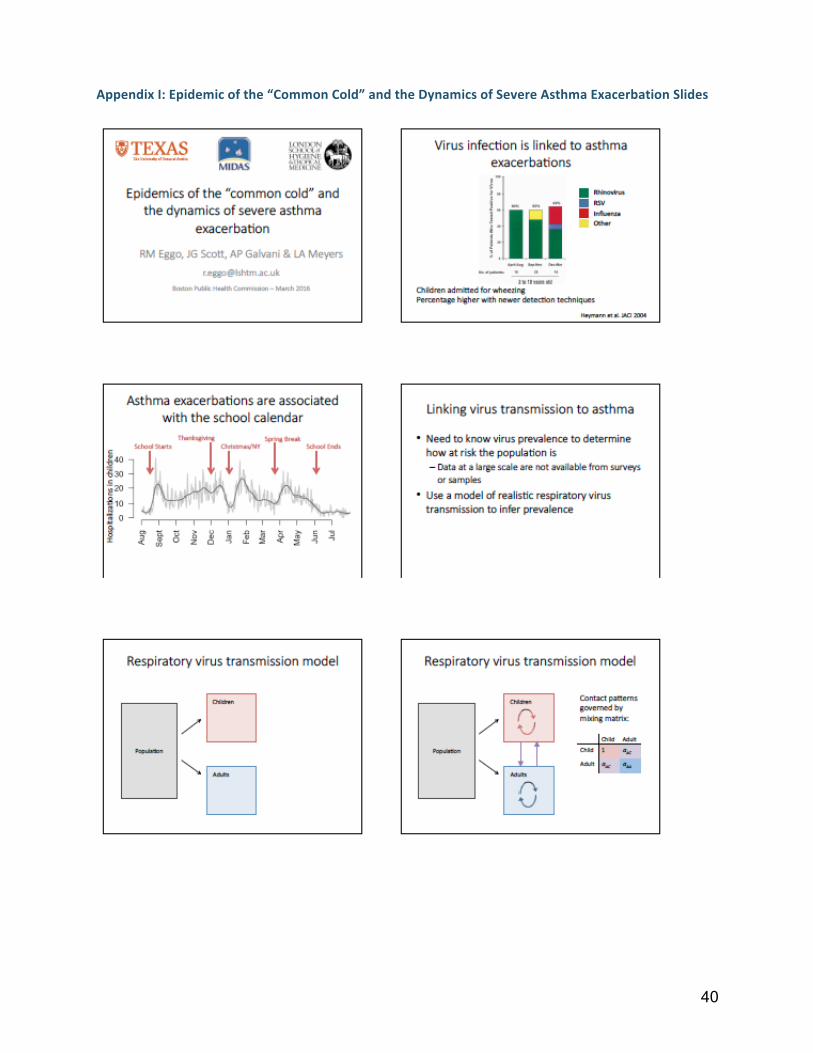
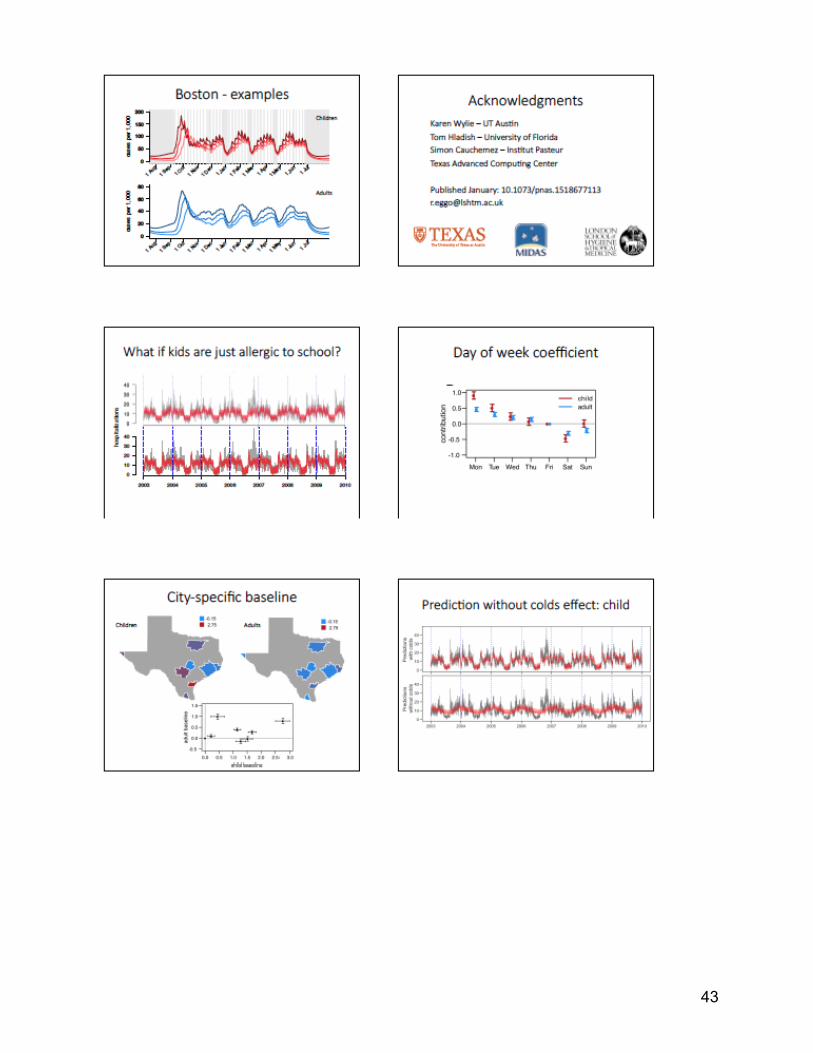
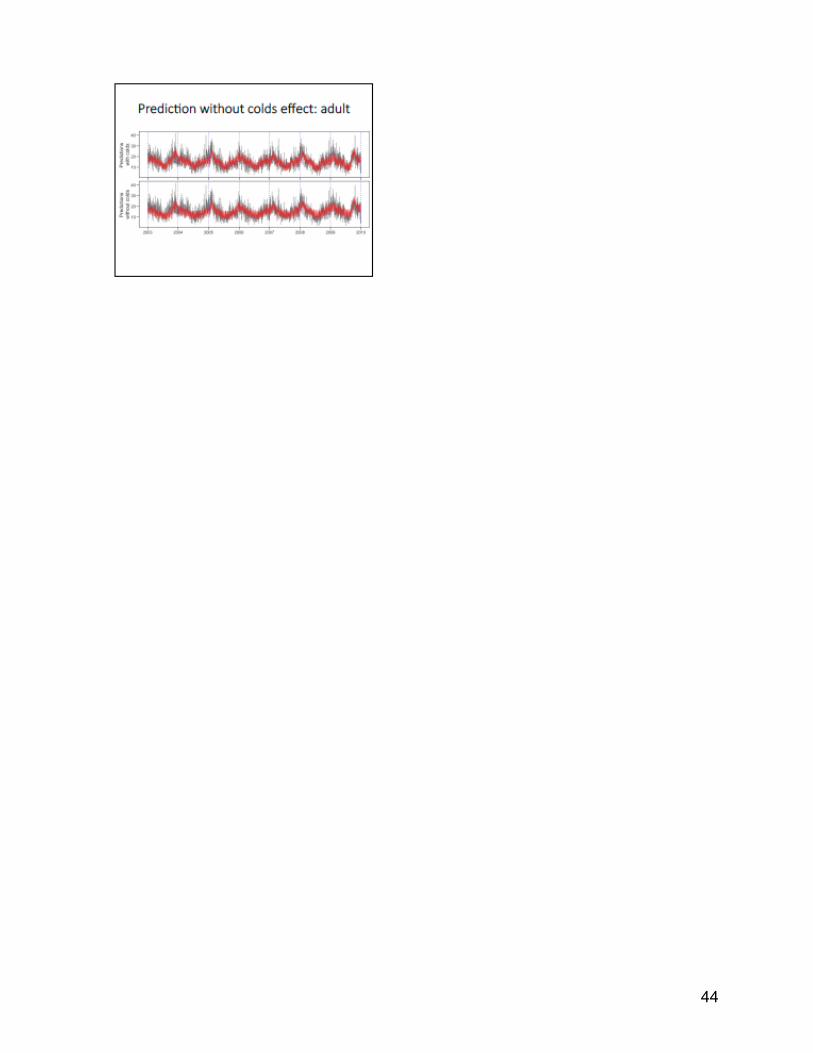
Epidemics of the “common cold” and the dynamics of sever asthma exacerbation: Rosalind Eggo, London School of Hygiene and Tropical Medicine • Linking virus transmission to asthma: o Need to know virus prevalence to determine how at risk the population is; data at a large scale are
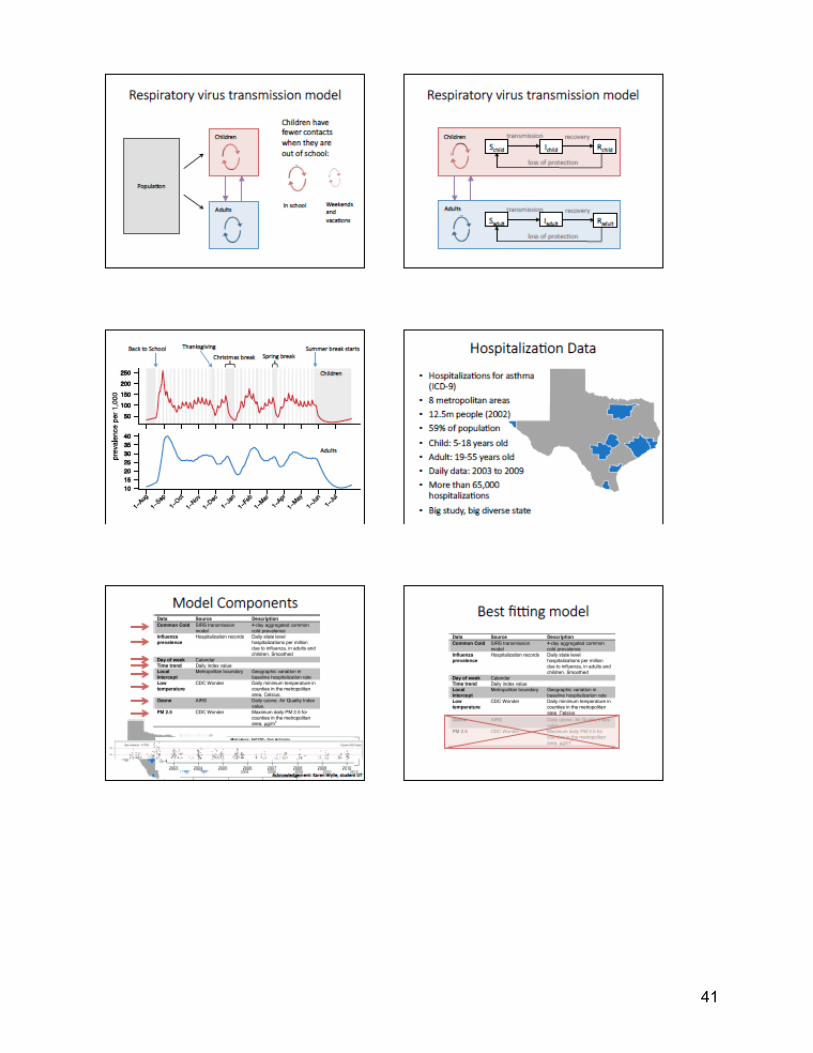
not available from surveys or samples. o Use a model of realistic respiratory virus transmission to infer prevalence. • Conclusions: o Common cold transmission model provides a harmonious explanation for the patterns of severe
asthma exacerbations seen in Texas. o Prevalence of infection is a shifting baseline of risk to the population driven by contact patterns of
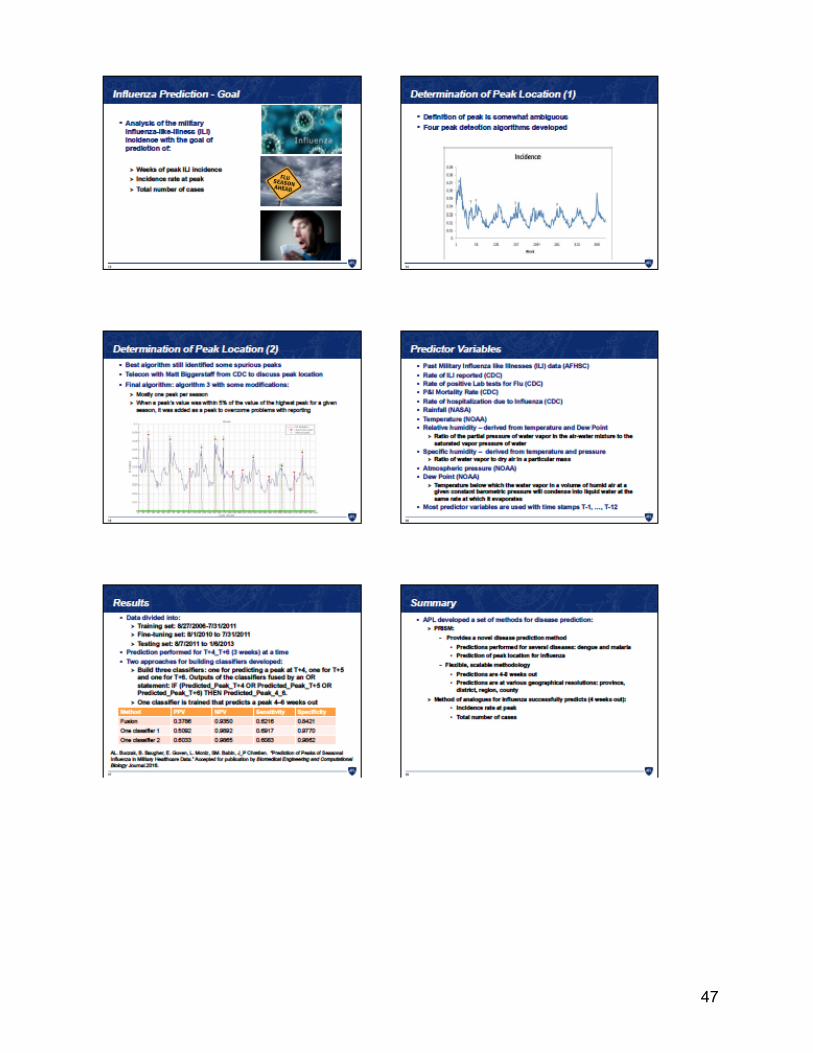
children in school. o Variation in school calendars can alter the risk baseline in a strongly non-‐linear way. Disease Prediction Anna Buczak, JHU-‐APL • Goal: create a capability that transforms how decision makers predict the incidence of infectious
disease, enabling them to reduce morbidity and save lives through effective mitigation efforts. • Predicting Infectious disease Scalable Method (PRISM): o Provides a novel disease prediction method
§ Predictions performed for several diseases: dengue and malaria. § Prediction of peak location for influenza.
o Flexible, scalable methodology:

16
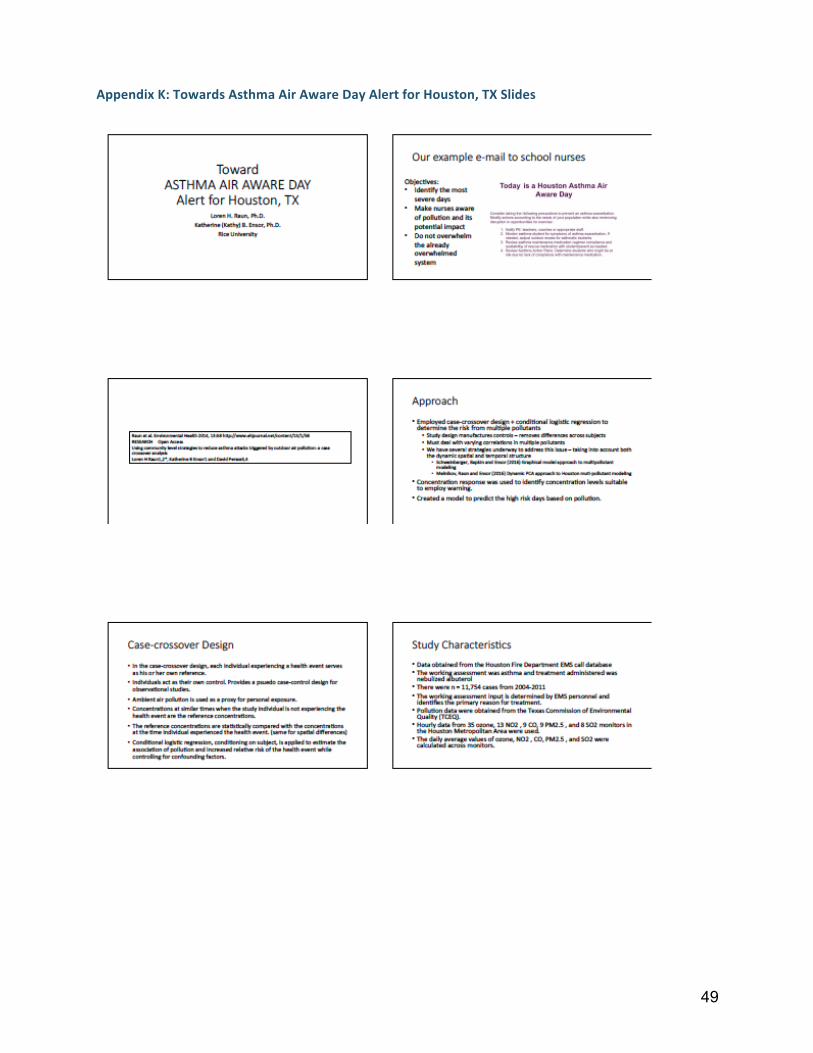
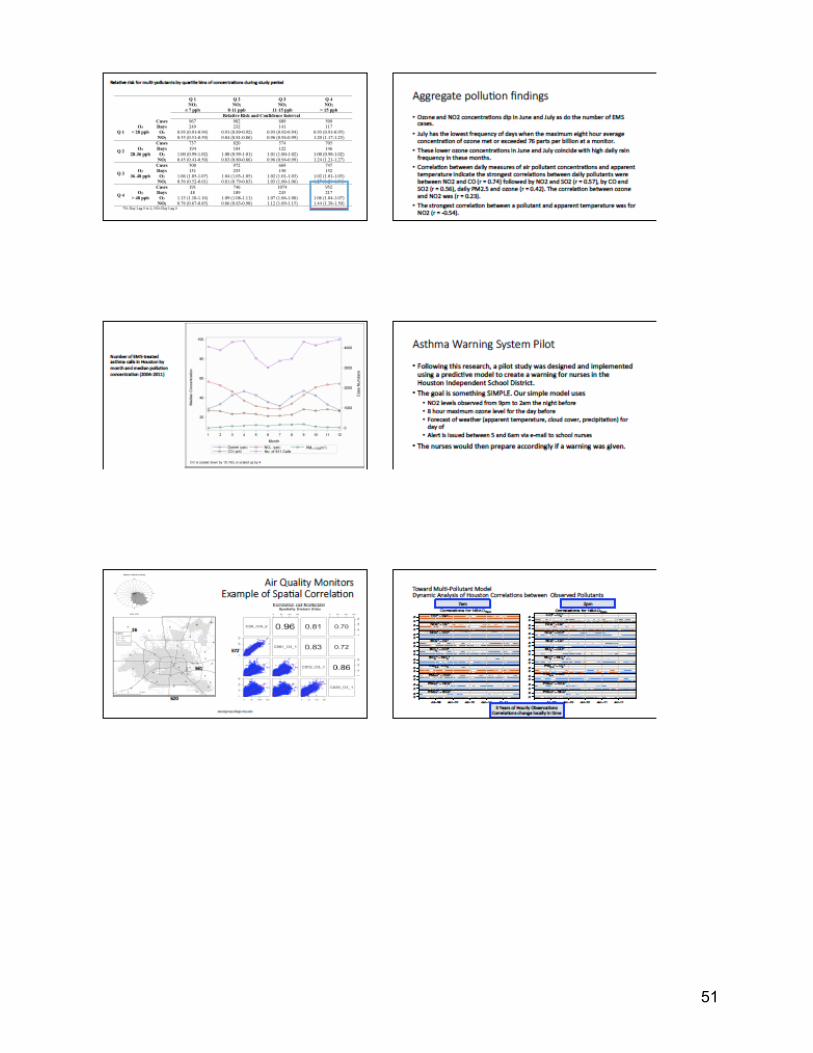
§ Predictions are at various geographical resolutions: province, district, region, county. • Method of analogues for influenza successfully predicts (4 weeks out): o Incidence at peak o Total number of cases Toward Asthma Air Aware Day Alert for Houston, TX Kathy Ensor, Rice University • Objectives: o Identify the most severe days o Make school nurses aware of pollution and its potential impact o Do no overwhelm the already overwhelmed system • Approach: o Employed case-‐crossover design + conditional logistic regression to determine the risk from
multiple pollutants. o Concentration response was used to identify concentration levels suitable to employ warning. o Created a model to predict the high-‐risk days based on pollution. • Asthma Warning System Pilot: o Model uses simple inputs: § NO2 levels observed from 9pm to 2am the night before § 8 hours maximum ozone level for the day before § Forecast of weather (apparent temperature, cloud cover, and precipitation for the day of
o Alert is issued between 5 and 6am via e-‐mail to school nurses. o The nurses would then prepare accordingly if a warning was given.
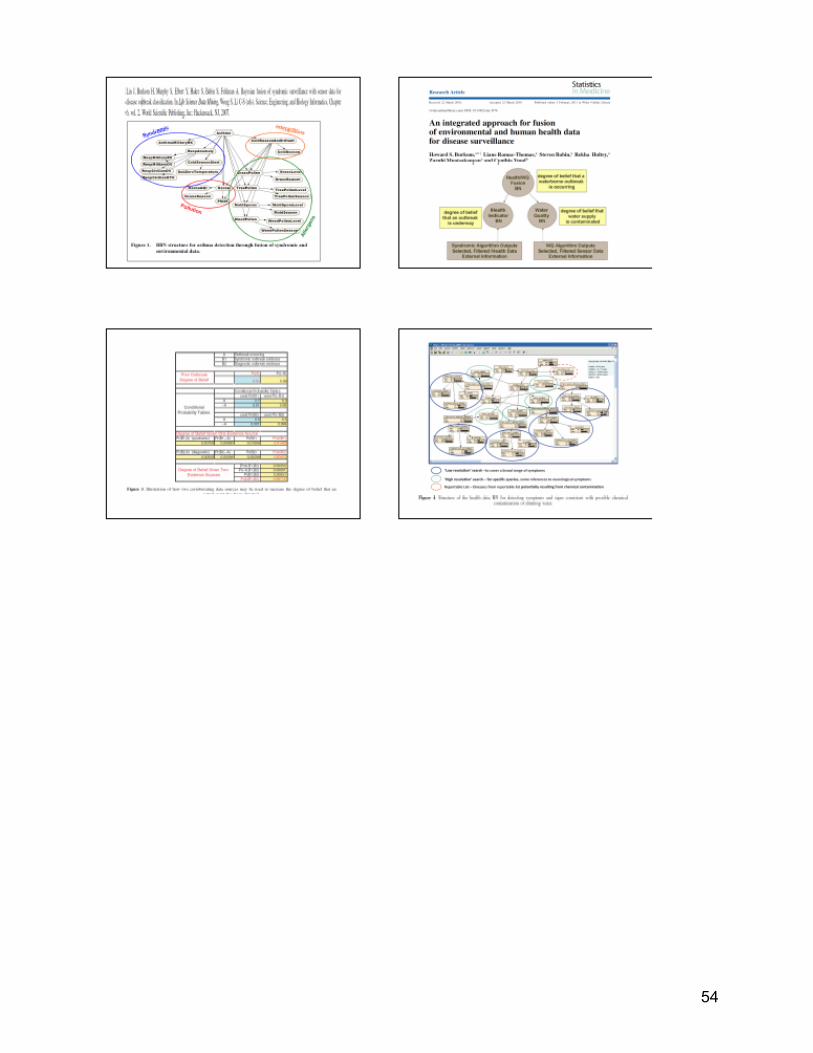
Bayesian Network Approaches Howard Burkom, JHU-‐APL • Concept: Population-‐based Bayes Networks o Method of combining information from the monitored population. o Not Bayesian statistics in the sense of hierarchical modeling, fixed/random effects (could
incorporate). o Not an agent-‐based Bayesian model representing every individual as a separate node with
properties. Translating the Model Feasibility: • Data streams for the model need to be identified and prioritized based on the target populations in
Boston. o Can we use syndromic data to find the most important stressors in clusters of high-‐risk groups? Impact: • Reduce racial and ethnic disparities in ED and hospitalizations. • Reduce geographic disparities. Intervention Levels: • Policy/System o Alerting school nurses
17
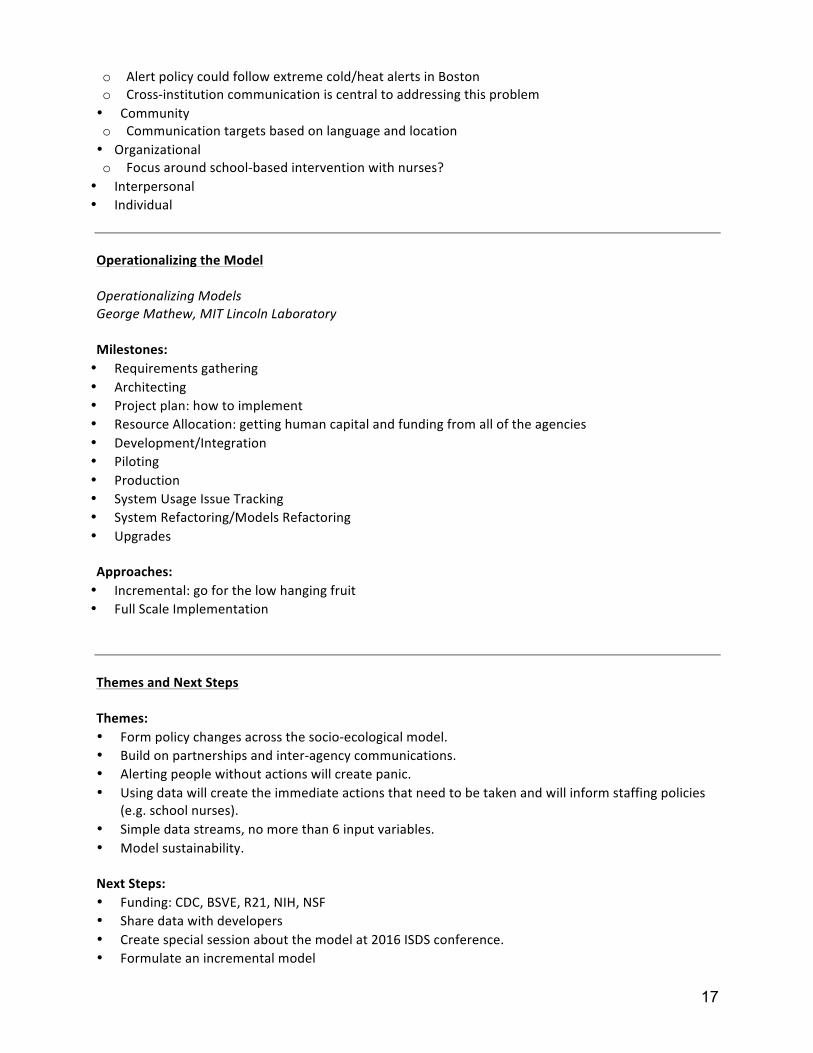
o Alert policy could follow extreme cold/heat alerts in Boston o Cross-‐institution communication is central to addressing this problem • Community o Communication targets based on language and location • Organizational o Focus around school-‐based intervention with nurses?
• Interpersonal • Individual Operationalizing the Model
Operationalizing Models George Mathew, MIT Lincoln Laboratory
Milestones: • Requirements gathering • Architecting • Project plan: how to implement • Resource Allocation: getting human capital and funding from all of the agencies • Development/Integration • Piloting • Production • System Usage Issue Tracking • System Refactoring/Models Refactoring • Upgrades Approaches: • Incremental: go for the low hanging fruit • Full Scale Implementation Themes and Next Steps Themes: • Form policy changes across the socio-‐ecological model. • Build on partnerships and inter-‐agency communications. • Alerting people without actions will create panic. • Using data will create the immediate actions that need to be taken and will inform staffing policies
(e.g. school nurses). • Simple data streams, no more than 6 input variables. • Model sustainability. Next Steps: • Funding: CDC, BSVE, R21, NIH, NSF • Share data with developers • Create special session about the model at 2016 ISDS conference. • Formulate an incremental model
18
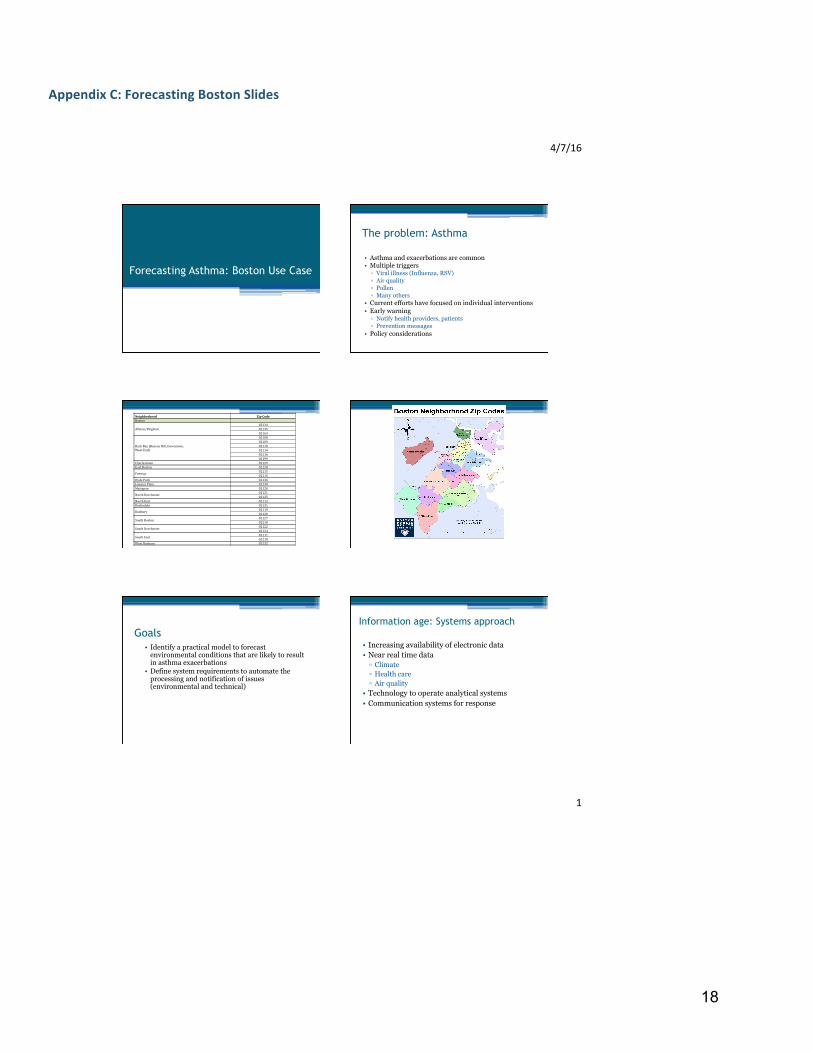
Appendix C: Forecasting Boston Slides
4/7/16
1
Forecasting Asthma: Boston Use Case
The problem: Asthma
• Asthma and exacerbations are common • Multiple triggers ▫ Viral illness (Influenza, RSV) ▫ Air quality ▫ Pollen ▫ Many others
• Current efforts have focused on individual interventions • Early warning ▫ Notify health providers, patients ▫ Prevention messages
• Policy considerations
Neighborhood ZipCodeBoston
Allston/Brighton021340213502163
BackBay(BeaconHill,Downtown,WestEnd)
021080210902110021140211602199
Charlestown 02129EastBoston 02128Fenway 02115
02215HydePark 02136JamaicaPlain 02130Mattapan 02126NorthDorchester 02121
02125NorthEnd 02113Roslindale 02131Roxbury 02119
02120SouthBoston 02127
02210SouthDorchester 02122
02124SouthEnd 02111
02118WestRoxbury 02132
Goals
• Identify a practical model to forecast environmental conditions that are likely to result in asthma exacerbations
• Define system requirements to automate the processing and notification of issues (environmental and technical)
• Increasing availability of electronic data • Near real time data ▫ Climate ▫ Health care ▫ Air quality
• Technology to operate analytical systems • Communication systems for response
Information age: Systems approach

19
20
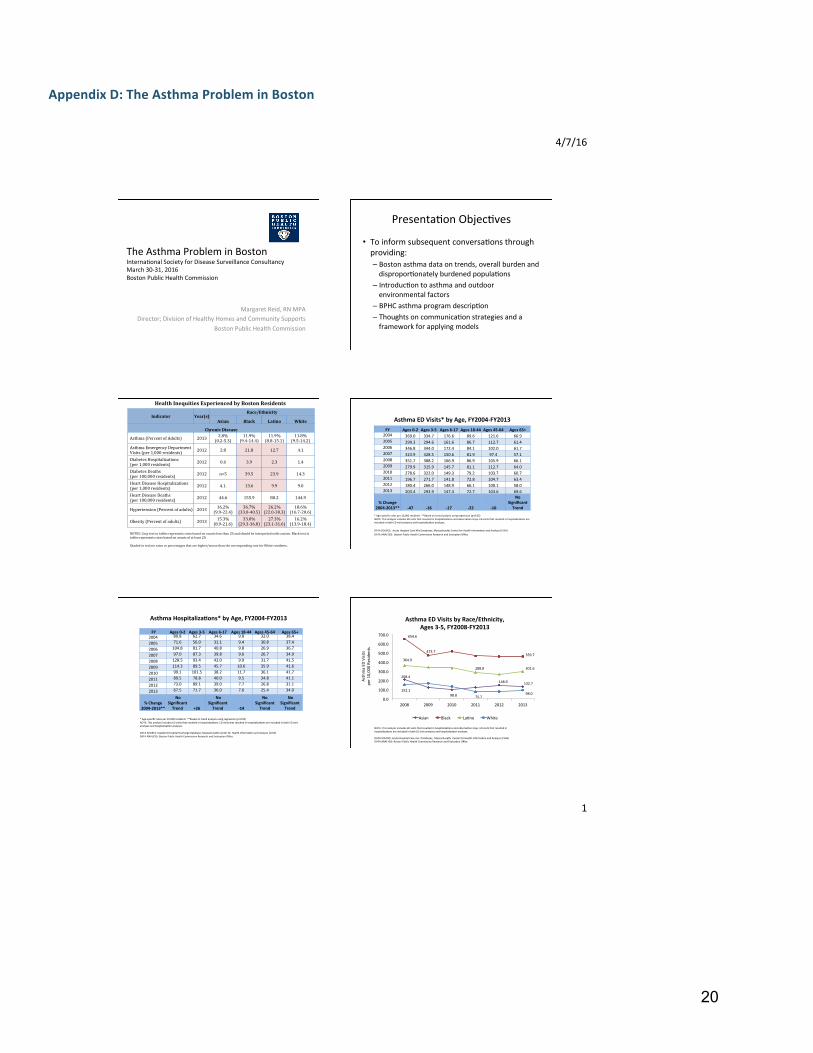
Appendix D: The Asthma Problem in Boston
4/7/16
1
TheAsthmaProbleminBostonInterna8onalSocietyforDiseaseSurveillanceConsultancyMarch30-31,2016BostonPublicHealthCommission
MargaretReid,RNMPADirector;DivisionofHealthyHomesandCommunitySupports
BostonPublicHealthCommission
Presenta8onObjec8ves
• Toinformsubsequentconversa8onsthroughproviding:– Bostonasthmadataontrends,overallburdenanddispropor8onatelyburdenedpopula8ons
– Introduc8ontoasthmaandoutdoorenvironmentalfactors
– BPHCasthmaprogramdescrip8on– Thoughtsoncommunica8onstrategiesandaframeworkforapplyingmodels
Indicator Year(s)Race/Ethnicity
Asian Black Latino White
ChronicDisease
Asthma(PercentofAdults) 2013 2.8%(0.2-5.3)
11.9%(9.4-14.4)
11.9%(8.8-15.1)
11.8%(9.5-14.2)
AsthmaEmergencyDepartmentVisits(per1,000residents) 2012 2.8 21.8 12.7 4.1
DiabetesHospitalizations(per1,000residents) 2012 0.6 3.9 2.3 1.4
DiabetesDeaths(per100,000residents) 2012 n<5 39.5 23.9 14.3
HeartDiseaseHospitalizations(per1,000residents) 2012 4.1. 13.6 9.9 9.0
HeartDiseaseDeaths(per100,000residents) 2012 44.6 155.9 80.2 144.9
Hypertension(Percentofadults) 2013 16.2%(9.9-22.4)
36.7%(33.0-40.5)
26.2%(22.0-30.3)
18.6%(16.7-20.6)
Obesity(Percentofadults) 2013 15.3%(8.9-21.6)
33.0%(29.3-36.8)
27.3%(23.1-31.6)
16.2%(13.9-18.4)
HealthInequitiesExperiencedbyBostonResidents
NOTES:Graytextintablesrepresentsratesbasedoncountslessthan20andshouldbeinterpretedwithcaution.Blacktextintablesrepresentsratesbasedoncountsofatleast20.Shadedinredareratesorpercentagesthatarehigher/worsethanthecorrespondingrateforWhiteresidents.
AsthmaEDVisits*byAge,FY2004-FY2013
FY Ages0-2 Ages3-5 Ages6-17 Ages18-44 Ages45-64 Ages65+2004 369.0 334.7 176.6 89.6 121.6 66.92005 299.3 294.6 161.6 86.7 112.7 61.42006 346.8 344.0 172.4 84.1 102.0 61.72007 323.9 328.5 150.6 81.9 97.4 57.12008 351.7 388.2 166.9 86.9 105.9 66.12009 279.9 315.9 145.7 81.1 112.7 64.02010 278.6 322.0 149.3 79.2 103.7 60.72011 196.7 271.7 141.8 72.8 104.7 63.42012 180.4 266.0 148.9 66.1 100.1 58.02013 203.4 293.9 147.4 72.7 103.6 69.6
%Change2004-2013** -47 -16 -17 -22 -10
NoSignificantTrend
*Age-specificratesper10,000residents**Basedontrendanalysisusingregression(p<0.05)NOTE:ThisanalysisincludesEDvisitsthatresultedinhospitaliza8onsandobserva8onstays.EDvisitsthatresultedinhospitaliza8onsareincludedinbothEDvisitanalysesandhospitaliza8onanalyses.
DATASOURCE:AcuteHospitalCaseMixDatabases,MassachuseasCenterforHealthInforma8onandAnalysis(CHIA)DATAANALYSIS:BostonPublicHealthCommissionResearchandEvalua8onOffice
FY Ages0-2 Ages3-5 Ages6-17 Ages18-44 Ages45-64 Ages65+2004 80.8 62.7 34.6 9.8 32.0 38.4
2005 71.6 56.0 31.1 9.4 30.8 37.4
2006 104.8 81.7 40.8 9.8 26.9 36.7
2007 97.0 87.3 39.8 9.6 26.7 34.9
2008 128.5 93.4 42.0 9.9 31.7 41.5
2009 114.3 89.5 45.7 10.6 35.9 41.6
2010 99.1 101.5 38.2 11.7 36.1 41.7
2011 89.5 78.8 40.0 9.5 34.8 41.1
2012 73.0 89.1 39.0 7.7 26.8 31.1
2013 67.5 71.7 36.0 7.6 25.4 34.0
%Change2004-2013**
NoSignificantTrend
+26
NoSignificantTrend
-14
NoSignificantTrend
NoSignificantTrend
*Age-specificratesper10,000residents**Basedontrendanalysisusingregression(p<0.05)NOTE:ThisanalysisincludesEDvisitsthatresultedinhospitaliza8ons.EDvisitsthatresultedinhospitaliza8onsareincludedinbothEDvisitanalysesandhospitaliza8onanalyses.DATASOURCE:Inpa8entHospitalDischargeDatabase,MassachuseasCenterforHealthInforma8onandAnalysis(CHIA)DATAANALYSIS:BostonPublicHealthCommissionResearchandEvalua8onOffice
AsthmaHospitalizaNons*byAge,FY2004-FY2013
0.0
100.0
200.0
300.0
400.0
500.0
600.0
700.0
2008 2009 2010 2011 2012 2013
AsthmaED
Visits
per1
0,000Re
siden
ts
AsthmaEDVisitsbyRace/Ethnicity,Ages3-5,FY2008-FY2013
Asian Black La8no White
208.4
98.8
148.9 132.7
152.1
75.798.0
364.9
288.8 301.6
654.6
473.7359.7
NOTE:ThisanalysisincludesEDvisitsthatresultedinhospitaliza8onsandobserva8onstays.EDvisitsthatresultedinhospitaliza8onsareincludedinbothEDvisitanalysesandhospitaliza8onanalyses.DATASOURCE:AcuteHospitalCasemixDatabases,MassachuseasCenterforHealthInforma8onandAnalysis(CHIA)DATAANALYSIS:BostonPublicHealthCommissionResearchandEvalua8onOffice

21
Appendix E: Syndromic Surveillance Slides
22
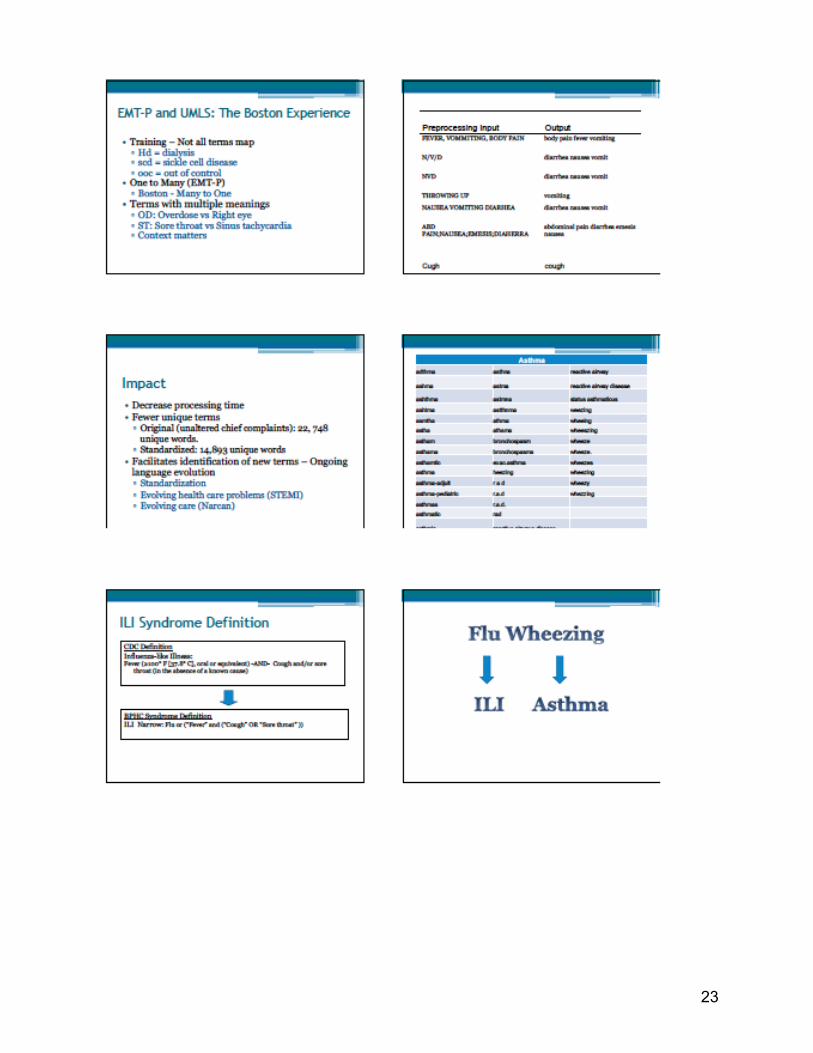
23
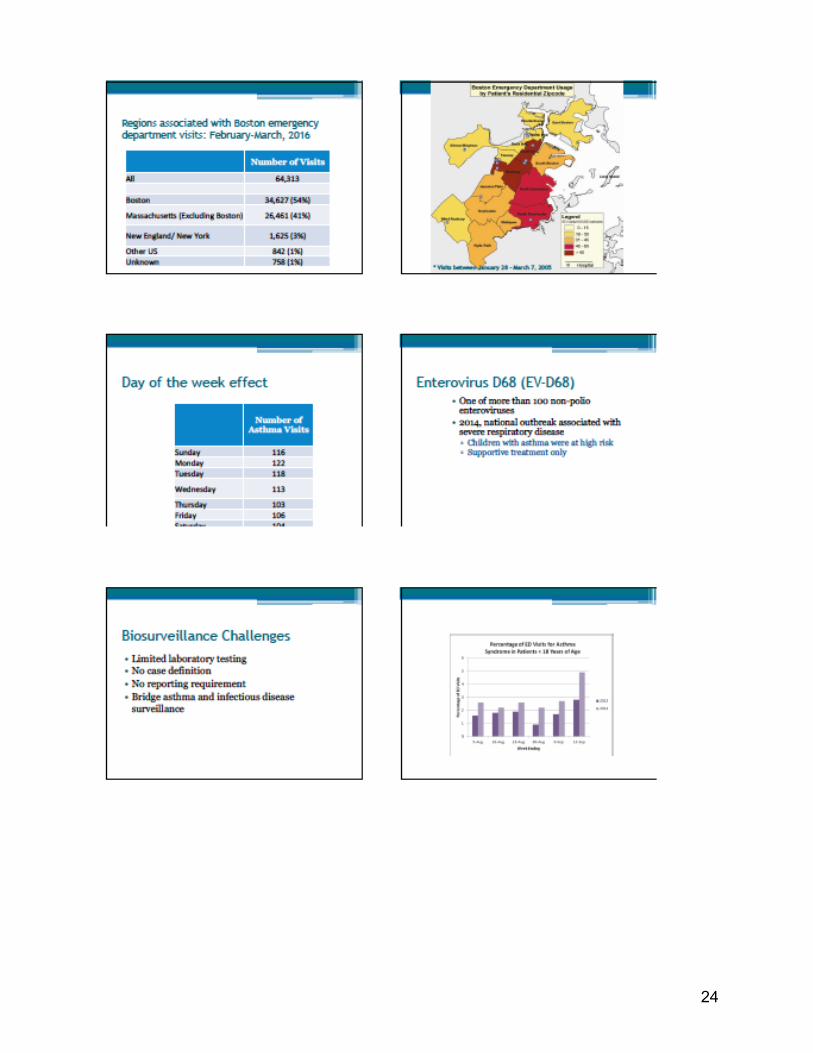
24

25
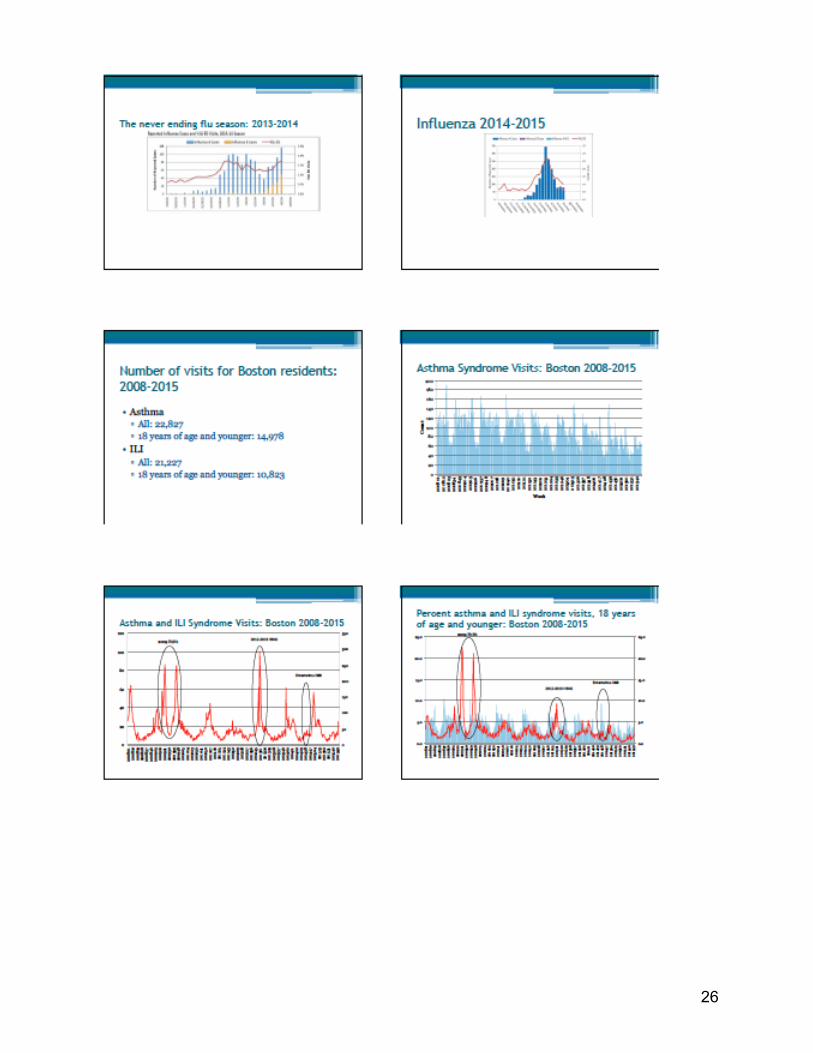
26
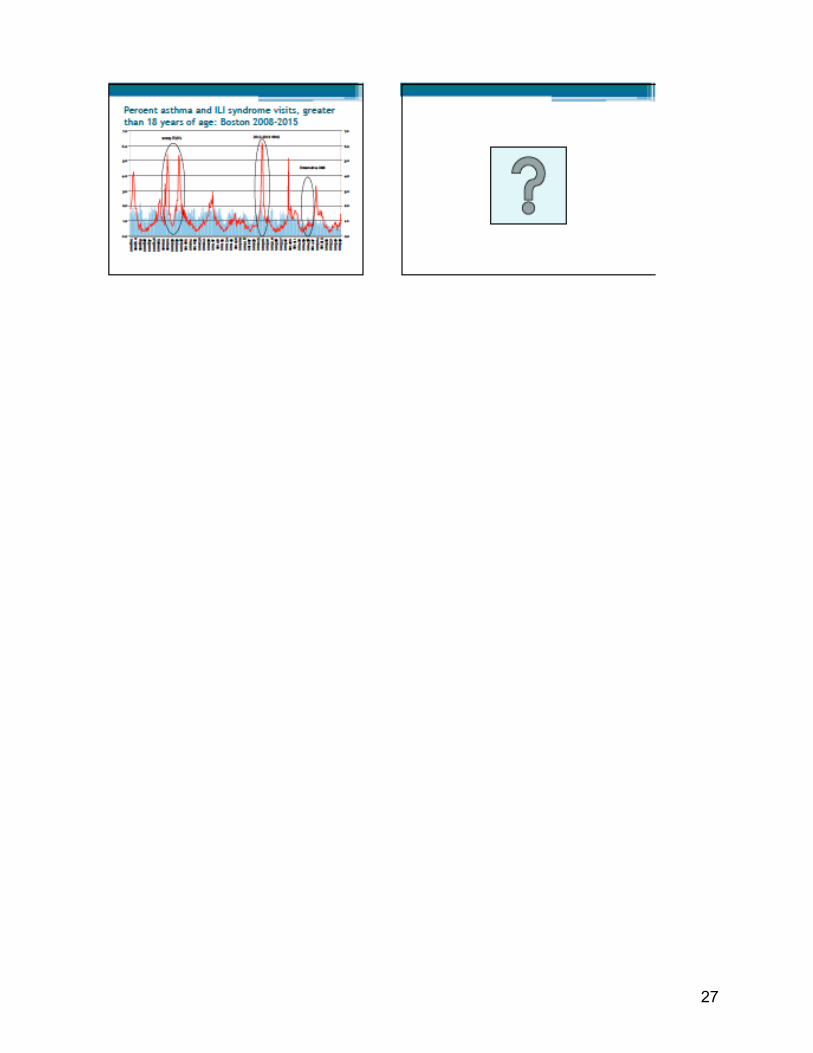
27
28
Appendix F: Weather Observations and Forecasts Slides

29
30
31
Appendix G: NOAA/National Weather Service Air Quality and Weather Predictions

32
33

34

35
36
37
Appendix H: A Discrete Event Simulation Model of Pediatric Asthma Exacerbation Slides

38
39
40
Appendix I: Epidemic of the “Common Cold” and the Dynamics of Severe Asthma Exacerbation Slides
41

42
43
44

45
Appendix J: Disease Prediction

46
47

48
49
Appendix K: Towards Asthma Air Aware Day Alert for Houston, TX Slides

50
51

52

53
Appendix L: Bayesian Network Approaches Slides
54
Top Related