


Languages
Pages
Legal

Page 1
CCBA Project Implementation Report
for
TIST Program in India
CCB-001
for verification under
The Climate, Community and Biodiversity Standard Second Edition
08 February, 2013

Page 2
Table of Contents
Project Overview ............................................................................................................................... 5 General Section .................................................................................................................................. 6
G1. Original Conditions in Project Area........................................................................................ 6 G1.1 General Information: location of the project and basic physical parameters ............. 6 G1.2 General information: types and condition of vegetation within the project area ....... 7 G1.3 General information: boundaries of the project area and the project zone ................ 7 G1.4 Climate Information: baseline carbon stocks ............................................................. 7 G1.5 Community information: description of communities in project zone ...................... 8 G1.6 Community Information: current land use and property rights ............................... 10 G1.7 Biodiversity Information: current biodiversity within the project zone .................. 10 G1.8 Biodiversity Information: High Conservation Values and attributes ....................... 11
G2. Baseline Projections .............................................................................................................. 13 G2.1 Most likely scenario ................................................................................................. 13 G2.2 Document how project benefits would not have occurred without project ............. 15 G2.3 Calculate carbon stock changes without project ...................................................... 18 G2.4 Affect on communities without project ................................................................... 18 G2.5 Affect on biodiversity without project ..................................................................... 19
G3. Project Design and Goals ...................................................................................................... 19 G3.1 Summary of climate, community and biodiversity objectives ................................. 19 G3.2 Description of project activities ............................................................................... 19 G3.3 Maps of project location and zone ........................................................................... 20 G3.4 Project Lifetime........................................................................................................ 20 G3.5 Natural and human-induced risks ............................................................................ 22 G3.6 Maintenance of the high conservation value attributes ............................................ 23 G3.7 Measures to maintain benefits beyond the project lifetime ..................................... 23 G3.8 Communities and other stakeholders ....................................................................... 23 G3.9 Publicizing the CCBA public comment period........................................................ 29 G3.10 Handling unresolved conflicts and grievances ....................................................... 30 G3.11 Project Financial Support ....................................................................................... 30
G4. Management Capacity and Best Practices ............................................................................ 31 G4.1 Project Proponent ..................................................................................................... 31 G4.2 Document key technical skills for successful implementation ................................ 31 G4.3 Developing Local Capacity ...................................................................................... 32 G4.4 Equal Opportunity Employment .............................................................................. 33 G4.5 Relevant workers right laws ..................................................................................... 33 G4.6 Occupational Safety ................................................................................................. 34 G4.7 Financial health of CAAC........................................................................................ 34
G5. Legal Status and Property Rights .......................................................................................... 34 G5.1 List of all relevant local, national and international laws ........................................ 34 G5.2 Project Approvals ..................................................................................................... 35 G5.3 Document project will not encroach on other lands ................................................ 35 G5.4 Involuntary relocation .............................................................................................. 35 G5.5 Illegal Activities ....................................................................................................... 35

Page 3
G5.6 Title to carbon rights ................................................................................................ 36 Climate Section ................................................................................................................................ 37
CL1. Net Positive Climate Impacts ............................................................................................. 37 CL1.1 Change in carbon stock due to project activity ...................................................... 37 CL1.2 Change in the emissions of non-CO2 GHG emissions .......................................... 38 CL1.3 GHG emissions resulting from project activities ................................................... 39 CL1.4 Demonstrate a positive net climate impact ............................................................ 39 CL1.5 Double Counting .................................................................................................... 40
CL2. Offsite Climate Impacts (Leakage) ..................................................................................... 40 CL2.1 Potential Sources of Leakage ................................................................................. 40 CL2.2 Leakage mitigation ................................................................................................ 40 CL2.3 Subtracting unmitigated leakage ............................................................................ 40 CL2.4 Non-CO2 leakage in excess of 5% ......................................................................... 40
CL3. Climate Impacts Monitoring ............................................................................................... 41 CL3.1 Initial Monitoring Plan........................................................................................... 41 CL3.2 Commit to developing a full monitoring plan ....................................................... 47
Community Section ......................................................................................................................... 48 CM1. Net Positive Community Impacts ...................................................................................... 48
CM1.1 Impacts on community ......................................................................................... 48 CM1.2 No High Conservation Values negatively affected .............................................. 49
CM2. Offsite Stakeholder Impacts .............................................................................................. 49 CM2.1 Identify potential negative offsite stakeholder impacts ........................................ 49 CM2.2 Mitigation of negative offsite stakeholder impacts .............................................. 49 CM2.3 No net negative impact ......................................................................................... 50
CM3. Community Impact Monitoring ......................................................................................... 50 CM3.1 Initial monitoring plan of community variable ..................................................... 50 CM3.2 Initial monitoring plan of HCV impacts ............................................................... 50 CM3.3 Develop a full monitoring plan ............................................................................. 50
Biodiversity Section ......................................................................................................................... 51 B1: Net Positive Biodiversity Impacts ......................................................................................... 51
B1.1 Changes in biodiversity as a result of the project..................................................... 51 B1.2 No HCVs be negatively affected by the project ....................................................... 52 B1.3 All species to be used by the project ........................................................................ 53 B1.4 Adverse effects of non-native species ...................................................................... 54 B1.5 No GMOs will be used for GhG removals ............................................................... 55
B2 Offsite Biodiversity Impacts .................................................................................................. 55 B2.1 Negative offsite biodiversity impacts ....................................................................... 55 B2.2 Mitigation of negative offsite biodiversity impacts ................................................. 55 B2.3 Justify the net positives biodiversity impact ............................................................ 55
B3 Biodiversity Impact Monitoring ............................................................................................. 55 B3.1 Initial plan for biodiversity monitoring .................................................................... 55 B3.2 Plan to assess effectiveness of measuring effect on HCV ....................................... 56 B3.3 Commit to developing a full monitoring plan .......................................................... 56

Page 4
Appendix 01 Project area locations overlain on 1990 Landsat image and corresponding
georeference file, "TIST IN PD-CCB-001b App01 LSat1990 Map.jpg" (image file)
and "TIST IN PD-CCB-001b App01 LSat1990 Map.jgw" (georeference file).
Appendix 02 Project area locations overlain on 2000 Landsat image and corresponding
georeference file, "TIST IN PD-CCB-001c App02 Lsat2000 Map.jpg" (image file)
and "TIST IN PD-CCB-001c App02 Lsat2000 Map.jgw" (georeference file).
Appendix 03 Project area boundaries in Google Earth KML file, "TIST IN PD-CCB-001d App03
PA Plots.kml"
Appendix 04 Excel spreadsheet of data with referenced worksheets, "TIST IN PD-CCB-001e
App04 Data 130208.xls"
Page 5
CCBA Project Implementation Report
for
TIST Program in India
CCB-001
Introduction
Clean Air Action Corporation submitted a Project Description (PD), for the TIST project in India,
for validation under the Climate, Community Biodiversity Standard (CCB). Because the PD was
written after the project had been in the operational for over 5 years, the following Project
Implementation Report (PIR) looks very similar to the PD. This report covers the period 1
January 2004 to 12 November 2012.
Project Overview
The International Small Group and Tree Planting Program (TIST) is a combined reforestation and
sustainable development project, in India, carried out by subsistence farmers. The farmers plant
trees on their land and retain ownership of the trees and their products. They receive training from
TIST and a share of the carbon revenues from CAAC.
TIST empowers Small Groups of 6-to-12 subsistence farmers in India, Kenya, Tanzania, and
Uganda to combat the devastating effects of deforestation, poverty and drought. Combining
sustainable development with carbon sequestration, TIST already supports the reforestation and
biodiversity efforts of over 64,000 subsistence farmers. Carbon credit sales generate participant
income and provide project funding to address agricultural, HIV/AIDS, nutritional and fuel
challenges. As TIST expands to more groups and more areas, it ensures more trees, more
biodiversity, more climate change benefit and more income for more people.
Replication of TIST in India began in 2002, with tree planting beginning in 2003, and has grown
to over 4,000 TIST participants in over 700 Small Groups. Because tree planting in the Project
Areas subject to this PD did not begin until 2004, this PD starts January 1, 2004.
TIST provides an administrative backbone that supplies training in building nurseries, tree
planting, conservation farming, building fuel-efficient stoves and malaria and HIV/AIDS
prevention. Part of the backbone is a two-way communications network that includes newsletters,
weekly meetings at the Small Group level, monthly meetings where groups of Small Groups
receive training, periodic seminars at the national level and an award winning monitoring system
based on hand-held computers and GPS. TIST is available to everyone and all are considered
equal. The rotating leadership and the Small Group rules empower women and the undereducated.
Those who are the most successful, regardless of education levels or gender, become mentors and
leaders.
This project description is for a subset of the TIST India program and corresponds to TIST VCS
project descriptions VCS-001. It applies to 452 Small Groups, 2,599 members, 924 project areas
and 671.8 ha.

Page 6
General Section
G1. Original Conditions in Project Area
G1.1 General Information: location of the project and basic physical parameters
TIST India is comprised of about 4,000 individual project areas that are owned or controlled by
the individual TIST members. The individual project areas of this PD are located in villages in the
five districts of Tamil Nadu State, namely Kancheepuram, Tiruvannamalai, Thiruvallur, Vellore
and Villupuram. The locations of the district are shown in Figure G1.1.
Figure G1.1:General area of TIST project 1
Soils: The predominant soil in the Kancheepuram, Tiruvannamalai, Vellore and Villupuram
Districts is red loam. In Kancheepuram District, black or “blackcotton” soil can be found
throughout, lateritic soils on the plateaus and alluvial soil along the coast. In Thiruvallur, 63% of
the soils are lateritic and 28% are red loam and black soils
Topography/Hydrology: The topography of Tamil Nadu generally consists of coastal plains in
the east, becoming uplands and hills to the west.1 The coastal plains, in which TIST India groves
are located, make up over half of the land area of Tamil Nadu. The Palar River is the main
watershed in the Kancheepuram and Vellore Districts. There are no perennial rivers in
Tiruvannamalai. The Araniyar, Kusasthalaiyar, Adyar and Cooum are the major water sheds in
Thiruvallur. The main river in Villupuram is the Varaganathi River.
Climate: The climate in southern India shows only slight seasonal variations. The climate of
Tamil Nadu is essentially tropical with high humidity throughout the year and an annual mean
temperature of about 29º C. The temperature in the height of summer (April and May) seldom
exceeds 43º C and in winter (January and February) rarely falls below 18º C. Tamil Nadu receives
1 http://moef.nic.in/soer/state/SoE%20report%20of%20Tamilnadu.pdf

Page 7
an average annual rainfall of 960 mm, most of which comes during the rainy season (October-
December). Frosts occur in the high hill regions of western Tamil Nadu, but have not been
recorded in the plains where TIST sites are located. The region receives a flood slightly less often
than once every ten years. Droughts also occur in the region about once every ten years. Tamil
Nadu also plays host to the occasional cyclone, however none have occurred in the past 30 years
in regions where TIST groves are located.
G1.2 General information: types and condition of vegetation within the project area
The project areas in all five districts are in the East Deccan dry-evergreen forests ecosystem. Due
to the high level of human activity, primarily for agriculture, little of the general area that
surrounds the project areas is in a natural state. The pre-project trees were counted and identified
and are listed by project area in worksheet "Baseline Strata." 2 The rest of the ground cover was
estimated as a percent of the total individual project area size. The stratification is present in
worksheet "Grove Summary."
G1.3 General information: boundaries of the project area and the project zone
There are 924 individual project areas in the associated Voluntary Carbon Standard (VCS) PD
and a total of over 1,400 TIST project areas currently in India. The boundaries of each have been
surveyed using a GPS and are presented four ways.
1) Appendix 01 is a Landsat 4/5 image of India showing the location of each individual
project area as a dot. This is to provide an overview of the project.
2) Appendix 02 is a Landsat 7 image of India showing the location of the individual project
areas as dot. This is to provide an overview of the project.
3) Appendix 03 is a KML file that displays the name, location and perimeter of each project
area on Google Earth.
4) Each project area (including perimeter and current tree strata) is displayed under its TIST
Small Group name on tist.org, a publicly accessible website).
Because of the dispersion and wide geographical area of TIST project areas, the Project Zone is
the area of southern India centered around Chennai.
G1.4 Climate Information: baseline carbon stocks
The baseline carbon stocks were estimated based on the approved Clean Development Mechanism
methodology AR-AMS0001, Version 06: Simplified baseline and monitoring methodologies for
small-scale A/R CDM project activities implemented on grasslands or croplands with limited
displacement of pre-project activities. Table G.1.4 shows the strata selected for the baseline
calculation, the hectares and percent of area of each stratum and the appropriate factors needed to
determine the baseline carbon stocks.
2 All worksheets are in Excel spreadsheet "TIST IN PD-CCB-001e App04 Data 130208.xls"

Page 8
Table G1.4
AG and BG Biomass t CO2e/ha
Baseline Strata Hectare Area Non-woody Trees Total
Cropland, annual crops 23.5 3.5% 18.3 0.9 19.2
Grassland as grassland 648.3 96.5% 16.0 0.9 16.8
Total 671.8 100.0% *AG = Above Ground, BG = Below Ground
Assumptions:
Hectares of cropland were based on field estimates made for each individual project area as
listed in worksheet "Grove Summary."
Annual cropland non-woody stocks = 5 t C/ha above and below ground (IPCC 2006GL,
Section 5.3.1.2) = 18.3 t CO2e/ha
Tropical dry grassland non-woody stocks = 8.7 t d.m./ha above and below ground (IPCC
2006GL, Table 6.4) = 16.0 t CO2e/ha
Woody biomass stocks represented by trees at a density of 2.2 stems per ha (1,499 trees
over 671.8 ha). The numbers of baseline trees were determined by a physical count of
each tree.3
Average DBH of pre-existing trees = 20.2 cm from inventory of pre-existing trees.4
Above ground tree biomass calculated applying equation for dry forest, where Kg dry mass
= exp(-1.996+2.32*ln(DBH cm)).5
Root:shoot ratio of 0.48.6
Carbon fraction of dry biomass = 0.5
G1.5 Community information: description of communities in project zone
Tamil Nadu is the seventh most populous state in the India, with a population of 72 million
people across 32 districts. The main language of the state is Tamil. Approximately 52 percent of
the state’s people live in the villages of rural areas.7 Communities are diverse in nature, with the
Vellalas community is mostly concentrated in the remote parts of the region, and Shanaars spread
throughout the region.
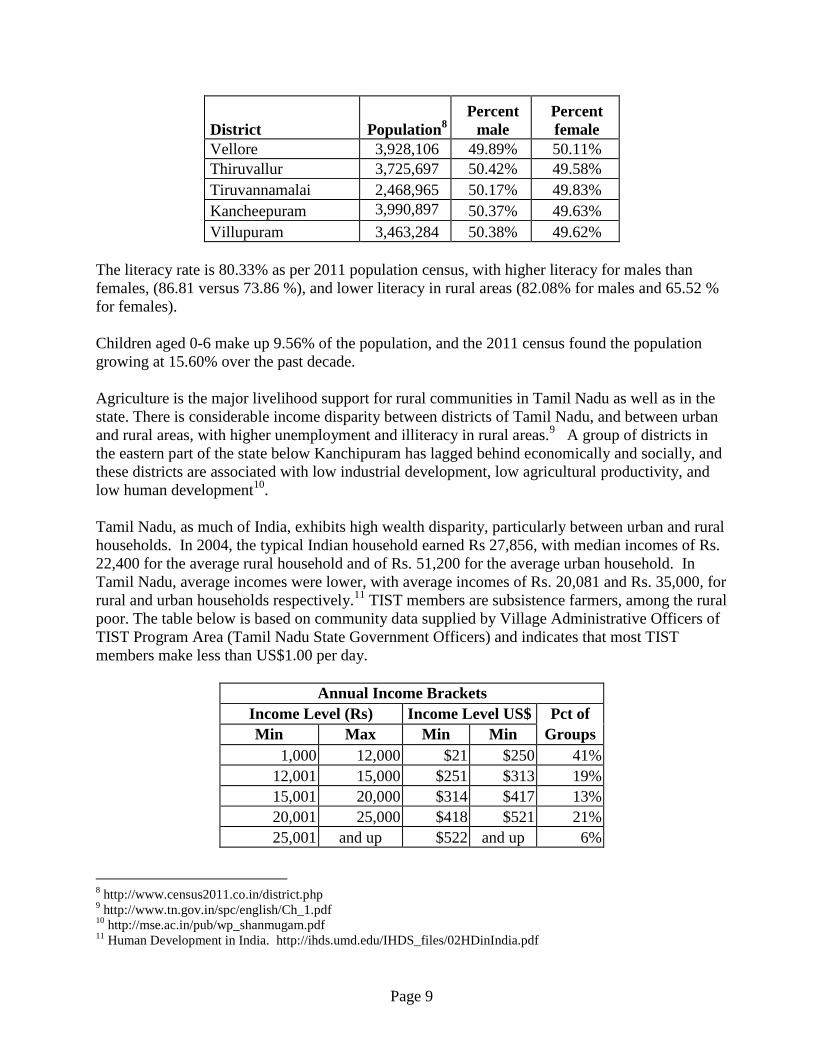
The 2011 census counted 36,158,871 males and 35,980,087 females in Tamil Nadu, with the
following counts in the five districts where TIST currently operates:
3 Appendix 04, "Baseline Strata" worksheet.
4 Ibid.
5 Brown, S. 1997. "Estimating biomass and biomass change of tropical forests: a primer." FAO Forestry Paper 134,
Rome, Italy. Section 3, "Methods for Estimating Biomass Density from Existing Data." Citing Brown et al. (1989).
Accessed 22 September 2010 at http://www.fao.org/docrep/W4095E/W4095E00.htm. Also See AR-AMS0001,
Appendix C 6 GPG-LULUCF, Annex 3A.1 Biomass Default Tables for Section 3.2 Forest Land, Table 3A.1.8,
Woodland/savannah 7 http://www.census2011.co.in/census/state/tamil+nadu.html
Page 9
District Population8
Percent
male
Percent
female
Vellore 3,928,106 49.89% 50.11%
Thiruvallur 3,725,697 50.42% 49.58%
Tiruvannamalai 2,468,965 50.17% 49.83%
Kancheepuram 3,990,897
50.37% 49.63%
Villupuram 3,463,284 50.38% 49.62%
The literacy rate is 80.33% as per 2011 population census, with higher literacy for males than
females, (86.81 versus 73.86 %), and lower literacy in rural areas (82.08% for males and 65.52 %
for females).
Children aged 0-6 make up 9.56% of the population, and the 2011 census found the population
growing at 15.60% over the past decade.
Agriculture is the major livelihood support for rural communities in Tamil Nadu as well as in the
state. There is considerable income disparity between districts of Tamil Nadu, and between urban
and rural areas, with higher unemployment and illiteracy in rural areas.9 A group of districts in
the eastern part of the state below Kanchipuram has lagged behind economically and socially, and
these districts are associated with low industrial development, low agricultural productivity, and
low human development10
.
Tamil Nadu, as much of India, exhibits high wealth disparity, particularly between urban and rural
households. In 2004, the typical Indian household earned Rs 27,856, with median incomes of Rs.
22,400 for the average rural household and of Rs. 51,200 for the average urban household. In
Tamil Nadu, average incomes were lower, with average incomes of Rs. 20,081 and Rs. 35,000, for
rural and urban households respectively.11
TIST members are subsistence farmers, among the rural
poor. The table below is based on community data supplied by Village Administrative Officers of
TIST Program Area (Tamil Nadu State Government Officers) and indicates that most TIST
members make less than US$1.00 per day.
Annual Income Brackets
Income Level (Rs) Income Level US$ Pct of
Min Max Min Min Groups
1,000 12,000 $21 $250 41%
12,001 15,000 $251 $313 19%
15,001 20,000 $314 $417 13%
20,001 25,000 $418 $521 21%
25,001 and up $522 and up 6%
8 http://www.census2011.co.in/district.php
9 http://www.tn.gov.in/spc/english/Ch_1.pdf
10 http://mse.ac.in/pub/wp_shanmugam.pdf
11 Human Development in India. http://ihds.umd.edu/IHDS_files/02HDinIndia.pdf

Page 10
The predominant ethno-linguistic group in Tamil Nadu is Tamil, with 89% of the population
native speakers. Other major groups include the Tellugu (5-6% of population), Kannada (1.7%),
and Malayam (0.6%), while many other groups represented in lower numbers also contribute to
the diversity in the region.12
There are no indigenous people. The cited people are part of the
national population.
G1.6 Community Information: current land use and property rights
The pre-project land use was agriculture. The current land use is tree planting and agriculture.
Land tenure is by registered deed to the individual members participating in TIST.
No land disputes have been identified. From initial monitoring, as part of the GhG contract
agreement, and in annual monitoring, Small Group members attest their ownership and right to
use the land where they plant trees. Additionally, TIST meetings and seminars are open to the
public. At no time has any land dispute been identified.
G1.7 Biodiversity Information: current biodiversity within the project zone
The information regarding the biodiversity within the project zone at the time the project began
was based on field observations and literature research.
Ecosystems: The project areas in all five districts are in the East Deccan dry-evergreen forests
ecosystem,13
a narrow strip of dry evergreen forest formation with Gondwanaland origins. The
average rainfall is 800 mm. Due to the high level of human activity, primarily for agriculture, little
of the general area that surrounds the project areas is in a natural state.
The original canopy-forming deciduous species, such as Albizzia amara and Chloroxylon spp.,
have succumbed to human pressures, so that existing vegetation type, when present, is low forest
of mostly small leathery-leaved evergreen trees with short trunks and spreading crowns. The
characteristic flora include Manilkara hexandra, Mimusops elengi, Diospyros ebernum, Strychnos
nux-vomica, Eugenia spp., Drypetes sepiaria, Flacourtia indica, and thorny species such as
Zyzyphus glabarrima, Dicrostachys cinerea, Randia dumetorum, and Carissa spinarum.
The ecoregion does not contain any endemic mammals or birds, but the sixty-six known mammal
species include two threatened species: the wild dog (Cuon alpinus) and sloth bear (Melursus
ursinus). Among birds of the region, Jerdon's courser (Rhinoptilus bitorquatus) is endangered, and
the spot-billed pelican (Pelecanus philippensis) and lesser florican (Eupodotis indica) are globally
threatened (IUCN 2000). Centuries of human impact have taken a heavy toll on the natural habitat
of this region, and more than 95 percent of the area is deforested. The remaining forests are
scattered small fragments.
12
http://www.censusindia.gov.in/Census_Data_2001/Census_Data_Online/Language/Statement3.htm 13
See TIST IN PD-VCS-Ex 39 WWF Ecoregion-East Deccan.pdf

Page 11
Major threats in the area include deforestation for farming and grazing, invasion by Prosopsis, a
thorny exotic plant, and poaching in the Satmala Hills, Pakla Wildlife Sanctuary, and Etunagaram.
G1.8 Biodiversity Information: High Conservation Values and attributes
Little biodiversity remains in the region because of hundreds of years of human pressure, but two
small, protected areas cover about 200 km2, about 1 percent of the ecoregion's area: Vettangudi
and Nelapattu Marakanam, a sacred grove near Pondicherry, is fairly well protected and
represents an important example of vegetation typical of the area and of High Conservation Value
as a sacred grove. Within the region encompassing the TIST project sites, protected areas include
two bird sanctuaries: the Pulicat Lake Bird Sanctuary, a saline backwater lake and wetlands that
are home to flamingos and endemic species including gilled leech and an unidentified bloodred
fish; and Vedanthankal Lake Bird Sanctuary, home to migratory birds including pintail, garganey,
grey wagtail, blue-winged teal, and common sandpiper. The area also is home to the Vandalur
Reserve Forest area, home to the Vandalur Zoo and restored forest planted with species typical of
dry evergreen system, and to Guindy National Park, a small, 2.82 km2 protected area of Albizia
amara Boiv. community (dry tropical evergreen forest) within the city of Chennai.14
The project areas in all five districts are in the East Deccan dry-evergreen forests ecosystem. Due
to the high level of human activity, primarily for agriculture, little of the general area that
surrounds the project areas is in a natural state.
Rare and Endangered Species: TIST activities are in areas where there is a long history of
human habitation and agriculture and consequently these lands have low biodiversity and the
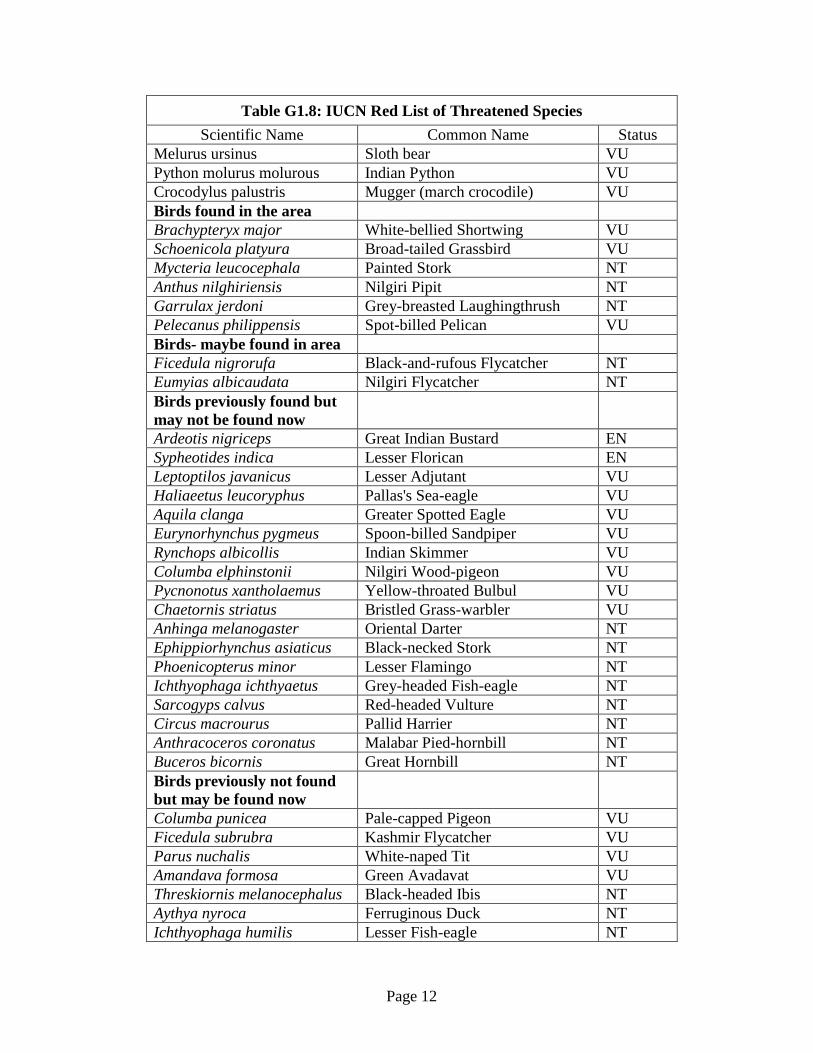
wildlife habitat is severely degraded. A list of threatened species that were potentially present in
the project areas was compiled through review of the literature and discussion with local experts.
Field observations by TIST staff, discussions with forest department officials and villagers
indicate the absence of any endangered or rare species in the project areas.
The IUCN Red List of Threatened Reptiles and a list of Threatened Mammals of India was
reviewed with the biologist of the Arignar Anna Zoological Park in Chennai for species that may
be present in the districts where TIST project areas are located (A. Manimoshi, personal
communication, 31 July 2008). A list of endangered plants in Tamil Nadu was also reviewed and
to determine which might be present in the districts where TIST project areas are located.
The following list was developed from this review:
Table G1.8: IUCN Red List of Threatened Species
Scientific Name Common Name Status
Mammals and Reptiles
Bos gaurus Gaur VU
Canis aureus Jackal VU
Panthera pardus Leopard TR
14
http://www.forests.tn.nic.in/WildBiodiversity/wildbiodiversity_home.html
Page 12
Table G1.8: IUCN Red List of Threatened Species
Scientific Name Common Name Status
Melurus ursinus Sloth bear VU
Python molurus molurous Indian Python VU
Crocodylus palustris Mugger (march crocodile) VU
Birds found in the area
Brachypteryx major White-bellied Shortwing VU
Schoenicola platyura Broad-tailed Grassbird VU
Mycteria leucocephala Painted Stork NT
Anthus nilghiriensis Nilgiri Pipit NT
Garrulax jerdoni Grey-breasted Laughingthrush NT
Pelecanus philippensis Spot-billed Pelican VU
Birds- maybe found in area
Ficedula nigrorufa Black-and-rufous Flycatcher NT
Eumyias albicaudata Nilgiri Flycatcher NT
Birds previously found but
may not be found now
Ardeotis nigriceps Great Indian Bustard EN
Sypheotides indica Lesser Florican EN
Leptoptilos javanicus Lesser Adjutant VU
Haliaeetus leucoryphus Pallas's Sea-eagle VU
Aquila clanga Greater Spotted Eagle VU
Eurynorhynchus pygmeus Spoon-billed Sandpiper VU
Rynchops albicollis Indian Skimmer VU
Columba elphinstonii Nilgiri Wood-pigeon VU
Pycnonotus xantholaemus Yellow-throated Bulbul VU
Chaetornis striatus Bristled Grass-warbler VU
Anhinga melanogaster Oriental Darter NT
Ephippiorhynchus asiaticus Black-necked Stork NT
Phoenicopterus minor Lesser Flamingo NT
Ichthyophaga ichthyaetus Grey-headed Fish-eagle NT
Sarcogyps calvus Red-headed Vulture NT
Circus macrourus Pallid Harrier NT
Anthracoceros coronatus Malabar Pied-hornbill NT
Buceros bicornis Great Hornbill NT
Birds previously not found
but may be found now
Columba punicea Pale-capped Pigeon VU
Ficedula subrubra Kashmir Flycatcher VU
Parus nuchalis White-naped Tit VU
Amandava formosa Green Avadavat VU
Threskiornis melanocephalus Black-headed Ibis NT
Aythya nyroca Ferruginous Duck NT
Ichthyophaga humilis Lesser Fish-eagle NT

Page 13
Table G1.8: IUCN Red List of Threatened Species
Scientific Name Common Name Status
Aegypius monachus Cinereous Vulture NT
Sterna acuticauda Black-bellied Tern NT
Plants NA
Hildegardia populifolia NA CR
Indigofera barberi NA Not
assessed
Lindsaea malabarica NA NT
Murdannia lanceolata NA VU
Neuracanthus neesiamus NA Not
assessed
Notes: EW = Extinct in wild
CR = Critical
EN = Endangered
VU = Vulnerable
CD = Conservation Dependent
NT = Near Threatened
DD = Data Deficient
N = Non-breeding visitor
G2. Baseline Projections
G2.1 Most likely scenario
The methodology requires justification that “the most likely baseline scenario of the small-scale
A/R CDM project activity is considered to be the land-use prior to the implementation of the
project activity, either grasslands or croplands.”15
The baseline field observations, as detailed in
the "Grove Summary" worksheet, indicated the project areas were grassland and cropland prior to
implementation of the project activity. That this is also the most likely use of the project areas,
without the project activity, is supported by:
The project areas are private lands owned by subsistence farmers conducting the project
activity. They have a history of farming and use of the land, other than natural forest or
long-term forestry.
These lands are located in an area populated by subsistence farmers, who use wood for
their primary fuel. As supported by the references below, wood use, agriculture and
increasing population have been key factors in deforestation.
These factors lead to the conclusion that there is little reason to believe that the project
areas will revert to forest without intervention.
There are no alternative uses of this land that can be reasonably expected.
15
AR-AMS0001, Section II.5.

Page 14
Literature Regarding Changes in Baseline Carbon Stocks. There is a clear pattern of rural
firewood use and forest degradation in India and Tamil Nadu that supports the case that carbon
stocks on each individual project area would be expected to decline or, at best, are increasing at a
rate of less than 10% compared to the expected removal by sinks. The lands of and surrounding
the project areas have been degrading for decades, due to human intervention.
Despite 20 years of programmatic efforts by the Indian and Tamil Nadu governments16
, forestry
today is in an extremely precarious position in the TIST areas.
Overall, fuel wood accounts for about 60% of the total fuel consumption in rural India.17
In
estimating fuel wood consumption, the Forest Survey of India showed only 17 million tonnes to
be available on a sustainable basis and 86 million tonnes were not.18
Rural fuel wood
consumption in Tamil Nadu was estimated at 172 kg/year.19
With a rural population of about 33
million, it equates to a demand of 5.7 million tonnes per year. An unpublished report of the
Commissioner of Statistics found that about 53% of the total fuel wood consumed in Tamil Nadu
was freely collected and 13.3% came from “own land.”20
These pressures have resulted in deforestation:
The Forest department is custodian of 22,870 square kilometers of forest land, which
constitute 17.584% of the geographic area, as against 33.33% required under National
Forest Policy, 1988.21
Nearly half of the forest area is subjected to heavy degradation on account of biotic
pressure.22
Heavy biotic pressure from abutting villages is the main cause of degradation of
forests.23
The forest wealth of the State is vulnerable to damage and destruction by elicit felling
of trees, ganja cultivation, fire, encroachment and poachers of wildlife.” 24
The areas where TIST operates are even more deforested. Most groups are in the
Kancheepuram District, where only 9.7% of the land is classified as forest.25
This
16
See Exhibit 02. 17
Devendra Pandey, “Fuelwood Studies in India, Myth and Reality,” Center for International Forestry Research
(2002): 37. See Exhibit 09. 18
Ibid, 18 19
Ibid, 47 20
Ibid, 83 21
See Exhibit 02. 22
http://www.tn.gov.in/policynotes/archives/policy2005-06/environment_forest.htm, Sections 2.1, 2.4.2, and 2.4.6,
Government of Tamil Nadu, Environment and Forests Department, Policy Note 2005 – 2006 Demand No. 14. See
Exhibit 10. 23
Ibid 24
Ibid
Page 15
extreme deforestation has an exacerbating impact on the water quality and quantity
available to all residents in areas already noted for a water deficit and wastewater
discharge into surface waters.
The Tamil Nadu Forest Department has identified “degradation on account of biotic
pressure” one of the pressures affecting the State.26
According to the Environmental Profile of the Thiruvallur District, “land, soil, water,
air, and the life support system like forests… are threatened by serious levels of
degradation.”27
The specific project areas are part of this environment. They are lands owned and used by the
rural residents and are subject to constant pressure to provide fuel wood, food and livelihood for
these subsistence-level farmers.
G2.2 Document how project benefits would not have occurred without project
Additionality of TIST is proven using the “Assessment of Additionality” contained in Appendix B
of Clean Development Mechanism Methodology AR-AMS0001, which demonstrates that the
project activity would not have occurred in the absence of the proposed project activity. The
barriers selected were "investment barrier" and "barriers due to social conditions, lack of
organization".
From the Project Participant’s perspective, TIST has numerous investment barriers. TIST does
not create or sell any products, other than GhG credits, associated with carbon sequestration. The
trees and their products are owned by the Small Groups. Any revenue generated by the tree
products belongs to the Small Groups. The TIST GhG “business” has been funded by Clean Air
Action Corporation (CAAC), as an investor, based solely on future GhG revenues. There is no
business, or business case, without carbon revenues. There is no payback or ROI, without carbon
revenues. But for the expectation of a carbon market and the expectation of the sale of GhG
credits from the project activity, CAAC would not have invested in TIST. Without carbon
revenues, TIST is not viable or sustainable.
From the Small Groups or member’s perspectives, there are barriers that have prevented
reforestation of these lands:
Investment barrier. Tree plantations require investment to obtain seedlings and, in the case of
TIST farmers, to take land out of current revenue production activities, such as cropland, for long-
term gain. Investment requires access to credit. However, due to their low income, the farmers
participating in TIST have little opportunity for investment loans or capital. Banks tend to be
25
Kanchipuram District Profile, http://www.kanchi.nic.in/district_profile_pro.html, downloaded 24 October, 2012.
See Exhibit 11. 26
http://www.environment.tn.nic.in/soe/images/ForestandWildlife.pdf, State of the Environment Report 2005,
Government of Tamil Nadu, Department of the Environment, downloaded 8 April, 2008, page 25. See Exhibit 12. 27
http://www.tnenvis.nic.in/DtProfiles/thiruvallur.pdf, Environmental Profile of Thiruvallur District, Government of
Tamil Nadu, Department of the Environment, 8 April, 2008. See Exhibit 13.

Page 16
reluctant to lend to those living at the subsistence level, because they have few assets for collateral
and little disposable income available for debt service. According to The International Fund for
Agricultural Development (IFAD), “more than one billion people – 90 percent of the world’s self-
employed poor – lack access to basic financial services, depriving them of the means to improve
their incomes, secure their existence, and cope with emergencies.”28
At a more local level, World Bank recognized the lack of credit available to the poor when they
set up the Tamil Nadu Empowerment and Poverty Reduction program.29
While the program has
made credit available to approximately 3 million impoverished women, there are another 9 million
people in the State that live on less than US$1.00 per day that have no access to credit.
TIST members are the people described above. They are subsistence farmers with little access to
the credit required for a plantation. Table G2.2.A is based on community data supplied by
Village Administrative Officers of TIST Program Area (Tamil Nadu State Government Officers)
and indicates that most TIST members make less than US$1.00 per day.
Table G2.2.A. Annual Income Brackets
Income Level (Rs) Income Level US$ Pct of
Min Max Min Min Groups
1,000 12,000 $21 $250 41%
12,001 15,000 $251 $313 19%
15,001 20,000 $314 $417 13%
20,001 25,000 $418 $521 21%
25,001 and up $522 and up 6%
While the trees can have a long-term financial benefit without the carbon component, day-to-day
household expenses prevent these farmers from spending their minuscule income on reforestation
projects. For example, seedlings cost Rs 0.20 to Rs 5.50 per seedling. Since each farmer is
expected to plant a minimum of 500 trees, the total up front cost is Rs 100 to Rs 2,750 per farmer
which can easily exceed 10% of their annual income.30
To compound the situation, the marginal
and small farmers that make up the TIST members typically make less money than they earn31
leaving no “additional” income for investment.
The following table provides an example of the initial costs, to the farmers, to start a plantation.
Without TIST, the farmer must buy the seedlings and incur labor costs. Without TIST, an
investment is required, but there is no credit available to fund it. TIST overcomes the investment
barrier two ways. First, it provides training that reduces the capital required to develop a tree
28
Accessed 22 September 2010 at http://www.ifad.org/media/press/2004/38.htm. 29
The World Bank, Project Appraisal Document on a Proposed Credit In the Amount of SDR 7.49 Million to the
Republic of India, for the Tamil Nadu Empowerment and Poverty Reduction “Puthu Vazhvu” Project, June 7, 2005,
pages 1 and 2. http://www-
wds.worldbank.org/external/default/WDSContentServer/WDSP/IB/2005/06/23/000090341_20050623101639/Render
ed/PDF/31806a.pdf. See Exhibit 15. 30
Additional information about the cost of tree planting to the members is provided in an attached spreadsheet, “TIST
IN PDD-CDM-01 Data 090531.xls, Plantation Cost.” 31
"A Special Program For Marginal and Small Farmers", National Commission for Enterprises in the Unorganised
Sector, New Delhi 2008, Table A8. See Exhibit 16.

Page 17
plantation. The training teaches TIST members how to obtain seeds and build nurseries at zero
cost, thereby, reducing the need for credit. Second, under the terms of the Project Participant’s
contracts with the TIST Small Groups, the farmers receive an annual advance on their potential
carbon revenues, which eliminates the need for credit.32
These payments are paid at least annually
based on the number of live trees counted each year. The payments are $0.033, per tree, per year,
and are initially of greater value than the value of the carbon. Ultimately, the Small Groups will
receive 70% of the net carbon revenues.
Table G2.2.B Start-up Cost Comparison: One ha Plantation33
Without TIST With TIST
Live Trees 500 500
Income $ - $ 17
Cost of a 500 Tree Plantation
Seedlings $ 30 $ -
Labor $ 29 $ -
Total Yearly Cost $ $
Income/(Loss) $ (59) $ 17
While financial projections can vary significantly based on cost and revenue assumptions,
advanced payment made to TIST farmers will exceed the net value of the carbon for the first 10
years of the project. In other words, TIST uses advanced payments farmers that are based on the
expectation of carbon revenues to overcome their inability to get credit.
Barriers due to social conditions, lack of organization. Planting large plantations requires more
than a single individual. The local communities lack the organizational structure to put together a
volunteer effort to plant trees. This statement is supported by the fact that both India and Tamil
Nadu have had a National Policy in effect since 1988 to address the problem of deforestation but
are still seeing annual losses in forest cover. (see Section 2.4). TIST and the Small Group
approach provide the organizational structure necessary to overcome this barrier. TIST provides
the training and the member’s Small Group provides the necessary manpower and support.
Laws and regulations requiring tree planting. The trees are planted on private lands and there
are no laws or regulations that require the TIST farmers to plant them.
Common Practice. There are cases in the area where farmers have planted fast rotation trees
without the carbon incentive. These farmers have no incentive to maintain the trees; indeed, their
incentive is to harvest them as soon as possible to get the revenue. In contrast, TIST is using the
annual tree payment to encourage and promote long-term, managed tree stands. The TIST GhG
Agreement requires the members to “plant a minimum of 1,000 trees and raise them to maturity”,
“replant trees that die, for any reason, each year for the next" 20;34
and to “not cut down trees,
except when implementing best practices for agroforestry developed by TIST.” This is only
possible because of the potential carbon revenues.
32
See Exhibits 03. 33
See Appendix 04, “Plantation Costs” worksheet for assumptions and references. 34
The contract in Exhibit 03 is for 50 years.

Page 18
Conclusion. The extension activities implemented by TIST that allow the project participants to
overcome these barriers, and the incentive payments TIST provides that support their decision to
participate, are entirely dependent on the carbon market. These kinds of activities are not possible,
without external financing of some kind. TIST’s operational budget for the project is funded
through an investment from CAAC, which is contingent on returns of future GhG revenues.
Without carbon revenues, on which its funding solely depends, the TIST project is neither viable,
nor sustainable.
G2.3 Calculate carbon stock changes without project
The methodology used to calculate the changes in carbon stock is based on CDM small scale
afforestation reforestation methodology AR-AMS0001 Version 06: Simplified baseline and
monitoring methodologies for small-scale A/R CDM project activities implemented on grasslands
or croplands with limited displacement of pre-project activities. As described in section G2.1, the
most likely scenario for the project lands is to continue as agricultural land, subject to ongoing
intervention through human habitation. As described in Section G2.2 (Forest Policies), the project
zone is undergoing a decrease in forest cover and therefore carbon stocks.
The conservative case for the change in baseline carbon stocks, without the project, is that the
biomass and carbon in the cropland and grassland remain constant, and that the baseline trees
continue to grow, unmolested and unaffected by actuarial mortality. Making reference to the
worksheet "Baseline Strata," the baseline tree count is obtained and the mean diameter is
calculated. Dividing the baseline tree count, by the total project area, yields a baseline tree density
for the project. When the average diameter of the baseline trees are grown at 0.5 cm per year and
the biomass is calculated using the proper allometric equation, the tonnes of CO2 per hectare can
be calculated (see Baseline Tree worksheet). When calculated for the entire project, the
conservative change in carbon stocks without the project is estimated to be 1,481.1 tons (see
worksheet "Baseline Growth").
There are no non-CO2 emissions. The project does not use chemical fertilizers and the project
does not own any vehicles or power equipment.
G2.4 Effect on communities without project
Without the project, thousands of subsistence farmers in the project zone would not be
participating in the sustainable development, reforestation and health training of TIST. The
communities would not receive the added income that has been paid to the TIST farmers as a
carbon stipend and they would not receive the 70% of the project profits, once the carbon
sequestered in the trees is enough to sustain the project. This added income would not be
available to help pay for primary education uniforms, secondary education, metal roofs and other
necessities. The farmers would not have planted the over two million trees already documented by
the project. They would not have built nurseries and grown millions of seedlings. They would not
have begun to grow their own sustainable on-farm fuel supplies. They would not have started
using FAO conservation farming practices, which have been documented to increase crop yields
two to ten times. They would not have received training in using more fuel-efficient cooking

Page 19
stoves, or received training on the effects of indoor cooking smoke. They would not have received
training on HIV/AIDS, malaria, hygiene, clean drinking water and nutrition. They would not have
had the opportunity for developing leadership skills and become Small Groups leaders regardless
of gender, religion, education or general background.
Likely changes in water, soil and other locally important ecosystems, without the project, are a
continued decline. Illegal harvesting of wood and charcoal in protected areas continues, supported
directly or indirectly by the people who live in the project zone, because of their need for cooking
fuel. The cutting of these trees leads to loss of soil stability and erosion. It also leads to a loss of
water retention. The result is higher sediment load in the critical water supplies, loss of soil, due
to erosion and decrease in year-round water, as run-off increases with each rainfall and less water
is absorbed in the soil. Continued deforestation leads to loss of habitat and biodiversity. The
project addresses each of these and helps reverse or mitigate them.
G2.5 Effect on biodiversity without project
Biodiversity in India has been declining for decades. Despite 20 years of programmatic efforts by
the Indian and Tamil Nadu governments, forestry today is in an extremely precarious position in
the TIST areas (see G2.2). The increasing population continues to put more pressure on existing
biodiversity, the project zone and what little is left in the project areas. Without TIST, there would
be 671.8 fewer trees on sustainable woodlots that reduce the pressure on protected high
biodiversity areas. There would be fewer indigenous trees. Although the threatened species in the
project zone are long gone from the project areas, the indigenous trees and additional forest cover
will have a positive effect on them, by improving connectivity and corridors among the protected
areas.
G3. Project Design and Goals
G3.1 Summary of climate, community and biodiversity objectives
The objectives of TIST are to:
increase biomass and carbon sequestered in project areas,
provide a sustainable fuel wood supply for the members,
provide a new source of revenue to the members from the sale of carbon credits,
provide training in important social and health related subjects, and
improve the biodiversity of the area by adding canopy and indigenous trees.
G3.2 Description of project activities
The project activities are:
Nursery training and development. Farmers are trained on species selections and their
benefits, on how to gather and prepare seeds, how to build and maintain nurseries. Special
attention is called to the benefits of indigenous trees and trees that provide food and other

Page 20
regularly available products. This is to help reduce the cost of entry to farmers. Where
nurseries are highly successful, farmers can sell their excess for additional revenue. This is
the first step in tree planting for climate change and revenue enhancement.
Tree planting. Farmers are trained to plant seedlings using the FAO conservation farming
techniques. The trees will sequester carbon as they grow and address climate change.
Increased canopy, new woodlots and new indigenous trees help biodiversity. The carbon
revenues and tree stipends paid to the members provide a new source of revenue.
Selective use of tree products. The farmers own the trees and their products, such as nuts
and fruits. They are permitted to use any deadwood. Use of trimming and thinning is
permitted, as long as it is sustainable. All of these enhance income and some improve food
security.
Provide training social and health training. TIST conducts training seminars, trains
directly in the field, and at Small Group meetings. They also use a newsletter for training
and disseminating best practices. Besides subjects related to tree planting, training
includes improved farming practices, malaria, HIV/AIDS, water quality, benefits of trees,
erosion control, water quality, leadership skills, climate change and any other subject of
interest to the members.
G3.3 Maps of project location and zone
The thousands of individual project areas are presented as follows:
Appendix 01. This is a Landsat 4/5 image of the project zone, with dots depicting the
location of each discrete project area.
Appendix 02. This is a Landsat 7 image of the project zone, with dots depicting the
location of each discrete project area.
Appendix 03. This is a KML file for use in Google Earth that has the GPS track of each
project area. Although the native format is for Google Earth, it is a GIS file that can be
imported into other GIS programs.
G3.4 Project Lifetime
The starting date of the A/R activity and the crediting period began 1 January, 2004. The project
is scheduled to last 30 years but may be extended if the carbon market is vibrant enough to support
it.
Justification: TIST, as a project, began with training, in late 1999, and tree planting, per se,
began in Tanzania in 2000. The project began in India in 2002. Tree planting for this PD began
in 2004.
Justification: TIST maintains a database record of each project area showing when it was first
quantified by a TIST staff member and how old the trees were. These records appear at
www.tist.org under “Project Areas” and under each region, group center, and Small Group where
audits have taken place. The data collected by TIST indicates that the first trees planted by Small
Groups, in project areas subject to this PD, were planted in 2004. See "Grove Summary" and
"Strata" worksheets for age of trees.

Page 21
Implementation Schedule:
2002 Initial field visit, consultation with local stakeholders, hold initial seminars, registration of
initial Small Group members, deploy monitoring system, hire local staff, hire and train
Quantifiers, begin training trainers.
2004-2011 Planting of first trees. Project expansion focused on adding new groups, members and
trees. Continue with regular monitoring and training. Hold regular seminars. Ongoing and
regular consultation with stakeholders.
2012 VCS and CCB validation and first verification.
2013-2035 Periodic verifications to be held in accordance with the minimums required by the
CCB and VCS standards. Project expansion focused on adding new groups, members and
trees. Continue with regular monitoring and training. Hold regular seminars. Ongoing and
regular consultation with stakeholders.
The following Gantt charts show the timing of annual events for the project. The numbers along
the top of each chart are years. Where "project" is indicated in the title, it is for the 30-year project
life. Where "project area" is indicated, it is for events that might take place within a project area
and the year one may be an event, rather than the beginning project date. With all the different
project areas, species, farmers and planting schedules, these charts are very general and subject to
change.
Main planting schedule (project). Main planting has taken place, but additional planting may
take place in individual project areas, over the next few years, where the original planting density
is low.
1 2 3 4 5 6 7 8 9 10 11 12 13 14 15 16 17 18 19 20 21 22 23 24 25 26 27 28 29 30
Replacement planting schedule (project). As trees die, farmers are to replant for 20 years.
Replanting can start as soon as the second year. Replanting is shown for 25 years because of the
staggered start of individual project areas.
1 2 3 4 5 6 7 8 9 10 11 12 13 14 15 16 17 18 19 20 21 22 23 24 25 26 27 28 29 30
Monitoring (project). Monitoring is ongoing. The internal goal is to quantify each grove
annually. Whether that is achieved or not, the Quantifiers are out in the field, all the time, visiting
the multitude of project areas.
1 2 3 4 5 6 7 8 9 10 11 12 13 14 15 16 17 18 19 20 21 22 23 24 25 26 27 28 29 30
Validation and verification (project). Validation takes place around year six, when project areas
have been established and trees are already in the ground and growing. It is expected that the

Page 22
initial verification will take place at the same time. While it is a cost trade off, because the
monitoring is ongoing, it is possible that verification could take place as frequently as annually.
1 2 3 4 5 6 7 8 9 10 11 12 13 14 15 16 17 18 19 20 21 22 23 24 25 26 27 28 29 30
Thinning (project area). Thinning is allowed, because it improves tree growth. Because of the
different species and their different growth rates, the different planting schedules, the different
original spacing and different farmers, thinning can begin in as early as four years, where an early
harvest for poles or firewood is made.
1 2 3 4 5 6 7 8 9 10 11 12 13 14 15 16 17 18 19 20 21 22 23 24 25 26 27 28 29 30
Fruit and nut harvest (project area). Most of the trees won't bear any fruits, nuts or other
products for five or six years. After that, harvest will be annual.
1 2 3 4 5 6 7 8 9 10 11 12 13 14 15 16 17 18 19 20 21 22 23 24 25 26 27 28 29 30
Deadwood harvest (project areas). Farmers may harvest deadwood any time it exists. For those
that lose trees in the first year, it will come in year one. However, it is expected that most
deadwood harvest will take place in later years as larger trees are lost, or branches die.
1 2 3 4 5 6 7 8 9 10 11 12 13 14 15 16 17 18 19 20 21 22 23 24 25 26 27 28 29 30
G3.5 Natural and human-induced risks
The long-term sustainability of TIST is dependent upon a carbon market for
afforestation/reforestation credits. As of the date of this PD, the market for CDM-based AR
credits is essentially nonexistent. AR credits have been locked out of the largest trading system
(i.e. the EUETS) and buyers have no practical use for the currency (i.e. tCERs). The market for
VCS credits exists but, by definition, is dependent upon the entities buying credits to voluntarily
offset their carbon emissions. An expected US market may or may not materialize and, if it does,
may or may not allow AR credits from outside the Americas.
TIST is different than most AR projects, in that it was created for small-scale subsistence farmers.
Because of the rules of CDM, many of the farmers in this PD have project areas too small to meet
the Host Country definition of a forest. Should VCS, or a possible US program, put the same
limitation on size, many of the farmers in TIST will no longer be eligible to participate in the
carbon market and will lose the financial incentive to participate in the program. TIST has
mitigated this risk by achieving what it has, at the lowest costs possible. Rather than using
expensive Western experts, it has deployed a sophisticated, yet easy to use, monitoring system and
relies on capacity building with the Small Group members and their desire to improve their lives.
Another risk is that farmers will drop out of the program. This is mitigated by the fact that there
are thousands of individuals involved already and TIST continues to grow. Having a few farmers
quit will not have a significant effect on the project.

Page 23
Natural risks include drought, pestilence and fire. These, however, are mitigated by the fact there
are thousands of individual project areas spread over thousands of square kilometers. We provide
training on minimizing risks from fires in newsletter and in training broadcasts on area radio
programming.
G3.6 Maintenance of the high conservation value attributes
Ongoing deforestation in India is a fact. The project areas have been settled for generations and
little, if any, of the natural biodiversity exists. The continued need for wood and the expanding
population has carried the deforestation into the protected forest, having a negative effect on
biodiversity there, too. TIST is reversing this trend by planting millions of new trees, many of
them indigenous. While some parties have raised barriers to prevent AR credits from participating
in a global carbon market, TIST has recognized that nearly 20% of deforestation is a result of the
need for wood for cooking and heating. This type of program is the only way to provide the
resources needed by this vast population of subsistence farmers, as well as make a positive impact
on biodiversity.
TIST trees are planted on the lands of small hold farmers, so the maintenance of HCV areas in the
region, described in section G.1.8, is indirect. The proximity of the Project Areas to the natural
forests will reduce illegal wood harvesting. The addition of indigenous trees, tree cover and fruit
trees enhance biodiversity by providing an expanded range for some of the animals that rely on the
HCV area. TIST trees have been being planted where deforestation has taken place and the
addition of many discrete project areas helps improve the wild life corridors between HCV areas
needed for healthy animal populations.
G3.7 Measures to maintain benefits beyond the project lifetime
TIST is a comprehensive program that includes training in climate change and biodiversity. The
following describes some of the training and their benefits.
Training in the benefits of specific tree species results in more trees selected that have a
value other than as harvested wood or for carbon revenue. Example: mango trees for their
fruits.
Training in the maintenance of a sustainable woodlot. Wood and charcoal are some of the
greatest expenses for subsistence farmers. Learning the value and convenience of a
sustainable woodlot will ensure that it is maintained beyond the life of the project.
Training in the benefits of biodiversity helps the farmers make the choice to keep trees,
rather than cut them down. The benefits include more productive soil, return of edible
indigenous plants, enhanced area ecotourism, and return of native wildlife that is useful to
them personally (e.g. bees).
G3.8 Communities and other stakeholders
Membership in TIST is completely voluntarily. The actions that members take are on their own
land. They maintain ownership of the land, the trees planted for sequestration and all the products
that the trees yield. TIST exists for the local farmers and only grows if the local farmers support
Page 24
it. The rapid growth of TIST is a reflection of the positive reaction that the farmers and other
stakeholders have had about TIST.
When TIST begins in an area, they contact community leaders, village heads/village leaders, local
NGOs and local government officials to determine if there is an interest in the program. If there is
an interest, TIST holds a public seminar to present the program, answer questions, address
concerns and receive comments. Regular and on-going meetings the public is invited to attend
follow this. TIST representatives have met with numerous State, District and Village officials
seeking comments and showing them the project. Since TIST is organic in its growth, this process
continues as it expands to new villages. In addition to the meetings, information about TIST is
disseminated by word of mouth; using “Chezhimai,” a bilingual (Tamil and English) newsletter
published by TIST India and direct contact with community leaders and government officials.
The original TIST program was started in Tanzania, in late 1999, to meet local needs in a
sustainable way, while at the same time addressing climate change. On 31 May, 2002, India
became the second country to introduce TIST. On 22 June and 23 June of that year, a seminar was
conducted in Vedal where local citizens were invited to learn about TIST, ask questions and make
comments. Those interested in joining TIST were invited to join. The seminar was documented
in the January 2003 “Chezhimai” newsletter.
As a result of the initial expression of interest and support from the community and farmers, TIST
reached out through word of mouth and direct contact to two more villages, Jambodai and
Andiseruvallur. As also documented in the January 2003 “Chezhimai,” this resulted in favourable
comments from villagers, agricultural officers, the postmaster of Vedal, Panchayat Head of Vedal
and other private citizens.
Since January 2003, TIST India has published 54 newsletters that document an ongoing dialogue
and support with members of the community, both inside and outside the program. These
documents are available to the public in a transparent form on the internet at tist.org.
At the Small Group level, member farmers meet with TIST representatives regularly where they
have an opportunity to ask more questions and make more comments. Since one of TIST’s main
focuses is adopting best practices, these are forums to review what is working about the program
and how it can be improved. Changes to the program are announced in the “Chezhimai.”
The result of this stakeholder process has led to numerous invitations for TIST to come to new
villages and numerous positive comments about TIST. The following section will summarise
written comments.
TIST has not received any negative comments.
Stakeholder comments have been received from:
1. Numerous Small Groups participants.

Page 25
2. Eight members of the Tamil Nadu Forest Department including the Principle Chief
Conservator, Conservator (Vellore District) & Deputy Conservator (Tiruvannamalai
District) and the District Forest Officer of Thiruvallur.
3. Nineteen Village Administrative Officers from villages in Kancheepuram, Tiruvannamalai,
and Thiruvallur.
4. Forty-six Village Panchayat Heads (village council).
5. Eighteen Women’s organisations.
6. Two Men’s Groups.
7. Six other organizations.
Specifically, letters from the following people have been received and are available from TIST:
Letter issued by Panchayat / Village District
Village Panchayat Head Semboondy Kanchipuram
Village Panchayat Head L Endathur Kanchipuram
Village Panchayat Head Achirapakkam Kanchipuram
Village Panchayat Head Kadambur Kanchipuram
Village Panchayat Head Keeranallur Kanchipuram
Councilor Pallipattu Thiruvallur
Village Panchayat Head Samanthavada Thiruvallur
Village Panchayat Head Nedungal Thiruvallur
Village Panchayat Head Pettai Kandigai Thiruvallur
Village Panchayat Head Placepalayam Thiruvallur
Village Panchayat Head Timmabubalapuram Thiruvallur
Village Panchayat Head Poondi Thiruvallur
Village Panchayat Head Katchur Thiruvallur
Village Panchayat Head Ambakkam Thiruvallur
Village Panchayat Head Gunipalayam Thiruvallur
Village Panchayat Head Allikuzhi Thiruvallur
Village Panchayat Head Perunchery Thiruvallur
Village Panchayat Head Vellathukottai Thiruvallur
Village Panchayat Head Keelnarma Tiruvannamallai
Village Panchayat Head Narmapallam Tiruvannamallai
Village Panchayat Head Sengaadu Tiruvannamallai
Village Panchayat Head Ilangadu Tiruvannamallai
Village Panchayat Head Pazhanchur Tiruvannamallai
Village Panchayat Head Esakolathur Tiruvannamallai
Village Panchayat Head Kolipuliyur Tiruvannamallai
Village Panchayat Head Mangalam Tiruvannamallai
Village Panchayat Head Thurinjapuram Tiruvannamallai
Village Panchayat Head Velungnanthal Tiruvannamallai
Village Panchayat Head Kadambai Tiruvannamallai
Village Panchayat Head Karippur Tiruvannamallai
Village Panchayat Head Ragunathasamuthiram Tiruvannamallai

Page 26
Village Panchayat Head Nadukuppam Tiruvannamallai
Village Panchayat Head Mel Kodungalur Tiruvannamallai
Village Panchayat Head Ulundhai Tiruvannamallai
Village Panchayat Head Marudadu Tiruvannamallai
Village Panchayat Head Badhur Tiruvannamallai
Village Panchayat Head Punnai Tiruvannamallai
Village Panchayat Head Kallankuthu Tiruvannamallai
Village Panchayat Head Vazhur Tiruvannamallai
Village Panchayat Head Kil Kodungalur Tiruvannamallai
Village Panchayat Head Irumbedu Tiruvannamallai
Village Panchayat Head Ariyathur Tiruvannamallai
Village Panchayat Head Vizhudhupattu Tiruvannamallai
Village Panchayat Head Koyilkuppam Tiruvannamallai
Invitation letter from the Principal Chief Conservator of Forests, Tamilnadu
District Forest Officer, Thiruvallur, Thiruvallur District
Forester, Allikuli, Thiruvallur District
Forest Range Officer, Thiruvallur Range, Thiruvallur District
Forest Range Officer, Forest Station, Thiruvallur District
Forest Range Officer, TAP Range, Thiruvallur District
Letter issued by Organisation
Head Placepalayam Village Roja Womens Organization
President Inner Wheel Club of Adyar (Rotary Club)
Branch Manager Indian Overseas Bank, L Endathur
Summary Forest Department Comments
TIST has wide knowledge and experience in the area of tree planting. This will help the
objectives of Tamil Nadu Forest Department outside the state forests.
TIST members have planted species like Mango, Jack, Teak, Lemon, Cashew, Red
sanders, Rose Wood, Teak, etc. in their own land dry lands. These trees are maintained
well.
TIST is forming Small Groups and enabling them to generate additional revenue.
TIST program is useful for the environment.
We participated in TIST meetings and explained Forest Department tree planting plans to
TIST members.
TIST India is helping Tamilnadu Forest Department in “Tree Culture (Cultivation) in
Private Land” project
We wish all the best for TIST program and would like this program to spread all over
Tamil Nadu – congratulations.
Summary of Village Administrative Officers Comments

Page 27
TIST has formed several Small Groups in our village area.
TIST is encouraging the villagers (TIST members) to plant trees in those lands where
agricultural activities are not possible due to less rain fall/no water.
TIST program is healing the ecology.
Our village is looking good because of TIST.
Our area villagers have a lot of wastelands. We feel that if tree-planting activities are
carried out in these wastelands, it will be very useful for the villagers. Since these
villagers are very poor, the revenue from TIST tree planting activity would be helpful.
The socio-economic situation of the region will improve due to TIST program.
We hope that this program grows more and more.
Villagers are getting good revenue in this program.
This program helps in sustainable development.
We request that the Indian Government help TIST to spread and grow.
Summary on Village Panchayat Head Comments
TIST has formed several Small Groups in our village area.
TIST is encouraging the villagers (TIST members) to plant trees in those lands where
agricultural activities are not possible due to less rainfall.
Due to TIST program, our village is turning green.
This program will reduce global warming.
TIST helps achieve local forestry goals.
TIST is making payments to the Small Groups for their trees.
Poor and rich are treated equally in this program.
Our blessing and thanks to their encouraging tree planting activity.
Summary on TIST Small Groups Comments
We have joined TIST as Small Groups and are planting trees in the program.
Our land was kept idle for more than 10 years. Now after joining TIST, we see vegetation
in our land.
We are planting trees in our own land where we are not able to do agriculture due to less
rain fall / no water.
We are following the best practices of TIST. We have planted trees like, teak, eucalyptus,
mango, and guava.
We are improving our environment in this program.
TIST is helping to improve the socio-economic situation in our area.
We are getting income from trees and our economy is growing.
We have planted long-standing trees; moreover, TIST will be with us for decades.
TIST pays regular incentive once in three months, which is beneficial to us.
Government should give necessary approval to TIST to expand more.
Poor people have and will benefit from TIST.
Other Stakeholders Comments

Page 28
Several hundred families have voluntarily joined in TIST program.
We see a large number of enthusiastic, well-informed women members in TIST program
who were being encouraged.
The members are maintaining the trees well.
TIST program is very useful to the small farmers and villagers.
We have distributed free seedlings to TIST members. We will contribute more in the
coming years.
Women’s Association / Women Self Help Group Comments
By planting trees, the farmer’s socio-economic situation is improving.
The trees are helping the environment. More trees should be planted in all barren lands.
Women and men work together in this tree planting activity.
We believe this will help improve personal financial needs.
TIST provides financial, agricultural and social benefits.
If we get free seedlings, it will be of great help for small villagers.
We receive voucher payments from TIST program.
Mango, Team, Gooseberry trees have been planted by TIST members.
We have participated in several TIST node meetings. This program is of great help to
villagers.
Non Governmental Organization Comments
Villagers who are not able to do agriculture due to low rainfall are organised in Small
Groups and are encouraged to participate in tree planting activities.
Groups have planted longstanding trees like, mango, jack, teak, sandalwood, team, and
guava in this program.
TIST is making stipend payment for the trees every three months and encouraging the
groups.
Members of our women’s self help group joined in TIST program and benefited.
Our agriculture experts are helping by giving good ideas for TIST program.
TIST is taking good suggestions and advice from other social service organisation.
We wish the TIST program would spread throughout Tamil Nadu
Some examples of specific comments are:
The President of Vedal Panchayat, V. S. Sagalagunam, wrote an article for TIST’s
Chezhumai newsletter sent to Small Groups. The article entitled “Your Panchayat Head
Supports TIST” included the following:35
35
http://www.tist.org/moreinfo.php, p. 1, Chezhumai newsletter - February 2003 Issue, Documents to Download, “9.
Newsletters Published in India,” TIST India.

Page 29
“For growing and maintaining these trees, TIST provides incentives to the members of the
Small Groups. I strongly encourage the public of Vedal Panchayat to avail from this
wonderful opportunity of cultivating these trees to beautify our area and also obtain the
incentives provided by TIST for your economic benefit. As your Panchayat leader, I
humbly request everyone to join and support the TIST program in our area…”
Support from Mr. Narayanan, Postmaster of the Vedal Post Office, was also carried in the
same issue:36
“This program is helping the people who live below the poverty line by providing Small
Groups that plant and maintain trees with cash incentives. Small Groups are also opening
savings accounts in our post office through which they will receive payments for their
plantings from TIST. I encourage all Small Groups to approach me at the post office to
open their savings accounts…”
The Assistant Agricultural officer, Elumalai Arumugam, also provided information and
encouragement to the TIST Small Group program members:37
“TIST brings to our deforested and drought prone area an opportunity and potential to
bring about tremendous benefits and development through reforestation, conservation
farming, community education, new technology and most importantly bringing people
together by working in Small Groups for a common goal. I request you all to join and
support TIST and plant lots of trees to improve our land cover and bring rains back to this
once fertile and prosperous part of Tamil Nadu.”
The Deputy Conservator of Forest, Tiruvannamalai District has mentioned through TIST
Chezhumai July 2008 that “The Major activity of TIST India is same as Forest
Department, to increase the green cover and to benefit the villagers with additional
revenue, and ultimately increase the carbon sequestering:38
Written comments are maintained by TIST India and are available for review.
There have been no negative comments received suggesting that TIST should not exist. Based on
the comments and responses above, no changes were necessary for the project.
G3.9 Publicizing the CCBA public comment period
Public comments for CCBA were solicited two ways. A public hearing was held in
Tiruvannamalai District, Tamil Nadu, India. Second, a series of emails were sent to stakeholders.
Public Meeting
36
Ibid., p. 3. 37
http://www.tist.org/moreinfo.php, p. 4, Chezhumai newsletter – September 2003 Issue, Documents to Download,
“9. Newsletters Published in India,” TIST India. 38
http://www.tist.org/moreinfo.php, p. 4, Chezhumai newsletter – September 2003 Issue, Documents to Download,
“9. Newsletters Published in India,” TIST India.
Page 30
The Public Meeting was held between 11:00 AM and 12:00 AM on 28 December, 2012 at the Sri
Lakshmi Balaji Marriage Hall, No 2/1, Bharathiyar Street, Pazhampettai, Chetpet, Polur Taluk,
Tiruvannamalai District, Tamil Nadu 606801. Notice was given in a leading Tamil Nadu papers
as follows:
Dinakaran Daily News Papers in Chennai, Tiruvallur, Vellore, Tiruvannamalai,
Villupuram, Kanchipiuram on 27th December 2012.
An email announcement was sent to 28 stakeholders on 4 January 2013.
Specifics regarding the announcements, public meeting, emails and email recipients are in support
document "TIST IN PD-VCS-Ex 29a Public Comments CCB-001.doc." There were no negative
comments.
G3.10 Handling unresolved conflicts and grievances
TIST has already gone through this process and there were no grievances, or conflicts. This is
because the program is voluntary, participants use their own land and it is considered
environmentally and socially beneficial.
All grievances will first be brought to the attention of the India Staff, where the issues will be
compared to standard TIST policy, TIST values39
and/or the Greenhouse Gas agreement among
the Small Group members and CAAC. The policies and values are the subject of training at
seminars, in the field and are published in the newsletter. Unresolved issues will be presented to
TIST Management. Where precedence or policy exists, they will be used in final decision-
making. Where new issues arise that are outside the existing precedence, or policy, decisions will
be made by India Staff and TIST Management. If these cannot be resolved within TIST, a
qualified mediator, such as Mr. Sriram Panchu of the Indian Centre for Mediation and Dispute
Resolution40
, will serve as a third-party mediator.
G3.11 Project Financial Support
TIST began, in late 1999, on the expectation that once the trees were large enough, the project
would be self-funding. A series of financial projections were developed that showed that after six
to ten years (depending on different financial cases regarding market price, growth rate, tree
mortality, etc.) the project would be sustainable based solely on carbon revenues. The key to
success was very low costs. TIST has designed the program to minimize cost, developing an
award winning monitoring system, building Host Country capacity and relying on voluntary
effort. Still, there is a cash shortfall in the early years of the project. This is made up by external
sources. CAAC has provided funding to make up this shortfall on the carbon side, through its own
39
TIST Values: We are Honest. We are Accurate. We are Mutually Accountable. We are Transparent. We are
Servants to each other. 40
http://www.gettingthedealthrough.com/organisations/21570/indian-centre-mediation-dispute-resolution/
Page 31
profits and advanced sales of credits. The fact that TIST is in its 13th year demonstrates its
longevity.
TIST’s financial plan and projections demonstrating financial support are available (confidential)
as Supporting Exhibit 07.41
G4. Management Capacity and Best Practices
G4.1 Project Proponent
The project proponent is Clean Air Action Corporation (CAAC). The role of CAAC and other
parties involved with TIST are summarized:
Clean Air Action Corporation (CAAC) is a for-profit US corporation that manages the
GhG component of TIST. CAAC is TIST’s largest contributor, provides technical
assistance and uses its host country subsidiaries to manage operations.
TIST Tree Planting India Private Limited (TIST India), an India subsidiary of CAAC.
It is the operator of TIST India and the contractor with the Small Groups for greenhouse
gas credits.
Thousands of TIST Farmers make up the Small Groups, plant the trees on their lands,
manage their own trees and make up the core or TIST.
G4.2 Document key technical skills for successful implementation
The two founders of CAAC have almost 75 years combined experience in energy, natural
resources, monitoring, quality control, transportation, biofuels, pollution control technologies,
emission trading, trading program development, third party due diligence, computer technology
and management. They began CAAC in 1993 and helped develop emission trading programs in
the US and Canada and were responsible for many firsts in innovative emission control (See
CAAC website).
TIST was established in direct response to the needs developed and expressed by Small Groups of
Tanzanian subsistence farmers in 1999 and 2000. Attending a Small Group training seminar
organized by the Anglican Diocese of Mpwapwa in July 1999, one of CAAC's founders
participated in a visioning exercise with local subsistence farmers. They expressed deep concern
about recurrent famine, poor crops, lack of shade and firewood, declining rainfall, declining soil
fertility, poor access to water for personal and agricultural use, poor diet, regular health problems
including TB and Malaria, lack of economic opportunity, poor cattle forage on eroded lands, and
the decline of wildlife due to over hunting and lack of forests. The Small Group seminar,
however, did not stop with identifying the local problems; participants established the goals of
starting hundreds of Small Groups to plant trees, reduce poverty, improve health, and prevent
famine. They decided the groups should work together with each other, and with resources in the
US and the UK, to share “njia bora” (best practices) and to start achieving the goals.
41
See TIST IN PD-VCS-Ex 07 Financial Plan.xls
Page 32
With CAAC's involvement with nascent GhG trading in Canada, there was an obvious way to
bring these improvements to the farmers using carbon credits as a financial tool.
TIST has been operating successfully for over 13 years and has expanded to four countries, 64,000
farmers and planted over 11,000,000 documented trees. The monitoring system they developed
won a Computerworld Honors Laureate in 2007.
The following summarizes CAAC carbon project development experience:
TIST Program, Tanzania, a small-hold farmer A/R project. It began in 1999, with the
first tree planting in 2000. The project is centered around Mpwapwa and Morogoro and
includes over 2,000 farmers.
TIST Program, India, a small-hold farmer A/R project. Training began in 2002 in the
rural area outside of Chennai, Tamil Nadu. Tree planting in India began in 2003. Tree
planting under this PD began in 2004. There are over 4,000 farmers. CAAC took a subset
of TIST India through the successful validation and registration for CDM.
TIST Program, Uganda, a small-hold farmer A/R project. It began in 2003 and is
centered around three towns in southwest Uganda (Bushenyi, Kabale and Kanungu).
There are over 5,000 farmers and almost five million trees. The DNA approved the project
contingent on submitting a PDD based on an approved methodology. They also approved
the EIA. TIST Uganda has four validated and verified VCS projects, all of which were
also validated and verified under CCB, with Gold Level for exceptional community
benefits.
TIST Program, Kenya, a series of small-hold farmer A/R projects. The project started in
2004 and is centered around Mt Kenya. There are over 52,000 farmers involved. The
project has been accepted by the forest department and DNA for CDM. An EIA was
accepted by the National Environmental Management Authority (NEMA). TIST Kenya
has six validated and verified VCS projects, all of which were also validated and verified
under CCB, with Gold Level for exceptional community benefits.
Sulfur Hexafluoride Emission Reductions from electric power equipment in substations
of Duquesne Light Company. Reductions were made at numerous locations in
Pennsylvania from 1996 through 1999. The reductions were approved as credits under the
Pilot Emissions Reduction Trading Program (PERT) in Ontario Canada. CAAC managed
the project.
Methane emission reductions through the recovery of landfill gas from the Lancaster
Landfill in Lancaster, New York. Reductions were made 1995 through 1998. The
reductions were approved as credits under the Pilot Emissions Reduction Trading Program
(PERT) in Ontario Canada. CAAC managed the project.
G4.3 Developing Local Capacity

Page 33
TIST begins in an area with a series of orientation seminars such as identified in G3.8. TIST
members are introduced to the program and participate in the customization of the program to the
locale. Most of the local staff is hired from the TIST membership. All Quantifiers and trainers are
from the local membership. Staff and Quantifiers are hired based on ability, not gender, tribe,
cultural background, or level of education. However, all effort is made to ensure a balance in
gender and tribal affiliation. Training is passed on to new workers through the seminars and
working with an experienced TIST member. As needed, the US team holds seminars to provide
new information.
Quantifiers receive ongoing training as needed and will attend a training seminar, at least once per
year. During this seminar, they will be trained on the TIST monitoring plan, which includes use
of the PDAs and GPS, use of the custom data collection software, how to maintain their data,
synchronizing their data with the TIST server, the importance of good data, taking tracks of the
project area perimeters, taking secondary track of the project area perimeters, counting trees, the
importance of proper tree counts, identifying tree species and tree ages, taking proper
circumference measurements, keeping accurate expenses, GhG contracts and any new program
initiated.
Small Groups training is ongoing. Small Groups are encouraged to meet weekly to plan how to
work together, share training and share best practices. Groups also receive training when they
receive payments (usually twice each year). Additional training is carried out in the field, on-site
by Quantifiers and volunteer Trainers, and through a monthly newsletter. Training includes
conservation farming, biodiversity, improved cook stoves, the GhG contract, climate change,
selecting tree species, the benefits of different species, preparing nurseries, tree management,
HIV/AIDS, malaria and other subjects of interest to the members.
G4.4 Equal Opportunity Employment
TIST does not have an expatriate staff. Although the main management staff and computer
development are in the US, Indians run the India program from project areas. The Quantifiers are
TIST farmers trained to use the monitoring system. The land and trees planted belong to the TIST
farmers. The TIST farmers work together to establish the best practices for their area (whereas the
Kenyan and Ugandan farmers establish their own best practices more suitable to their areas).
TIST farmers are trained as trainers. Indians run payment and training meetings and Small Group
meetings. All TIST members have an opportunity to be group leaders, regardless of education or
gender. TIST members are utilized as volunteers, independent contractors and employees based
on achievement, not gender, education or social status. TIST holds regular training seminars for
Quantifiers and conducts regular audits to make sure their skills are honed.
G4.5 Relevant workers right laws
The employment laws are listed below. CAAC uses Indian counsel to advise on issues relating to
employment. CAAC is not in violation of these laws.
Workmen’s Compensation Act 1923
Minimum Wages Act 1948

Page 34
Payment of Wages Act 1936
Industrial Disputes Act 1947
Employees Provident Fund and Miscellaneous Provisions Act 1952
Payment of Bonus Act 1965 Payment of Gratuity Act 1972
Maternity Benefit Act 1961
Industrial Employment (Standing orders) Act 1946
All employees are given an overview of their rights when hired or at training meetings. The
contents of Exhibit 36,42
"TIST India: Employee Rights" are provided to them either verbally or in
writing.
G4.6 Occupational Safety
TIST members are conducting activities that they normally do, i.e. farming using manual labor.
TIST workers walk or use public transportation. They do not engage in activities that are
inherently unsafe. The risks facing TIST workers are minimal and no different than those
affecting anyone living in the area. Such risks include:
riding in public transport where there is risk of crash or robbery;
venomous or constricting snakes, which, although have been mostly eradicated from the
farmlands, still can be encountered.
TIST has a Standard Operating Procedure to address safety. To ensure that safety policy and
safety issues are understood, each Quantifier will be briefed on the following safety policy
annually.43
G4.7 Financial health of CAAC
CAAC has been in business since 1993 and has operated TIST for over 13 years. CAAC is
profitable after all TIST expenses. Financial statements and a financial plan have been made
available to the Verifier.
G5. Legal Status and Property Rights
G5.1 List of all relevant local, national and international laws
As a tree-planting program that takes place voluntarily on existing farmland, there are few laws
that are relevant to TIST. They are, however:
• National Forest Policy for India, 1988 sets a target of 33.33% forest cover. The policy
suggests that afforestation on degraded wastelands could be an important component of
achieving this goal.
42
See TIST IN PD-VCS-Ex 36 Employee Rights.doc 43
See Exhibit 37: TIST IN PD-VCS-Ex 37 Quantifier Safety 110110.doc

Page 35
• Other policies regarding forests and land include The Tamil Nadu State Forest Act of
1882, The Wildlife Protection Act of 1972, and the Forest Conservation Act of 1980.
There is no law/regulation specific to reforestation of privately owned degraded lands. However,
the continued deforestation and forest degradation despite these policies show that they will
continue as unrealized aspirations without additional funding and support. Without the project
activity, the project areas would not be reforested.
G5.2 Project Approvals
There were no approvals necessary for a farmer to plant trees on his/her lands. However, TIST
engaged local forest and environmental offices to seek their approval and received broad approval
and support, as seen in section G3.8.
The A/R project activity does not have any negative environmental impact because the project
activity is highly environmental friendly. This is supported by the India domestic national
authority (DNA) for CDM. A subset of TIST India was validated and registered under CDM44
and the CDM approval indicates the DNA believes the TIST program meets the necessary
environmental threshold.
In addition, TIST India has been recognized by the Tamil Nadu Forest Department for its work,
and was awarded “Best Planting in Private Lands” under Institutional Category for “The
International Year of Forests 2011.”45
TIST India farmers in Tiruvallur District received three
additional awards for forestry outreach and awareness creation.
G5.3 Document project will not encroach on other lands
CAAC and TIST do not own or lease any of the project lands. TIST takes place on the existing
land of farmers and their families. CAAC enters into contracts with the Small Group members. In
the contract, the members attest in that they have the rights to plant on these lands.
G5.4 Involuntary relocation
CAAC and TIST do not own or lease any of the project lands. TIST takes place on the existing
land of farmers and their families. Participation is strictly voluntary. CAAC has no authority to
relocate any of the members or landowners.
G5.5 Illegal Activities
Illegal harvesting of trees and charcoal making exist in the protected forests of the project zone.
This is an ongoing problem for Indian forestry and is not related to TIST or caused by TIST.
TIST, through its development of on-farm, sustainable, wood lots, has a positive impact on these
activities by providing an alternate, sustainable source of fuel to some of the population.
44
See Exhibit 21. CDM Approval. 45
See Exhibit 23. Award for Best Tree Planting
Page 36
G5.6 Title to carbon rights
Greenhouse Gas Agreements among all the Small Groups, with each member as a signatory, and
TIST India exist. Under the terms of the contract, all rights and title to the carbon is transferred to
TIST India. The members retain the land and trees. There is not a national law that governs
carbon, per se. However, the ownership of tree and tree products can be subject to contract and
transferred to others.
Under a contract between TIST India and CAAC, TIST India transfers the right to the carbon to
CAAC. Furthermore, CAAC takes on the obligation to fund TIST India and the tree payments to
the Small Groups.

Page 37
Climate Section
CL1. Net Positive Climate Impacts
CL1.1 Change in carbon stock due to project activity
The change in carbon stocks due to project activities are based on AR-AMS0001 Version 06:
Simplified baseline and monitoring methodologies for small-scale A/R CDM project activities
implemented on grasslands or croplands with limited displacement of pre-project activities as
adopted by the Voluntary Carbon Standard.
Change with the project. The change with the project is based on the ex-ante estimation required
of the methodology. The trees planted are stratified by major species and year planted and each
strata was grown over time, based on accepted annual volume increments. The following lists the
major species and the factors used to estimate the carbon that will result from TIST trees.
Tectona grandis
Iv = 12 m3/ha/yr.
46
Where: Iv = annual increment in volume based on over the bark log volumes.
BEF = 1.5.47
WD = 0.5 t.d.m/m3.48
R = 0.2749
Gmelina arborea
Iv = 31 m3/ha/yr.
50
Where: Iv = annual increment in volume based on over the bark log volumes.
BEF = 1.5.51
WD = 0.41 t.d.m/m3.52
R = 0.2753
46
GPG-LULUCF, Table 3A.1.7. Average Annual Above Ground Net Increment in Volume in Plantations By Species,
Tectona grandis. 47
GPG-LULUCF, Table 3A.1.10, Default Values Of Biomass Expansion Factors (BEF), Tropical, Broadleaf. 48
GPG-LULUCF, Table 3A.1.9-2, Basic Wood Densities (D) of Stemwood (Tonnes Dry Matter/M3 Fresh Volume)
for Tropical Tree Species, Tropical Asia, Tectona grandis. 49
GPG-LULUCF, Table 3A.1.8, Tropical/Sub-tropical dry forest. 50
GPG-LULUCF, Table 3A.1.7. Average Annual Above Ground Net Increment in Volume in Plantations By Species,
Gmelina arborea. 51
GPG-LULUCF, Table 3A.1.10, Default Values Of Biomass Expansion Factors (BEF), Tropical, Broadleaf. 52
GPG-LULUCF, Table 3A.1.9-2, Basic Wood Densities (D) of Stemwood (Tonnes Dry Matter/M3 Fresh Volume)
for Tropical Tree Species, Tropical Asia, Gmelina arborea. 53
GPG-LULUCF, Table 3A.1.8, Tropical/Sub-tropical dry forest.

Page 38
Mangifera indica
Iv = 6.45 m3/ha/yr.
54
Where: Iv = annual increment in volume based on over the bark log volumes.
BEF = 1.5.55
WD = 0.52 t.d.m/m3.56
R = 0.2757
Other Asia, Dry Tropical
NA = 6.45 t.d.m/ha/yr.58
Where: NA = annual increment of above ground biomass, t.d.m/ha/yr
BEF = 1.5.59
WD = 0.73 t.d.m/m3.60
R = 0.27.61
The age class of the strata is based on the age of the trees already planted and listed in worksheet
"Strata." The data is tabulated in worksheets "Ex-Ante Carbon Est" and "Ex-Ante Strata Est" and
presented in worksheet "Table CL1.1."
Change without the Project. The methodology allows the change in baseline carbon without the
project to be ignored, providing it is less than 10% of the change in carbon that results from the
project. The existing trees were recorded and measured during the baseline study (worksheet
"Baseline Strata"). The non-woody areas were stratified and the area estimated (worksheet "Grove
Summary). A conservative case was used to estimate the increase in carbon overtime (worksheet
"Baseline Growth"). The ex-ante estimate of the baseline without the project is 0.45% of the ex-
ante estimate with the project and the baseline case is ignored in the calculations.
Net change in Carbon Stocks. Due to the methodology, the change in baseline carbon was
ignored and the ex ante net change in carbon stocks was estimated at 331,410 tonnes of CO2e or
11,047 tonnes per year.
CL1.2 Change in the emissions of non-CO2 GHG emissions
The change in emissions of non-CO2 carbon stocks is below 5% and was ignored.
54
GPG-LULUCF, Table 3A.1.6, Annual Average Above Ground Biomass Increment in Plantations By Broad
Category, Asia, Other Species, Dry. 55
GPG-LULUCF, Table 3A.1.10, Default Values Of Biomass Expansion Factors (BEF), Tropical, Broadleaf. 56
GPG-LULUCF, Table 3A.1.9-2, Basic Wood Densities (D) of Stemwood (Tonnes Dry Matter/M3 Fresh Volume)
for Tropical Tree Species, Tropical Asia, Mangifera spp. 57
GPG-LULUCF, Table 3A.1.8, Tropical/Sub-tropical dry forest. 58
GPG-LULUCF, Table 3A.1.6, Annual Average Above Ground Biomass Increment in Plantations By Broad
Category, Asia, Other Species, Dry. 59
GPG-LULUCF, Table 3A.1.10, Default Values Of Biomass Expansion Factors (BEF), Tropical, Broadleaf. 60
A sample set of tree counts by species planted by TIST farmers in India was obtained from the TIST database. The
wood densities were obtained and a weighted average was calculated. See Table 3.2.B. 61
GPG-LULUCF, Table 3A.1.8, Tropical/Sub-tropical dry forest.

Page 39
The potential source of methane is burning of biomass. Because the farmers planting the trees are
subsistence farmers that rely on wood for cooking food, they are not expected to engage in
widespread burning; available wood will be used for domestic fuel and would just offset fuel
wood gathered from outside the project area. In addition, the burning of biomass is neither
necessary for the project, nor promoted. Any methane emission is de minimis and well below the
5% threshold.
N2O is a potential source from chemical fertilizers. The policy of TIST is for the farmers to
refrain from using chemical fertilizers, and instead, to rely on dung and plant material. Neither of
these are the result of project activity and need not be considered.
CL1.3 GHG emissions resulting from project activities
In accordance with the conditions of the approved baseline and monitoring methodology AR-
AMS0001, "project emissions are considered insignificant and therefore neglected."62
While no
test or analysis of project emissions are required, the following comments are provided:
Fertilizers. The policy of TIST is for the farmers to refrain from using chemical fertilizers and
instead to rely on dung and plant material. Neither of these are the result of project activity and
need not be considered. However, if considered, the nitrogen emissions from natural fertilizers are
estimated to be less than 0.1% of the actual net greenhouse gas removal by sink and may be
considered de minimis. See "Misc Calc" worksheet.
Nitrogen-fixing species. Emissions from nitrogen fixing species are also insignificant. Though
present, the nitrogen-fixing trees are a minor component of the overall tree inventory. Because
any deadwood will be used for domestic fuel, the trees will not be left to rot or decay. The lands
where the trees are being planted are degraded and likely have a nitrogen deficit.
Fossils Fuels. There will be no burning of fossil fuels or biomass for site preparation, monitoring,
tree harvesting, or wood transportation; nor does TIST involve any industrial processes, as all
labor is manual. Thus, no other GHGs are expected to be emitted as a result of the implementation
of the proposed project.
CL1.4 Demonstrate a positive net climate impact
The ex-ante estimate is that TIST trees will sequester 331,410 tonnes of CO2e over the 30 years
and will, therefore, have a net positive impact on the climate. In addition, planting the trees will
benefit the overall ecosystem and, through the use of deadwood from the project, result in reduced
deforestation outside the project boundaries.
62
AR-AMS0001, Section I.3, Section II.26 and Section VI.47.
Page 40
CL1.5 Double Counting
The project areas that make up this CCB PD are being validated and verified under VCS. If they
are validated and verified, VCS will issue VERs that will be entered on one registry. The registry
rules will prevent these VERs from being sold twice.
India is not subject to an emissions cap.
CL2. Offsite Climate Impacts (Leakage)
CL2.1 Potential Sources of Leakage
While no leakage is expected to result from the project, the potential sources of leakage are
reviewed and the reasons why these don't apply to the project are presented.
Activity shifting or displacement: The members of TIST were questioned, as part of the
baseline survey, to determine if planting trees caused shifting of activity or displacement.
They stated “no”. In addition, the value of the carbon that the trees generate is very small
compared to the value of the crops the land can provide. Since, by definition, these crops
are the primary source of food for the farmers, the farmers do not displace their primary
activity. Because membership is voluntary, there is no reason for any displacement to
occur. While TIST farmers are encouraged to plant trees around their homes, they are
never asked or encouraged to move from their residence.
Market effects (effect of reduced harvest): The project areas are owned by the farmers
and the trees are new sources of wood for them. The need for fuel wood is one of the main
reasons India has been undergoing deforestation. Farmers, either directly or indirectly,
take wood from gazetted forest. The project allows the farmers to use the deadwood
produced by their project trees providing a more convenient and lower cost fuel source and
reducing the pressure on the gazetted forests.
CL2.2 Leakage mitigation
Because no leakage sources were identified, no mitigation was necessary.
CL2.3 Subtracting unmitigated leakage
Because there is no expected leakage, the amount to be subtracted from the net climate impact of
the project is zero.
CL2.4 Non-CO2 leakage in excess of 5%
None were identified.
Page 41
CL3. Climate Impacts Monitoring
CL3.1 Initial Monitoring Plan
Because TIST was designed as a climate change project and the project areas under this PD have
been operational since 2004, the monitoring plan in this section is operational.
Each project area is owned and managed by a different group of people, which TIST calls Small
Groups. The areas are discrete parcels of land spread out over many districts and villages. The
Small Groups select the species of trees, the number of trees to plant and the planting schedule.
They also own and maintain the trees and the tree products. While TIST works with the groups to
develop best practices that can be shared and adopted by everyone in the organization, the fact
remains that each project area is different. The difference is such that the monitoring system
required is different than typical forest monitoring protocols.
TIST has met the challenge of obtaining accurate information from a multitude of small discrete
project areas in remote areas, where roads are poor and infrastructure is minimal, by combining
high-tech equipment and low-tech transportation within its administrative structure. The TIST
Data System is an integrated monitoring and evaluation system currently deployed in India and
three other countries. On the front end is a handheld computer-based platform supported by GPS
technology, that is utilized by field personnel (Quantifiers, auditors, trainers and host country
staff) to collect most project information. This includes data relating to registration, accounting,
training, tree planting, baseline data, conservation farming, stoves, GPS plots, and photographs.
The data is transferred to TIST’s main database server via the Internet and a synchronization
process, where it is incorporated with historical project data. The server provides information
about each tree grove on a publicly available website, www.tist.org. In addition, the other data is
available to TIST staff through a password-protected portal.
The handheld computers have been programmed with a series of custom databases that can
temporarily store GPS data, photographs, and project data. The interface is designed to be a
simple to use, checklist format that ensures collection of all of the necessary data. It is simple
enough for those unskilled in computers and high tech equipment to be able to operate, after a
short period of training. The interface can also be programmed for data collection not specific to
the project. The handhelds are “off the shelf,” keeping their costs relatively low.
The synchronization process takes place using a computer Internet connection. While office
computers are used where available, field personnel commonly use cyber cafes, reducing travel
time and improving data flow. Where available, cell phones using GPRS technology are now
allowing synchronization from remote tree groves and project areas, providing near real-time data.
The TIST Data Server consists of a public side, accessible by anyone over the Internet and a
private side only accessible through a password-protected portal. On the public side, a dynamic
database is used to constantly update the displayed data. Changes can be seen daily, as new
synchronizations come in. By mapping the project data with photos and GPS data, the results of
each Small Group can be seen on a single page. The GPS data has been programmed with Google
Maps to locate project activities anywhere in the world on satellite imagery.

Page 42
On the private side, confidential accounting data, archive data and data not currently displayed is
available. This is the source data for the custom reports and tables necessary for project managers.
The TIST database is off-site and has an off-site backup. The information collected and used for
this monitoring program will be archived for at least two years, following the last crediting period.
Monitoring change in baseline carbon. The selected CDM/VCS methodology does not require
monitoring of the baseline. As determined with the ex-ante calculation, the change in baseline
carbons stocks is fixed at the value derived in Section G2.3.
Monitoring selected carbon pools. The selected carbon pools are above ground and below
ground biomass. The following monitoring plan is being used and will continue to be used.
Step 1. Because of the difference in species and age of the trees and location, ownership and
management of the project areas, each project area is be monitored. They are documented in
"Grove Summary" and "Strata" worksheets, Appendix 04. The boundary of the project area was
obtained with a GPS (Appendix 03), the area calculated and displayed in the "Grove Summary"
worksheet.
Step 2. The strata for the ex post estimation of the actual net greenhouse gas removals are by
species and year. Stratification is done within each individual project areas. The area of a stratum
in a project area ("area of a stratum (ha)") is determined by multiplying the area of project area
(see Step 1) by the percentage of trees of that stratum in the respective project area.
Step 3. Where a tree species exceeds 10% of the total tree inventory, it is assigned to a Major
Strata. All other tree species are assigned to the "Other" strata.
Step 4. Allometric equations are used to convert DBH values to biomass. An allometric equation
for each Major Strata were identified. If a species specific equation for a Major Strata was
unavailable, it uses the "Other" equation as a default. The following are the Major Strata and the
allometric equations that were used. The list will be updated as new, or more appropriate ones,
become available.
Tectona grandis63
: Y = 0.153 • DBH2.382
Gremlina arborea64
: Y= 0.153 • DBH2.217
Mangifer indica: no species specific equations, will use "Other" equation
63
GPG-LULUCF Annex 4A.2 Examples of allometric equations for estimating aboveground biomass and
belowground biomass of trees, Table 4.A.3. Examples of Allometric Equations for Estimating Above Ground
Biomass (kg of dry matter per tree) of some Individual Species Commonly Used in the Tropics, Tectona grandis. See
Exhibit 18. 64
Regina N. Banaticla, Renezita F. Sales and Rodel D. Lasco, Biomass Equations for Tropical Tree Plantation
Species Using Secondary Data from the Philippines, Australian Centre for International Agricultural Research
(ACIAR) Smallholder Forestry Project, ASEM 200/008 redevelopment of a timber industry following extensive land
clearing: Proceedings from the end-of project workshop, Ormoc City, Philippines 19-21 August 2004, Table 5, page
122. See Exhibit 19.

Page 43
Other (default)65
: Y = exp[–2.289 + 2.649 • ln (DBH) – 0.021 • (ln(DBH))2]
Where:
Y= aboveground dry matter, kg (tree)-1
DBH = diameter at breast height, cm
ln = natural logarithm
exp = e raised to the power of
Step 5. The DBH of up to 20 trees per stratum, per project area, were measured. Height was not
measured or used in the allometric equations. Each DBH value for each tree measured was
applied to the appropriate allometric equation and the biomass of each per tree in the stratum was
obtained and averaged to determine the "average above ground biomass per tree (kg)" of a
stratum.
Step 6. For each stratum in each project area, the average above ground biomass per tree was
multiplied times the number of trees to yield the "above ground biomass in stratum (kg)." The
results were divided by 1,000 to obtain "above ground biomass in stratum (t)."
Step 7. The methodology requires the use of tons of biomass per hectare in a subsequent step. It
was determined by dividing the "above ground biomass in stratum (t)" from Step 6 by the "area of
the stratum" from Step 2.
above ground biomass (t/ha) = above ground biomass in stratum (t)
area of the stratum (ha)
Step 8. The above ground biomass of each stratum was multiplied by 0.5 to convert biomass to
carbon. The result was "above ground carbon” (t/ha).
Step 9. The carbon stocks of the below ground biomass of each stratum (t/ha) were calculated by
multiplying the above ground biomass of each stratum (t/ha) by the appropriate roots to shoot ratio
and by 0.5, the carbon fraction of the biomass. A root to shoot factor of 0.27 was used.66
The
result was "below ground carbon” (t/ha).
Step 10. The total carbon stocks (CO2e) were determined by adding the above and below ground
carbon (C) of each stratum in each project areas, multiplying each sum by the respective area of
that stratum, converting the result to CO2e and summing the products. The following is the
general equation required by the methodology.
65
GPG-LULUCF Annex 4A.2 Examples of allometric equations for estimating aboveground biomass and
belowground biomass of trees, Table 4.A.1. Allometric Equations for Estimating Aboveground Biomass (kg dry
matter per tree) of Tropical and Temperate Hardwood and Pine Species, Tropical moist hardwoods. See Exhibit 18. 66
GPG-LULUCF, Table 3.A.1.8. See Exhibit 17.

Page 44
I
P(t) = Σ(PA(t) i + PB(t) i) * Ai*(44/12)
i-I
Where:
P(t) = carbon stocks within the project boundary at time t achieved by the project
activity (t CO2e)
PA(t)I = carbon stocks in aboveground biomass at time t of stratum i achieved by the
project activity during the monitoring interval (t C/ha) from Step 8.
PB(t)I = carbon stocks in belowground biomass at time t of stratum i achieved by the
project activity during the monitoring interval (t C/ha) from Step 9.
Ai = project activity area of stratum i (ha) from Step 2.
I = stratum i (I = total number of strata)
The data to be monitored for monitoring actual net GhG removals by sinks are the number of trees
in each project area and representative circumference. Because of the potential difference among
project areas, the tree count of each project area is monitored. TIST has a staff of trained
Quantifiers that visit each and every project area periodically. When quantifying a project area,
they:
Identify or confirm identification of the project area by its unique name combination of
Small Group name and grove name (grove is the vernacular used by the project for a
project area).
Determine the latitude and longitude of the approximate center point of the project area
with a GPS. It is automatically logged into the hand-held computer database for temporary
storage.
Map the boundaries of the project area by walking the perimeter using a GPS. The data is
stored in the hand-held computer database for temporary storage.
Count each tree in the project area by age and species strata. The operator enters this data
directly into the handheld computer database for temporary storage.
Measure the circumference of up to 20 trees in the age and species strata of a project area.
The operator enters this data into the handheld computer database for temporary storage.
The data on the handheld computer database is uploaded to the TIST server, through the Internet,
for additional processing and permanent storage.
The confidence and precision levels will be assessed in future monitoring.
The following table summarizes the monitoring plan.

Page 45
Data/
Para-
meter
Data
unit
Descrip-
tion
Source
of data
Value of
Data67
Measure-
ment
Methods68
QA/QC
Comment Location Latitude
and
longitude
Single point
location of
the area
where project
activity has
been
implemented
GPS See "Grove
Summary"
worksheet
for each
result
Go to each
project area,
take a single
location point
per area with
GPS/PDA, up-
load to server
SOP, audit
and multiple
visits
The location
of each project
area is
obtained with
a GPS
Project area ha Size of the
areas where
the project
activity has
been
implemented
GPS See "Grove
Summary"
worksheet
for each
result
Go to each
project area,
take a track of
the perimeter
with the
GPS/PDA, up
load to server.
Software
computes area
inside track
SOP, audit
and multiple
visits
The area of
each project
area is
obtained with
a GPS by
walking and
mapping the
boundary of
the project
area
DBH cm Diameter of
tree at breast
height
(1.30 m)
Measur-
ing tape
Multiple
values
specific to
strata taken
from selected
project areas
Ongoing
measurement
taken by
Quantifiers as
they visit
project areas
SOP, audit
and multiple
visits,
multiple
locations
TIST
measures
DBH of up to
20
representative
trees of each
age/species
stratum in
different
project area
No of trees trees Number of
trees in a
project area
by strata
Physical
count
See "Grove
Summary"
worksheet
for current
results. This
number will
change over
time for each
project area
based on
replanting
and mortality
Physical count
by Quantifiers
with each visit
SOP, audit
and multiple
visits
Ownership name Ownership of
land of project
area
Project
registra-
tion data
See "Grove
Summary"
worksheet
for each
result
Ask members
about changes
in ownership.
Record on PDA
SOP, audit
and multiple
visits
List of owners
of each PA,
their contract
status and the
status of their
carbon rights
will be
reviewed with
67
TBD means to be determined during quantification. 68
PDA means personal digital assistant, the hand held computer and custom software used by
TIST.

Page 46
Data/
Para-
meter
Data
unit
Descrip-
tion
Source
of data
Value of
Data67
Measure-
ment
Methods68
QA/QC
Comment each
monitoring
event to
confirm
ownership
Total CO2 Mg Total CO2 Project
activity
Changes
over time
based on tree
count, strata
and growth
Calculated
using
allometric
equations and
conversion
factors
See above for
tree count and
circum-
ference.
Calculation
subject to
verification.
Based on data
collected from
all plots and
carbon pools
Data will be maintained for at least two years following the end of the last crediting period.
TIST uses the following QA/QC procedures:
Quantifier Training: Quantifiers receive explicit training in regard to TIST’s Standard
Operating Procedures so that quantifications are performed in a standard and regular
fashion. The Quantifier field manual/handbook is available online at www.tist.org under
“Documents to Download” and is updated to reflect changes in internal procedures.
Quantifiers meet monthly to discuss questions or problems that they may have and receive
training and software updates when necessary. Quantifiers are not dedicated to a grove for
the life of that grove and may be rotated to other groves.
Staff Audits: TIST staff members are trained to quantify groves and have handheld
devices that are programmed to conduct audits. A requirement of their job is to
periodically audit Quantifiers, including an independent sampling of tree counts and
circumference measurement.
Multiple Quantifications: TIST’s internal goal is to quantify each project area once per
year. Inaccurate data and errors are self-correcting with the subsequent visits. If trees
have died or have been removed, a new count will reflect the current population. The
growth of the trees, as indicated by increased DBH, is monitored with these subsequent
visits. If a species is mislabeled, it will arise as a conflict when different Quantifiers
attempt to perform tree counts for that grove that do not match the previous one.
Comparisons are made over time to determine whether a particular quantification or tree
count appears unrealistic.
Multiple Tracks: In order to ensure that the location and perimeter of each discrete
project area is accurate, each GPS track of the parcel is measured at least twice, or until
two tracks that reliably define the project area are obtained. Quantifiers will be required to
re-trace the tract with each quantification, to verify that they are at the correct project area
and that they are counting the correct trees.
Double Counting: To ensure that the same project area is not counted more than once, an
overlap script is used that compares the outline of all project areas. If an overlap is
Page 47
detected, the project areas are visually compared. If an overlap is determined, the
overlapping project area is removed from the PD.
Data Quality: TIST Quantifiers count every tree in each discrete project area. Counting
each tree is 100% sampling and provides greater than 1% precision, at the 95% confidence
level. Up to 20 circumference readings, for each stratum, in a project area, will be taken
and archived to develop a localized database of growth data by strata. This data will
provide the circumference data for each stratum. This sampling will exceed the 10%
precision, at the 95% confidence level, required by the methodology. TIST Data System: The data system is an integral part of TIST’s quality assurance and
quality control plan. The handheld devices are programmed in a manner that requires the
data to be collected in a step-by-step manner, increasing the likelihood that all the data will
be collected. Data field characteristics are defined to force the use of numbers, text or
special formats. Drop down menus are used to restrict answers to certain subsets (e.g. a
TIST Small Group name comes from a drop down menu). Some data fields are restricted
to a range of data (e.g. negative numbers are not allowed). The data is uploaded within a
day to the main database, providing timely reporting and secure storage of the data.
Desk Audit: TIST has developed analytical tools for reviewing data, as it comes in from
the field, to look at track data, tree counts, and completeness of data.
Transparency: By providing the quantification data online and available to anyone with
an Internet connection, TIST is open to audit by anyone, at any time. By providing the
location, boundaries, tree count by species and circumference, any interested party can
field check TIST data. This transparency and the actual visits that have already taken place
provide a further motive to make sure the field data is correct.
Monitoring Leakage. Leakage was monitored within five years of the start of the project, by
surveying the members responsible for a discrete project area, on whether participation in the
program caused leakage, in the form of displaced activity. The answers were universally no.
Because no leakage has been identified, no further leakage monitoring is necessary.
CL3.2 Commit to developing a full monitoring plan
A full monitoring plan was developed and is available as Appendix 06.69
69
Appendix 06 is "TIST IN PD-CCB-001g App06 Monitoring Plan 130208.doc"

Page 48
Community Section
CM1. Net Positive Community Impacts
CM1.1 Impacts on community
The project creates a positive socio-economic impact. Some of the benefits realized by the Small
Group members and their families are:
New job opportunities: TIST requires a Host Country staff to operate. There are
currently 17 staff employees. TIST personnel travel by public transportation and buy food
and supplies from local merchants, bolstering the local economy. TIST uses Host Country
professionals, such as accountants and lawyers. TIST staff is trained to use the handheld
computers and GPS and how to collect data. They synchronize their devices in cyber
cafés, requiring the use of personal computers.
Direct Effects to Small Groups: TIST benefits thousands of Small Group members by
providing a new source of income. Small Group members are paid for each tree they plant
and maintain. When the project becomes self-funding from the sale of carbon credits, they
will receive 70% of the net carbon revenues.
Small Group Structure: Empowerment of Small Groups and creation of “best practices”
improves farm production, health, and farmer life. Small Groups use “rotating leadership”
which supports gender equality and develops the capacities of each member. The visible
success of the TIST groups and the availability of wood, shade, lumber, fruit, and
improved crop yields provides the entire community with positive examples.
Fruits and nuts from tree plantings: The members select the trees to plant on their land
and retain ownership of the trees and their products. To the extent that they plant fruit or
nut trees, they will gain the food security and economic benefits the trees provide.
Wood products and limited timber from trees: Besides owning the trees, the farmers
have the rights to all dead wood. They may prune branches and collect fallen branches.
The growth models used for extrapolating biomass includes up to 70% mortality over a 30-
year period. The farmers can use this biomass for their own consumption without affecting
the estimated carbon stocks. In addition, the farmers may thin their trees as part of the on-
going management of the project area and sell the harvested stems as timber.
Natural medicines, insecticides and other benefits from trees: Some of the trees, such
as the Neem, provide other non-wood related benefits.
Capacity building on agricultural improvements, business skills, nursery
development, and reforestation: TIST has a well-developed capacity building program
that promotes rotating leadership within the Small Groups, that focuses on gender equality
and is made available to all members, regardless of education or social standing. TIST
provides training in subjects such as conservation farming, nursery development
reforestation, climate change, biodiversity, building and using more fuel-efficient stoves
and runs the program like a business.
Improved beauty of the landscape: This is a welcome attribute in an overused and
degraded landscape.

Page 49
The economic value to each member is dependent on which program elements they choose to
adopt. More than 84% of TIST members interviewed in an effort to assess socioeconomic impacts
indicated that they had received additional income as a result of TIST activities. Most commonly,
they reported using this additional income for agricultural inputs to improve their farms. Other
reported using the income for education or food.
TIST's goal is to surpass “sustainability,” so that people meet their needs today, in ways that
improve the next generation’s ability to meet its needs in the future. When farmers have
additional income to improve their farms, educate their children, and improve their nutrition, they
achieve this goal and improve their future in ways of their choosing.
Comparison with "without project" scenario. Quite simply, none of these benefits would exist
without the project. There would be no carbon revenues, no incentive to take farmland out of
production to garner a long-term benefit, no new trees that can provide food and economic
benefits from their products, no training in sustainable development activities and no new
employment opportunities.
CM1.2 No High Conservation Values negatively affected
The project does not have a negative effect on HCV areas. The project takes place on private
lands that have been under human habitation and agriculture for generations. The planting of trees
for the program does not cause displacement or move activities to HCV areas. On the contrary,
the two greatest threats to the HCV areas are deforestation and loss of biodiversity. The planting
of new trees and availability of some of the biomass for use by the participants reduces
deforestation pressure. The planting of woodlots on farms, especially where indigenous trees are
planted, improves biodiversity and helps connect dispersed HCV areas with canopy.
CM2. Offsite Stakeholder Impacts
CM2.1 Identify potential negative offsite stakeholder impacts
Because the project takes place on private lands and the tree planting is by the landowners, and
because the planting of trees is akin to the farming that has taken place on the lands for
generations, there are few negative potential impacts to offsite stakeholders.
One that has been identified is the effect of eucalyptus trees on ground water and watercourses.
As stated, the farmers get to choose the type of trees they plant on their own lands. During
training, TIST has been clear about some of the negative effects of eucalyptus trees, and as a result
there are no eucalyptus in this PD.
CM2.2 Mitigation of negative offsite stakeholder impacts
In order to reduce the number of eucalyptus trees, TIST has been training members and trainers on
indigenous trees and their benefits, as well as the negative effects of eucalyptus in sensitive areas.

Page 50
CM2.3 No net negative impact
The multitude of listed benefits to the community members and benefits to the environment
compared with only one identified potential and mitigated impact means the project has a positive
net impact.
CM3. Community Impact Monitoring
CM3.1 Initial monitoring plan of community variable
The following are the components of the initial Community Impact Monitoring plan.
1. Number of Small Group members in PD (male and female).
2. Number of Small Groups in PD.
3. Number of community members in TIST India (male and female).
4. Number of Small Groups in TIST India.
5. Number of community members active in TIST India.
6. Number of community members adopting natural resource management practices.
7. Number of community members with greenhouse gas agreements with TIST.
8. Total payments to community.
9. Number of live trees planted by TIST Small Groups.
10. Number of fruit or nut trees in TIST India.
11. Number of eucalyptus trees in TIST India.
12. Number of people employed by TIST or under contract to deliver services.
In addition, many more program components, such as GPS tracts of all the project areas, were
obtained in the climate change monitoring plan.
Monitoring is done annually as part of the overall monitoring of TIST. TIST Quantifiers collect
data as they visit each Small Group to count trees by species. Contracts are collected and recorded
by the administrative staff. The number of people employed or under contract with TIST and the
amount of GhG payments to Small Groups is obtained from administrative records.
Field data is recorded on custom programmed hand held computers and uploaded to the TIST
database. Data will be kept at least three years from the end of the reporting period.
CM3.2 Initial monitoring plan of HCV impacts
Because the project takes place on private lands that have been under human habitation and
agriculture for generations, there will be no direct monitoring of HCV areas. Instead, the impact
will be addressed by the number of indigenous trees planted by the project and the numbers of
hectares that contain indigenous trees.
CM3.3 Develop a full monitoring plan
A full monitoring plan was developed and is available as Appendix 06.
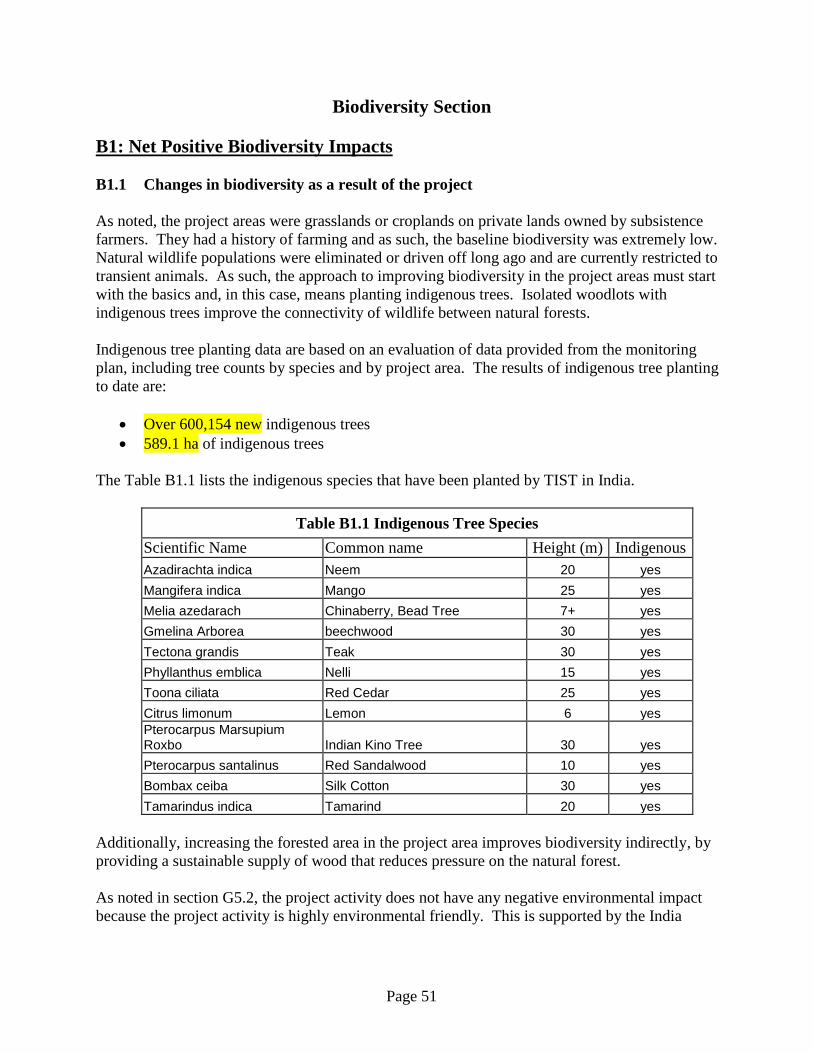
Page 51
Biodiversity Section
B1: Net Positive Biodiversity Impacts
B1.1 Changes in biodiversity as a result of the project
As noted, the project areas were grasslands or croplands on private lands owned by subsistence
farmers. They had a history of farming and as such, the baseline biodiversity was extremely low.
Natural wildlife populations were eliminated or driven off long ago and are currently restricted to
transient animals. As such, the approach to improving biodiversity in the project areas must start
with the basics and, in this case, means planting indigenous trees. Isolated woodlots with
indigenous trees improve the connectivity of wildlife between natural forests.
Indigenous tree planting data are based on an evaluation of data provided from the monitoring
plan, including tree counts by species and by project area. The results of indigenous tree planting
to date are:
Over 600,154 new indigenous trees
589.1 ha of indigenous trees
The Table B1.1 lists the indigenous species that have been planted by TIST in India.
Table B1.1 Indigenous Tree Species
Scientific Name Common name Height (m) Indigenous
Azadirachta indica Neem 20 yes
Mangifera indica Mango 25 yes
Melia azedarach Chinaberry, Bead Tree 7+ yes
Gmelina Arborea beechwood 30 yes
Tectona grandis Teak 30 yes
Phyllanthus emblica Nelli 15 yes
Toona ciliata Red Cedar 25 yes
Citrus limonum Lemon 6 yes
Pterocarpus Marsupium Roxbo Indian Kino Tree 30 yes
Pterocarpus santalinus Red Sandalwood 10 yes
Bombax ceiba Silk Cotton 30 yes
Tamarindus indica Tamarind 20 yes
Additionally, increasing the forested area in the project area improves biodiversity indirectly, by
providing a sustainable supply of wood that reduces pressure on the natural forest.
As noted in section G5.2, the project activity does not have any negative environmental impact
because the project activity is highly environmental friendly. This is supported by the India

Page 52
domestic national authority (DNA) for CDM. A subset of TIST India was validated and registered
under CDM70
and part of the process included:
Environmental wellbeing: This should include a discussion of impact of the project activity
on resource sustainability and resource degradation, if any, due to proposed activity;
biodiversity friendliness; impact on human health; reduction of levels of pollution in
general.71
CDM approval indicates the DNA believes the TIST program meets the necessary environmental
threshold.
In addition, TIST India has been recognized by the Tamil Nadu Forest Department for its work,
and was awarded “Best Planting in Private Lands” under Institutional Category for “The
International Year of Forests 2011”.72
TIST India farmers in Tiruvallur District received three
additional awards for forestry outreach and awareness creation.
Promotion of improved farming methods will further reduce pressure on forestland by increasing
food productivity by, and consequently decreasing pressure for, land clearing for agriculture.
Biodiversity is also enhanced directly through the planting of indigenous trees in homesteads and
woodlots. Increases in tree biodiversity should also enhance diversity of associated species,
including pollinators, and other beneficial species, while protection of riparian areas will improve
water quality and provide other important ecosystem services.
Most Likely Scenario: baseline ‘without project.’ None of the tree planting would have
occurred without the project. In the case of the indigenous trees, the biodiversity benefit is clearly
positive.
The members of TIST also plant non-indigenous trees. While they would not have been planted
without the project, and some lack the clear biodiversity benefit of the native species, they too
have a net biodiversity benefit. Going back to the on-going deforestation affecting the entire
country and the obvious continued need for fuel wood and timber by the expanding population, a
fuel wood alternative is necessary. The non-native trees fill this niche, and by doing so, reduce
deforestation and indirectly contribute to biodiversity. The "without project" scenario would mean
more pressure on the natural forests and more loss of biodiversity. Therefore, even looking at the
project from the vantage of the non-native species, the project has a net biodiversity benefit when
compared to the "without project" case.
B1.2 No HCVs be negatively affected by the project
No HCVs are negatively affected by the project. The project areas provide vital resources that
reduce pressure on these important areas, and through the planting of indigenous trees, expands
the range of biodiversity in these forests.
70
See Exhibit 21. CDM Approval. 71
See Exhibit 22. CDM Approval Process 72
See Exhibit 23. Award for Best Tree Planting

Page 53
The project areas are on individual farms, with an extensive history of farming and land use, other
than natural forest or long-term forestry. As such, any negative effect caused by human activity at
the project sites has already happened. Project activity has had a positive affect on HCVs.
B1.3 All species to be used by the project
Because TIST does not provide seeds or seedlings, TIST farmers collect seeds from locally
existing trees that have a history of being grown in the country and regionally. Farmers are trained
on how to harvest seeds, from local trees, for their nurseries and tree planting, and on benefits of
varied species. Because the farmers own the trees that they plant, the species are selected by the
Small Groups based on their needs and the benefits, which they desire to obtain. As a result,
numerous species and varieties have been selected. Table B1.3 lists the species present in the
project areas and indicates whether they are indigenous to India. Additional species may be added
over the life of the project as additional planting takes place.
Table B1.3
Table B1.3 Tree Species Selected
Scientific Name Common name Height (m) Indigenous
Anacardium occidentale Cashew 15 no
Aniba rosaedora Rosewood 30 no
Azadirachta indica Neem 20 yes
Bombax ceiba Silk Cotton 30 yes
Casuarina equisetifolia Casuarina 30 yes
Citrus limonum Lemon 6 yes
Citrus sinensis Orange 13 no
Endiandra glauca Endiandra glauca 0 no
Eucalyptus grandis Flooded Gum 55 no
Gmelina arborea Beechwood 30 yes
Grevillea robusta Grevillea, River Oak, Silk Oak 25 no
Mangifera indica Mango 25 yes
Melia azedarach Chinaberry, Bead Tree 7+ yes
Olea europaea Olive 10 no
Phyllanthus emblica Nelli 15 yes
Pouteria sapota Sapota 18 no
Psidium guajava Guava 15 no
Pterocarpus Marsupium
Roxbo Indian Kino Tree 30 yes
Pterocarpus santalinus Red Sandalwood 10 yes
Swietenia mahagoni Mahogany 40 no
Tamarindus indica Tamarind 20 yes
Tectona grandis Teak 30 yes
Toona ciliata Red Cedar 25 yes
Page 54
Table B1.3 Tree Species Selected
Scientific Name Common name Height (m) Indigenous
Zanthoxylum spp. East African Satinwood 35 yes
Invasive Species. All listed species have been screened against the global database of invasive
species.73
Of the species, only guava is identified as invasive. However, while guava is included
in species invasive in India, they are high value trees in India and, according to the Forest Service,
are not invasive.74
Psidium guajava is a mainstay of the Indian diet and provides one of the most
popular fruits. It is the fourth most important fruit in India after mango, banana and citrus.75
Believed to be from Central America, it was introduced in India in the seventeen century, where it
has become an important fruit that adds to the economic well-being and food security of Indians.
It is being planted on agricultural lands and not in the natural forest. There are 16,830 guava trees,
out of 658,377 project trees, or 2.6%.
B1.4 Adverse effects of non-native species
As stated in B1.3, TIST does not provide seeds or seedlings, so the trees planted by TIST farmers
are locally sourced from existing trees with a history of being grown in the country and regionally.
They choose both indigenous and non-native species for their varied benefits. Some species,
notably eucalyptus, may have negative impacts if not managed with care. Eucalyptus, popular in
India since its introduction in 1790 for its fast growth, is known to set deep roots that may deplete
water resources without sustainable management. Eucalyptus is very common in many parts of
the country and is planted and promoted by State Forest Departments and Forest Development
Corporations for fuel wood, building poles and for timber.76
TIST farmers agree, as part of their contract, that trees that damage the environment will not be
counted as TIST trees. Groups are trained on the benefits of alternative indigenous trees and how
to grow these trees.
Training, monitoring, and incentives are all structured to encourage farmers to plant diverse trees
with diverse benefits. Because of all of these active steps taken to safeguard against deleterious
environmental effects, negative impacts have not been identified.
The use of non-native species is justified in a number of ways. Farmers choose species that
provide them with needed products and services. Project activities are on lands already impacted
by long-term human habitation and agriculture. Many species, like orange, lemon, and guava,
while not indigenous, have been naturalized over an extended period of time and provide much
needed food. Others, like casuarina, are chosen for their fast growth. In a country with a high
need for forest products, including fuel wood for cooking and timber for construction, sources of
sustainable wood products must be developed to substitute natural forest being lost through
73
International Union of Concerned Scientists, Global Invasive Species Database, Accessed 11 January, 2011 at
http://www.issg.org/database. 74
See Exhibit 37, TIST IN PD-VCS-Ex 38 TN Horticulture, Guava.jpg. 75
http://nhb.gov.in/report_files/guava/GUAVA.htm 76
http://www.fao.org/docrep/005/AC772E/ac772e06.htm

Page 55
deforestation. Many of these exotic species are valued, planted and promoted by State Forest
Departments and Forest Development Corporations.
B1.5 No GMOs will be used for GhG removals
No GMOs were used by the project to generate GHG emissions reductions or removals.
B2 Offsite Biodiversity Impacts
B2.1 Negative offsite biodiversity impacts
No negative offsite biodiversity impacts have been identified. As pointed out in Section CL2.1,
evidence that there was not any displacement of members has been provided in the form of a
survey of the landowners and project participants during baseline monitoring. They owned the
land before the project and own the land during the project.
In addition, the program is designed to allow sustainable harvest within the project boundary by
the members, which reduces the need for fuel wood from external sources. The Small Group
members own the trees and as the trees die, either naturally or through thinning, the members can
use them as fuel wood. The project activity has a beneficial effect on area deforestation; instead of
causing it, it ameliorates it.
B2.2 Mitigation of negative offsite biodiversity impacts
Not applicable, since no negative offsite biodiversity impacts have been identified.
B2.3 Justify the net positives biodiversity impact
No negative offsite biodiversity impacts have been identified. Therefore, net effect of the project
on biodiversity is positive.
B3 Biodiversity Impact Monitoring
B3.1 Initial plan for biodiversity monitoring
TIST has been in operation in India, since 2004 and has deployed an award-winning monitoring
system that collects data for, among other things, biodiversity. The monitoring plan described,
herein, is the full monitoring plan required under B3.3, below.
The plan uses TIST’s strength in gathering, verifying, and analyzing field data to measure critical
biodiversity metrics in the farms and groves where TIST farmers work and live. Trees are the
main focus of biodiversity impact monitoring since they provide important habitat diversity and
structural features for biodiversity. Tree biodiversity is expected to increase as a result of
awareness raising, training and incentives. We monitor and report on the TIST website the species
planted, number of trees of each species planted in each area, and, as the trees grow, the age and
circumference of these trees. Quantification is a constant process and, as a project area is
Page 56
monitored, new data populates the website. Annual monitoring of each site is expected and a
minimum of every two years will be achieved.
At a landscape level, we monitor the number of hectares of land improved, with indigenous tree
planting by TIST farmers and their location.
Trends in landscape connectivity and forest fragmentation were addressed, using the track data
collected by the Quantifiers. The location, extent and area of each project area were obtained.
There are 671.8 hectares of new forest comprised of 924 individual parcels spread out over
thousands of square kilometers. The location and perimeter of each project area are presented in
Appendix 1 and 2. Although the rules of VCS allow additional project areas to be added to a
grouped project PD, the rules of CCB do not. Though TIST will continue to add project areas, the
areas in this PDD will be fixed for the life of the project and the above numbers are not expected
to change.
B3.2 Plan to assess effectiveness of measuring effect on HCV
Because there is no direct interaction with the HCV, the monitoring will be indirect and based on
monitoring direct project achievements per B3.1 and B3.3.
B3.3 Commit to developing a full monitoring plan
A full monitoring plan was developed and is available as Appendix 06.
Top Related