


Languages
Pages
Legal


ARTIFICIAL INTELLIGENCE-GENERATED
PROCESS MODELS TO OPTIMIZE TOC
REMOVAL AND TTHM REDUCTION AT THE
OZARK POINT WTP
1
John Cook and Ruby Daamen
Advanced Data Mining Int’l, LLC
Greenville, SC
Sharon Sweeney
Central Arkansas Water
Little Rock, Arkansas
Acknowledgement
2
Graham Rich, CAW
Gary Hum, CAW
John Scioscia, Jacobs Engineering
Contents
• Objective of study
• Source water background
• Introduction to process modeling using AI
• Evaluate TOC removal enhancements
• Modeling TTHMs in clearwells
• Modeling TTHMs at distribution system sites
• Findings and recommendations
3

Project Background
4
Project Objectives
• Given: TTHM values at some distribution sites fed
by the Ozark Point WTP will not meet Stage 2
D/DBP regulation
• Develop enhanced insight among all parameters
of TTHM formation
• Develop models to optimize TOC removal in
coagulation and settling process
• Develop models to identify opportunities for
reducing TTHMs through WTP
• Develop model of distribution system TTHM
formation
• Determine optimization approaches
Overview of CAW
• CAW formed July 1, 2001 as a regional water
system serving ~ 425,000 people in the greater
Little Rock area – 121,500 retail and 10 wholesale customers
• Water Sources and Treatment – 2 Water Sources; Lakes Maumelle and Winona and 1 regulating
reservoir, Jackson Reservoir
– 2 Treatment Plants; total capacity 124 MGD; 157 MGD seasonally
– Clearwell storage capacity: 25 MG
• Water Distribution System – Roughly 2300 miles of pipeline
– 23 offsite storage tanks (total offsite storage 42.5 MG) with 22
Booster pumping stations serving 18 pressure zones
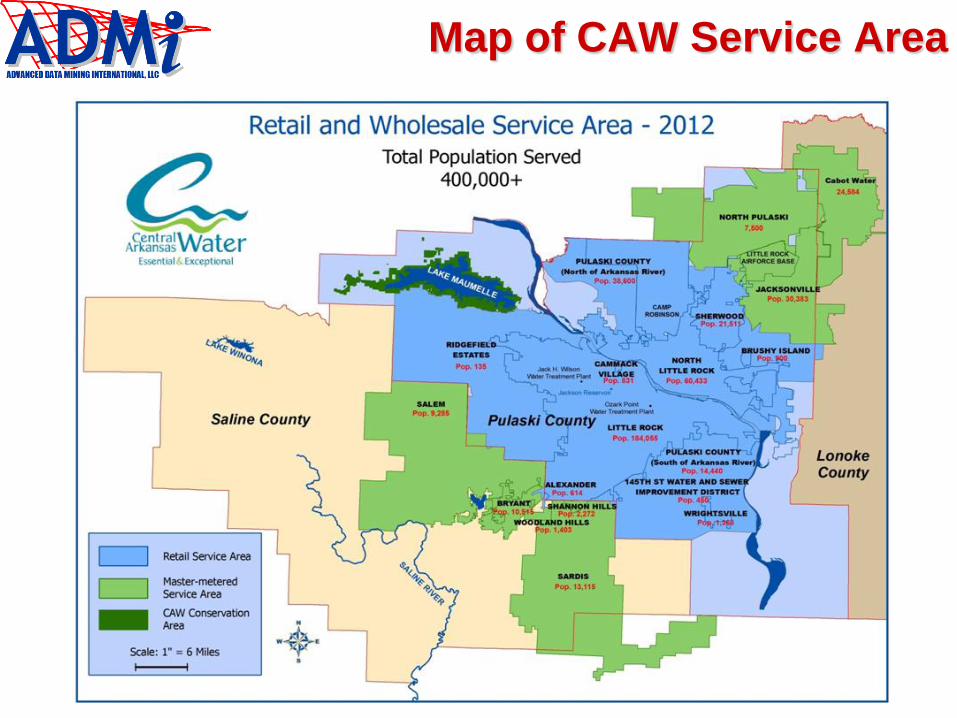
Map of CAW Service Area
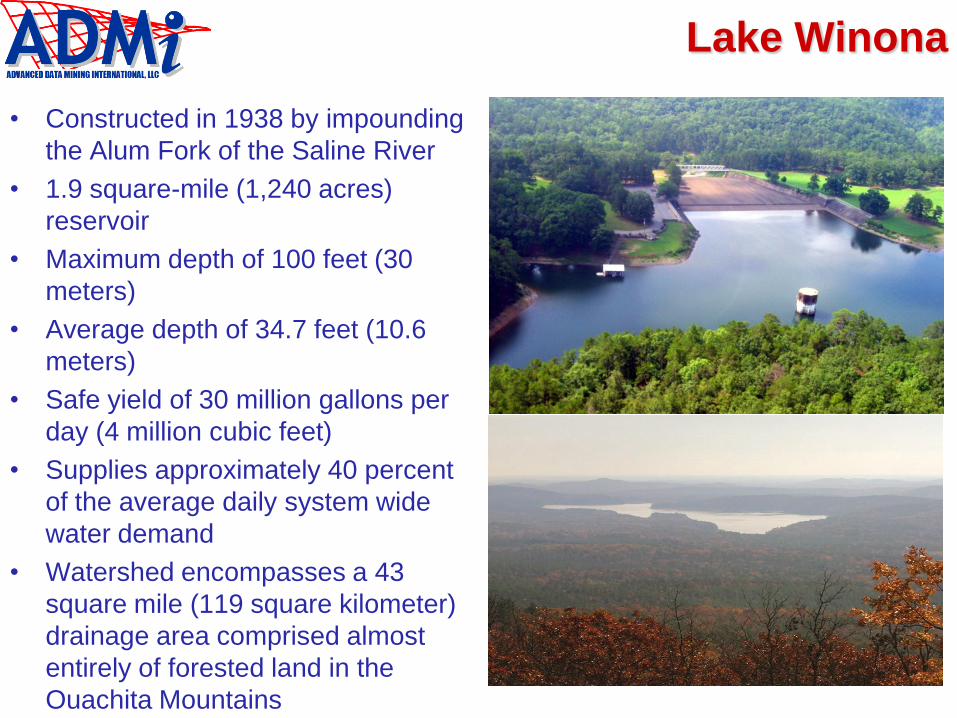
Lake Winona
• Constructed in 1938 by impounding
the Alum Fork of the Saline River
• 1.9 square-mile (1,240 acres)
reservoir
• Maximum depth of 100 feet (30
meters)
• Average depth of 34.7 feet (10.6
meters)
• Safe yield of 30 million gallons per
day (4 million cubic feet)
• Supplies approximately 40 percent
of the average daily system wide
water demand
• Watershed encompasses a 43
square mile (119 square kilometer)
drainage area comprised almost
entirely of forested land in the
Ouachita Mountains
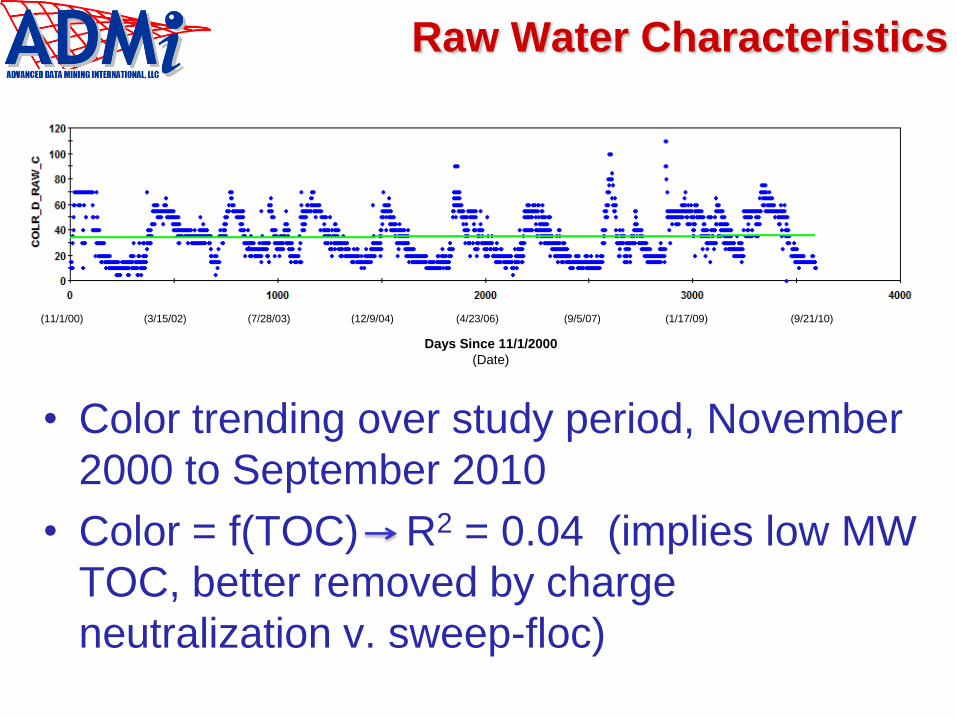
Raw Water Characteristics
• Color trending over study period, November
2000 to September 2010
• Color = f(TOC) R2 = 0.04 (implies low MW
TOC, better removed by charge
neutralization v. sweep-floc)
(7/28/03) (11/1/00) (4/23/06) (1/17/09) (9/21/10) (3/15/02) (12/9/04) (9/5/07)
Days Since 11/1/2000
(Date)
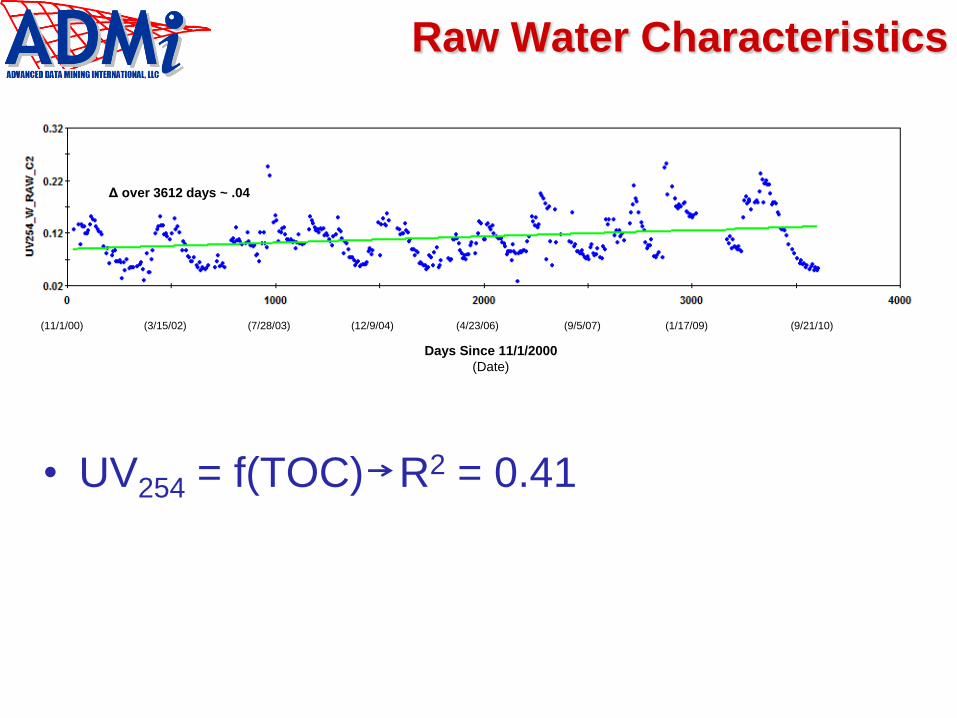
Raw Water Characteristics
• UV254 = f(TOC) R2 = 0.41
Δ over 3612 days ~ .04
(7/28/03) (11/1/00) (4/23/06) (1/17/09) (9/21/10) (3/15/02) (12/9/04) (9/5/07)
Days Since 11/1/2000
(Date)
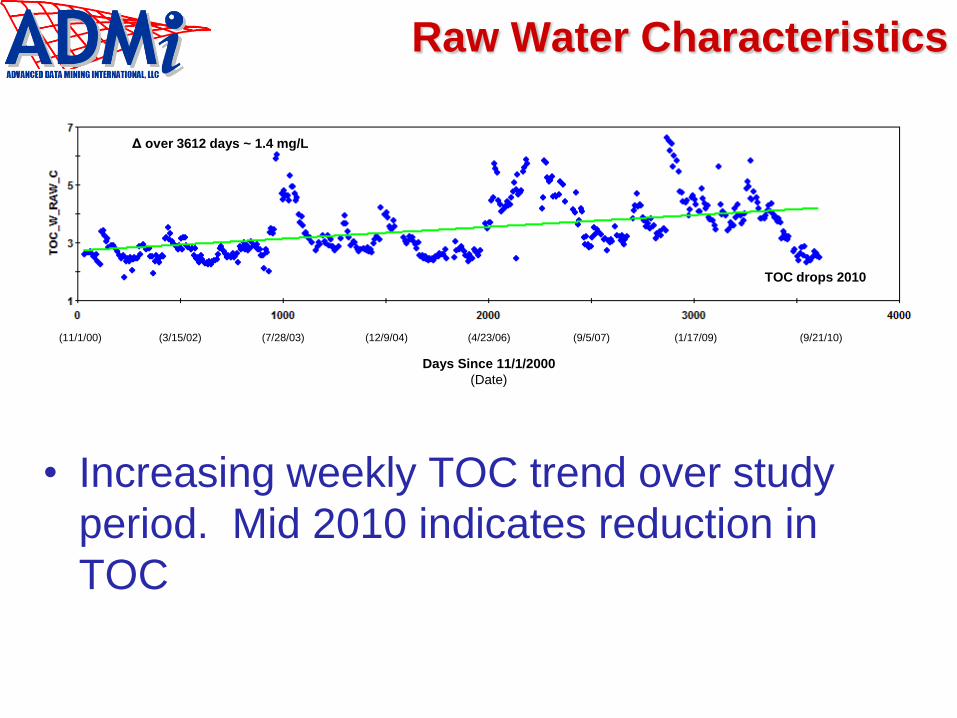
Raw Water Characteristics
• Increasing weekly TOC trend over study
period. Mid 2010 indicates reduction in
TOC
Δ over 3612 days ~ 1.4 mg/L
(7/28/03) (11/1/00) (4/23/06) (1/17/09) (9/21/10)
Days Since 11/1/2000
(Date)
(3/15/02) (12/9/04) (9/5/07)
TOC drops 2010
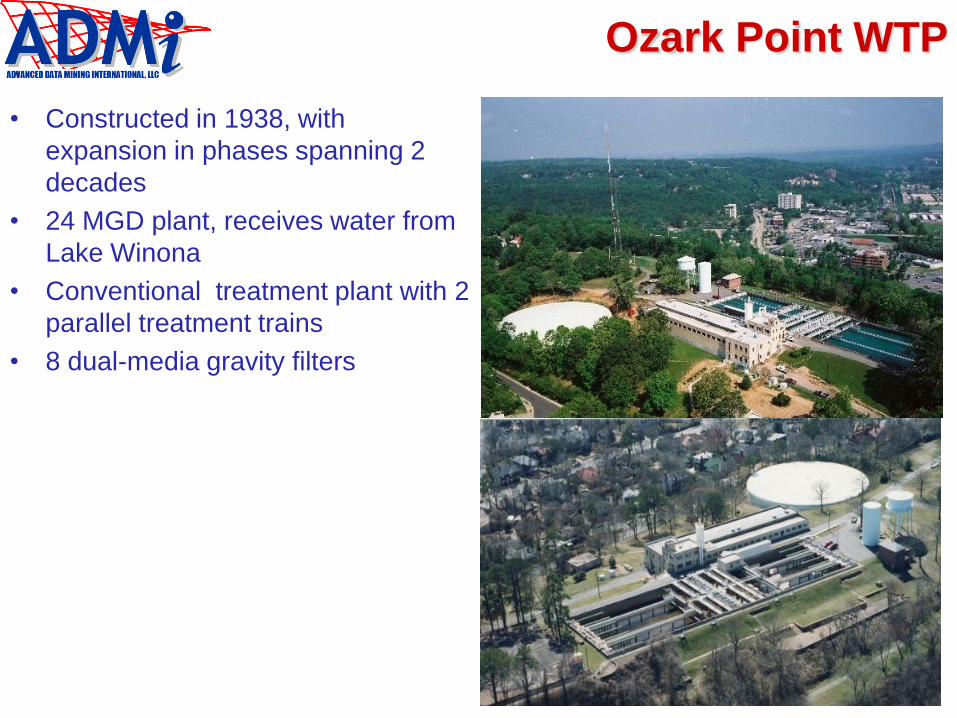
Ozark Point WTP
• Constructed in 1938, with
expansion in phases spanning 2
decades
• 24 MGD plant, receives water from
Lake Winona
• Conventional treatment plant with 2
parallel treatment trains
• 8 dual-media gravity filters

Technical Approach
13

Artificial Neural Networks (ANNs)
Multi-layer perceptron Artificial Neural Network(ANN)
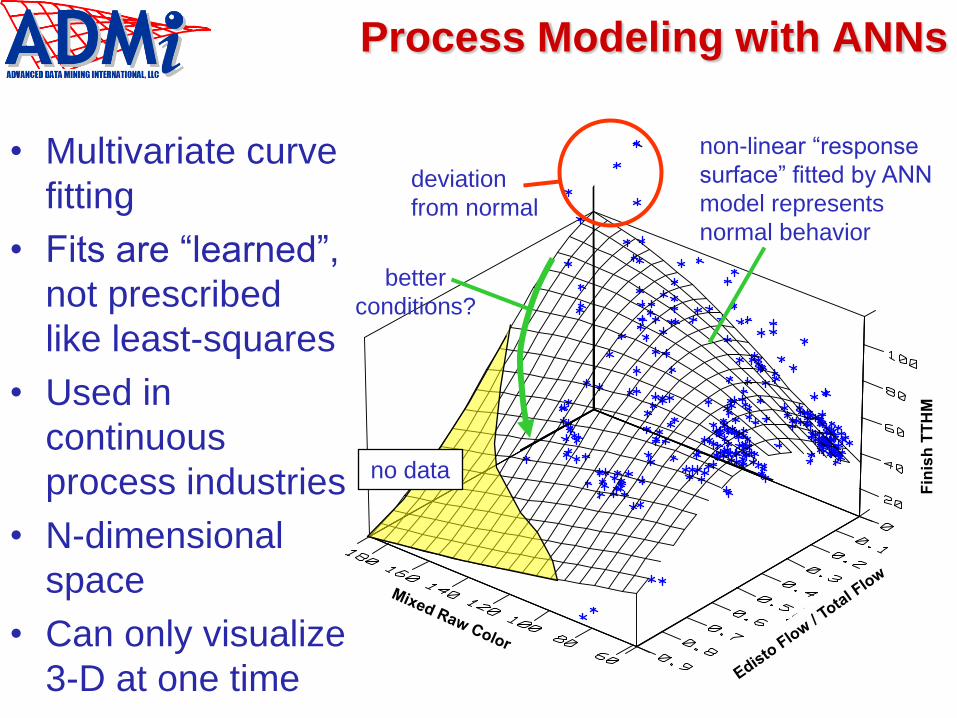
Process Modeling with ANNs
• Multivariate curve
fitting
• Fits are “learned”,
not prescribed
like least-squares
• Used in
continuous
process industries
• N-dimensional
space
• Can only visualize
3-D at one time
no data
non-linear “response
surface” fitted by ANN
model represents
normal behavior
deviation
from normal
better
conditions?
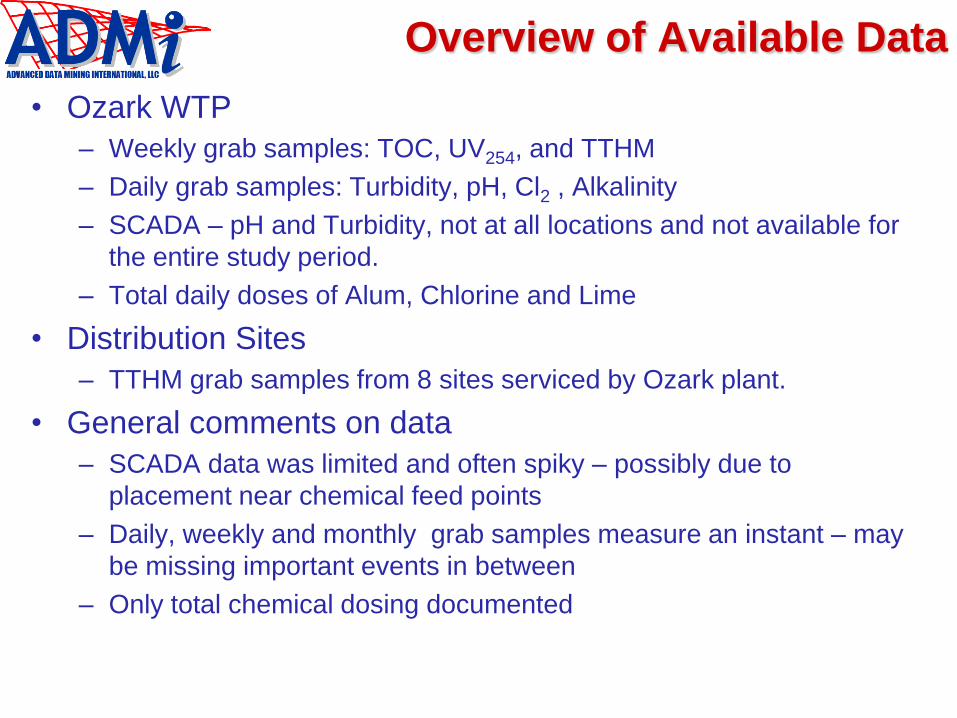
Overview of Available Data
• Ozark WTP
– Weekly grab samples: TOC, UV254, and TTHM
– Daily grab samples: Turbidity, pH, Cl2 , Alkalinity
– SCADA – pH and Turbidity, not at all locations and not available for
the entire study period.
– Total daily doses of Alum, Chlorine and Lime
• Distribution Sites
– TTHM grab samples from 8 sites serviced by Ozark plant.
• General comments on data
– SCADA data was limited and often spiky – possibly due to
placement near chemical feed points
– Daily, weekly and monthly grab samples measure an instant – may
be missing important events in between
– Only total chemical dosing documented
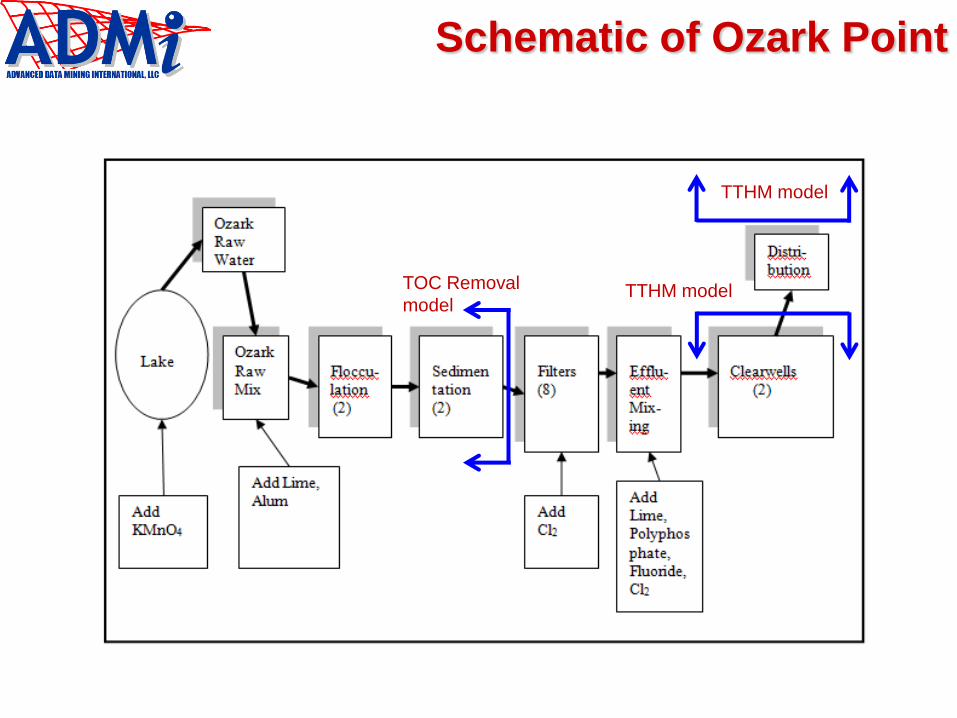
Schematic of Ozark Point
TOC Removal
model
TTHM model
TTHM model

TOC REMOVAL
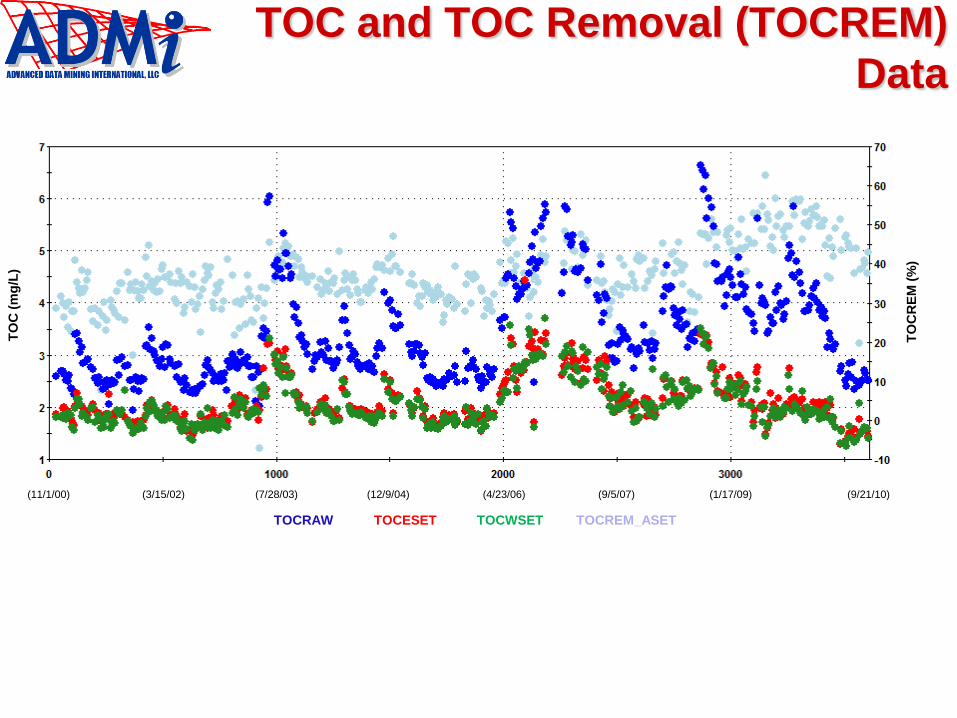
TOC and TOC Removal (TOCREM)
Data
TOCRAW TOCESET TOCWSET TOCREM_ASET
(7/28/03) (11/1/00) (4/23/06) (1/17/09) (9/21/10) (3/15/02) (12/9/04) (9/5/07)
TO
C (
mg
/L)
TO
CR
EM
(%
)
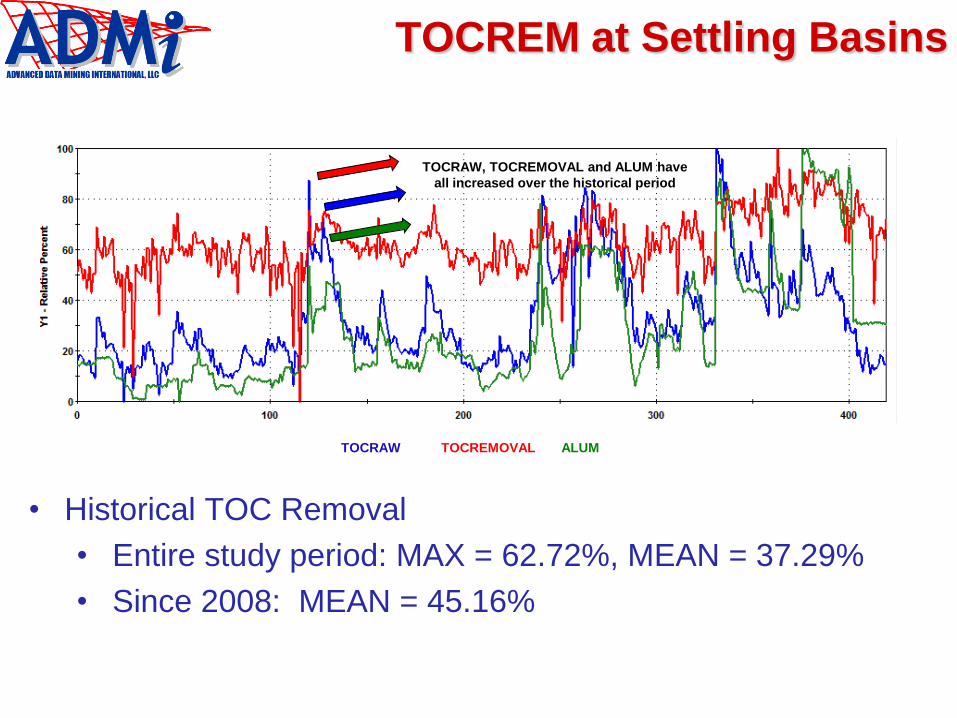
TOCREM at Settling Basins
TOCRAW TOCREMOVAL ALUM
TOCRAW, TOCREMOVAL and ALUM have
all increased over the historical period
• Historical TOC Removal
• Entire study period: MAX = 62.72%, MEAN = 37.29%
• Since 2008: MEAN = 45.16%
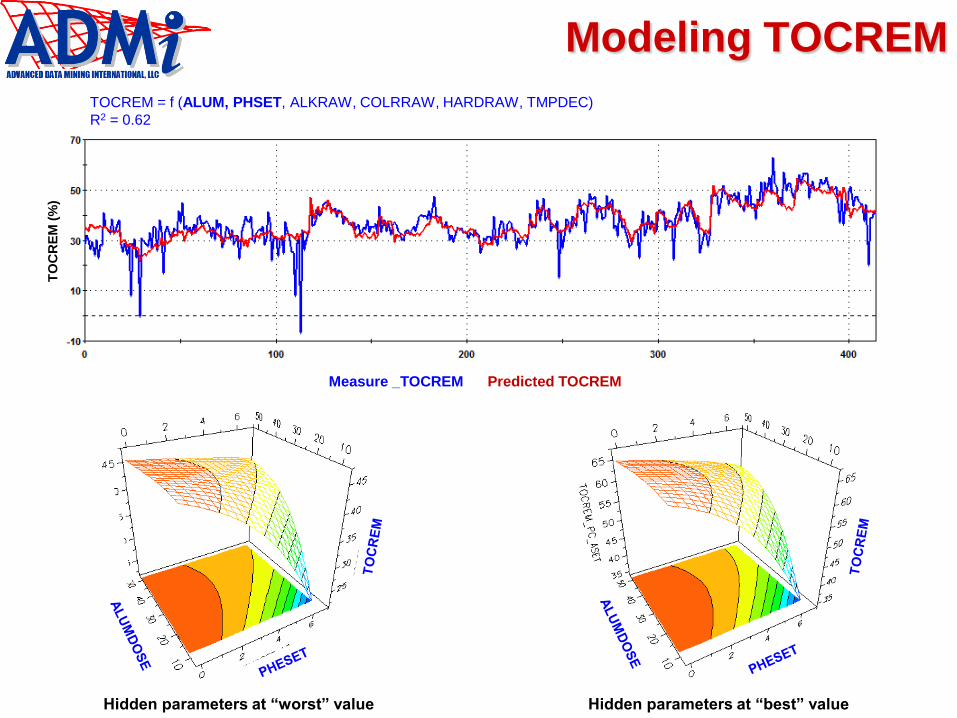
Modeling TOCREM
Measure _TOCREM Predicted TOCREM
TO
CR
EM
(%
)
TOCREM = f (ALUM, PHSET, ALKRAW, COLRRAW, HARDRAW, TMPDEC)
R2 = 0.62
Hidden parameters at “worst” value Hidden parameters at “best” value
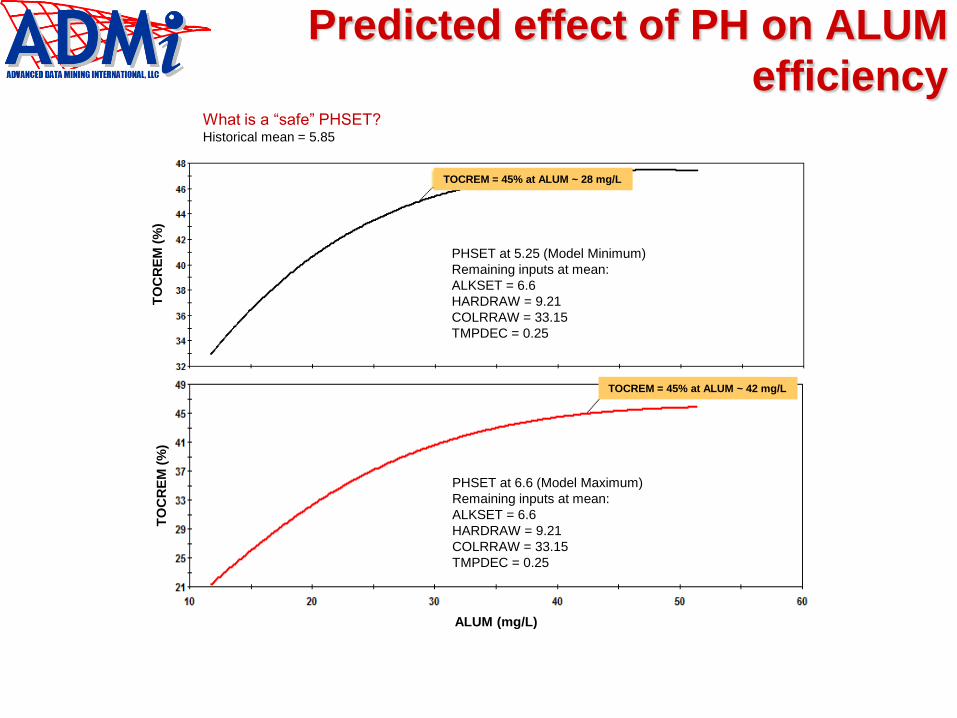
Predicted effect of PH on ALUM
efficiency
PHSET at 5.25 (Model Minimum)
Remaining inputs at mean:
ALKSET = 6.6
HARDRAW = 9.21
COLRRAW = 33.15
TMPDEC = 0.25
PHSET at 6.6 (Model Maximum)
Remaining inputs at mean:
ALKSET = 6.6
HARDRAW = 9.21
COLRRAW = 33.15
TMPDEC = 0.25
TO
CR
EM
(%
) T
OC
RE
M (
%)
ALUM (mg/L)
TOCREM = 45% at ALUM ~ 42 mg/L
TOCREM = 45% at ALUM ~ 28 mg/L
What is a “safe” PHSET? Historical mean = 5.85
TTHMs
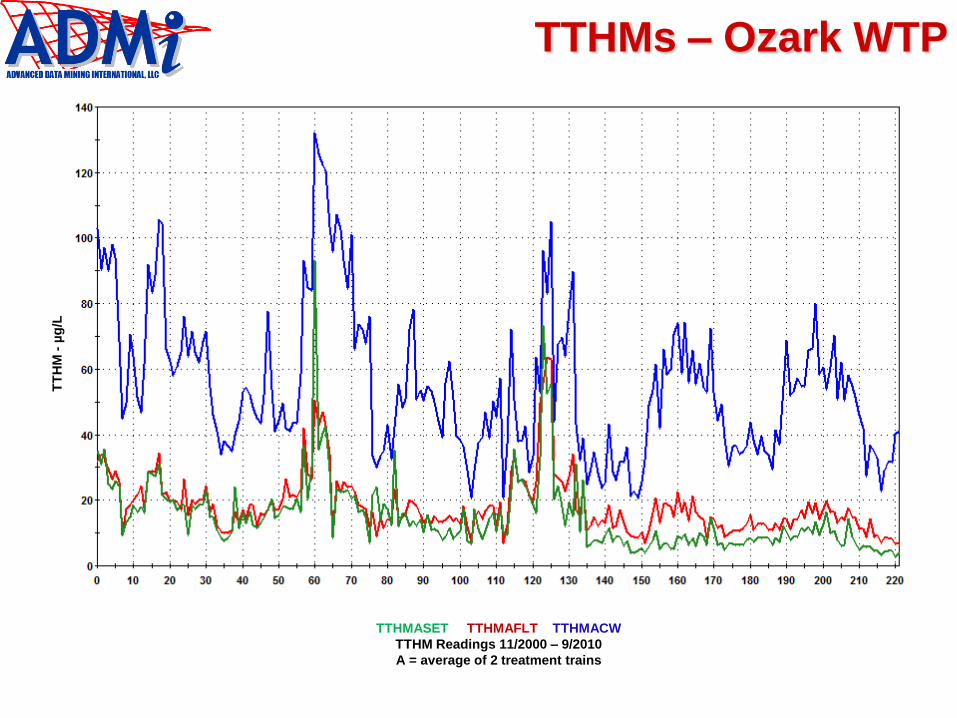
TTHMs – Ozark WTP T
TH
M -
µg
/L
TTHMASET TTHMAFLT TTHMACW
TTHM Readings 11/2000 – 9/2010
A = average of 2 treatment trains
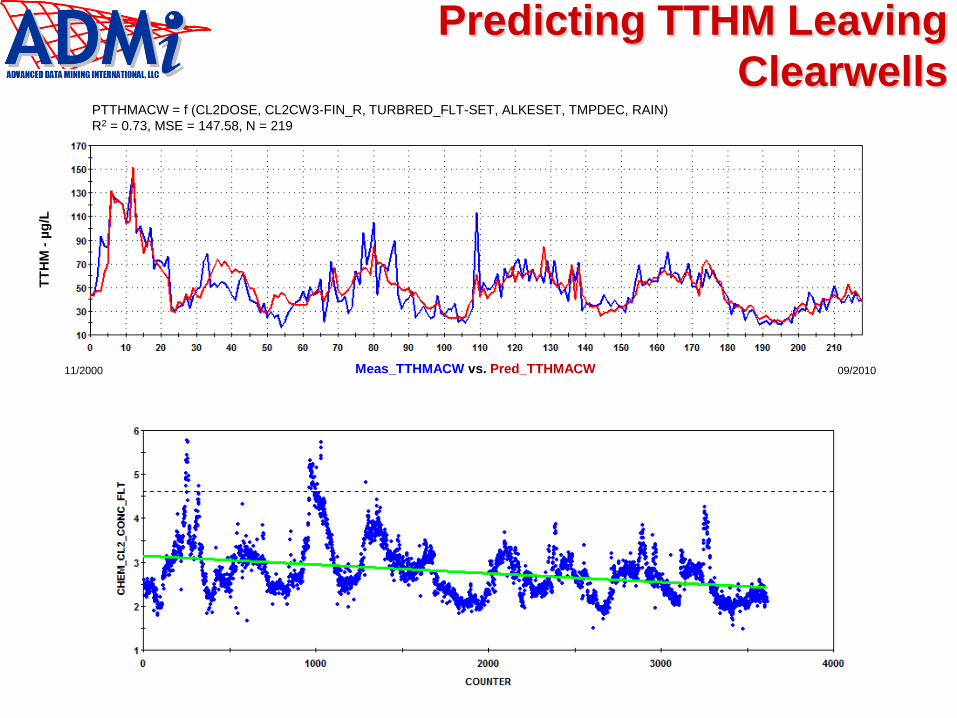
Predicting TTHM Leaving
Clearwells PTTHMACW = f (CL2DOSE, CL2CW3-FIN_R, TURBRED_FLT-SET, ALKESET, TMPDEC, RAIN)
R2 = 0.73, MSE = 147.58, N = 219
Meas_TTHMACW vs. Pred_TTHMACW
TT
HM
- µ
g/L
11/2000 09/2010

THM Formation Sensitivity to
Temperature
To temperature minimum and maximum [≈ 20 µg/L ]
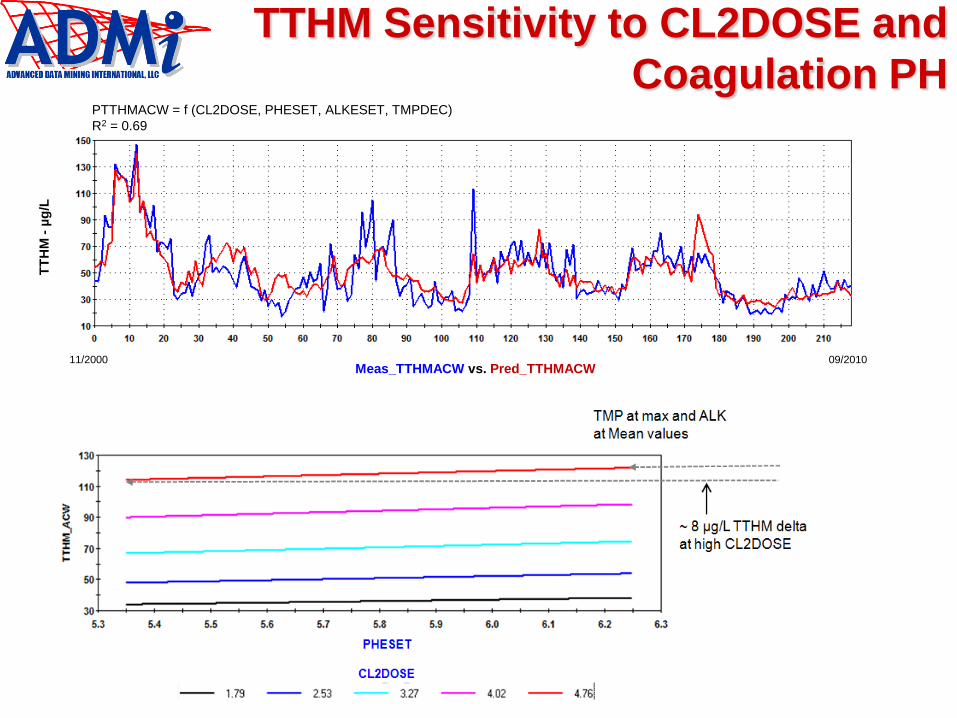
TTHM Sensitivity to CL2DOSE and
Coagulation PH PTTHMACW = f (CL2DOSE, PHESET, ALKESET, TMPDEC)
R2 = 0.69
Meas_TTHMACW vs. Pred_TTHMACW
TT
HM
- µ
g/L
11/2000 09/2010
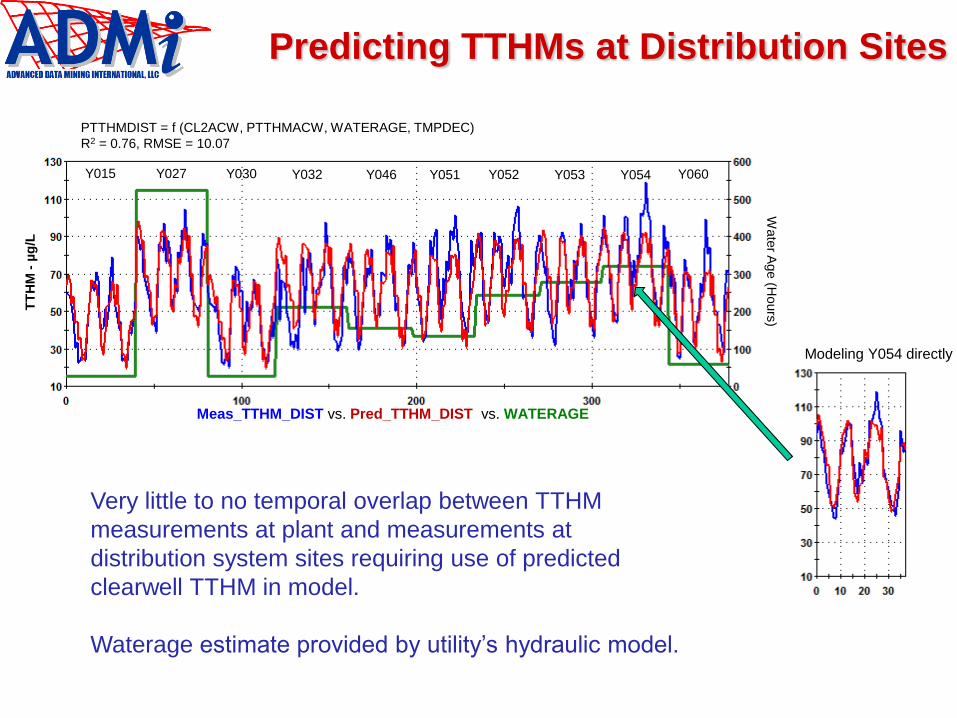
Predicting TTHMs at Distribution Sites T
TH
M -
µg
/L
PTTHMDIST = f (CL2ACW, PTTHMACW, WATERAGE, TMPDEC)
R2 = 0.76, RMSE = 10.07
Meas_TTHM_DIST vs. Pred_TTHM_DIST vs. WATERAGE
Wate
r Age (H
ours
) Y015 Y027 Y030 Y032 Y046 Y051 Y052 Y053 Y054 Y060
Modeling Y054 directly
Very little to no temporal overlap between TTHM
measurements at plant and measurements at
distribution system sites requiring use of predicted
clearwell TTHM in model.
Waterage estimate provided by utility’s hydraulic model.
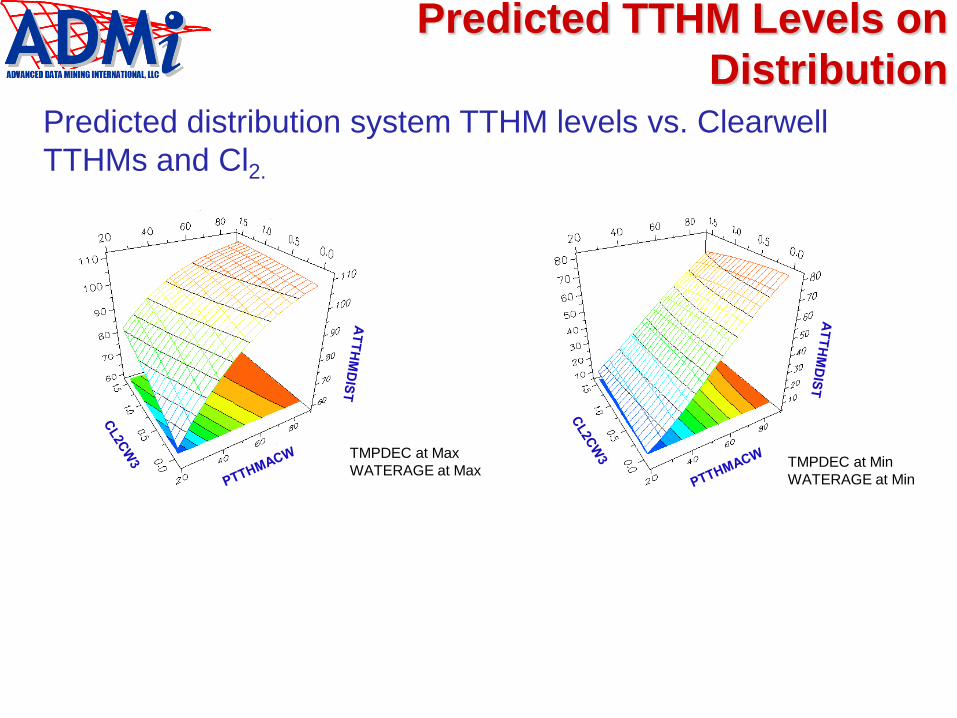
Predicted TTHM Levels on
Distribution
TMPDEC at Max
WATERAGE at Max TMPDEC at Min
WATERAGE at Min
Predicted distribution system TTHM levels vs. Clearwell
TTHMs and Cl2.
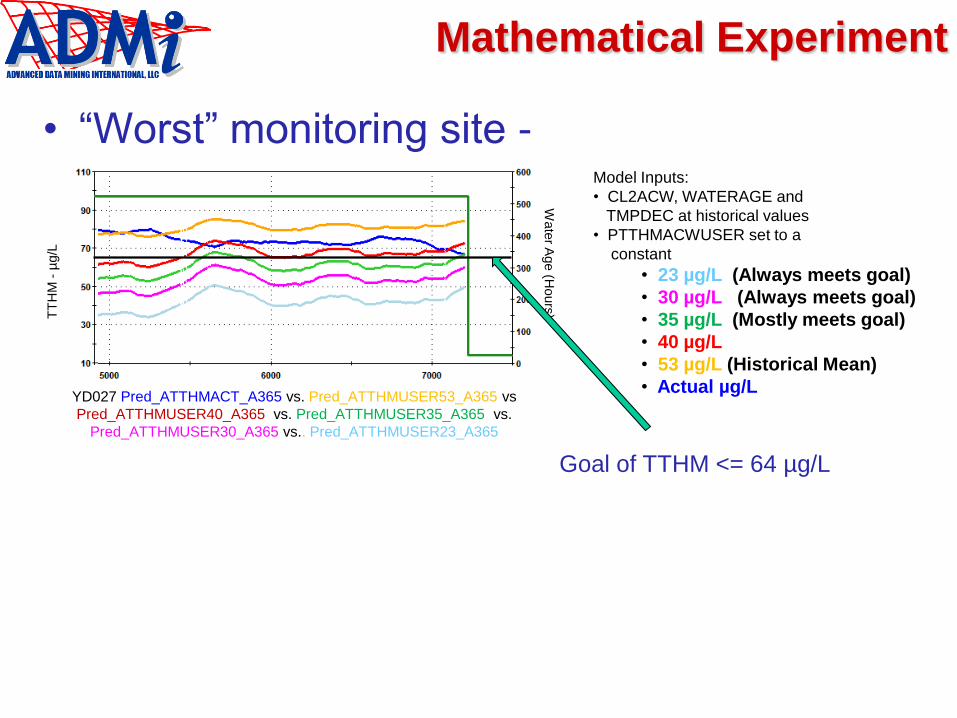
Mathematical Experiment
• “Worst” monitoring site - Model Inputs:
• CL2ACW, WATERAGE and
TMPDEC at historical values
• PTTHMACWUSER set to a
constant
• 23 µg/L (Always meets goal)
• 30 µg/L (Always meets goal)
• 35 µg/L (Mostly meets goal)
• 40 µg/L
• 53 µg/L (Historical Mean)
• Actual µg/L
TT
HM
- µ
g/L
Wate
r Age (H
ours
) YD027 Pred_ATTHMACT_A365 vs. Pred_ATTHMUSER53_A365 vs
Pred_ATTHMUSER40_A365 vs. Pred_ATTHMUSER35_A365 vs.
Pred_ATTHMUSER30_A365 vs.. Pred_ATTHMUSER23_A365
Goal of TTHM <= 64 µg/L
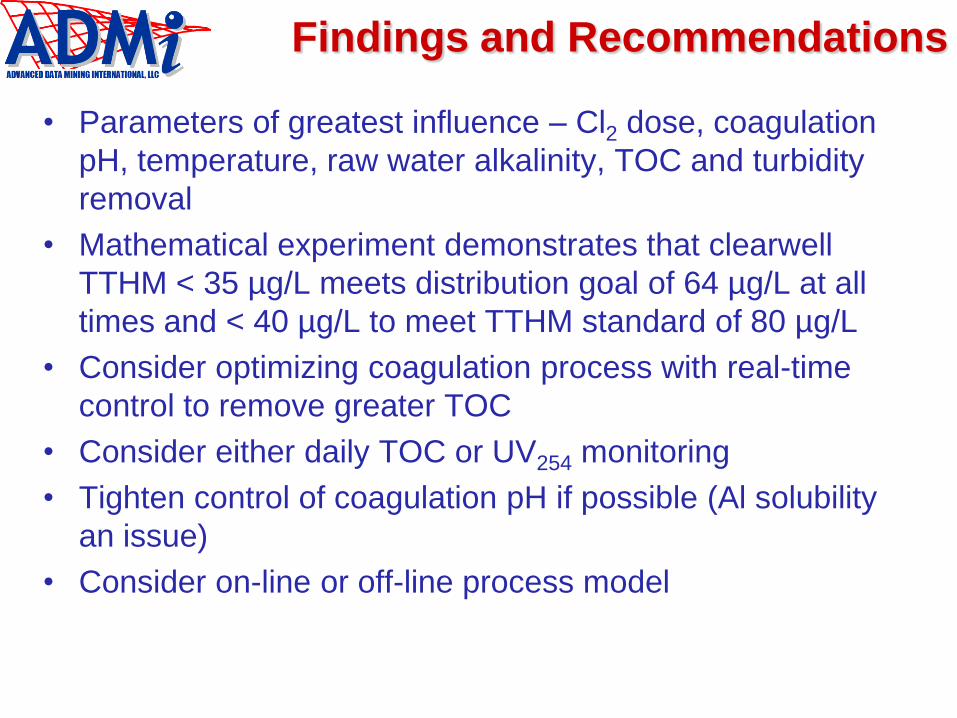
Findings and Recommendations
• Parameters of greatest influence – Cl2 dose, coagulation
pH, temperature, raw water alkalinity, TOC and turbidity
removal
• Mathematical experiment demonstrates that clearwell
TTHM < 35 µg/L meets distribution goal of 64 µg/L at all
times and < 40 µg/L to meet TTHM standard of 80 µg/L
• Consider optimizing coagulation process with real-time
control to remove greater TOC
• Consider either daily TOC or UV254 monitoring
• Tighten control of coagulation pH if possible (Al solubility
an issue)
• Consider on-line or off-line process model
Possible applications in a WTP
• Understanding and better controlling:
– Turbidity removal
– Filter optimization
– Chemical feed optimization
– Energy usage optimization
– Weather effects on treatment performance
– Predicting incipient nitrification
– Predicting incipient taste and odor problems
– Minimizing TTHM, HAA or other DBPs
– Etc.

Thanks for Your Attention!
For further information:
Sharon Sweeney:
John Cook:
Ruby Daamen:
Top Related