


Languages
Pages
Legal


Topographic Map Design Topographic Map Design and Layoutand Layout
Presented by:Presented by:Khlaraj Chouhan (15)Khlaraj Chouhan (15)
Keshebnath Kattel (3)Keshebnath Kattel (3)Kailashnath Pandey (1)Kailashnath Pandey (1)
Roshani Sharma (2)Roshani Sharma (2)

Presentation OutlinesPresentation Outlines Definition of topographic maps.Definition of topographic maps. Contents of topographic maps.Contents of topographic maps. Design ProcessDesign Process Map LayoutMap Layout
05/01/2305/01/23 22
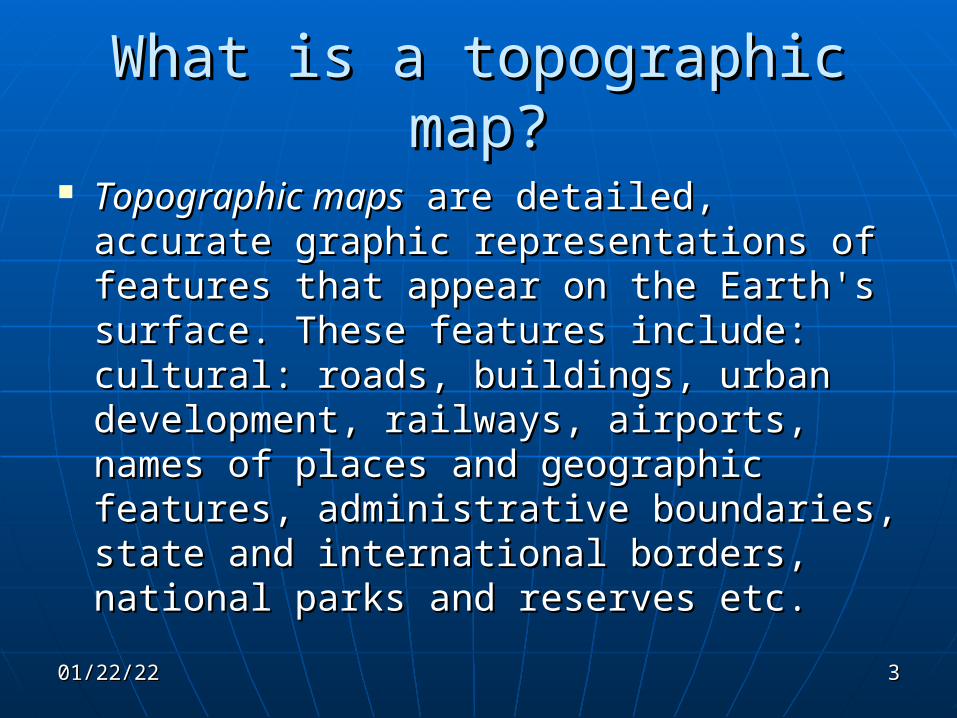
What is a topographic map?What is a topographic map? Topographic mapsTopographic maps are detailed, accurate are detailed, accurate
graphic representations of features that graphic representations of features that appear on the Earth's surface. These appear on the Earth's surface. These features include: cultural: roads, buildings, features include: cultural: roads, buildings, urban development, railways, airports, urban development, railways, airports, names of places and geographic features, names of places and geographic features, administrative boundaries, state and administrative boundaries, state and international borders, national parks and international borders, national parks and reserves etc.reserves etc.
05/01/2305/01/23 33
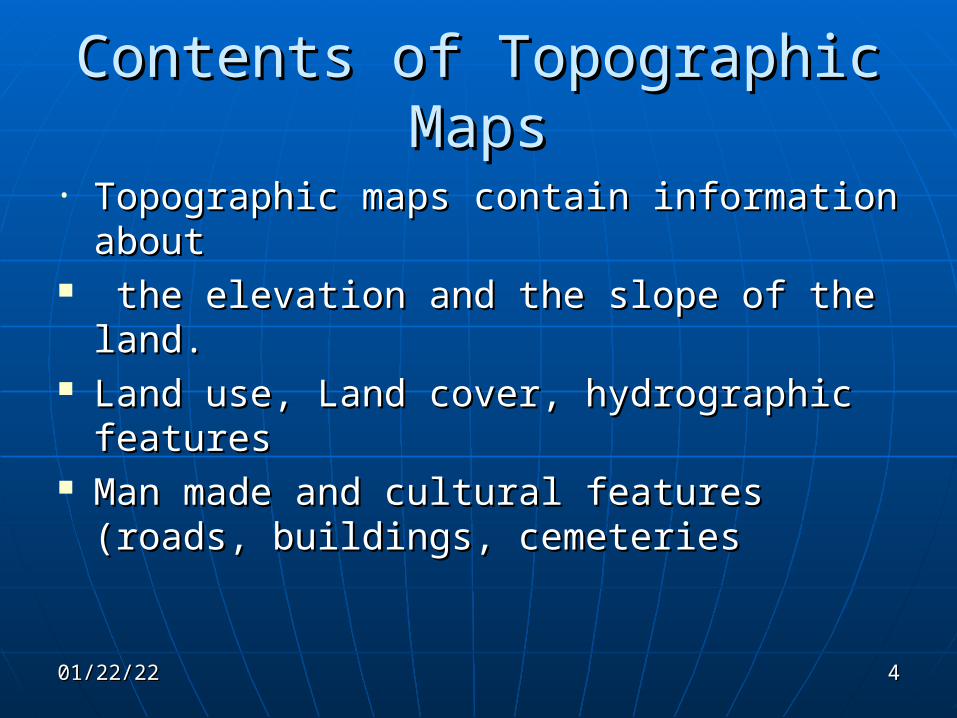
Contents of Topographic MapsContents of Topographic Maps• Topographic maps contain information Topographic maps contain information
about about the elevation and the slope of the land. the elevation and the slope of the land. Land use, Land cover, hydrographic Land use, Land cover, hydrographic
featuresfeatures Man made and cultural features (roads, Man made and cultural features (roads,
buildings, cemeteriesbuildings, cemeteries
05/01/2305/01/23 44

05/01/2305/01/23 55
05/01/2305/01/23 66

Other Topographic TermsOther Topographic Terms Map scale – compares distances on Map scale – compares distances on
the map with distances on earth.the map with distances on earth. Legend – explains symbols used on Legend – explains symbols used on
the map.the map. Index contours – contour lines that Index contours – contour lines that
are labeled to help you find the are labeled to help you find the contour interval.contour interval.
05/01/2305/01/23 77

05/01/2305/01/23 88

What do the colors on the topographic What do the colors on the topographic map represent?map represent?
General Thumb Rules:General Thumb Rules:• Blue lines/shapes - represent water Blue lines/shapes - represent water
features, such as streams and lakes.features, such as streams and lakes.• Brown – contour linesBrown – contour lines• Black – special buildings, railroads, other Black – special buildings, railroads, other
man made objects.man made objects.• Green – Woodland areasGreen – Woodland areas• Red – Transportation layer, BuildingsRed – Transportation layer, Buildings• Yellow – cultivated landYellow – cultivated land
05/01/2305/01/23 99

Now that I know what a topographic Now that I know what a topographic map is, how do I read it?map is, how do I read it?
First determine the contour interval First determine the contour interval (the distance between each contour (the distance between each contour line)line)
Then determine the map scale Then determine the map scale (usually at the bottom of the map)(usually at the bottom of the map)
Identify any hills or depressionsIdentify any hills or depressions Use the legend to identify man made Use the legend to identify man made
features.features.05/01/2305/01/23 1010
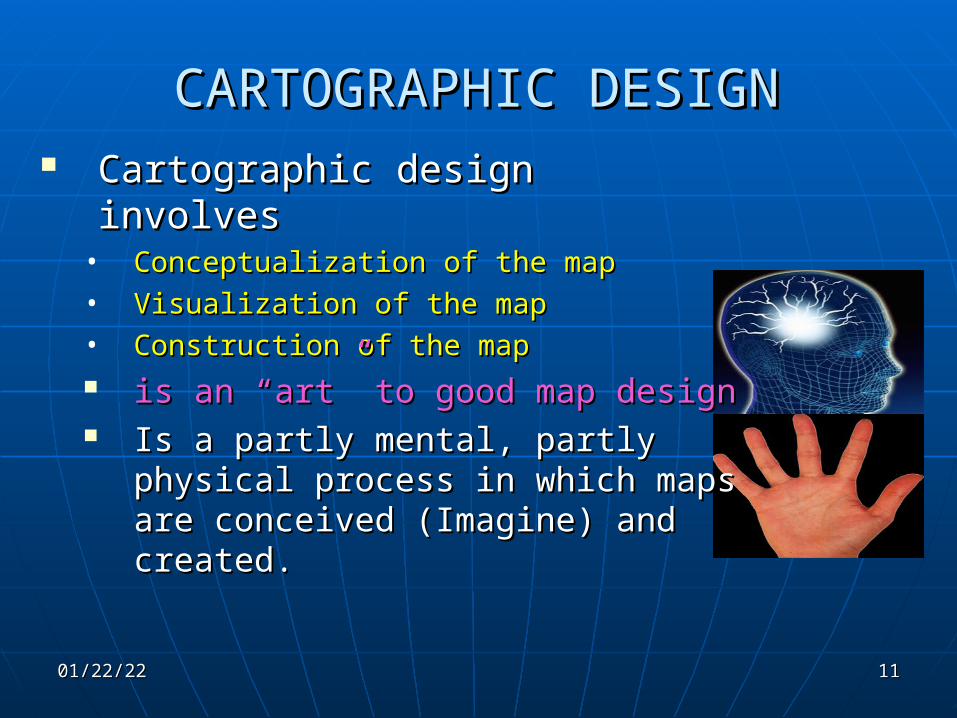
CARTOGRAPHIC DESIGNCARTOGRAPHIC DESIGN Cartographic design involves Cartographic design involves
• Conceptualization of the mapConceptualization of the map• Visualization of the mapVisualization of the map• Construction of the mapConstruction of the map is an “art” to good map designis an “art” to good map design Is a partly mental, partly Is a partly mental, partly
physical process in which maps physical process in which maps are conceived (Imagine) and are conceived (Imagine) and created.created.
05/01/2305/01/23 1111
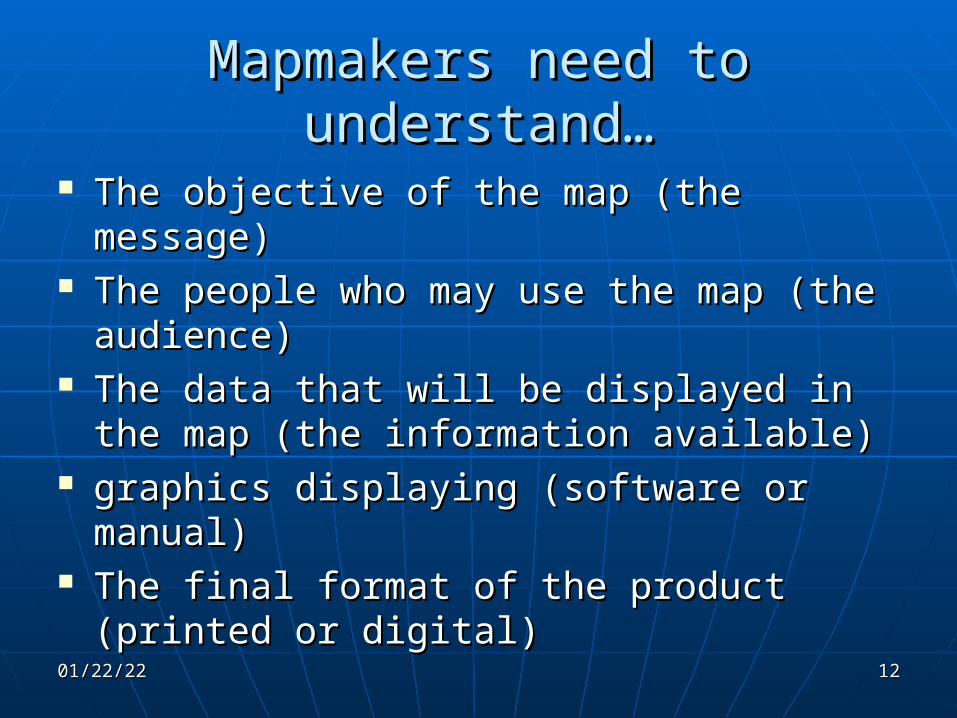
Mapmakers need to understand…Mapmakers need to understand… The objective of the map (the message)The objective of the map (the message) The people who may use the map (the The people who may use the map (the
audience)audience) The data that will be displayed in the map The data that will be displayed in the map
(the information available)(the information available) graphics displaying (software or manual) graphics displaying (software or manual) The final format of the product (printed or The final format of the product (printed or
digital)digital)
05/01/2305/01/23 1212
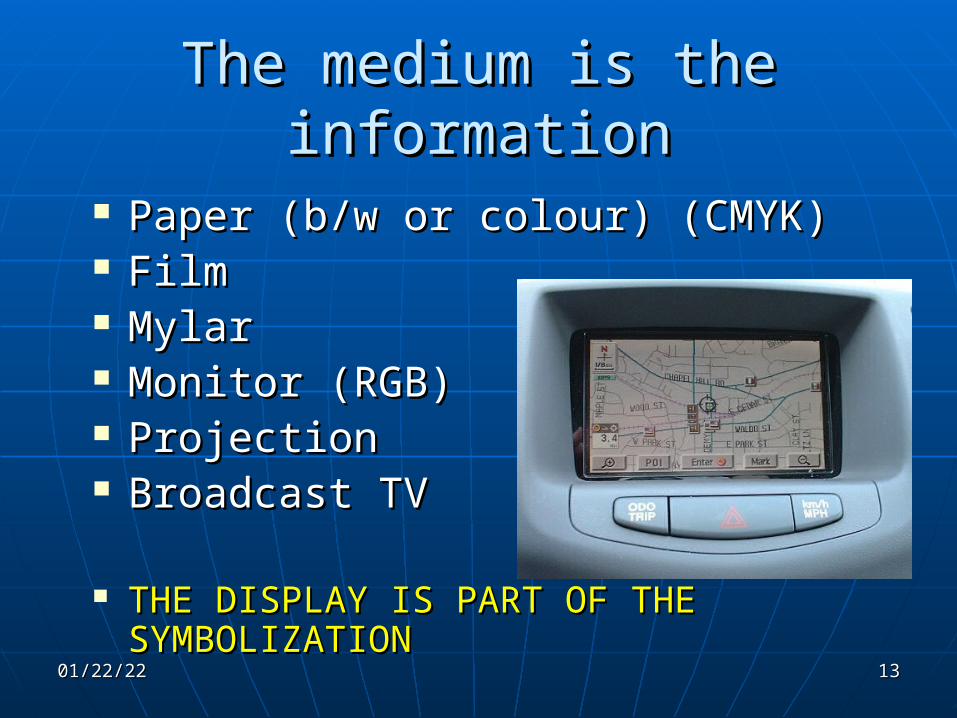
The medium is the informationThe medium is the information
PaperPaper (b/w or colour) (CMYK) (b/w or colour) (CMYK) FilmFilm MylarMylar Monitor (RGB)Monitor (RGB) ProjectionProjection Broadcast TVBroadcast TV
THE DISPLAY IS PART OF THE THE DISPLAY IS PART OF THE SYMBOLIZATIONSYMBOLIZATION
05/01/2305/01/23 1313

Design ProcessDesign Process Involves a series of operations.Involves a series of operations. It is convenient to break this It is convenient to break this
sequence into three stages: First sequence into three stages: First stage, Second stage and Third stage.stage, Second stage and Third stage.
05/01/2305/01/23 1414

First StageFirst Stage
Several acceptable solutions are possible for Several acceptable solutions are possible for graphic visualization and symbolization.graphic visualization and symbolization.
The best result is a general design planThe best result is a general design plan ““Good design is simply the best solution Good design is simply the best solution
among many, given a set of constraints among many, given a set of constraints imposed by the problem” (Dent 1999)imposed by the problem” (Dent 1999)
05/01/2305/01/23 1515
Second StageSecond Stage Develop specific graphic planDevelop specific graphic plan analyzing various alternatives and choose analyzing various alternatives and choose
the best one. the best one. Decide on kinds of symbolism, number of Decide on kinds of symbolism, number of
classes and class limits, color use, classes and class limits, color use, typographical relationships etc.typographical relationships etc.
You have made all but minor decisions in You have made all but minor decisions in this stage.this stage.
05/01/2305/01/23 1616

Third StageThird Stage Preparation of detail specifications for map Preparation of detail specifications for map
construction (automated or manual) construction (automated or manual) • About symbols, line weights, colors, lettering About symbols, line weights, colors, lettering
sizes etc.sizes etc. Specifications: all the processes involved Specifications: all the processes involved
in map construction.in map construction.
05/01/2305/01/23 1717

Design PrinciplesDesign Principles
1.1. LegibilityLegibility2.2. Visual ContrastVisual Contrast3.3. Figure-groundFigure-ground4.4. Hierarchical structureHierarchical structure5.5. BalanceBalance
05/01/2305/01/23 1818

LegibilityLegibility easy to read and understand. (symbols) easy to read and understand. (symbols) Clearly visible. (Size, color, line weight)Clearly visible. (Size, color, line weight) Identify them clearly.Identify them clearly. Not be confusing. (symbol, line, shape)Not be confusing. (symbol, line, shape) clearly distinguishable. (used size, colors, clearly distinguishable. (used size, colors,
patterns to differentiate)patterns to differentiate) Not, too small or too big. (Symbols)Not, too small or too big. (Symbols) contrasting colors and shapescontrasting colors and shapes
05/01/2305/01/23 1919
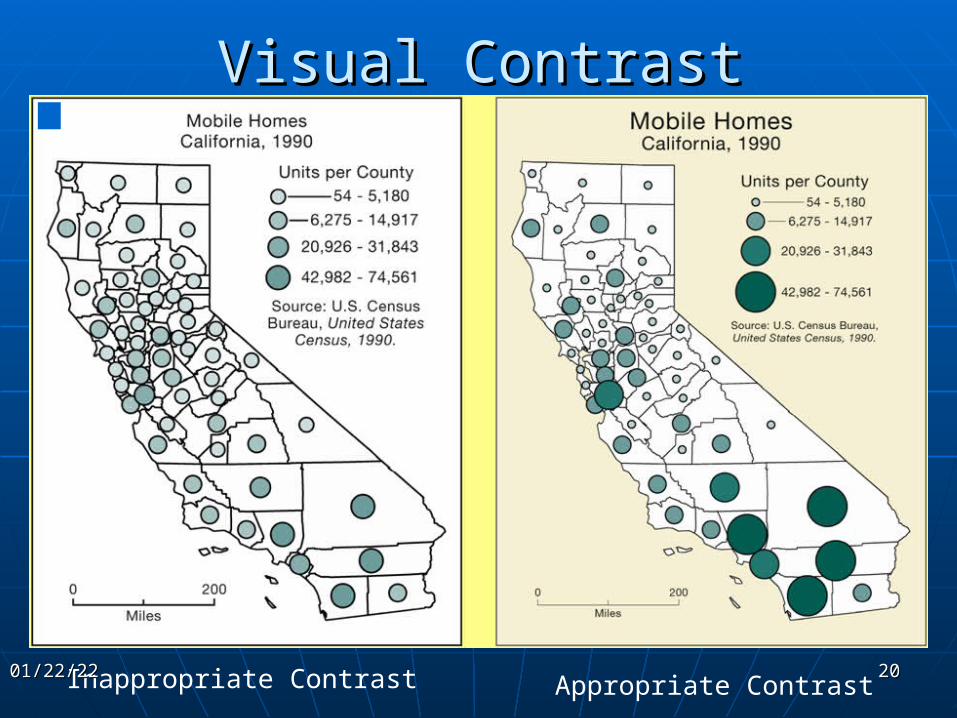
Inappropriate Contrast Appropriate Contrast
Visual ContrastVisual Contrast
05/01/2305/01/23 2020

Example of good Example of good line contrast line contrast
Example of poor line contrast
Visual ContrastVisual Contrast
05/01/2305/01/23 2121

Visual ContrastVisual ContrastLine weight Pattern Shading Hue
HUE
INTENSITYINTENSITY
SATURATION
05/01/2305/01/23 2222

Figure-Ground OrganizationFigure-Ground Organization Separation figure and map background Separation figure and map background
clearly.clearly. It is natural and fundamental characteristics It is natural and fundamental characteristics
of graphic map design.of graphic map design. Differentiation (shape, size, color) Closed forms Familiarity Lightness Detail Size (small and big size of area feature)
05/01/2305/01/23 2323

Figure ‘floating’ Figure ‘floating’ on top on Groundon top on Ground
Superimposition Superimposition draws attention to draws attention to
FigureFigure
Figure-Ground OrganizationFigure-Ground Organization
05/01/2305/01/23 2424

Lack of contrast resulting Lack of contrast resulting in poor figure-ground in poor figure-ground
perceptionperception
Better contrast resulting in good figure-ground
perception
Figure-Ground OrganizationFigure-Ground Organization
05/01/2305/01/23 2525

Hierarchical organization (visual hierarchy)Hierarchical organization (visual hierarchy) “separate meaningful characteristics and to
portray likenesses, differences, and interrelationships” (Robinson, 1995).
ContrastContrast• Line character and weightLine character and weight• TextureTexture• ValueValue• DetailDetail• ColorColor• TextText
05/01/2305/01/23 2626

Name Placement and AttributesName Placement and Attributes
Need to consider the most effective Need to consider the most effective way of positioning type on a map way of positioning type on a map • Labeling Point SymbolsLabeling Point Symbols• Labeling Linear FeaturesLabeling Linear Features• Labeling AreasLabeling Areas• Title and Legend textTitle and Legend text• Other informationOther information
05/01/2305/01/23 2727
BalanceBalance

Text: Selection and PlacementText: Selection and Placement
Dhulikhel
BM 232
UK M
arga
200
L ak e
M u d
POINT LINE AREAC
A
NV
05/01/2305/01/23 2828

Map layoutMap layout for presentation maps, some conventions on for presentation maps, some conventions on
what to include:what to include:• a title (or caption). clearly state what the map a title (or caption). clearly state what the map
shows. plus relevant date of data, sources, shows. plus relevant date of data, sources, author, contact info, etc.author, contact info, etc.
• a legend, so any reader can interpret the content a legend, so any reader can interpret the content of the map. meaning of all symbol and colours of the map. meaning of all symbol and colours
• scale indication. translates distance on the map scale indication. translates distance on the map to distance on the groundto distance on the ground
• orientation indication (the good old north arrow)orientation indication (the good old north arrow)• borders and neat lines, grid and graticule valueborders and neat lines, grid and graticule value
these conventions are truly follow or broken!these conventions are truly follow or broken!05/01/2305/01/23 2929

3030
Basic Map ElementsBasic Map Elements
The Development regions of Nepal
Scale 1: 500, 000
Modified Universal Transverse Mercator ProjectionThis map is produced in 1995 by Survey Department, Nepal
0 41 2 3hundreds ofkilometers
Legend
Map Scale Graphical Scale
Inset
Map Projection
Neat line Border Title
Central Development region.
Map Index A B
Map Scale Representative Fraction
Map Body
North Arrow
Bibliographic information

Optical Center vs. Geometric CenterOptical Center vs. Geometric Center
Optical Center
Geometric Center
Balance and centreBalance and centre
05/01/2305/01/23 3131
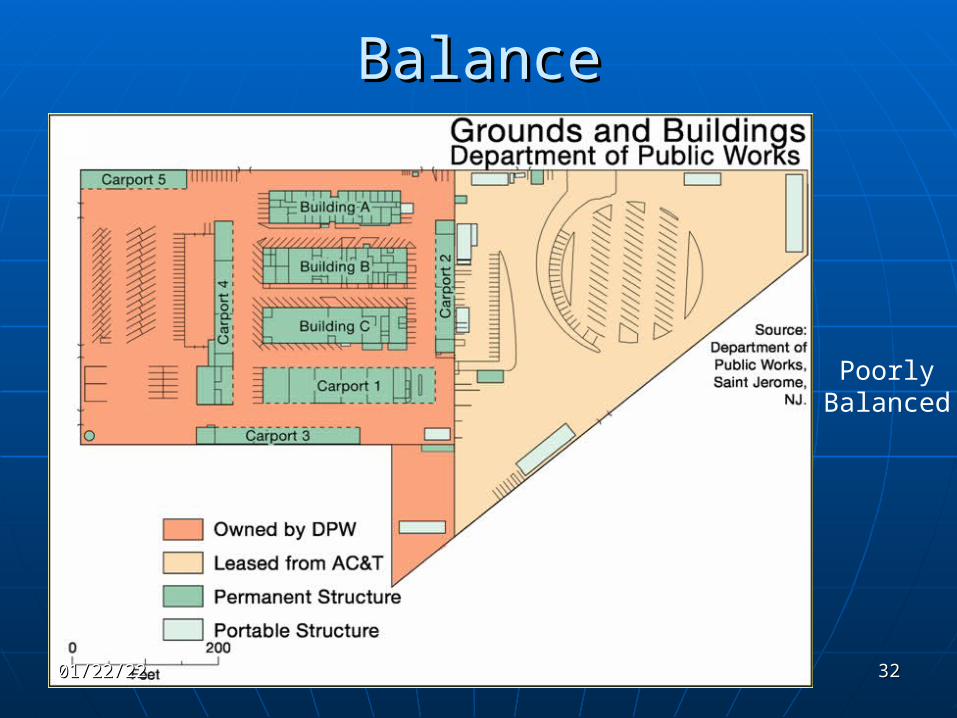
BalanceBalance
Poorly Balanced
05/01/2305/01/23 3232
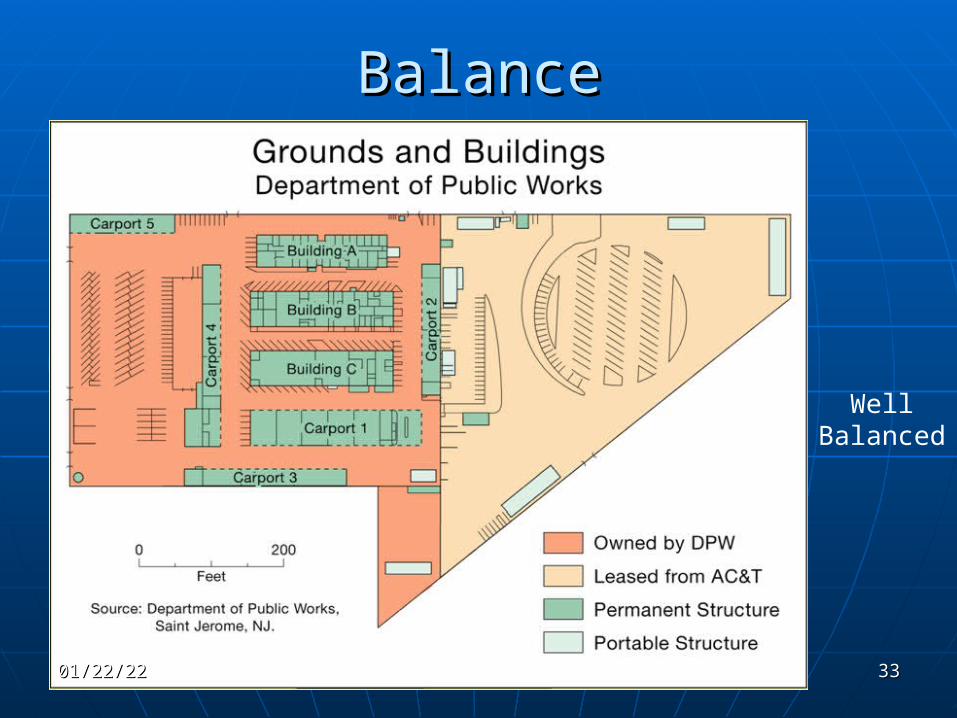
BalanceBalance
Well Balanced
05/01/2305/01/23 3333

Map Design PrinciplesMap Design Principles
Understanding of user requirements
Consideration of display format
A clear visual hierarchy
Simplicity3434
German designer, Dieter Rams05/01/2305/01/23

Legibility
Consistency
Accessibility
Good composition
3535German designer, Dieter Rams
Map Design PrinciplesMap Design Principles
05/01/2305/01/23

What is the goal of the map? (Purpose)What is the goal of the map? (Purpose) Who will read the map? (Audience)Who will read the map? (Audience) Where will the map be used? Where will the map be used? (Condition of use) (Condition of use) What data is available for the composition of What data is available for the composition of
the map? (Available Data)the map? (Available Data) What resources are available in terms of What resources are available in terms of
both time and equipment?both time and equipment? What is the scale of map? (level of detail)What is the scale of map? (level of detail) What is the shape and size of area? ( Ground What is the shape and size of area? ( Ground
Reality)Reality)
Factors Influencing Map DesignFactors Influencing Map Design
05/01/2305/01/23 3636

Any Questions…?Any Questions…?
05/01/2305/01/23 3737

Thank you !!!Thank you !!!
05/01/2305/01/23 3838
Top Related