


Languages
Pages
Legal


Carbon storage in engineered wood products in landfills
Presented by Fabiano Ximenes, NSW DPI, 2013

Talk Outline
- Background to project
- Landfills in Australia - Excavations
- Experimental work - Implications to industry

Project background
- Previous projects: long-term C storage in solid wood
-Funding: FWPA / Laminex / DAFF
1) Long-term C storage in engineered wood products and paper from landfills; 2) Long-term C storage in engineered wood products and paper in anaerobic reactors in the laboratory

Why is it important?
- Greenhouse credentials of wood products (Carbon trading)
- Life Cycle Assessments - More accurate estimates of national greenhouse emissions
Landfill types
Municipal solid waste landfills
C&D landfills
C&I landfills
Bioereactor landfills

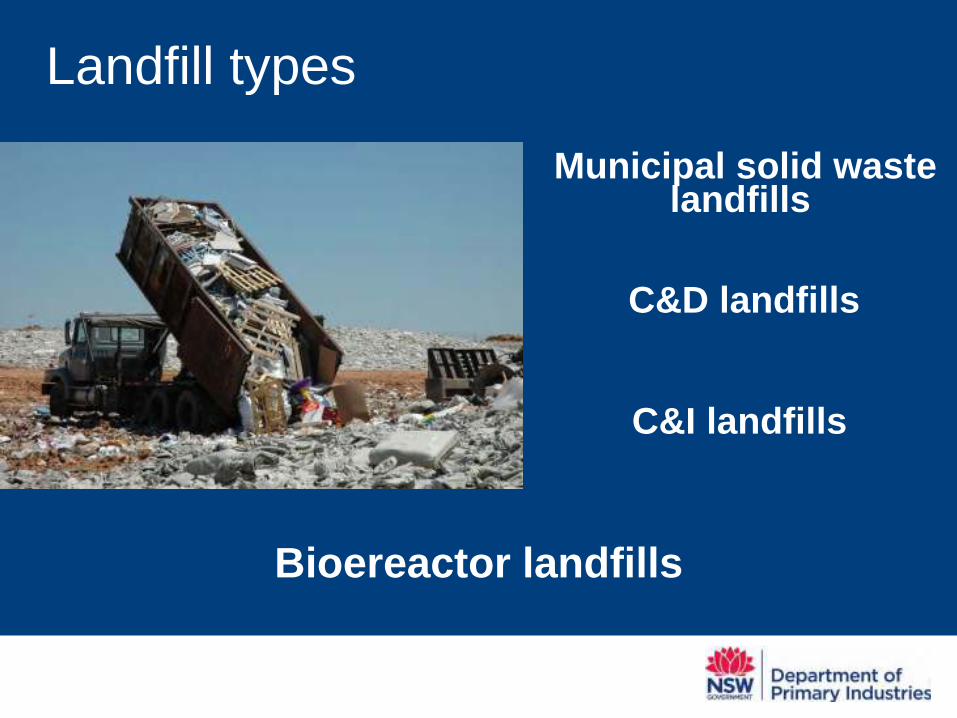
Landfills
Past: shallow, no compaction, aerobic
Sanitary landfills: 20 -
30’s
Engineered landfills: 60-70’s
Modern landfills: large, deep, compaction, anaerobic
Landfills

Wood waste disposal Current options: Recycle/reuse; landfill
Wood waste to landfills in Australia: 1.5 -
2 Mt / year; paper : 1.3 Mt / year Eventually – most recycled products
either decay or placed in landfills
Alternative: Incineration for energy recovery (Europe model)
*Fossil-fuel displacement benefits

Decomposition in landfills
• Decay of organics: 50:50 CO2 and CH4 • Oxidation factor: 0.1 (default) – probably
higher
• Best-practice landfills: 75 - 90% CH4 recovery
• Methane generation: 0-30 years
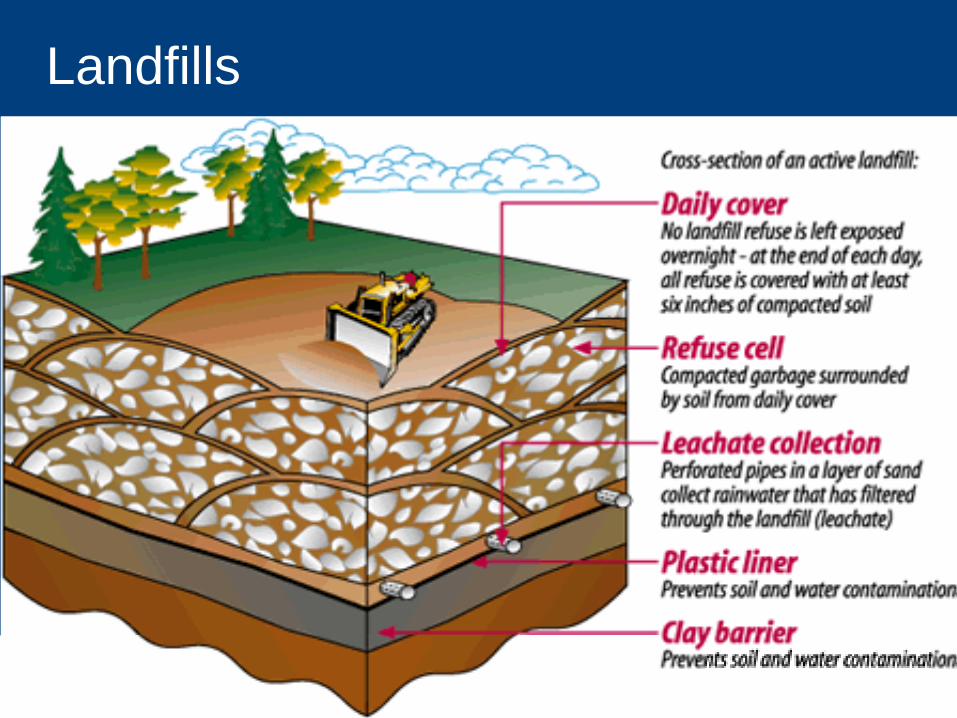
Decay of wood in landfills
Wood is made up primarily of cellulose, hemicellulose and lignin
Wood type
Cellulose (%)
Hemicellulose (%)
Lignin (%)
Softwood 45-50 15-20 25-35
Hardwood 50-55 15-25 18-25

Decay of wood in landfills
Wood is made up primarily of cellulose, hemicellulose and lignin
Lignin is degraded under aerobic conditions

Undegraded wood
Bacterial attack Severe fungal attack
Wood degradation (Aerobic)
From: MSc thesis: Preservation of wood using oxy -aluminium compounds. Ximenes 2000

Decay of wood in landfills
Wood is made up primarily of cellulose, hemicellulose and lignin
Lignin is degraded under aerobic conditions
If landfill is under anaerobic conditions, then
lignin (and some of the cellulose and hemicellulose) will not degrade

Methodology - Excavations
Identification of sites (worst case scenario) Site characterization Target products
Chemical composition: Cellulose /
Hemicellulose / Lignin / Ash Comparison with matching controls

Excavation at Lucas Heights
“To understand garbage you have to touch it, to fee l it, to sort it, to smell it” Rathje and Murphy , 2001

Excavation at Meadowbank

20 years in landfill

29 years in landfill
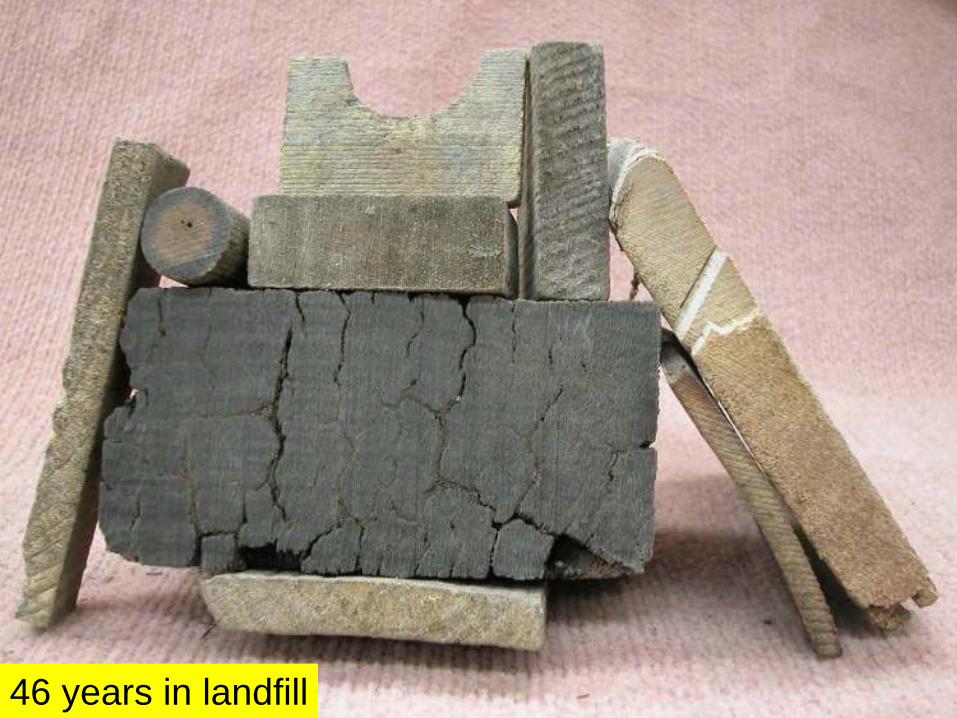
46 years in landfill

44 years in landfill

Ximenes et al 2008
Analysed range of solid wood samples from two landfills in Sydney
No significant loss of carbon in one landfill (samples buried for 19-29 years)
Approx. 18% loss of carbon from samples buried in another landfill (46 years)

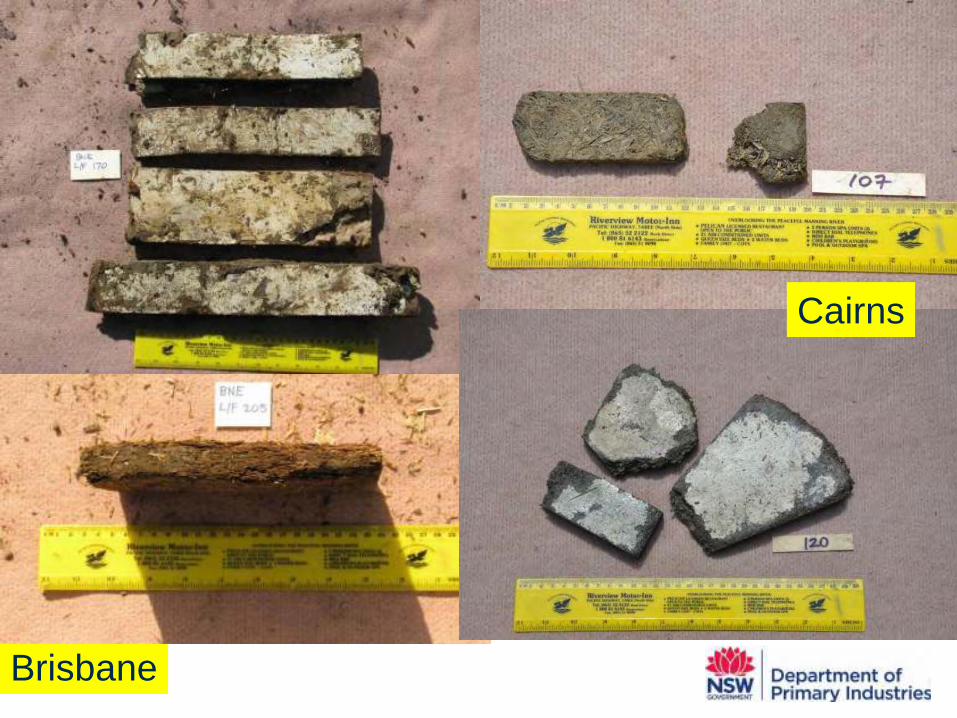
Cairns - Portsmith
Sampling (0.5 m intervals), until the bottom of the cells (2.5-3.5 m in depth)
The pH ranged from 5.6 to 7.4 . The
temperature of the waste was slightly higher than the ambient temperature
Samples buried for 16-18 years
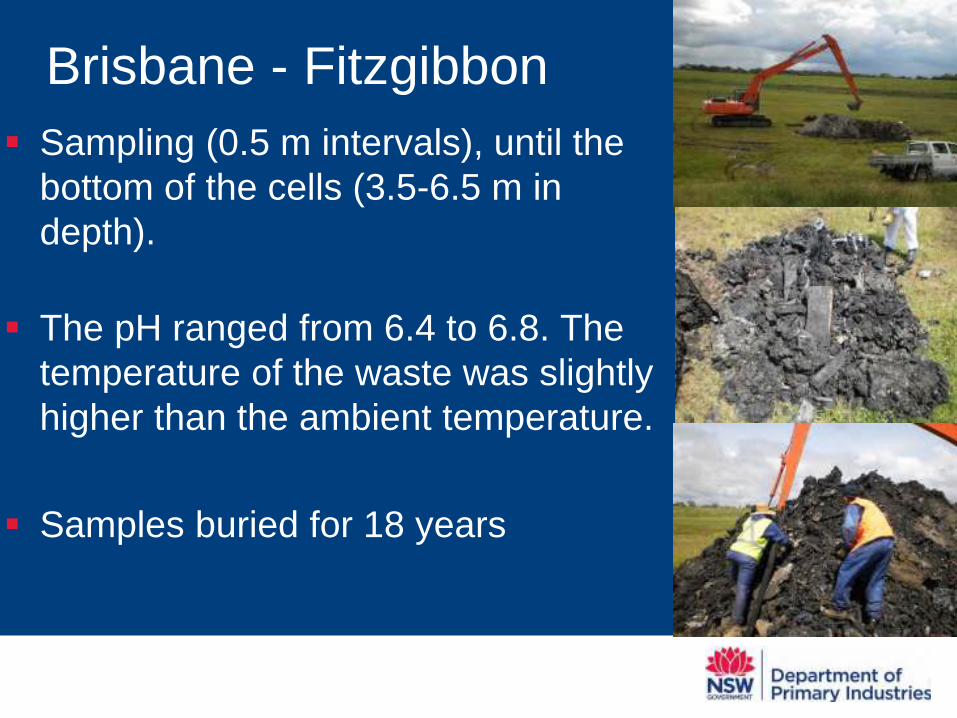
Brisbane - Fitzgibbon Sampling (0.5 m intervals), until the
bottom of the cells (3.5-6.5 m in depth).
The pH ranged from 6.4 to 6.8. The
temperature of the waste was slightly higher than the ambient temperature.
Samples buried for 18 years

Table 1. Mean pH and temperature of waste buried at Roghan Rd. landfill
Cell Depth of cell (m)
pH (Mean, SD)
Temperature (°C; Mean, SD)
1 3.5 6.4 (0.3) 25.8 (0.4)
2 5.0 6.5 (1.0) 26.4 (0.6)
3 6.5 6.8 (0.3) 27.0 (2.0)
4 5.0 6.8 (0.2) 25.4 (0.8)
Combined 6.7 (0.6) 26.2 (1.3)
Brisbane - Fitzgibbon

Brandown (Kemps Creek) Sampling (0.5 m intervals), until the
bottom of the cells (7.0 m in depth). The pH ranged from 6.8 to 7.0. The
temperature of the waste increased slightly with depth.
Samples buried for 19-20 years
Brandown (Kemps Creek)
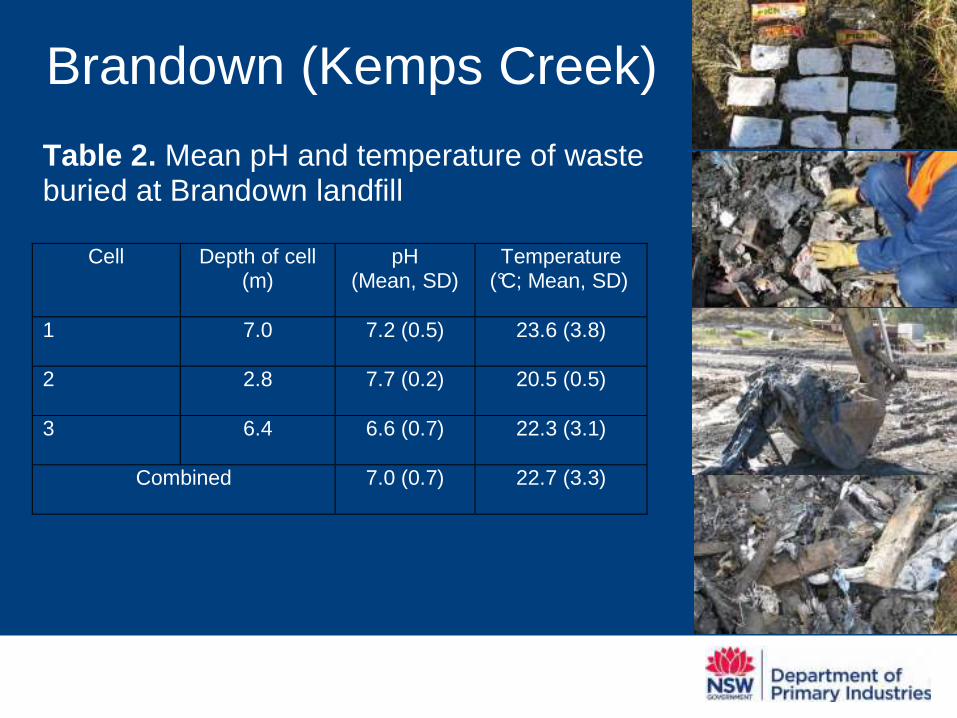
Table 2. Mean pH and temperature of waste buried at Brandown landfill
Cell Depth of cell (m)
pH (Mean, SD)
Temperature (°C; Mean, SD)
1 7.0 7.2 (0.5) 23.6 (3.8)
2 2.8 7.7 (0.2) 20.5 (0.5)
3 6.4 6.6 (0.7) 22.3 (3.1)
Combined 7.0 (0.7) 22.7 (3.3)

Excavation in Brisbane
“To understand garbage you have to touch it, to fee l it, to sort it, to smell it” Rathje and Murphy , 2001

Excavation in Brisbane

Excavation in Kemps Creek

Excavation in Kemps Creek

16 years in landfill


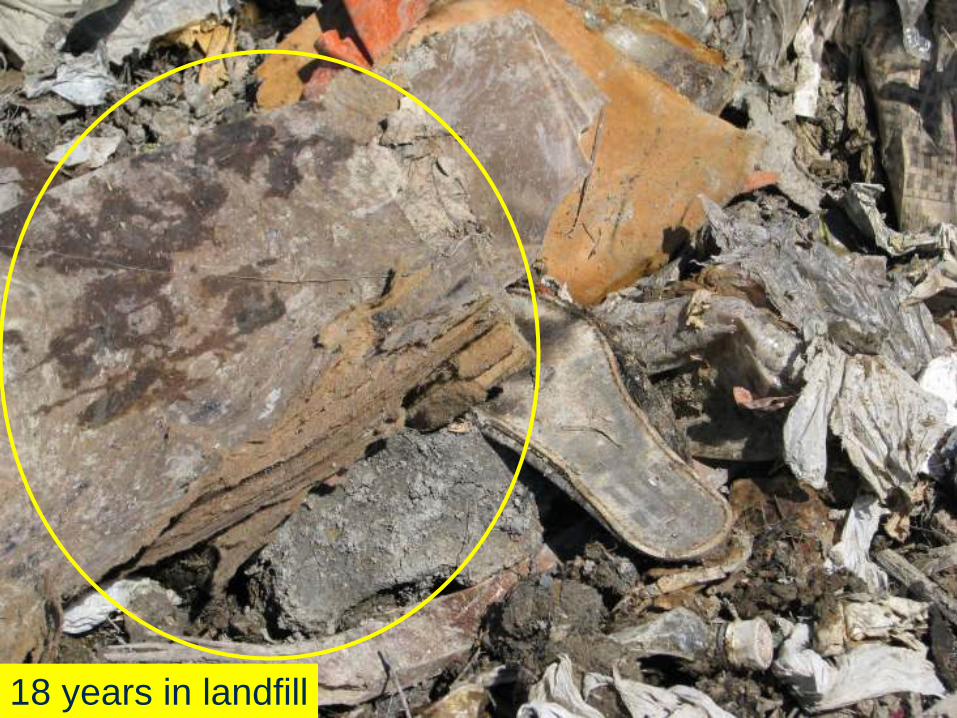
18 years in landfill

14 years in landfill
14 years in landfill

Plywood - Cairns

Brisbane
Kemps Creek
Brisbane
Cairns

Kemps Creek

Brisbane
Cairns

Kemps Creek

Excavations – Moisture content
Table. Moisture content of engineered wood products recovered from Sydney, Brisbane and Cairns according to product type
Site Moisture content (%) Mean (SD, N)
Particleboard MDF Plywood / Veneer
Kemps Creek
37 (8.8, 29) 44.7 (10.0, 19) 38.9 (10.1, 12)
Brisbane 45 (10.0, 21) 47.9 (9.7,20)
41.4 (10.0,10)
Cairns 39-8-58.3
70.6 (4.2, 6) 56.9 (3.0, 4)

Excavation – Fibre analysis
Composite wood product type N Sample type
Normalised Ash
(%, SD)
Holocel. Lignin MDF 9 Landfill 62.2 (1.7) 37.8 (1.7) 4.8 (1.5)
1 Control 67.9 32.1 0.3
Plywood 8 Landfill 59.4 (6.9) 40.6 (6.9) 5.3 (3.3)
1 Control 63.1 36.9 2.9
Particleboard 2 Landfill 63.8 36.2 17.7
1 Control 66.4 33.6 0.4
Table . Chemical composition analysis of engineered wood product samples recovered from Portsmith landfill, Cairns.
* Standard deviation provided for landfill engineered wood product types with at least 3 samples. Range provided for landfill engineered wood product types with 2 samples only
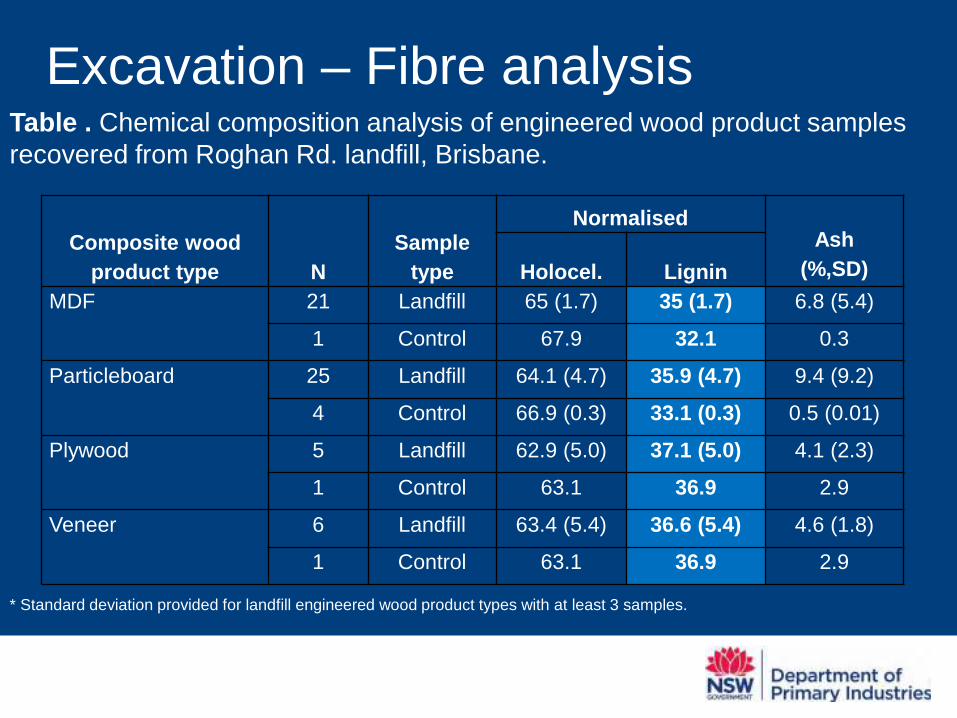
Excavation – Fibre analysis
Composite wood
product type N Sample
type
Normalised Ash
(%,SD) Holocel. Lignin MDF 21 Landfill 65 (1.7) 35 (1.7) 6.8 (5.4)
1 Control 67.9 32.1 0.3
Particleboard 25 Landfill 64.1 (4.7) 35.9 (4.7) 9.4 (9.2)
4 Control 66.9 (0.3) 33.1 (0.3) 0.5 (0.01)
Plywood 5 Landfill 62.9 (5.0) 37.1 (5.0) 4.1 (2.3)
1 Control 63.1 36.9 2.9
Veneer 6 Landfill 63.4 (5.4) 36.6 (5.4) 4.6 (1.8)
1 Control 63.1 36.9 2.9
Table . Chemical composition analysis of engineered wood product samples recovered from Roghan Rd. landfill, Brisbane.
* Standard deviation provided for landfill engineered wood product types with at least 3 samples.

Excavation – Fibre analysis
Composite wood product type N
Sample type
Normalised
Ash (%,SD)
Holocel. Lignin MDF 19 Landfill 63.4 (4.8) 36.6 (4.8) 4.1 (3.2)
1 Control 67.9 32.1 0.3
Particleboard 28 Landfill 64.6 (2.4) 35.4 (2.4) 5.1 (6.7)
4 Control 66.9 (0.3) 33.1 (0.3) 0.5 (0.01)
Veneer 6 Landfill 64.9 (1.5) 35.1 (1.5) 5.0 (2.3)
1 Control 63.1 36.9 2.9
Table . Chemical composition analysis of engineered wood product samples recovered from Brandown landfill, Sydney.
* Standard deviation provided for landfill engineered wood product types with at least 3 samples.
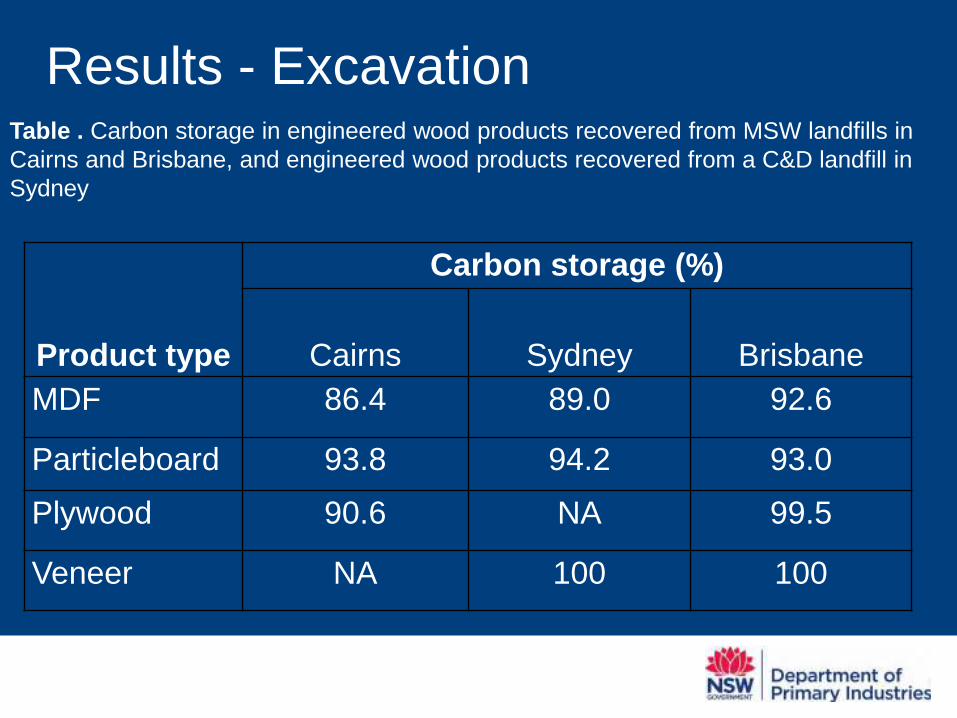
Results - Excavation
Product type
Carbon storage (%)
Cairns Sydney Brisbane
MDF 86.4 89.0 92.6
Particleboard 93.8 94.2 93.0
Plywood 90.6 NA 99.5
Veneer NA 100 100
Table . Carbon storage in engineered wood products recovered from MSW landfills in Cairns and Brisbane, and engineered wood products recovered from a C&D landfill in Sydney

Excavation - issues Possibility of decay while the products where in service (before disposal); Possibility of decay taking place in the aerobic
stages of the landfill life; Possibility of loss of carbon due to decay of a
chemical nature in landfills; Difficulties in finding suitable controls for
comparisons with landfill samples Difficulties in finding enough controls to enable
meaningful statistical comparisons
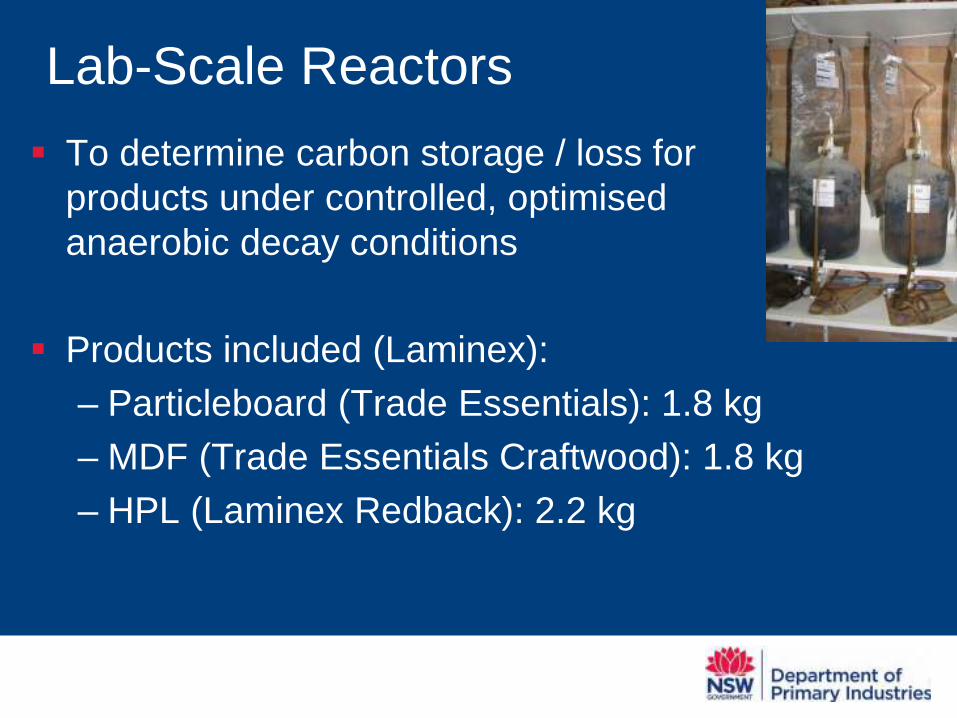
Lab-Scale Reactors
To determine carbon storage / loss for products under controlled, optimised anaerobic decay conditions
Products included (Laminex): – Particleboard (Trade Essentials): 1.8 kg – MDF (Trade Essentials Craftwood): 1.8 kg – HPL (Laminex Redback): 2.2 kg

Methodology - Laboratory Reactors filled with composite wood
products and seed material (anaerobic conditions)
Moisture, temperature, pH, nutrients
optimum Monitoring release of CH4 and CO2 (gas
chromatography) Mass balance after gas release is finished Carbon storage / loss determined

Lab-Scale Reactors
Conditions to maximize decomposition
– Temperature: 39°C – Leachate neutralization and
recirculation (Veolia bioreactor landfill, Goulburn)
– Regular monitoring of nutrients: target concentrations • NH3-N: 100 mg of N/L • PO4-P: 5-10 mg of P/L

Lab-Scale Reactors

Particleboard / MDF samples: before and after
Particleboard
MDF

Results - Laboratory pH

Results - Laboratory
Gas Composition – Particleboard
Reactor 1
Reactor 2
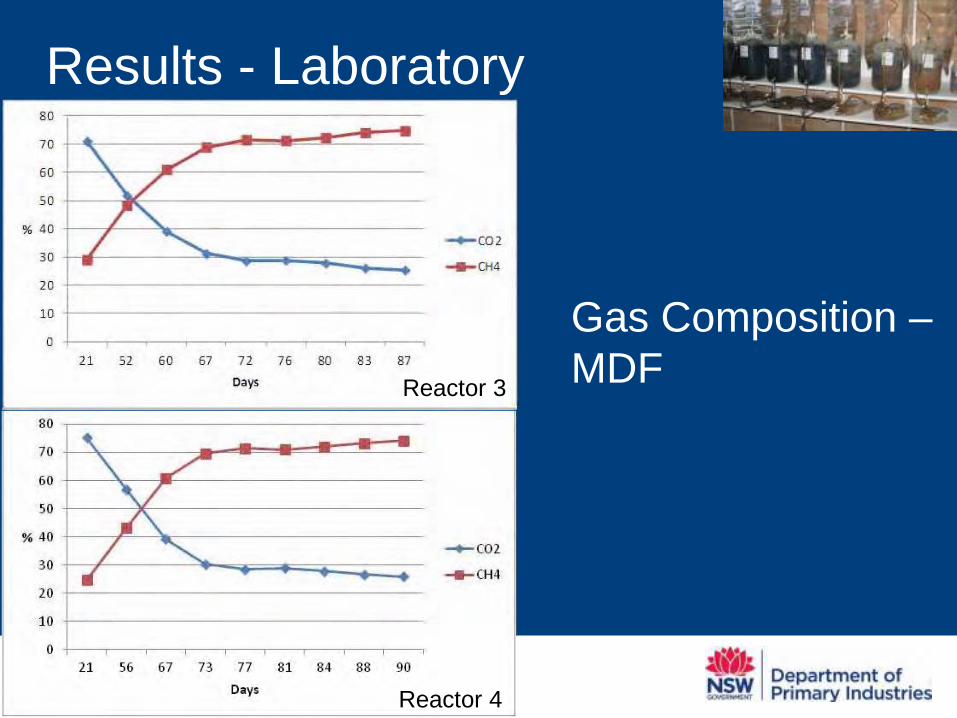
Results - Laboratory
Gas Composition – MDFReactor 3
Reactor 4

Results - Laboratory
Product type
Carbon storage (%) Carbon loss (%)
Particleboard 98.25 1.75
MDF 100 0
High-pressure laminate 100 0
Table . Carbon storage and carbon loss (range) from engineered wood products in bioreactors
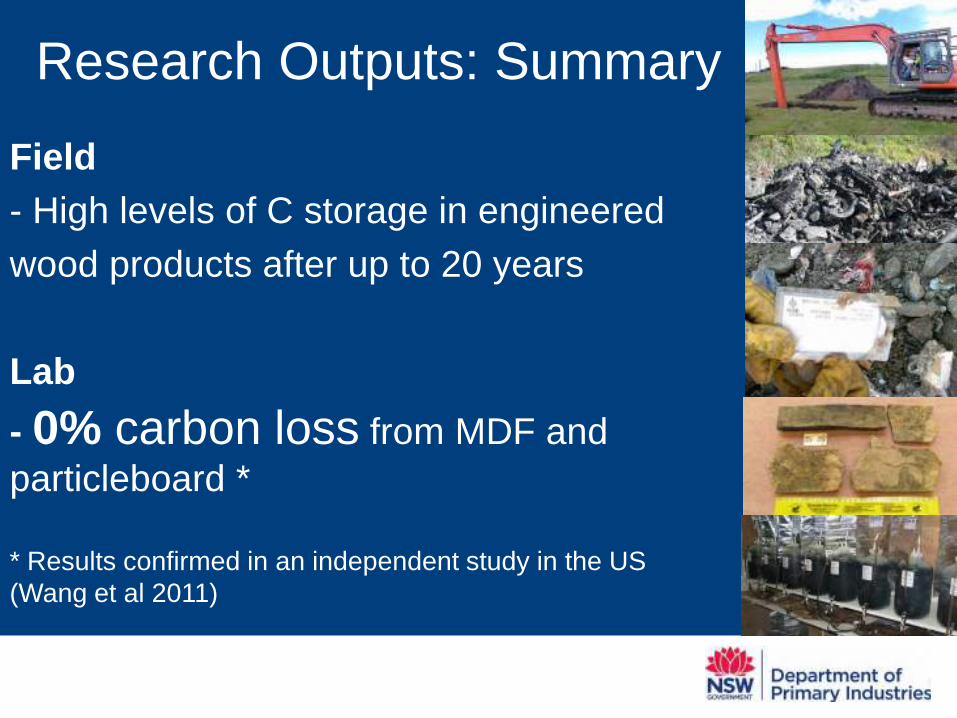
Research Outputs: Summary
Field - High levels of C storage in engineered wood products after up to 20 years Lab
- 0% carbon loss from MDF and particleboard * * Results confirmed in an independent study in the US (Wang et al 2011)

Carbon Storage in Australia's Forest Plantations, Wood Products in Service and in Landfill
88 Mt C
94.6 Mt C
137.5 Mt C
Plantations
Wood in service
Wood in landfills

Implications for Industry – cont. - Demonstration of long-term carbon storage: carbon credits * Additional carbon revenue (additional carbon to trade) * Increasing value of thinnings / incentive for plantation expansion
MORE $ FOR C

Implications for Industry
- Use of engineered wood products has a significant beneficial GHG impact
- Any of the current end-of-life options: Recycling Energy Landfill
POSITIVE GHG OUTCOME

Implications for Industry
- Improved outcomes in LCAs of engineered wood products
- Improved outcomes in building rating schemes
WOOD PRODUCTS MORE COMPETITIVE IN BUILDING RATING SCHEMES
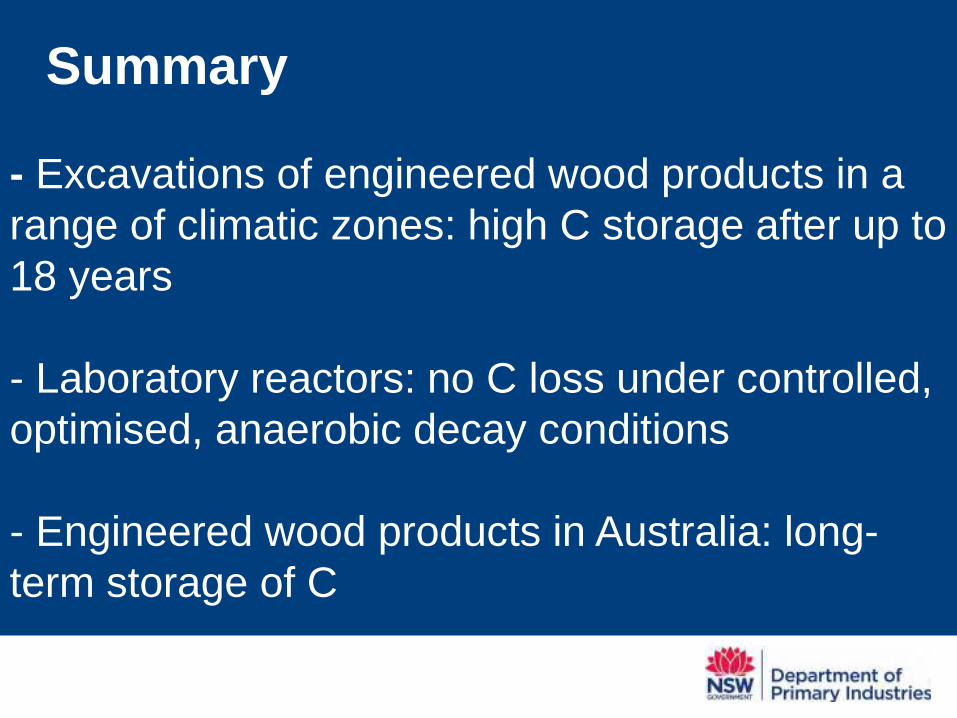
Summary - Excavations of engineered wood products in a range of climatic zones: high C storage after up to 18 years - Laboratory reactors: no C loss under controlled, optimised, anaerobic decay conditions
- Engineered wood products in Australia: long-term storage of C

Wang et al 2011
Aim: characterize the anaerobic biodegradability of major wood products in municipal waste in the USA
Experimental set-up: 8 L bioreactors
Carbon loss from solid wood: 0 – 7.8%
Carbon loss from Particleboard, MDF and plywood: 1.1-1.4%

Current work - Consolidation of data from more recent excavations - Consolidation of data from experimental work in the US (paper products) and in Australia (paper products and composite wood products)
- Bioreactor experiments with range of Australian solid wood types ongoing

Key references Ximenes, F.A.; Gardner, W.D.; Cowie, A. The decomposition of wood products in landfills in Sydney, Australia. Waste Manag. 2008, 28, 2344–2354. Wang, X.; Padgett, J.M.; De la Cruz, F.B.; Barlaz, M.A. Wood biodegradation in laboratory scale landfills. Environ. Sci. Technol. 2011, 45, 6864–6871.
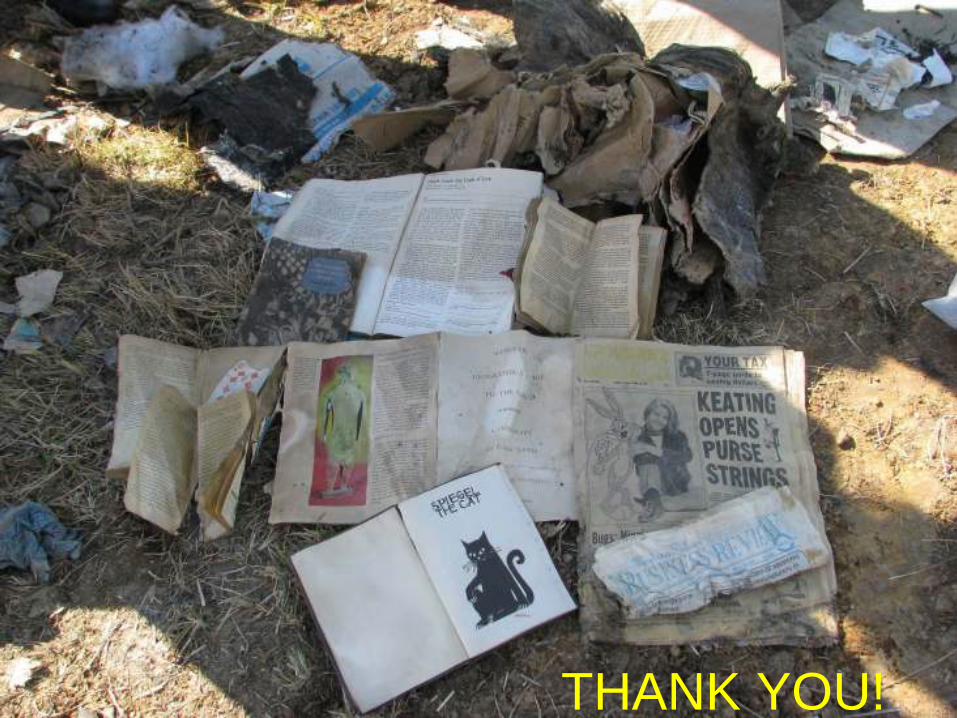
THANK YOU!
Top Related