


Languages
Pages
Legal


Capital Constraints, Counterparty Risk and
Deviations from Covered Interest Rate Parity
Niall Coffey Warren Hrung Asani Sarkar
ABSTRACT
We provide robust evidence of deviations from the Covered Interest Parity (CIP) relation since the onset of the crisis in August 2007. The CIP deviations exist with respect to different dollar interest rates and exchange rate pairs of the dollar vis-à-vis other currencies. The results show that our proxies for margin conditions and cost of capital are significant determinants of the basis. Following the bankruptcy of Lehman Brothers, uncertainty about counterparty risk became a significant determinant of CIP deviations. The supply of dollars by the Federal Reserve to foreign central banks via reciprocal currency arrangements (swap lines) reduced CIP deviations. In particular, the announcement on October 13 2008 that the swap lines would become unlimited reduced CIP deviations substantially. These results indicate a breakdown of arbitrage transactions in the international capital markets during the crisis partly due to lack of funding and partly due to heightened counterparty credit risk. Central bank interventions helped to reduce the funding liquidity risk of global institutions.
October 2009
All authors are from the Federal Reserve Bank of New York. We thank Viral Acharya, Ron Alquist, Markus Brunnermeier, Emmanuel Farhi, Arvind Krishnamurthy, Richard Levich, Martin Oehmke, Lasse Pedersen, and Dimitri Vayanos for valuable comments. We thank Mark Lueck for data help and seminar participants at the NBER Summer Institute 2009, the Financial Stability Conference Vancouver 2009, and the Systems Finance conference of the Federal Reserve for helpful comments. The views stated here are those of the authors and do not necessarily reflect the views of the Federal Reserve Bank of New York, or the Federal Reserve System.

1
The covered interest rate parity (CIP) relation is a bedrock of international economics. CIP
states that, if foreign exchange (FX) risk is fully hedged, then borrowing at home to lend abroad
(or vice versa) is not profitable. Empirical evidence is generally supportive of the CIP,
especially for recent sample periods and for the developed countries, except when exchange
controls impede the free flow of capital.1
In this paper, we document a substantial and persistent breakdown in the CIP relation
since the onset of the crisis in August 2007. We measure the deviation from CIP by the US
dollar (USD) basis, defined as the difference between the USD rate implied by the CIP relation
(henceforth, the “implied rate”) and a benchmark unsecured dollar interest rate (e.g. the USD
Libor). We show that while the basis is miniscule in normal periods, it has been consistently
large and positive since the start of the crisis and increased dramatically after mid-September
2008 following the bankruptcy of Lehman Brothers. For example, the basis estimated using
USD Libor as the interest rate and the euro-USD currency rate increased from essentially zero in
the pre-crisis period to around 25 basis points during the initial periods of the crisis, before
shooting up to over 200 basis points by the end of September 2008 (Figure 1).
Observed CIP deviations tend to be short-lived (11
minutes or less) and are not, on average, profit making (Akram, Rime and Sarno (2008)).
We show that this result is robust to the use of alternative USD interest rates and the use
of different currency pairs (of USD vis-à-vis other currencies). If banks contributing to Libor
were strategically under-reporting their true dollar borrowing rates during the crisis, as has been
alleged, then we might spuriously observe a deviation from CIP with reference to Libor.2
1 Holmes and Schott (1965) discuss how severe exchange control restrictions resulted in persistent CIP deviations during the early 1930s to the late 1950s. As these controls eased, CIP deviations became less frequent.
However, we continue to find large deviations from CIP when we use the New York Funding
2 See, for example, “Libor Fog,” by Carrick Mollenkamp, The Wall Street Journal, April 16 2008, page A1.

2
Rate (NYFR) and Treasury bill rates (Figure 2).3
What may have caused this remarkable deviation in the CIP? Keynes (1923) discusses
how lack of “floating capital” may impede the CIP relation from holding. In modern parlance,
funding constraints during the crisis placed limits to arbitrage (Shleifer and Vishny (1997),
Gromb and Vayanos (2002), Geanakoplos (2003), Basak and Croitoru (2006), and Brunnermeier
and Pedersen (2009)).
We also find that the USD basis estimated with
respect to six currency pairs (USD vis-à-vis the Australian dollar, the euro, the Japanese Yen, the
British pound, the Swiss franc, and the New Zealand dollar) shows a similar pattern of sharp
increases in the crisis period, and especially since September 2008 (Figure 3).
4
We use the model of Garleanu and Pedersen (2009) to explain why the CIP deviations
turned positive during the crisis. We discuss how a positive basis was indicative of difficulties in
borrowing USD in the unsecured funding market, likely due to reduced supply of and increased
global demand for USD during the crisis. We then develop empirical measures of margin
conditions and the shadow cost of capital and show that they are significant determinants of the
basis. These results indicate that arbitrage trades in the international capital markets were
limited during the crisis due to funding constraints.
Garleanu and Pedersen (2009) show that, given risk-tolerant investors
who are margin-constrained and risk-averse investors who are constrained in their derivatives
positions, the basis between a derivative and its asset is non-zero in equilibrium and depends on
their relative margins and the leveraged investors’ shadow cost of capital.
3 NYFR, published by ICAP and introduced in June 2008, is a trimmed mean of quotes collected from a panel of contributing US banks. To reduce the incentive to under-report, individual quotes and the composition of the panel are not disclosed. And, while Libor panel banks are asked to provide an estimate of their own borrowing costs, ICAP asks only for an estimate of the rate at which a representative A1/P1 bank would be likely to obtain funding. 4 Holmes and Schott (1965) provide examples of increased flow of arbitrage funds associated with lower CIP deviations. In the context of the uncovered interest rate parity, Brunnermeier, Nagel and Pedersen (2008) show that the sudden unwinding of carry trades are attributable to funding illiquidity when speculators near funding constraints.
3
Another explanation of CIP deviations (also discussed by Keynes (1923)) is that
previously riskless cash flows became risky during the crisis.5 Baba and Packer (2008) show
that the basis increases in the difference in CDS prices of European and US firms.6
To ease short-term dollar funding constraints, the Federal Reserve agreed to supply
dollars to foreign central banks via reciprocal currency arrangements (swap lines) with several
developed and emerging market countries. We study changes in the basis on days of Federal
Reserve announcements and auctions related to the swap lines. We find that announcement days
of the swap lines program are associated with a reduction in the basis by an average of 5 basis
points. We further find that the actual auctions of dollars were also effective in bringing down
the basis on the days of operations. Shortly after the Lehman bankruptcy, the Fed announced an
increase in the size of swap lines to accommodate any quantity of USD that might be
demanded.
We find that
uncertainty about counterparty risk became a significant determinant of the basis, particularly in
the immediate aftermath of the failure of Lehman Brothers. Taken together, our results therefore
indicate a breakdown of arbitrage transactions partly due to lack of funding and partly due to
heightened counterparty credit risk, with the relative importance of the two types of risks varying
during different stages of the crisis.
7
5 Gorton (2009) discusses how “informationally-insensitive” debt became “informationally-sensitive” during a crisis.
We find that this announcement was associated with a substantial reduction in the
basis of more than 50 basis points during a single day. These results further establish that
funding constraints were key drivers of the basis during the crisis.
6 Holmes (1959) shows how CIP deviations tend to increase when sovereign risk and bank credit risk increases. Frenkel and Levich (1977) find that covered arbitrage profits increase during turbulent times. Taylor (1989) shows that deviations from CIP tend to increase during periods of crisis (e.g. the inception of the European Monetary System in 1979) and they persist for some time. Akram, Rime and Sarno (2008) find that CIP deviations increase with market volatility. 7 Federal Reserve Press Release, http://federalreserve.gov/newsevents/press/monetary/20081013a.htm. October 13 2008.
4
We conduct several robustness checks. We repeat our regressions using changes in the
basis (since the basis displays strong autocorrelation). We also repeat our analysis using high
frequency (hourly) exchange rate data (this data is only available for part of our sample). Our
qualitative results remain the same in all cases.
Of related papers, Griffoli and Ranaldo (2009) also find that funding constraints explain
the CIP deviations but, different from us, that counterparty risk does not. The difference may
arise because counterparty risk is likely to be less of a factor for the shorter maturity loans they
examine (i.e. 1-week maturity compared to our 3-month maturity). Further, they assume that
arbitrageurs are able to borrow at secured (i.e. OIS) rates whereas we use unsecured (i.e. Libor)
funding rates when estimating CIP deviations. They find that central bank swap lines had no
statistical effect on the deviations after the Lehman failure (although they do not consider the
announcement of unlimited swap lines). Baba and Packer (2008) find a decline in volatility of
the basis but no change in its level due to the swap lines. They focus on CDS prices but do not
consider arbitrageurs’ funding constraints as determinants of CIP deviations.8
Our contribution, relative to these papers, lie in using a theoretical framework (based on
Garleanu and Pedersen (2009)) to (1) explain why the CIP deviations became positive and (2)
derive empirical measures for funding constraints: the overnight repo spread between agency
MBS and Treasury collaterals. The short (overnight) maturity and collaterization imply that
credit risk is likely to be a small part of the spread. Garleanu and Pedersen (2009) document CIP
deviations and comment on its correlation with the TED spread. However, they do not conduct
any formal econometric analysis.
8 Baba and Packer (2008) use the Libor-OIS spread as a proxy for liquidity risk but this proxy includes a substantial component of credit risk, as shown by McAndrews, Sarkar and Wang (2009).
5
We extend this framework to develop an empirical measure of uncertainty about
counterparty risk and examine the co-evolution of credit risk and liquidity risk during the crisis.
Heider, Hoerlova and Holthausen (2009) show theoretically that asymmetric information about
counterparty risk can lead to breakdowns in interbank markets. Pritsker (2009) finds that lenders
with greater subjective uncertainty about borrowers’ default risk charges higher rates. We show
that CIP deviations are significantly related to this measure. Shleifer and Summers (1990) argue
that small deviations from fundamentals may not be corrected when cash flows are risky. Our
results suggest that even large deviations may not be corrected if cash flows are risky and capital
is limited. Finally, we extend prior evidence on the efficacy of public liquidity supply from the
domestic context to the international markets (also discussed by McGuire and von Peter (2009)).
The remainder of the paper is organized as follows. In Section I, we describe our
methodology and data. In Section II, we present estimates of CIP deviation. In sections III and
IV, we discuss measures of funding constraints and counterparty risk and present results relating
these measures to CIP deviations. In Section V, we assess the impact of the Federal Reserve’s
announcements and actual operations related to the bilateral currency swap lines on CIP
deviations. We conclude in Section VI.
I. Data and Measurement of CIP Deviations
In this section, we discuss our estimates of CIP deviations and describe the data. Let s be
the spot rate, f the forward rate, iD the domestic interest rate and iF the foreign interest rate at
time t. Interest rates are in nominal units. Exchange rates are in units of domestic currency per
unit of foreign currency. The CIP relation then states that at each time t:
( )Ft
t
tDt i
sf
i +=+ 11 (1)
6
Given data on the forward rate, the spot rate and the foreign interest rate iF, the implied
rate is the value of iD that solves (1). The USD basis (BasisD) is the difference between the
implied USD rate and a benchmark unsecured USD interest rate.
( ) ( )rateinterest unsecured 11 USDisf
Basis Ft
t
tDt +−+= (2)
For most of our analysis, we use the euro-USD exchange rate, the euro Libor and USD
Libor fixing rates to estimate the basis:
( ) )$1(1rate $
rate $tt
t
tDt LIBOReuroLIBOR
spoteuroforwardeuroBasis +−+= (3)
Arbitrage in international capital markets should ensure that the implied dollar rate is
equal to the USD Libor rate, so that the basis is zero and CIP holds. A non-zero basis in normal
times is likely due to temporary mispricings that are not arbitraged away (Akram et al (2008)).
We obtain tradable quote data on spot and 3-month forward exchange rates from Reuters,
Bloomberg and Tullett Prebon, a leading broker in FX markets. Griffoli and Ranaldo (2009) use
data from the same source. They argue that the data is representative of the market in that all
major participants are included. Further, they show that, although prices are indicative, they are
close to actual trading prices. The 3-month Libor rates are pulled from Reuters.
Ideally, data for all legs of the arbitrage transaction should be synchronous. For the early
part of our sample, the exchange rate data are only available with close of business day values.
Since Libor rates are announced at about 7am US Eastern Standard Time (EST), we calculate the
day t implied rate by matching spot and forward exchange rate data for close of day t with Libor
rates announced on day t+1 (where all times are US EST). Starting from May 23 2008, we have
available hourly data on the euro-USD exchange rate from Reuters and Tullett Prebon which
7
allows time-matching with Libor within the hour. We present results for both sets of data; in
general, our results are qualitatively similar whether using the daily or the hourly data.
II. Estimates of Deviations from CIP
In this section we present estimates of deviations from CIP during the crisis period. To
show robustness of the estimates, we present measures based on alternative dollar interest rates
in Section A and alternative currency pairs in Section B. In all cases, we estimate the USD basis
for a 3-month term loan. The sample period spans January 2007 to March 2009 for a total of 564
daily observations.
A. Estimates of CIP deviation based on alternative dollar interest rates
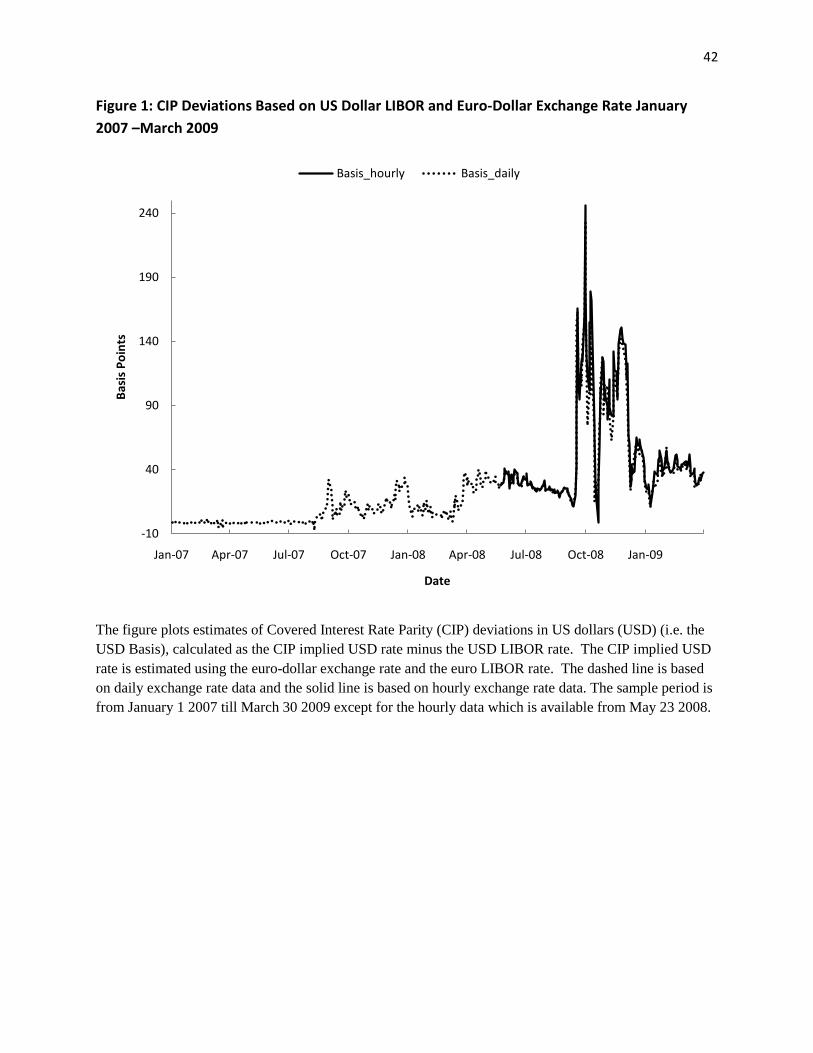
INSERT FIGURE 1 HERE
Figure 1 shows estimates of the USD basis using equation (3) for daily (dashed line) and
hourly (solid line) euro-USD exchange rate data. We observe that, prior to August 2007 (the
start of the crisis), the basis fluctuated around zero. However, since the crisis started, the euro-
USD basis has been consistently large and positive (implying a market-based USD implied
funding rate higher than the USD Libor fixing rate). The deviations have been particularly large
since the Lehman bankruptcy of September 15 2008. For the period where both hourly and daily
exchange rate data is available, we observe that the two estimates track each other closely.
Indeed, the correlation between the two basis measures is 0.94. Therefore, our estimates of CIP
deviations appear robust to the reporting frequency of the exchange rate data.
INSERT TABLE 1 HERE
Panel A of Table 1 shows the mean and maximum values of the CIP deviations in basis
points for different benchmark USD interest rates. The first two rows of Panel A show estimates
8
using the daily and hourly euro-USD exchange rates when USD Libor is the reference rate. In
the pre-crisis period, the mean and maximum deviations were less than 2 basis points in absolute
value. In the crisis period, two regimes are observable. Prior to September 2008, the basis was
large relative to the pre-crisis period, rising to an average of 18 basis points for the daily data,
with a maximum of 40 basis points. After September 2008, the basis jumped to an average of 65
basis points using daily data and 70 basis points using hourly data. The corresponding maxima
were 233 and 246 basis points.
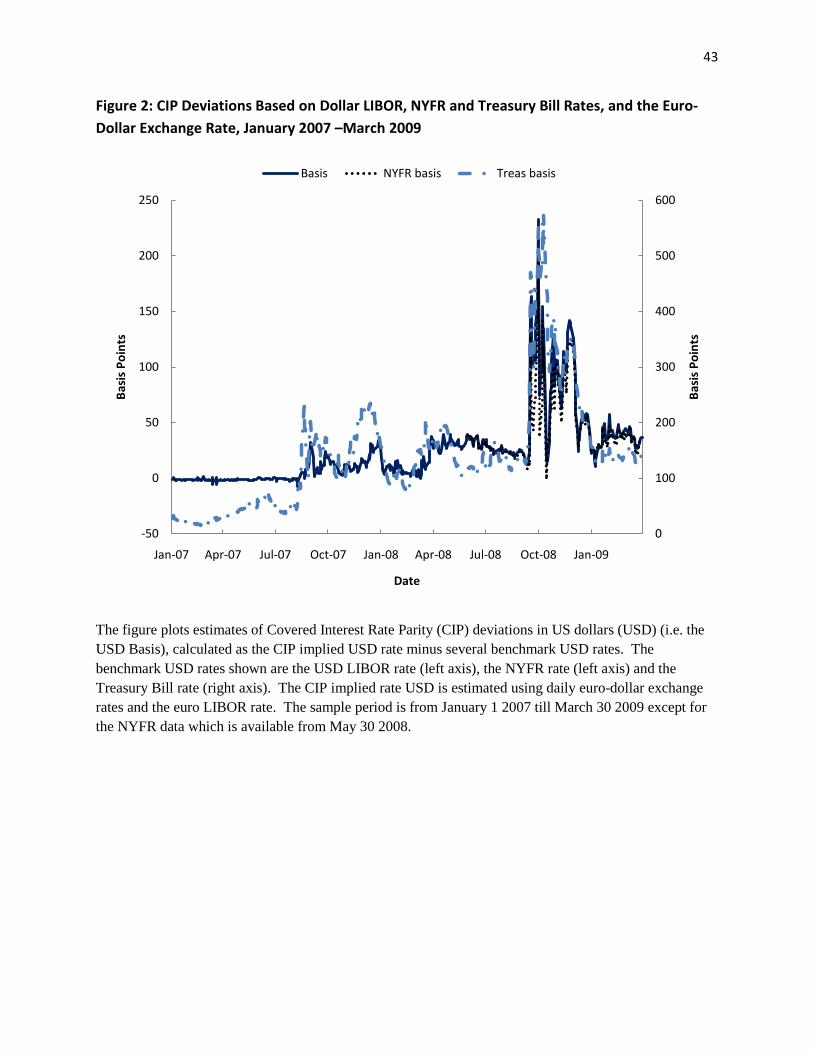
INSERT FIGURE 2 HERE
We re-estimate the basis after replacing the USD Libor rate with the NYFR rate or the
Treasury bill rate in equation (3). The NYFR is a purely domestic US rate unlike Libor, which
has only 3 US banks among 16 Libor panel banks. In addition, the NYFR was designed to
minimize the incentives of banks to misreport their borrowing rates (see footnote 3). The NYFR
data is available from May 30 2008. Figure 2 shows that the behaviour of the NYFR basis is
similar to that based on Libor: it is high and positive prior to September 2008 and increases even
more sharply in September 2008. Panel A of Table 1 shows that the mean and maximum values
of CIP deviations are similar whether based on Libor or NYFR. The CIP deviations based on the
Treasury bill rate display qualitatively similar dynamics as those based on Libor. However, the
bill basis is more than 3 times larger than that of the Libor basis. This is because the Treasury
bill rate closely tracks the policy rate that the Federal Reserve has aggressively reduced over the
crisis period. In general, these results indicate the robustness of the evidence of CIP deviations
with respect to alternative reference dollar interest rates.

9
B. Estimates of CIP deviation based on alternative currency pairs
If increases in the USD basis rate are in part due to an excess demand for dollars globally
from non-US institutions (McGuire and von Peter (2009)), we expect to see increased USD basis
with respect to multiple currencies. We estimate the basis for the US dollar vis-à-vis Australian
dollar (AUD), the Swiss franc (CHF), the British pound (GBP), the Japanese yen (JPY) and the
New Zealand dollar (NZD). To calculate the USD basis with respect to a currency, we use
equation (2) along with the interest rate and exchange rate denominated in the relevant currency.
For example, for the GBP-USD currency pair, we back out an implied dollar rate using the GBP
Libor rate, and the spot and forward GBP-USD exchange rates.
INSERT FIGURE 3 HERE
From Figure 3, we observe that for five other currency pairs, the basis has also widened
dramatically since September 15, 2008 and generally followed a path similar to that of the euro-
USD basis. Panel B of Table 1 shows the mean and maximum values of the basis estimates for
different currency pairs. We observe that the mean and maximum values are similar for different
currency pairs, and moreover they are comparable to those for the USD-euro pair in Panel A of
Table 1. One exception is the AUD-USD pair for which the basis appears to be high since
September 16 2008 compared to the other currency pairs. Overall, the evidence supports the
hypothesis of an excess demand for USD worldwide.
In this section we find robust evidence that estimates of the CIP deviation based on different
dollar interest rates and currency pairs depict a similar pattern: large and positive deviations after
August 2007 followed by even sharper increases following September 2008. In the remainder of
the paper, we explain why the arbitrage condition implicit in the CIP relation breaks down during
10
the crisis and we assess the effect of the Federal Reserve’s announcements and actual operations
related to the bilateral currency swap lines on the CIP deviations.
III. Determinants of CIP Deviations: Discussion and Empirical Methodology
In this section, we discuss a theoretical framework for understanding CIP deviations. We
then use the framework to explain why the deviations were positive (section A) and to propose
empirical proxies for funding constraints (section B) and credit risk (section C).
The CIP deviation may persist if funding is not available to arbitrageurs. Shleifer and
Vishny (1997) show how negative shocks are amplified if investors withdraw money from funds.
Gromb and Vayanos (2002) show that when margin-constrained arbitrageurs face capital
scarcity, a negative shock induces them to liquidate their own positions and widen price
discrepancy.9
Basak and Croitoru (2006) and Garleanu and Pedersen (2009) show that, in equilibrium,
the basis between an asset S and a derivative D (i.e. the expected return on S minus the expected
return on D) is non-zero if investors are heterogeneous and face investment restrictions
(typically, leverage constraints on positions in S as well as position limits on short positions in
D). The basis represents differences in risk premia required by different investors. Garleanu and
Pedersen (2009) develop an asset pricing model where risk-tolerant investors are margin
constrained but risk-averse investors are not. They show that if the risk tolerant investor is long
S and also long D, then in equilibrium the basis is:
Brunnermeier and Pedersen (2009) study the feedback effects between margins
and market conditions.
( )Dt
Stt
DSt mmBasis −=− ψ (5)
9 Geanakoplos (2003) derive margin constraints endogenously and shows the optimality of margin debt contracts.

11
where ψ is the margin constrained investor’s shadow cost of capital and mi is the margin on
security i. A positive basis arises if the margin on D is lower than that on S, which induces the
risk tolerant investor to accept a lower risk premium on D.10
Alternatively, if the risk-tolerant investor has a long position in S and a short position in
D, then in equilibrium the basis is a function of the sum of the two margins:
( )Dt
Stt
DSt mmBasis +=− ψ (6)
The intuition is that the risk-tolerant investor has to pay margins on both legs of the basis trade.
A. Why were Deviations from Covered Interest Parity Positive?
In theory, deviations from CIP could be positive or negative. But, as we have seen, they
were consistently positive. We use the framework of Garleanu and Pedersen (2009) to
understand the sign of the basis after the crisis. In the context of CIP deviations, the implied rate
may be viewed as the return from the FX swap position D while the Libor rate is the return on
the spot dollar position S. 11
The positive basis means that the situation described by (6) applies---leveraged investors
have long positions in S (i.e. USD) and short positions in D (i.e. FX swaps). Arbitrageurs can
earn riskless profits by borrowing USD for 3 months at the Libor rate and investing at the euro
Libor rate, while covering the FX risk in the FX swap market. But this arbitrage trade did not
occur due to the shortage of USD arising from reduced supply from lenders as well as increased
The swap dealer quotes the forward differential f/s for the swap
transaction. The return to investing $1 in swaps is (1+if)f/s which is equal to the implied rate.
10 Equations (5) and (6) are limiting results obtained when the relative wealth of the risk tolerant investor approaches zero. In the general case, the basis also depends on the difference in the covariance of returns of S and D with the consumption of the risk-tolerant agent. 11 The investor would swap dollars into euros while simultaneously agreeing to reverse the transaction at the current forward rate and closing the swap in 3 months. Non-US institutions typically obtain dollar funding in the FX swap markets, primarily from US institutions that have a natural dollar deposit base.
12
demand by global banks during the crisis (Coffey, Hrung, Nguyen and Sarkar (2009)). An
example of reduced dollar supply is that U.S. money market funds abruptly stopped purchasing
bank-issued commercial paper after they faced large redemptions following the bankruptcy of
Lehman Brothers (Baba, McCauley, and Ramaswamy (2009)). On the demand side, McGuire
and von Peter (2009) estimate that the USD “funding gap” of European banks had grown to at
least $1.1 to $1.3 trillion by mid-2007 and they financed this gap from interbank markets, FX
swap markets and central banks. As the first two funding sources dried up during the crisis,
global banks had to pay a premium to obtain USD.
INSERT TABLE 2 HERE
We now propose empirical proxies for margin constraints and the shadow cost of capital
as determinants of the basis. Since arbitrage transactions are not riskless in reality, we also
discuss a number of risk measures. A summary of all variable definitions is in Table 2.
B. Empirical proxy for margin constraint and shadow cost of capital
In this section, we propose empirical measures for relative margin constraints and the shadow
cost of capital, the two variables in (6).
Our empirical proxy for the tightness of margin conditions is the overnight agency MBS-
Treasury repo spread which is the repo rate using agency mortgage-backed securities (MBS) as
collateral minus the repo rate using Treasury securities as collateral.12
12 These are general collateral (GC) repo rates that reference non-specific government securities with the lowest level of counterparty risk (Hordahl and King (2008)). In contrast, specific collateral rates reference particular types of collateral, such as an on-the-run bond.
Repos have become a
primary source of funding for commercial banks, investment banks and securities lenders in
recent times. By mid-2008, the gross amount of repos outstanding (including double counting)
had exceeded $10 trillion, about the same as the total value of assets in the US banking system
13
(Hordahl and King (2008)). Since both MBS and Treasury repo loans are collaterized, and given
the short (overnight) maturity, the spread between them mainly reflects the relative market
illiquidity of the two assets. In particular, agency MBS securities became highly illiquid during
the crisis, leading to an increase in the agency MBS-Treasury repo spread.13 Since margins are
expected to increase with market illiquidity (Brunnermeier and Pedersen (2009)), increases in the
overnight MBS-Treasury repo spread is as a proxy for increasingly tight margin conditions.14
Our source for overnight repo rate data, previously used by Fleming, Hrung and Keane
(2009), is the Federal Reserve Bank of New York’s primary dealer survey. The trading desk at
the New York Fed collects information each morning from dealers on the average overnight
general collateral repo rate at which it has financed its positions in Treasury securities, agency
debt securities, and agency MBS, as well as the quantity of securities financed. An overall
weighted average is then calculated for each collateral type.
Therefore, we expect a positive relation between CIP deviations and the repo spreads.
Since we are examining the USD basis at a 3-month maturity, we also use the 3-month
agency MBS-Treasury repo rate. The 3-month rate is relevant if banks are concerned about
maturity mismatch between funding and investments. A caveat is that counterparty risk may be
a larger component of the repo spread for the 3-month maturity (although increases in credit risk
may increase the haircut on the loan rather than the repo rate). The data is from Bloomberg who
in turn source the data from ICAP North America, a large interdealer broker. Longstaff (2000)
uses this data in his analysis of the term structure of repo rates.
13 Brunnermeier (2009) uses the repo spread (although not of the overnight maturity) to illustrate liquidity risk during the crisis. Gorton and Metrick (2009) discuss the role of repo markets during the financial crisis. 14 Garleanu and Pedersen (2009) use the tightness of credit condition variable in the senior officer bank loan survey as a proxy for increasing tightness. This data, however, is only available at the quarterly frequency.

14
As discussed in Gromb and Vayanos (2002) and Brunnermeier and Pedersen (2009),
funding liquidity and market liquidity premia are tightly linked. Since the repo spread is
intended to capture funding conditions, we also include in our regressions a market liquidity risk
measure. This is the par-OTR yield spread, defined as the yield of a hypothetical 10-year off-the-
run par bond minus the on-the-run 10-year Treasury yield. The data for the on-the-run 10-year
Treasury yield is from Haver Analytics while the par bond yields are from the Federal Reserve
Board.15
The expected sign of the correlation between illiquidity measures and the basis is
ambiguous. Increases in the par-OTR spread have two effects. Increased illiquidity in the US
markets makes it less likely that US institutions would be willing to supply dollars in off-shore
dollar markets which should increase the basis. However, increased illiquidity also increases
unsecured interest rates in the US, which tends to decrease the basis.
The par-OTR spread is a measure of the market liquidity premium in the Treasury
market and is taken to be a proxy for systematic market liquidity risk in the economy. Since
Treasury yields usually fall when demand for liquid and safe securities rises, systematic liquidity
premia is likely to be correlated with Treasury liquidity premia.
Garleanu and Pedersen (2009) show that the arbitrageur’s shadow cost of capital is the
interest rate spread between an uncollaterized and collaterized loan. We use the 3-month TED
spread (i.e. the Libor minus the Treasury bill rate) and the 3-month Libor-Repo spread as proxies
for the shadow cost of capital.
15 The hypothetical 10-year Treasury trading at par is derived from a Nelson-Siegel-Svensson zero-coupon curve estimated from off-the-run Treasury coupon securities. In contrast to our approach, prior literature has used the yield on an actual off-the-run bond to compute the on-off spread. However, the actual yield depends on the specialness of Treasury securities (Duffie (1996)) potentially leading to negative on-off-spreads, as has frequently been the case in recent periods.
15
C. Empirical measures of counterparty risk
To the extent that arbitrage became risky during the crisis, CIP deviations need not
constitute violations of the Law of One Price. Counterparty risk increased substantially during
the crisis, which increased unsecured rates. Even secured funding sources such as FX swaps
were affected since there was increased probability that the contracts would have to be replaced
on unfavorable terms in case of counterparty default (Duffie and Huang (1996)).
Our credit risk measures are:
• CDX: The CDX investment grade (IG) index of CDS prices
• Dispersion: The quote dispersion of Libor panel banks
CDX represents the average default risk in the economy. Data on the 5-year CDX IG index
is from Markit. The index covers 125 names in North America and represents the average credit
risk of major global firms.
In addition to its level, uncertainty about credit risk is an important determinant of interest
rates (Flannery (1996), Heider et al (2009), Pritsker (2009)). We represent this uncertainty by
the quote dispersion among Libor panel banks. We obtain from Bloomberg the daily 3-month
USD Libor quotes of the 16 banks in the Libor panel of the British Bankers’ Association and
calculate the maximum minus the minimum of the quotes each day. The quote dispersion shows
the extent to which some Libor panel banks report greater borrowing costs, and therefore more
default risk, compared to the typical Libor panel bank. Our uncertainty measure is consistent
with those proposed in Heider et al (2009) and Pritsker (2009) (i.e. the spread in default
probabilities assigned by lenders to a borrower’s investments). The expected sign of the
correlation of credit risk with the basis depends on whether the credit risk is greater for US or for

16
non-US institutions. If the credit risk increases more for non-US firms then iF increases more
than USD Libor and so the basis increases; in the reverse case, the basis decreases.
Finally, we control for foreign exchange risk and general market risk using:
• EVOL: Options-implied volatility in the euro-USD foreign exchange market.
• VIX: Options-implied volatility in the equity market
The implied volatility for the euro-USD exchange rate is calculated by JP Morgan, and this data
is obtained from Bloomberg. FX volatility determines the cost of hedging FX risk. The equity
implied volatility is given by the VIX measure, data for which is pulled from Bloomberg. Since
previous work has found VIX to be a significant determinant of asset prices in several markets,
we take VIX to stand for the risk aversion of investors in the broader financial markets.16
IV. Explaining CIP Deviations: Results
In this section, we explain deviations in CIP using measures of funding constraints and
risk measures. We examine whether CIP deviations constitute a breakdown in the Law of One
Price due to capital constraints of arbitrageurs---specifically, changes in margin constraints and
arbitrageurs’ cost of capital (section A). In section B, we explore the hypothesis that CIP
deviations reflect the increased credit risk of arbitrage transactions. In section C, we decompose
aggregate credit risk into the credit risk of non-US institutions relative to US firms.
A. CIP deviations, margin constraints and shadow cost of capital
INSERT FIGURE 4 HERE
16 VIX has been found to be a significant determinant of prices of foreign exchange (Brunnermeier, Nagel and Pedersen (2008)), and sovereign CDS (Longstaff, Pan, Pedersen and Singleton (2007)).
17
Arbitrageurs’ funding constraints are determined by the tightness of margin conditions
and their shadow cost of capital. Figure 4 plots the Agency MBS-Treasury repo spread (our
proxy for margin conditions) for the overnight (MBS-T-ON) and 3 month (MBS-T-M3)
maturities along with CIP deviations based on the euro-dollar FX rate and the USD Libor rate.
Except for brief periods after the Lehman bankruptcy, the repo spreads are positive, consistent
with the greater illiquidity of MBS relative to Treasuries. We observe that the basis and repo
spreads co-move for much of the period.
INSERT TABLE 3 HERE
Table 3 shows the correlation of CIP deviations with the MBS-Treasury repo spreads for
different crisis periods. Prior to the crisis (Panel A), the basis and the repo spread have a
correlation of 0.30 for the overnight spread and 0.22 for the 3-month spread. From August 2007
till September 15 2008 (Panel B), the basis and the repo spreads tend to diverge, and the
correlation becomes negative. The negative co-movement generally occurs starting in March
2008 (see Figure 4) when the Federal Reserve initiated the TSLF program designed to provide
liquid Treasury collateral in exchange for less liquid collateral (e.g. MBS). This program
reduced the illiquidity premium in the repo spread (Fleming, Hrung and Keane, 2009) while the
basis was still increasing. After September 15 2008 (Panel C), the correlation becomes positive
again (0.50 for the overnight spread and 0.38 for the 3-month spread). Finally, the correlation
between the basis and the Par-OTR spread is negative prior to the crisis, positive in the pre-
Lehman period and negative again after the Lehman bankruptcy, suggesting that the relative
liquidity risk of US vis-à-vis non-US firms was changing over the course of the crisis.
INSERT FIGURE 5 HERE

18
The expected association between the CIP deviation and the TED or the Libor-Repo
spread is positive and Figure 5 shows that they generally co-move together, as also shown by
Garleanu and Pedersen (2009). However, between August 2007-September 15 2008, the
correlation is negative between the basis and the TED spread, which may be attributed to a
reduction in the shadow cost of capital after the Fed’s TSLF program.
INSERT TABLE 4 HERE
Table 4 shows results from a regression of the USD basis on its own lag, the repo spread,
the TED spread and the Par-OTR spread for the pre-crisis period, the pre-Lehman and post-
Lehman crisis periods. Panel A shows results when we use the overnight repo spread. For the
pre-crisis period, the coefficient on the margin constraint is positive and significant, consistent
with tighter margin conditions increasing CIP deviations, as predicted. The coefficient on the
TED spread is also positive and significant at the 10% level. From August 2007 to September 15
2008, the basis becomes highly autocorrelated as the coefficient on the lag basis is 0.91. The
repo spread is negative and no longer significant, perhaps indicating the effects of the Fed’s
TSLF program. However, the market liquidity risk measure, Par-OTR becomes a positive and
significant determinant of the basis at this time. The TED spread remains positive and
significant at the 10% level. In the final crisis period, the repo spread is again positively
associated with the basis and the coefficient becomes large in magnitude and highly significant.
Panel B of Table 4 repeats the regressions using the 3-month repo spread. The results are
qualitatively similar to those using the overnight spread: the repo spread is generally positively
associated with CIP deviations except during the period when TSLF was initiated. The Par-OTR
spread becomes negatively and significantly related to CIP deviations in the post-Lehman period,
whereas the coefficient is positive and insignificant when using the overnight repo spread. The

19
difference likely reflects differences in the correlation of Par-OTR with the overnight and 3-
month repo spreads in this period (see Panel C of Table 3).
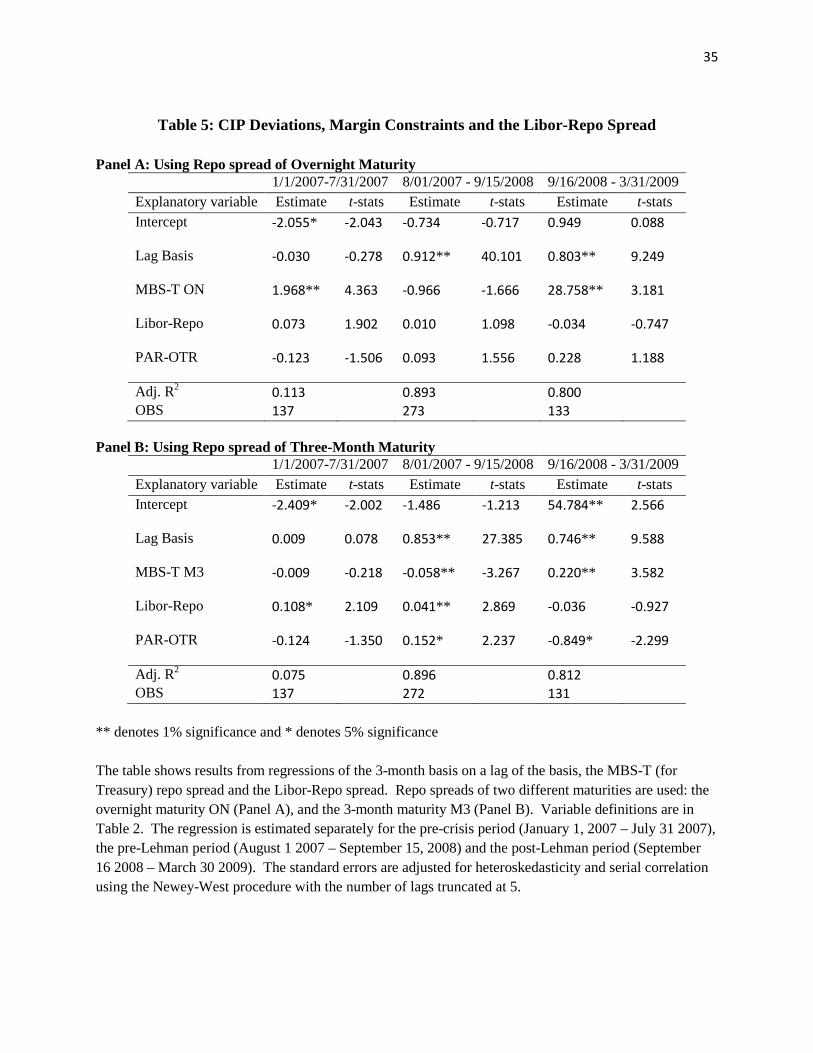
INSERT TABLE 5 HERE
Table 5 repeats these regressions while replacing the TED spread with the Libor-Repo
spread. These results generally track those for the TED spread: a positive relationship of CIP
deviations with margin conditions (except during the pre-Lehman crisis period) and with the
Libor-Repo spread.
B. CIP deviations, credit risk and liquidity risk
Table 3 shows that the correlation of the basis with the CDX index is positive before the
Lehman bankruptcy and negative afterwards, suggesting that the relative credit risk of US
institutions vis-à-vis non-US firms changed during the course of the crisis. In contrast, the
correlation of the basis with credit risk dispersion (Disp.) is always positive in the crisis period
and is more than 60% after the Lehman bankruptcy. Dispersion has relatively low correlation with
CDS prices in the pre-crisis period, and higher correlations in the crisis period, consistent with
Heider et al (2009) who predict that asymmetry and levels of credit risk are positively associated.
EVOL and VIX have a correlation of close to 50% with the basis in the pre-Lehman period and
more moderate correlation afterwards.
INSERT TABLE 6 HERE
In Table 6, we show results from a regression that expands on the previous analysis by
adding credit risk measures. Panel A shows results when we use the TED spread as the shadow
cost of capital. Dispersion is significantly related to the basis in the pre-crisis and post-Lehman
period, with negative and positive signs. The different signs reflect the differential effects of
credit risk on the dollar and euro unsecured funding markets. The CDX index is not significantly

20
related to the basis. VIX and EVOL are positive significant determinants of the basis in the post-
Lehman period, although EVOL is only significant at the 10% level. The sign and significance
of the repo spread and the TED spread are the same as before, with one exception. In the post-
Lehman period, the TED spread has a negative and significant association with the basis, in
contrast with a negative and insignificant sign earlier. Therefore, controlling for the effect of
credit risk, the increase in the shadow cost of capital had a greater impact on dollar borrowing
rates relative to euro rates. Panel B reports results when the Libor-Repo spread is used; the
results are similar to those in Panel A. One difference is that the CDX index is now a negative
and significant determinant of the basis in the pre-crisis period.
C. Relative credit risk of US versus non-US firms
The expected sign of the correlation of credit risk with the basis depends on whether the
credit risk increases more for US firms (which increases USD Libor) or more for non-US
institutions (which increases the foreign interest rate iF). Therefore, we define a measure of
relative default risk:
• Relative default risk: The average CDS prices of 13 non-US banks in the Libor panel
minus the average CDS prices of 10 systematically important US banks.17
INSERT FIGURE 6 HERE
Figure 6 plots the relative default risk measure which was close to zero in the beginning
of 2007 and has gradually become more negative, indicating that the default risk of large US
17 The 10 systematically important US banks are those defined by the Treasury in its TARP plan. : Bank of America, Bank of NY Mellon, Citigroup, Goldman Sachs, JP Morgan Chase, Morgan Stanley, Merrill Lynch, State Street Corp, Wachovia, Wells Fargo. Bank of America agreed to buy Merrill Lynch on September 15 2008 but the acquisition did not officially close till January 2009. Wells Fargo acquired Wachovia on October 4 2008.
21
banks has increased more than large non-US banks during the crisis. Therefore, we expect the
relative credit risk measure to be negatively correlated with the basis.
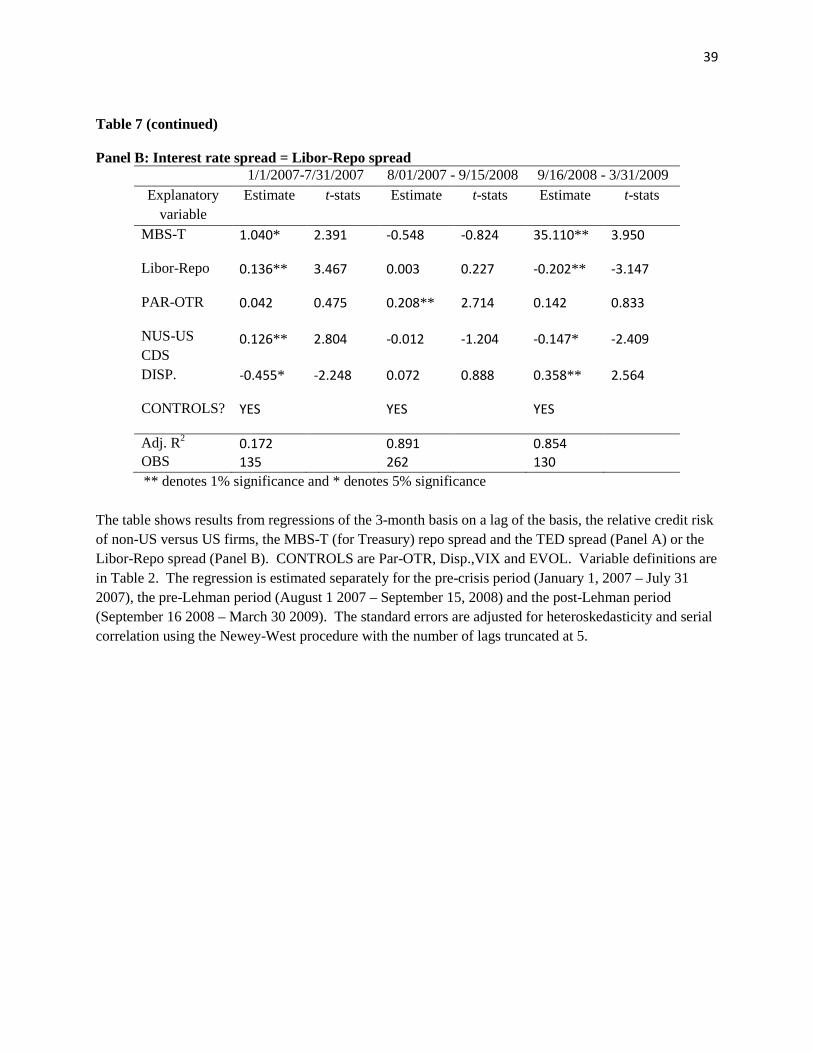
INSERT TABLE 7 HERE
Table 7 shows results from a regression with the CDX index replaced by the relative
credit risk of non-US vis-à-vis US banks. For brevity, we only show results for funding
constraints and credit risk measures. The results in Panel A, using the TED spread, shows that
the relative credit risk measure is significant in the crisis periods. The results in Panel B, using
the Libor-Repo spread, shows that it is significant in every period except the pre-Lehman crisis
period. In both panels, the sign is positive in the pre-crisis and negative in the crisis period,
consistent with expectations. Relative credit risk is another measure of dispersion (between US
and non-US firms instead of between Libor banks, as was the case earlier). The results therefore
provide further evidence of the significance of this measure, especially after the Lehman failure.
The results indicate that tighter margin conditions associated with higher CIP deviations.
An exception is the early period of the crisis when the Fed intervened to relax collateral
constraints, at a time when CIP deviations were still increasing. However, market liquidity risk
(i.e. the on-off Treasury spread) remains a significant determinant of CIP deviations even during
this period. Overall, funding constraints were significant determinants of the basis in all periods.
The cost of capital is a significant determinant of the basis, with the sign depending on whether
the impact is greater in the euro or the dollar markets. Credit risk--and, in particular, its
dispersion---is particularly important in understanding CIP deviations during the post-Lehman
crisis period. Indeed, the Federal Reserve provided unlimited amounts of dollars to foreign
Central Banks after September 20008. In the next section, we examine whether the Fed’s dollar
liquidity supply eased funding constraints and reduced the basis.

22
V. Central Bank Currency Swaps and CIP Deviations
In this section, we investigate the effect of Federal Reserve announcements and actual
operations related to the swap lines on CIP deviations. To the extent that the deviations are due
to arbitrageur’s funding constraints in the international money markets, the supply of dollars by
the Federal Reserve may be expected to alleviate the problem. In the Fed’s bilateral currency
swap arrangements, it supplies USD in exchange for foreign currency for a specified period to
foreign Central Banks who then supplies USD to banks in its own jurisdictions via auctions.
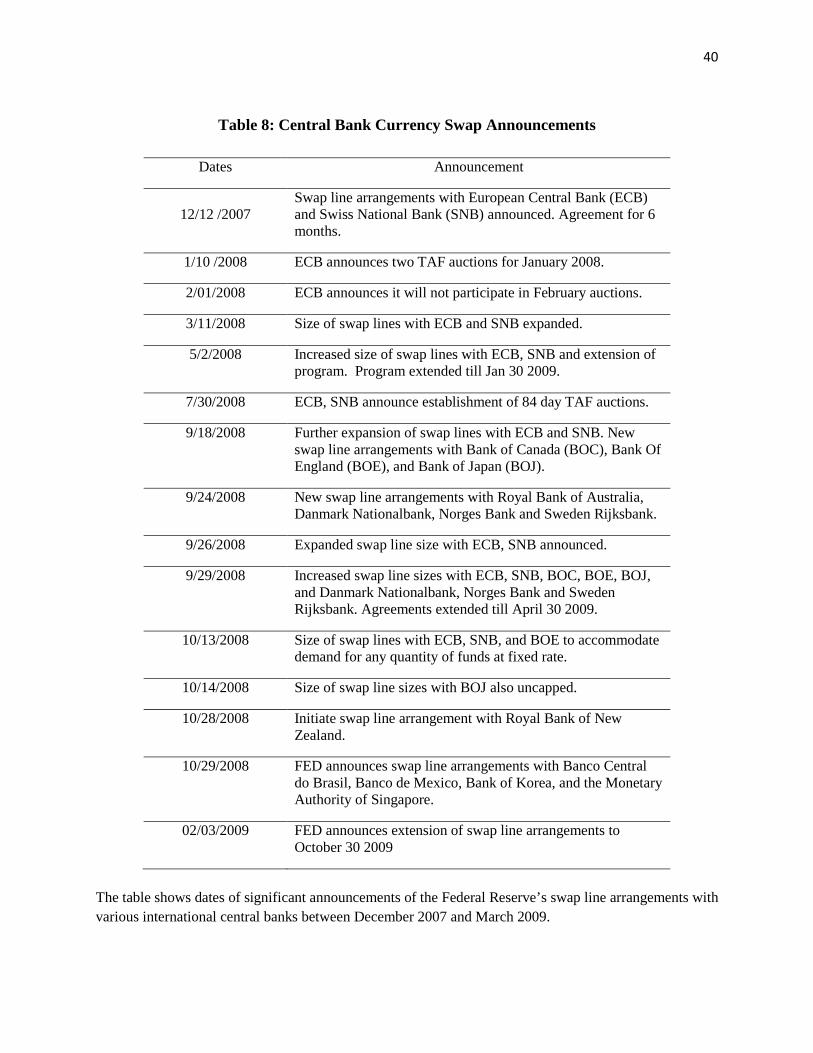
INSERT TABLE 8 HERE
Table 8 shows significant announcement dates for the program. The program was
initiated on December 12 2007 with swap lines arranged with the European Central Bank (ECB)
and the Swiss National Bank (SNB). As the USD shortage became more acute, the program was
expanded in size and scope. After Lehman’s bankruptcy, the cap on the amount of funds
distributed was removed altogether on October 13 2008, when the Fed promised to accommodate
any quantity demanded at the auctions.
To determine the effect of the swap lines program, we define a dummy variable that
equals 1 on days when the Fed announces an increase in funds supplied. Correspondingly, the
dummy has value -1 on February 1 2008 when the ECB withdrew from the February auctions,
and so effectively this constituted a negative supply event. We define a separate dummy variable
for the October 13 announcement “uncapping” the swap lines. We also define a dummy variable
for days when the Fed conducted TAF auctions where US banks and US branches of foreign
banks participated and bid for USD. We do not include dummy variables for ECB auction dates
since these dates coincided with TAF auction days leading to a collinearity problem in the
regressions. Since auction days are scheduled ahead of time on specific days of the month, we
23
expect the swap program to have an impact mainly on announcement days, perhaps with the
exception of the initial auctions when banks were still learning about the program.
Since the swap lines are expected to reduce liquidity risk, we control for credit risk but
not for liquidity risk in estimating their effects. Also, we use the change rather than the level of
the basis as the dependent variable. This is necessary to account for persistence in the impact of
swap lines on the basis, given that we are using dummy variables to capture the effect of swap
lines.18
We estimate the following regression to examine the effect of swap lines on the basis:
ttttt CONTROLSAuctionsSwapUncapSwapAnnInterceptBasis εααα +∆++++=∆ $321 (7)
where Δ indicates that the variable is in changes, SwapAnn is a dummy variable for
announcement days of the swap line program, SwapUncap is a dummy variable for October 13
2008 when the size of swap lines became unlimited, $Auctions is a dummy variable for TAF
auction days, and CONTROL are variables to control for credit risk and market risk.
CONTROL includes the CDX index, Disp., VIX, and EVOL. In addition, we include the term
spread defined as the difference between the 10-year Treasury note and the 3-month bill (both
constant maturity). We control for term risk since the loans are for term maturities (mostly for
28 and 84 day maturities) and their effectiveness may depend on the shape of the yield curve.
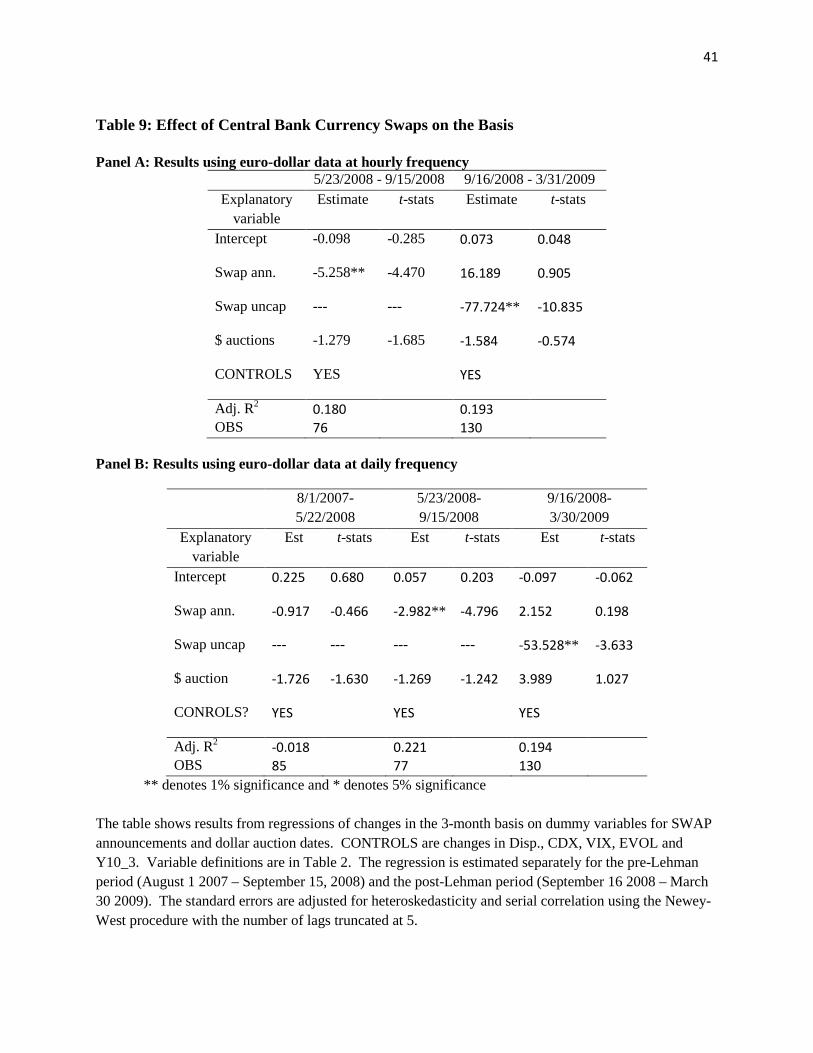
INSERT TABLE 9 HERE
The results of the regression are in Table 9. The sample period is August 1 2007 till
March 30 2009. Since announcement effects may be short-lived, higher frequency of data is
likely to improved results. So, we initially report results in Panel A for the basis using the hourly
euro-dollar FX data which is available from May 23 2008. To check for robustness, we repeat
18 McAndrews et al (2009) make a similar point when estimating the effect of TAF using dummy variables.

24
the regression using the daily data and report these results in Panel B. The results in Panel A
indicate that, from May 23 2008 to September 15 2008, the swap line announcements reduce the
basis by an average of more than 5 basis points. In addition, the dollar auctions lower the basis
by an additional 1.3 basis point per auction, although this result is only significant at the 10%
level. For the period September 16 2008 to March 2009, the announcement uncapping the swap
lines had a substantial effect on the basis, which is reduced by almost 80 basis points on the day.
The remaining announcement days had no statistically significant effect on the swap lines. This
result is intuitive since counterparty risk became a significant determinant of the basis in the
post-Lehman period and the Fed’s program primarily served to reduce funding liquidity risk.
The results in Panel B, using daily data, are qualitatively similar when considering the
same sample period. The swap announcements reduced the basis by an average of 3 basis points
from May 23 2008 to September 15 2008, and the uncapping announcement reduced the basis by
almost 55 basis points. From August 2007 to May 22 2008, we find that the swap
announcements were not statistically significant while the auctions reduced the basis by about 2
basis points per auction (although this effect is significant only at the 10% level).
In summary, announcements effects and actual operations related to the Fed’s swap lines
program appear to have succeeded in reducing the basis when funding constraints were binding.
Thus, the swap lines reduced the basis in the pre-Lehman crisis period and again in October 2008
when the swap lines became unlimited in size. This is consistent with enhanced overnight repo
spreads at these times (see Figure 4). Announcements after October 2008 had no statistically
significant effects on CIP deviations. However, the latter result must be interpreted cautiously
since our study does not address the longer-term implications of the Fed’s program. For
example, CIP deviations decreased substantially from the high of 233 basis points in September

25
2008 to about 35 basis points at the end of March 2009 but we only examine announcement
effects of the swap lines program, rather than the broader impact of the program over time.
VI. Conclusion
In this paper, we document substantial and significant deviations from CIP during the
financial crisis, with particularly dramatic deviations following the bankruptcy of Lehman
Brothers. This result is robust to the use of alternative benchmark dollar interest rates and
different currency pairs. Our results show that funding constraints of arbitrageurs (as measured
by our proxies for margin conditions and the cost of capital) are significant determinants of CIP
deviations. In addition, we find evidence that uncertainty about counterparty risk became an
issue after September 2008, as cash flows previously perceived as riskless became risky. These
results indicate limits to arbitrage transactions in the international capital markets during the
crisis partly due funding constraints and partly due to counterparty credit risk.
To ease short-term dollar funding constraints, the Federal Reserve agreed to supply
dollars to foreign central banks via reciprocal currency arrangements (swap lines) with several
developed and a few emerging market countries. We find that announcement days of the swap
lines program were associated with a reduction in the basis. We further find that the actual
auctions of dollars were also effective in bringing down the basis on the day of the operations.
The announcement that swap lines would become uncapped in October 2008 resulted in a
reduction of more than 55 basis points in the basis. Although subsequent announcements of
swap lines programs did not have a significant effect on the basis, these results appear to point to
the success of the Federal Reserve in acting as the international lender of last resort at a time
when short-term dollar funding was impaired globally.

26
References
Akram, Farooq, Rime, Dagfinn and Lucio Sarno, 2008, Arbitrage in the Foreign Exchange
Market: Turning on the Microscope, Journal of International Economics, 76, 237-253.
Baba, Naohiko, Robert N. McCauley, and Srichander Ramaswamy. 2009. “U.S. Dollar Money
Market Funds and Non-U.S. Banks.” BIS Quarterly Review, March: 65-81.
Baba, Naohiko, Frank Packer, and Teppei Nagano. 2008. “The Spillover of Money Market
Turbulence to FX Swap and Cross-Currency Swap Markets.” BIS Quarterly Review,
March: 73-86.
Baba, Naohiko and Frank Packer, 2008, Interpreting Deviations from Covered Interest Rate
Parity during the Financial Market Turmoil of 2007-2008, BIS.
Basak, Suleyman and Benjamin Croitoru, 2006, On the Role of Arbitrageurs in Financial
Markets, Journal of Financial Economics, 81, 1, 143-173.
Brunnermeier, M., 2009, “Deciphering the 2007-08 Liquidity and Credit Crunch,” Journal of
Economic Perspectives, 23, 1, 77-100.
Brunnermeier, Markus, Nagel, Stefan and Lasse H. Pedersen, 2008, Carry Trades and Currency
Crashes, NBER Macroeconomics Annual 2008, ed. by D. Acemoglu, K. Rogoff and M.
Woodford.
Brunnermeier, Markus and Lasse H. Pedersen, 2009 Market Liquidity and Funding Liquidity,
Review of Financial Studies, 22(6), 2201-2238.
Coffey, Niall, Hrung, Warren, Nguyen, Hoai-Luu and Asani Sarkar, 2009, The Global Financial
Crisis and the Offshore Dollar Markets, Current Issues in Economics and Finance, 15, 6.
Darrell Duffie, 1996, Special Repo Rates, Journal of Finance, 51, 2, 493-526.
Duffie, Darrell and Ming Huang, 1996, Swap Rates and Credit Quality, Journal of Finance, 51,
921-950.
27
Flannery, M. J., 1996, “Financial Crises, Payment System Problems, and Discount Window
Lending,” Journal of Money, Credit and Banking, 28, 4, 804-824.
Fleming, Michael J., Hrung, Warren B. and Frank M. Keane, 2009, Repo Market Effects of The
Term Securities Lending Facility, Working Paper, Federal Reserve Bank of New York.
Frenkel, Jacob A. and Richard M. Levich, 1977, Transaction Costs and Interest Arbitrage:
Tranquil versus Turbulent Periods, The Journal of Political Economy, 85, 6, 1209-1226.
Geanakoplos, John, 2003, Liquidity, Default and Crashes: Endogenous Contracts in General
Equilibrium, in Advances in Economics and Econometrics: Theory and Applications II,
Econometric Society Monographs: Eighth World Congress, ed. by M. Dewatripont, L. P.
Hansen, and S.J. Turnovsky. Cambridge University Press, Cambridge, UK, 2, 170-205.
Garleanu, Nicolae and Lasse Heje Pedersen, 2009, Margin-Based Asset Pricing and Deviations
from the Law of One Price, Working Paper, NYU and UC Berkeley.
Gorton, Gary, 2009, Slapped in the Face by the Invisible Hand: Banking and the Panic of 2007,
Working Paper, Yale University.
Gorton G. and A. Metrick (2009), “Securitized Banking and the Run on the Repo”, Yale ICF
Working Paper No. 09-14.
Griffoli, Tommaso M. and Angelo Ranaldo, 2009, Deviations from Covered Interest Rate Parity
During the Crisis: A Story of Funding Liquidity Constraints, Working Paper, The Swiss
National Bank.
Gromb, Denis and Dimitri Vayanos, 2002, Equilibrium and Welfare in Markets with Financial
Constrained Arbitrageurs, Journal of Financial Economics, 66 (2-3), 361-407.
Heider, Florian, Hoerova, Marie and Cornelia Holthausen, 2009, “Liquidity Hoarding and Interbank
Market Spreads: The Role of Counterparty Risk,” Working Paper, ECB.
Alan R. Holmes, 1959, The New York Foreign Exchange Market. Federal Reserve Bank of New
York, New York.

28
Holmes, Alan R. and Francis H. Schott, 1965, The New York Foreign Exchange Market. Federal
Reserve Bank of New York, New York.
Hordahl, Peter and Michael R. King, 2008. “Developments in Repo Markets During the
Financial Turmoil.” BIS Quarterly Review, December: 37-53.
Keynes, John M., 1923, A Tract on Monetary Reform. London: Macmillan.
Longstaff, Francis, 2000, The Term Structure of Very Short Term Rates: New Evidence for the
Expectations Hypothesis, Journal of Financial Economics, 58, 397-415.
Longstaff, Francis, Pan, Jun, Pedersen, Lasse H. and Kenneth J. Singleton, 2007, How Sovereign
is Sovereign Credit Risk, Working Paper, Stanford University.
McAndrews, James, Sarkar, Asani and Zhenyu Wang, 2009, The Effect of the Term Auction
Facility on the London Inter-Bank Offered Rate, Working Paper, Federal Reserve Bank of
New York.
McGuire, Patrick and Goetz von Peter, 2009, The US Dollar Shortage in Global Banking and the
International Policy Response, BIS.
M. Pritsker, 2009, “Informational Easing: Improving Credit Conditions Through the Release of
Information,” Forthcoming, Economic Policy Review.
Shleifer, Andrei and Larry H. Summers, 1990, The Noise Trader Approach to Finance, Journal
of Economic Perspectives, 4(2), 19-33.
Shleifer, Andrei and Robert W. Vishny, 1997, The Limits of Arbitrage, Journal of Finance,
52(1), 35-55.
Taylor, Mark P., 1989, Covered Interest Arbitrage and Market Turbulence, Economic Journal
99, 376-391.

29
Table 1: Measures of CIP Deviation
Panel A: Estimates based on euro-dollar exchange rate and alternative dollar interest rates
1/1/2007-7/31/2007 8/01/2007 - 9/15/2008 9/15/2008 - 3/31/2009 Interest
rate FX data
frequency Mean Max Mean Max Mean Max
LIBOR Daily -1.322 1.740 18.046 39.674 65.353 233.022
Obs. 144 279 135
LIBOR Hourly --- --- 27.073 40.772 70.024 246.314
Obs. --- 79 134
NYFR Daily --- --- 25.090 38.869 55.915 195.022
Obs. --- 75 133
T. Bill Daily 35.782 79.226 141.555 242.260 247.003 572.891
Obs. 145 281 135

30
Table 1 (continued) Panel B: Estimates based on dollar LIBOR rate and alternative currencies vis-à-vis dollar
8/01/2007 - 9/15/2008 9/15/2008 - 3/31/2009 Currency Mean Max Mean Max AUS 10.790 40.218 122.483 509.532
Obs 275 73
CHF 20.576 43.328 41.301 191.037
Obs 275 134
GBP 24.342 51.676 90.038 235.752
Obs 275 133
JPY 11.950 31.471 32.257 219.336
Obs 275 134
NZD 4.847 37.193 49.983 140.820
Obs 275 73
The table shows the mean and maximum values of deviations from Covered Interest Rate Parity (CIP) in basis points for the pre-crisis period (January 1, 2007 – July 31 2007), the pre-Lehman period (August 1 2007 – September 15, 2008) and the post-Lehman period (September 16 2008 – March 30 2009). The deviations are equal to the US dollar (USD) interest rate implied by the CIP relation (“the implied rate”) minus the USD interest rate. In Panel A of the table, the implied rate is estimated using the euro-dollar exchange rate and the euro LIBOR rate. The USD interest rates are USD LIBOR, NYFR or Treasury bill rates. The euro-dollar data frequency is either daily or hourly. The hourly dollar-euro data is available from May 23 2008 only. In Panel B of the table, the USD interest rate is USD LIBOR. The implied rate is based on the following exchange rates: Australian dollar (AUS)-USD, Swiss franc (CHF)-USD, British pound (GBP)-USD, Japanese Yen (JPY)-USD and New Zealand dollar (NZD)-USD. The AUS-USD and NZD-USD exchange rate data are only available through December 31 2008.

31
Table 2: Variable Definitions Basis USD interest rate implied by the CIP relation (“the implied rate”) minus the USD
LIBOR rate. The implied rate is estimated using the euro-dollar spot and forward exchange rates and the euro LIBOR rate.
MBS-T ON Agency MBS repo rate minus Treasury repo rate, both of overnight maturity. MBS-T M3 Agency MBS repo rate minus Treasury repo rate, both of 3-month maturity. Libor-Repo LIBOR rate minus Treasury repo rate, both of 3-month maturity. TED LIBOR rate minus Treasury bill rate, both of 3-month maturity. Par-OTR Yield on hypothetical off-the-run Treasury trading at par minus on-the-run
Treasury yield, both of 10-year maturity CDX CDX IG index NUS-US CDS Average of CDS prices of 13 non-US banks in LIBOR panel minus average of
CDS prices of 10 systemically important US banks Disp. Maximum minus minimum quote of banks in USD LIBOR panel VIX Equity implied volatility Index EVOL Euro-US dollar exchange rate implied volatility Swap ann. Dummy variable equal to 1 on days with announcements of the Fed’s currency
swap lines program (dates in Table 7) Swap uncap Dummy variable equal to 1 on day when the Fed announced that the size of the
currency swap lines would become unlimited $ auctions Days when the Fed auctioned dollars to banks The table describes the variables used in the regressions.

32
Table 3: Correlation of Basis and Its Determinants
Panel A: January 1, 2007 –July 31, 2007 Basis MBS-T
ON MBS-T
M3 TED LIB-
Repo Par_ OTR
Disp. CDX VIX EVOL
Basis 1.000
MBS-T ON
0.297 1.000
MBS-T M3
0.218 0.402 1.000
TED 0.244 0.549 0.392 1.000
Libor-Repo
0.282 0.406 0.855 0.507 1.000
Par_OTR -0.138 -0.033 0.143 0.056 0.049 1.000
Disp. -0.183 -0.333 -0.431 -0.117 -0.368 -0.267 1.000
CDX 0.006 0.228 0.628 0.249 0.658 0.505 -0.327 1.000
VIX 0.010 0.286 0.482 0.349 0.453 0.521 -0.286 0.800 1.000
EVOL -0.198 -0.282 -0.230 -0.401 -0.322 0.101 0.061 -0.055 -0.129 1.000
Panel B: August 1, 2007 –September 15, 2008
Basis MBS-T ON
MBS-T M3
TED LIB- Repo
Par_ OTR
Disp. CDX VIX EVOL
Basis 1.000
MBS-T ON
-0.289 1.000
MBS-T M3
-0.400 0.601 1.000
TED -0.054 0.300 0.535 1.000
Libor-Repo
0.114 0.406 0.685 0.732 1.000
Par_OTR 0.472 0.044 0.109 -0.118 0.258 1.000
Disp. 0.069 0.110 0.213 0.530 0.369 -0.296 1.000
CDX 0.196 -0.016 0.071 -0.238 0.034 0.720 -0.514 1.000
VIX -0.455 0.370 0.383 0.152 0.014 0.155 -0.205 0.331 1.000
EVOL 0.498 -0.046 -0.018 -0.053 0.211 0.732 -0.214 0.679 0.101 1.000

33
Table 3 (continued) Panel C: September 16 2008 –March 30, 2009
Basis MBS-T ON
MBS-T M3
TED LIB- Repo
Par_ OTR
Disp. CDX VIX EVOL
Basis 1.000
MBS-T ON 0.497 1.000
MBS-T M3 0.383 0.040 1.000
TED 0.605 0.616 0.442 1.000
Libor-Repo 0.492 0.547 0.483 0.967 1.000
Par_OTR -0.380 -0.586 0.315 -0.357 -0.251 1.000
Disp. 0.611 0.607 0.329 0.898 0.843 -0.469 1.000
CDX -0.112 -0.401 0.112 -0.284 -0.256 0.380 -0.405 1.000
VIX 0.350 -0.099 0.652 0.450 0.504 0.296 0.308 0.355 1.000
EVOL -0.124 -0.553 0.330 -0.277 -0.215 0.651 -0.301 0.339 0.324 1.000
The table shows the correlations between the basis and its determinants for the pre-crisis period (January 1, 2007 – July 31 2007; Panel A), the pre-Lehman period (August 1 2007 – September 15, 2008; Panel B) and the post-Lehman period (September 16 2008 – March 30 2009; Panel C). Variable definitions are in Table 2.

34
Table 4: CIP Deviations, Margin Constraints and TED Spread
Panel A: Repo spread of Overnight Maturity 1/1/2007-7/31/2007 8/01/2007 - 9/15/2008 9/16/2008 - 3/31/2009
Explanatory variable Estimate t-stats Estimate t-stats Estimate t-stats Intercept -0.847 -1.782 -1.651 -1.539 -0.112 -0.010
Lag Basis 0.015 0.130 0.910** 39.765 0.822** 9.735
MBS-T ON 1.873** 3.652 -0.846 -1.384 24.046** 3.287
TED 0.011 1.809 0.011 1.819 -0.020 -0.478
PAR-OTR -0.132 -1.689 0.120* 2.081 0.204 0.988
Adj. R2 0.110 0.891 0.793 OBS 141 276 135
Panel B: Repo spread of Three-Month Maturity
1/1/2007-7/31/2007 8/01/2007 - 9/15/2008 9/16/2008 - 3/31/2009 Explanatory variable Estimate t-stats Estimate t-stats Estimate t-stats Intercept -1.118* -1.960 -2.550* -2.085 54.890** 2.467
Lag Basis 0.004 0.038 0.863** 27.052 0.753** 9.028
MBS-T M3 0.054 1.751 -0.047* -2.374 0.216** 3.368
TED 0.012* 2.307 0.024* 2.570 -0.028 -0.724
PAR-OTR -0.146 -1.727 0.216** 2.952 -0.865* -2.257
Adj. R2 0.080 0.894 0.812 OBS 137 275 132
** denotes 1% significance and * denotes 5% significance The table shows results from regressions of the 3-month basis on a lag of the basis, the MBS-T (for Treasury) repo spread and the TED spread. Repo spreads of two different maturities are used: the overnight maturity ON (Panel A), and the 3-month maturity M3 (Panel B). Variable definitions are in Table 2. The regression is estimated separately for the pre-crisis period (January 1, 2007 – July 31 2007), the pre-Lehman period (August 1 2007 – September 15, 2008) and the post-Lehman period (September 16 2008 – March 30 2009). The standard errors are adjusted for heteroskedasticity and serial correlation using the Newey-West procedure with the number of lags truncated at 5.
35
Table 5: CIP Deviations, Margin Constraints and the Libor-Repo Spread
Panel A: Using Repo spread of Overnight Maturity 1/1/2007-7/31/2007 8/01/2007 - 9/15/2008 9/16/2008 - 3/31/2009
Explanatory variable Estimate t-stats Estimate t-stats Estimate t-stats Intercept -2.055* -2.043 -0.734 -0.717 0.949 0.088
Lag Basis -0.030 -0.278 0.912** 40.101 0.803** 9.249
MBS-T ON 1.968** 4.363 -0.966 -1.666 28.758** 3.181
Libor-Repo 0.073 1.902 0.010 1.098 -0.034 -0.747
PAR-OTR -0.123 -1.506 0.093 1.556 0.228 1.188
Adj. R2 0.113 0.893 0.800 OBS 137 273 133
Panel B: Using Repo spread of Three-Month Maturity
1/1/2007-7/31/2007 8/01/2007 - 9/15/2008 9/16/2008 - 3/31/2009 Explanatory variable Estimate t-stats Estimate t-stats Estimate t-stats Intercept -2.409* -2.002 -1.486 -1.213 54.784** 2.566
Lag Basis 0.009 0.078 0.853** 27.385 0.746** 9.588
MBS-T M3 -0.009 -0.218 -0.058** -3.267 0.220** 3.582
Libor-Repo 0.108* 2.109 0.041** 2.869 -0.036 -0.927
PAR-OTR -0.124 -1.350 0.152* 2.237 -0.849* -2.299
Adj. R2 0.075 0.896 0.812 OBS 137 272 131
** denotes 1% significance and * denotes 5% significance The table shows results from regressions of the 3-month basis on a lag of the basis, the MBS-T (for Treasury) repo spread and the Libor-Repo spread. Repo spreads of two different maturities are used: the overnight maturity ON (Panel A), and the 3-month maturity M3 (Panel B). Variable definitions are in Table 2. The regression is estimated separately for the pre-crisis period (January 1, 2007 – July 31 2007), the pre-Lehman period (August 1 2007 – September 15, 2008) and the post-Lehman period (September 16 2008 – March 30 2009). The standard errors are adjusted for heteroskedasticity and serial correlation using the Newey-West procedure with the number of lags truncated at 5.

36
Table 6: CIP Deviations, Counterparty Risk and Liquidity Risk
Panel A: Interest rate spread = TED spread 1/1/2007-7/31/2007 8/01/2007 - 9/15/2008 9/16/2008 - 3/31/2009
Explanatory variable
Estimate t-stats Estimate t-stats Estimate t-stats
Intercept 1.007 1.066 0.744 0.300 -49.744* -1.967
Lag Basis -0.008 -0.077 0.882** 27.111 0.731** 10.206
Liquidity Risk
MBS-T ON 1.152** 2.468 -0.676 -1.063 34.233** 4.810
TED 0.012* 1.935 0.009 1.127 -0.207** -3.107
PAR-OTR -0.149 -1.468 0.191** 2.347 -0.077 -0.384
Counterparty Risk
CDX -0.002 -0.159 0.003 0.236 0.066 0.910
Disp. -0.523** -2.573 0.072 0.727 0.516** 3.008
Market Risk
VIX -0.023 -0.513 -0.148 -1.464 0.822** 3.918
EVOL -0.098 -1.155 -0.049 -0.204 1.312 1.855
Adj. R2 0.128 0.889 0.836
OBS 139 266 132

37
Table 6 (continued) Panel B: Interest rate spread = Libor-Repo spread
1/1/2007-7/31/2007 8/01/2007 - 9/15/2008 9/16/2008 - 3/31/2009 Explanatory
variable Estimate t-stats Estimate t-stats Estimate t-stats
Intercept -1.766 -1.893 2.439 1.046 -48.000* -2.280
Lag Basis -0.080 -0.841 0.886** 26.902 0.663** 8.039
Liquidity Risk
MBS-T ON 1.498** 3.304 -0.667 -0.996 38.055** 4.541
Libor-Repo 0.131** 3.915 0.002 0.140 -0.208** -3.135
PAR-OTR -0.046 -0.515 0.217** 2.640 -0.110 -0.563
Credit Risk
CDX -0.040** -2.449 -0.003 -0.309 0.045 0.586
Disp. -0.363 -1.796 0.050 0.605 0.382* 2.474
Market Risk
VIX 0.017 0.375 -0.151 -1.535 0.928** 4.064
EVOL -0.051 -0.767 -0.102 -0.430 1.488* 1.946
Adj. R2 0.144 0.892 0.844
OBS 135 263 131
** denotes 1% significance and * denotes 5% significance
The table shows results from regressions of the 3-month basis on a lag of the basis, risk measures, the MBS-T (for Treasury) repo spread and the TED spread (Panel A) or the Libor-Repo spread (Panel B). Variable definitions are in Table 2. The regression is estimated separately for the pre-crisis period (January 1, 2007 – July 31 2007), the pre-Lehman period (August 1 2007 – September 15, 2008) and the post-Lehman period (September 16 2008 – March 30 2009). The standard errors are adjusted for heteroskedasticity and serial correlation using the Newey-West procedure with the number of lags truncated at 5.

38
Table 7: CIP Deviations and Relative Credit Risk of US versus Non-US Firms
Panel A: Interest rate spread = TED spread 1/1/2007-7/31/2007 8/01/2007 - 9/15/2008 9/16/2008 - 3/31/2009
Explanatory variable
Estimate t-stats Estimate t-stats Estimate t-stats
MBS-T ON 1.123** 2.368 -0.442 -0.698 31.704** 4.350
TED 0.011 1.715 0.010 1.275 -0.208** -3.759
PAR-OTR -0.119 -1.158 0.212** 2.808 0.213 1.138
NUS-US CDS
0.035 1.035 -0.028* -2.267 -0.172** -2.570
DISP. -0.562** -2.591 0.089 1.012 0.492** 3.634
CONTROLS? YES YES YES
Adj. R2 0.133 0.890 0.849 OBS 139 265 131
39
Table 7 (continued) Panel B: Interest rate spread = Libor-Repo spread
1/1/2007-7/31/2007 8/01/2007 - 9/15/2008 9/16/2008 - 3/31/2009 Explanatory
variable Estimate t-stats Estimate t-stats Estimate t-stats
MBS-T 1.040* 2.391 -0.548 -0.824 35.110** 3.950
Libor-Repo 0.136** 3.467 0.003 0.227 -0.202** -3.147
PAR-OTR 0.042 0.475 0.208** 2.714 0.142 0.833
NUS-US CDS
0.126** 2.804 -0.012 -1.204 -0.147* -2.409
DISP. -0.455* -2.248 0.072 0.888 0.358** 2.564
CONTROLS? YES YES YES
Adj. R2 0.172 0.891 0.854 OBS 135 262 130 ** denotes 1% significance and * denotes 5% significance
The table shows results from regressions of the 3-month basis on a lag of the basis, the relative credit risk of non-US versus US firms, the MBS-T (for Treasury) repo spread and the TED spread (Panel A) or the Libor-Repo spread (Panel B). CONTROLS are Par-OTR, Disp.,VIX and EVOL. Variable definitions are in Table 2. The regression is estimated separately for the pre-crisis period (January 1, 2007 – July 31 2007), the pre-Lehman period (August 1 2007 – September 15, 2008) and the post-Lehman period (September 16 2008 – March 30 2009). The standard errors are adjusted for heteroskedasticity and serial correlation using the Newey-West procedure with the number of lags truncated at 5.
40
Table 8: Central Bank Currency Swap Announcements
Dates Announcement
12/12 /2007 Swap line arrangements with European Central Bank (ECB) and Swiss National Bank (SNB) announced. Agreement for 6 months.
1/10 /2008 ECB announces two TAF auctions for January 2008.
2/01/2008 ECB announces it will not participate in February auctions.
3/11/2008 Size of swap lines with ECB and SNB expanded.
5/2/2008 Increased size of swap lines with ECB, SNB and extension of program. Program extended till Jan 30 2009.
7/30/2008 ECB, SNB announce establishment of 84 day TAF auctions.
9/18/2008 Further expansion of swap lines with ECB and SNB. New swap line arrangements with Bank of Canada (BOC), Bank Of England (BOE), and Bank of Japan (BOJ).
9/24/2008 New swap line arrangements with Royal Bank of Australia, Danmark Nationalbank, Norges Bank and Sweden Rijksbank.
9/26/2008 Expanded swap line size with ECB, SNB announced.
9/29/2008 Increased swap line sizes with ECB, SNB, BOC, BOE, BOJ, and Danmark Nationalbank, Norges Bank and Sweden Rijksbank. Agreements extended till April 30 2009.
10/13/2008 Size of swap lines with ECB, SNB, and BOE to accommodate demand for any quantity of funds at fixed rate.
10/14/2008 Size of swap line sizes with BOJ also uncapped.
10/28/2008 Initiate swap line arrangement with Royal Bank of New Zealand.
10/29/2008 FED announces swap line arrangements with Banco Central do Brasil, Banco de Mexico, Bank of Korea, and the Monetary Authority of Singapore.
02/03/2009 FED announces extension of swap line arrangements to October 30 2009
The table shows dates of significant announcements of the Federal Reserve’s swap line arrangements with various international central banks between December 2007 and March 2009.
41
Table 9: Effect of Central Bank Currency Swaps on the Basis Panel A: Results using euro-dollar data at hourly frequency
5/23/2008 - 9/15/2008 9/16/2008 - 3/31/2009 Explanatory
variable Estimate t-stats Estimate t-stats
Intercept -0.098 -0.285 0.073 0.048
Swap ann. -5.258** -4.470 16.189 0.905
Swap uncap --- --- -77.724** -10.835
$ auctions -1.279 -1.685 -1.584 -0.574
CONTROLS YES YES
Adj. R2 0.180 0.193 OBS 76 130
Panel B: Results using euro-dollar data at daily frequency
8/1/2007-5/22/2008
5/23/2008-9/15/2008
9/16/2008-3/30/2009
Explanatory variable
Est t-stats Est t-stats Est t-stats
Intercept 0.225 0.680 0.057 0.203 -0.097 -0.062
Swap ann. -0.917 -0.466 -2.982** -4.796 2.152 0.198
Swap uncap --- --- --- --- -53.528** -3.633
$ auction -1.726 -1.630 -1.269 -1.242 3.989 1.027
CONROLS? YES YES YES
Adj. R2 -0.018 0.221 0.194 OBS 85 77 130
** denotes 1% significance and * denotes 5% significance The table shows results from regressions of changes in the 3-month basis on dummy variables for SWAP announcements and dollar auction dates. CONTROLS are changes in Disp., CDX, VIX, EVOL and Y10_3. Variable definitions are in Table 2. The regression is estimated separately for the pre-Lehman period (August 1 2007 – September 15, 2008) and the post-Lehman period (September 16 2008 – March 30 2009). The standard errors are adjusted for heteroskedasticity and serial correlation using the Newey-West procedure with the number of lags truncated at 5.
42
Figure 1: CIP Deviations Based on US Dollar LIBOR and Euro-Dollar Exchange Rate January 2007 –March 2009
The figure plots estimates of Covered Interest Rate Parity (CIP) deviations in US dollars (USD) (i.e. the USD Basis), calculated as the CIP implied USD rate minus the USD LIBOR rate. The CIP implied USD rate is estimated using the euro-dollar exchange rate and the euro LIBOR rate. The dashed line is based on daily exchange rate data and the solid line is based on hourly exchange rate data. The sample period is from January 1 2007 till March 30 2009 except for the hourly data which is available from May 23 2008.
-10
40
90
140
190
240
Jan-07 Apr-07 Jul-07 Oct-07 Jan-08 Apr-08 Jul-08 Oct-08 Jan-09
Basi
s Po
ints
Date
Basis_hourly Basis_daily
43
Figure 2: CIP Deviations Based on Dollar LIBOR, NYFR and Treasury Bill Rates, and the Euro-Dollar Exchange Rate, January 2007 –March 2009
The figure plots estimates of Covered Interest Rate Parity (CIP) deviations in US dollars (USD) (i.e. the USD Basis), calculated as the CIP implied USD rate minus several benchmark USD rates. The benchmark USD rates shown are the USD LIBOR rate (left axis), the NYFR rate (left axis) and the Treasury Bill rate (right axis). The CIP implied rate USD is estimated using daily euro-dollar exchange rates and the euro LIBOR rate. The sample period is from January 1 2007 till March 30 2009 except for the NYFR data which is available from May 30 2008.
0
100
200
300
400
500
600
-50
0
50
100
150
200
250
Jan-07 Apr-07 Jul-07 Oct-07 Jan-08 Apr-08 Jul-08 Oct-08 Jan-09
Basi
s Po
ints
Basi
s Po
ints
Date
Basis NYFR basis Treas basis
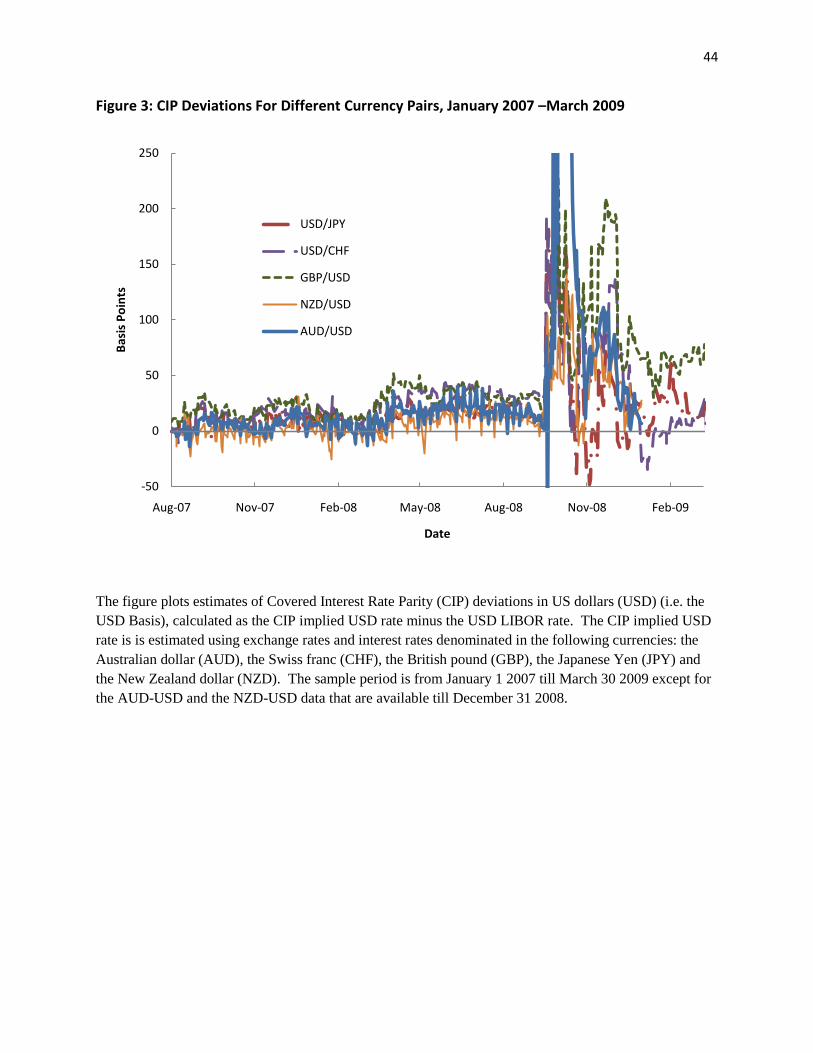
44
Figure 3: CIP Deviations For Different Currency Pairs, January 2007 –March 2009
The figure plots estimates of Covered Interest Rate Parity (CIP) deviations in US dollars (USD) (i.e. the USD Basis), calculated as the CIP implied USD rate minus the USD LIBOR rate. The CIP implied USD rate is is estimated using exchange rates and interest rates denominated in the following currencies: the Australian dollar (AUD), the Swiss franc (CHF), the British pound (GBP), the Japanese Yen (JPY) and the New Zealand dollar (NZD). The sample period is from January 1 2007 till March 30 2009 except for the AUD-USD and the NZD-USD data that are available till December 31 2008.
-50
0
50
100
150
200
250
Aug-07 Nov-07 Feb-08 May-08 Aug-08 Nov-08 Feb-09
Basi
s Po
ints
Date
USD/JPY
USD/CHF
GBP/USD
NZD/USD
AUD/USD

45
Figure 4: CIP Deviations, and MBS-Treasury Repo Spread
The figure plots estimates of Covered Interest Rate Parity (CIP) deviations in US dollars (USD) (i.e. the USD Basis), calculated as the CIP implied USD rate minus the USD LIBOR rate. The CIP implied USD rate is estimated using the euro-dollar exchange rate and the euro LIBOR rate. Also plotted are the agency MBS minus Treasury repo spreads for the overnight (MBS_T_ON), plotted on the right vertical axis, and 3-month (MBS_T_M3) maturities, plotted on the left vertical axis. The sample period is from January 1 2007 till March 30 2009.
0.00
0.50
1.00
1.50
2.00
2.50
3.00
3.50
-50
0
50
100
150
200
Jan-07 Apr-07 Jul-07 Oct-07 Jan-08 Apr-08 Jul-08 Oct-08 Jan-09
Announcements MBS_T_m3 Basis MBS_T_ON
March 11, 2008: TSLF Announcement
March 17, 2008:PDCF Announcement
March 17, 2008:Bear Stearns Collapse
September 15, 2008: Lehman Bros. Bankruptcy

46
Figure 5: CIP Deviations, Libor-Repo Spread and TED Spread
The figure plots estimates of Covered Interest Rate Parity (CIP) deviations in US dollars (USD) (i.e. the USD Basis), calculated as the CIP implied USD rate minus the USD LIBOR rate. The CIP implied USD rate is estimated using the euro-dollar exchange rate and the euro LIBOR rate. Also plotted are the 3-month Libor minus Treasury repo spread and the 3-month TED spread (i.e. Libor minus the Treasury bill rate). The sample period is from January 1 2007 till March 30 2009.
-10
40
90
140
190
240
290
340
390
440
-10
40
90
140
190
240
290
340
390
440
490
Jan-07 Apr-07 Jul-07 Oct-07 Jan-08 Apr-08 Jul-08 Oct-08 Jan-09
Basi
s Po
ints
Basi
s Po
ints
Date
Basis TED_m3 Lib-Repo

47
Figure 6: Difference between CDS Prices of non-US and US Banks
The figure plots the relative default risk of non-US firms relative to US firms. This is estimated as the average CDS prices of 13 non-US banks in the Libor panel minus the average CDS prices of 10 systematically important US banks. The 10 systematically important US banks are those defined by the Treasury in its TARP plan. : Bank of America, Bank of NY Mellon, Citigroup, Goldman Sachs, JP Morgan Chase, Morgan Stanley, Merrill Lynch, State Street Corp, Wachovia, Wells Fargo.The sample period is from January 1 2007 till March 30 2009.
-300
-250
-200
-150
-100
-50
0
Jan-07 Apr-07 Jul-07 Oct-07 Jan-08 Apr-08 Jul-08 Oct-08 Jan-09
CDS
Spre
ad
Date
Top Related