

![[Smart Grid Market Research] Smart Grid Hiring Trends Study (Part 2 of 2)- Zpryme Smart Grid Insights](https://static.fdocuments.us/doc/165x107/5414021c8d7f7284698b47a9/smart-grid-market-research-smart-grid-hiring-trends-study-part-2-of-2-zpryme-smart-grid-insights.jpg)


![[Smart Grid Market Research] South Korea: Smart Grid Revolution, Zpryme Smart Grid Insights, July 2011](https://static.fdocuments.us/doc/165x107/5414026d8d7f727d698b47c7/smart-grid-market-research-south-korea-smart-grid-revolution-zpryme-smart-grid-insights-july-2011.jpg)
Languages
Pages
Legal


California Smart Grid
Annual Report to the
Governor and the Legislature
in Compliance with Public Utilities Code § 913.2
February 2019

i
Table of Contents 1. Executive Summary 1
2. Introduction 4
2.1. What is the Smart Grid? 4
2.2. California’s Continuing Evolution to Grid Modernization 5
2.2.1. Deployment Plan Background 6
2.2.2. Smart Grid Costs and Benefits 7
2.2.3. Ongoing Commitment to Improving Safety and Reliability 8
3. Commission Activities Related to Smart Grid in 2018 and Expected in 2019 10
3.1. 2017 Smart Grid Activities 10
3.1.1. DER Action Plan 10
3.1.2. Distribution Resources Plans 11
3.1.3. Integrated Distributed Energy Resources (IDER) 15
3.1.4 . Interconnection Rule 21 16
3.1.5 . Smart Inverters 16
3.1.6 . Energy Storage 19
3.1.7. Plug-In Electric Vehicle Integration 22
3.1.8. Demand Response 24
3.1.9. Enhanced Reliability Reporting 26
3.1.10. Customer Data Access, Energy Data Request, and Other Data Activities 27
3.1.11. Conversion of Mobile Home Park Master Meters to Direct Utility Meters 29
3.2. Smart Grid Activities Expected in 2019 at the CPUC 30
4. Smart Grid Projects in California 33
4.1. Summary of IOU Activities in 2018 33
4.1.1. Advanced Metering Infrastructure Deployment 37
4.1.2. Utility De-energization 37
4.2. Highlights of San Diego Gas & Electric’s (SDG&E) Smart Grid Deployment 39
4.2.1. SDG&E Example Projects 40
4.3. Highlights of Southern California Edison (SCE) Smart Grid Deployment 42
4.3.1. SCE Example Projects 44
4.4. Highlights of Pacific Gas & Electric (PG&E) Smart Grid Deployment 45
4.4.1. PG&E Example Projects: 46
5. Conclusion 48

ii
List of Tables and Figures
Table 1 IOU Costs and Benefits for Fiscal Year July 1, 2017 through June 30, 2018 ........................................... 8
Table 2 IOU Progress Towards the AB 2514 Energy Storage Target .................................................................. 20
Table 3 IOU Electric Reliability Compared to the U.S. National Median Values for 2017 ................................. 27
Table 4 Advanced Metering Infrastructure (Smart Meters) Rollout ..................................................................... 37
Table 5 SDG&E’s Estimated Smart Grid Costs for Fiscal Year July 1, 2017 through June 30, 2018 ................. 39
Table 6 SDG&E’s Estimated Smart Grid Benefits Realized for Fiscal Year July 1, 2017 – June 30, 2018.…....39
Table 7 SCE’s Estimated Smart Grid Costs for Fiscal Year July 1, 2017 through June 30, 2018 ....................... 42
Table 8 SCE’s Estimated Smart Grid Benefits Realized for Fiscal Year July 1, 2017 through June 30, 2018 .. 443
Table 9 PG&E’s Estimated Smart Grid Costs for Fiscal Year July 1, 2017 through June 30, 2018 .................... 45
Table 10 PG&E’s Estimated Smart Grid Benefits Realized for Fiscal Year July 1, 2017 - June 30, 2018 .......... 45

iii
Glossary of Terms
Advanced Distribution Management System: (ADMS) See Distribution Management System.
Advanced Metering Infrastructure: (AMI) refers to the full energy consumption data measurement
and collection system that includes Smart Meters at the customer site, communication networks
between the customer and utility, and data reception and management systems that make the
information available to the utility.
Behind-the-Meter: (BTM) refers to electrical equipment and technologies that are interconnected on
the customer’s side of the electric meter. Customer-sited distributed energy resources (DERs) are one
of the most common examples of BTM resources.
CAISO: California Independent System Operator maintains reliability on one of the largest and most
modern power grids in the world, and operates a transparent, accessible wholesale energy market.
Circuit: A network of wires that carries power from substations or distributed generation to local load
areas such as commercial and residential areas.
Click-Through Authorization Process: An online customer authorization process that allows
customers to easily share their energy data with third-party demand response providers who can use
the data to help the customer optimize their demand response performance.
Customer Minutes of Interruption: (CMI or CMIN) refers to the duration of an outage event
measured in minutes summed across all customers affected by the event.
Demand Response: (DR) refers to changes in electric usage by end-use customers from their normal
consumption patterns in response to changes in the price of electricity over time, or to incentive
payments designed to induce lower electricity use at times of high wholesale market prices or when
system reliability is jeopardized.
Distributed Energy Resources: (DERs) include: distributed renewable generation resources, energy
efficiency, energy storage, electric vehicles, and demand response technologies. DERs are connected
to the distribution grid both behind the customer’s meter (BTM) and in front of the customer’s meter
(IFM).
Distribution Feeder: (Or feeder) refers to a circuit that carries power from a distribution substation
to local load areas such as commercial and residential areas.

iv
Distribution Investment Deferral Framework: (DIDF) a framework designed to identify
opportunities where future distribution system upgrades can be deferred or avoided through
distributed energy resource deployment.
Distribution Management System: (DMS, also referred to as Advanced Distribution Management
System (ADMS)) a software platform that can monitor and control the distribution system efficiently
and reliably.
Distribution Planning Advisory Group: (DPAG) a body formed by market participants and an
independent professional engineer who advise the utilities on the selection of distribution deferral
opportunities and provide input on the development of competitive solicitation for distributed energy
resources.
Distribution Resources Plan: (DRP) refers to the plans that each of the investor-owned utilities were
required to develop to propose contracts, tariffs or other distribution energy resources procurement
mechanisms to maximize the locational benefits and minimize the incremental costs of distributed
resources. The DRPs also identify additional spending necessary to integrate distribution energy
resources into distribution planning and to modernize their electric grids; as well as identify the
barriers to the deployment of distribution energy resources. DRP also refers to the namesake
proceeding in which the DRPs were developed.
Demand Response Auction Mechanism: (DRAM) a competitive solicitation mechanism run by the
investor-owned utilities that enables distributed energy resource aggregators to offer their services to
utilities and the state’s wholesale energy markets. The commodity being traded is measured in
kilowatt-months of capacity, or the ability to reduce use or add energy for up to 4 hours at a time
during the state’s late afternoon and evening peaks, over the course of a month.
Electric Tariff Rule 21: (Or Rule 21) refers to the tariff governing the utilities’ interconnections of
distributed energy resources.
Energy Atlas: A geospatial analytical tool developed by UCLA’s California Center for Sustainable
Communities Institute of the Environment. The Energy Atlas is the largest set of disaggregated
energy data in the nation, and uses energy consumption data at the building level, combined with
public records, to reveal previously undetectable patterns about how people, buildings and cities use
energy. The tool helps regional planners and decision makers more effectively target energy program
interventions and develop policies to mitigate and prepare for climate change.
EV: Electric vehicle. See plug-in electric vehicle.

v
Fast Track Process: A streamlined review process within Rule 21 that is based on multiple
evaluation screens for interconnecting net energy metering, non-export, and small exporting facilities.
Fault Location Isolation and Service Restoration: (FLISR) a software system integrated into the
utilities’ outage management system that limits the impact of outages by quickly opening and closing
automated switches and reconfiguring the flow of electricity through a circuit. By reconfiguring the
flow of electricity, FLISR can minimize the number of customers impacted by an outage and isolate
the outage to reduce restoration times. With FLISR, outages that may have been a one- to two-hours
in duration can be reduced to less than five minutes.
General Rate Case: (GRC) General rate cases are proceedings used to address the costs of operating
and maintaining the utility system and the allocation of those costs among customer classes. For
California’s three large investor-owned utilities (IOUs), the GRCs are parsed into two phases. Phase I
of a GRC determines the total amount the utility is authorized to collect, while Phase II determines
the share of the cost each customer class is responsible for and the rate schedules for each class. Each
large electric utility files a GRC application every three years.
Gigawatt: (GW) a unit of electric power equal to one billion watts.
Home Area Network: (HAN) a communication network that is deployed and operated in a small
area such as a house or small office that enables the communication of various devices such as
distributed energy resources, heating and air-conditioning units, and smart household appliances for
purposes of energy management and responding to variable energy price signals. Utilities can
leverage HANs to manage customer load during peak hours and reduce greenhouse gas emissions
from expensive gas-fired power plants that would otherwise be needed to meet peak demand.
Integrated Capacity Analysis: (ICA) quantifies the available hosting capacity of every distribution
circuit in the utilities’ service territories to integrate distributed energy resources without triggering
grid upgrades.
Integrated Distributed Energy Resources: (IDER) refers to the Commission’s strategy for the
utilities to integrate customer demand-side programs, such as energy efficiency, self-generation,
advanced metering, and demand response, in a coherent and efficient manner. Also refers to the IDER
proceeding which is focused on developing sourcing mechanisms for the procurement DERs that
advance distribution planning objectives.
Integrated Resource Plan: (IRP) comprehensive utility procurement plans that detail what resources
are to be procured and how it will be done to comply with the State’s climate and energy policies and

vi
adequately balance safety, reliability, cost and meet the State’s environmental goals laid out by SB
350 and SB 100.
Inverter: An electronic device that converts DC power to AC power and is necessary to connect most
distributed energy resources to the grid. See Smart Inverter.
IOU: Investor-owned utility.
Island Mode: Refers to when a circuit or microgrid operates in isolation from the distribution grid
and can continue to serve power through DERs when the distribution grid experiences outages and
can no longer serve the circuit or microgrid.
Kilowatt: (kW) A unit of electric power equal to one thousand watts.
Load: The total amount of power needed to meet all demand on the grid at any given time.
Locational Net Benefits Analysis: (LNBA) a tool that can determine optimal locations for DER
deployment based on cost-effective opportunities for DERs to defer or avoid traditional distribution
system investments.
Megawatt: (MW) a unit of electric power equal to one million watts.
Multiple-Use Applications: (MUA) refers to the multiple benefits and services that energy storage
devices can provide to the grid to increase the economic value provided.
Net Energy Metering: (NEM) Customers who install small solar, wind, biogas, and fuel cell
generation facilities to serve all or a portion of onsite electricity needs are eligible for the state's net
metering program. NEM allows customers who generate their own energy ("customer-generators") to
serve their energy needs directly onsite and to receive a financial credit on their electric bills for any
surplus energy fed back to their utility.
Order Instituting Rulemaking: (OIR) An investigatory proceeding opened by the PUC to consider
the creation or revision of rules or guidelines in a matter affecting more than one utility or a broad
sector of the industry. Comments and proposals are submitted in written form. Oral arguments or
presentations are sometimes allowed.
On-Peak: Refers to the hours of the day in which demand for electricity tends to be the highest.
Off-Peak: Refers to the hours of the day that are not characterized by on-peak electricity demand.
Outage Management System: (OMS) a computer system used by electric distribution system
operators to assist in restoration of power.

vii
PEV: Plug-in electric vehicle. A type of zero emission vehicle (ZEV) which has no tail pipe
emissions. A plug-in electric vehicle is any motor vehicle that can be recharged from an external
source of electricity, such as wall sockets, and the electricity stored in the rechargeable battery packs
drives or contributes to drive the wheels.
Plug-and-Play: Refers to a distribution grid system where high penetrations of distributed energy
resources can be integrated seamlessly due to streamlined and simplified processes for
interconnecting these technologies.
Reactive Power Priority: A mandatory smart inverter setting for California’s investor-owned
utilities that allows distributed generation to provide local voltage support and mitigate voltage rise
on the distribution system.
Reliability: The ability of the electric grid to deliver electricity in the quantity and with the quantity
demanded by customers while minimizing service interruptions. Reliability is measured by the
number of outages and outage duration.
Request for Offer: (RFO) an open and competitive solicitation process whereby an organization
requests the submission of offers in response to a scope of services that is needed.
Resiliency: The ability of the grid to resist failure, reduce the magnitude and/or duration of disruptive
events to the grid, and recover from disruptive events.
Resource Adequacy: a regulatory requirement designed to provide sufficient resources to the
California Independent System Operator to ensure the safe and reliable operation of the grid in real
time. RA is a planning reserve margin of available generation resources.
Self-Healing Benefits: Refers to system reliability benefits derived from a network of sensors,
automated controls, and advanced software that utilize real-time distribution data to detect and isolate
faults and to reconfigure the distribution network to minimize the customers impacted by outages and
other disruptive events.
SIWG: Smart Inverter Working Group is an ad-hoc collaborative stakeholder committee that
provides input and recommendations to the CPUC Rule 21 proceeding in the areas of smart inverters.
Supervisory Control and Data Acquisition: (SCADA) is a system of software and hardware
elements that allow distribution system operators to remotely gather, monitor, and process data from
sensors deployed along the distribution system.
Smart Inverter: A smart inverter is an inverter that performs functions that, when activated, can
autonomously contribute to grid support during excursions from normal operation voltage and

viii
frequency system conditions. Smart inverters provide autonomous responses to voltage and frequency
conditions, safety features, and communications capabilities. See Inverter.
Smart Meter: An electronic meter that records consumption of electric energy in intervals of an hour
or less and communicates that information at least daily back to the utility for monitoring and billing.
A smart meter enables customers to view their consumption hourly to enable improved energy
management and responsiveness to time variant energy price signals. See Advanced Metering
Infrastructure.
SONGS: Refers to the former San Onofre Nuclear Generating Station.
Time of Use Rates: (TOU) Time-of-use is a rate plan in which rates vary according to the time of
day, season, and day type (weekday or weekend/holiday). Higher rates are charged during the peak
demand hours and lower rates during off-peak (low) demand hours. Rates are also typically higher in
summer months than in winter months. This rate structure provides price signals to energy users to
shift energy use from peak hours to off-peak hours. Time of use pricing encourages the most efficient
use of the system and can reduce the overall costs for both the utility and customers.
Truck Roll: A utility dispatch of technicians to investigate electrical equipment during an outage.
Vehicle-Grid Integration: (Also referred to as Vehicle-to-Grid Integration or VGI) a framework for
utilizing the flexible charging and discharging capabilities of plug-in electric vehicles to serve as a
grid asset.
Volt Amperes Reactive: (VAR) a measure of reactive power, which exists in an AC circuit when the
current and voltage are not in phase. Certain types of loads absorb or produce reactive power, so its
presence on the distribution grid is unavoidable. However, reactive power imbalances cause abnormal
voltages, so VARs must be managed to keep line voltages within acceptable ranges.
Volt/VAR Control: (Also known as Volt/VAR Optimization) refers to the process of managing
voltage levels by injecting or absorbing reactive power (measured in VAR) on the distribution
system.

ix
CPUC Smart Grid Vision
Innovation continues to create new opportunities across the network of
physical, electronic, and virtual assets that make up our rapidly modernizing
grid. As new ideas are tested by the physics and economics of real circuits and
real-time markets, the Commission will be closely watching the outcomes and
evaluating our own policies. Distributed energy resources and other smart grid
technologies that empower customers to use cleaner, safer, and more
affordable energy will make a lasting contribution to California’s climate and
economy.
In 2018, the Commission continued to make great strides towards
achieving the state’s Smart Grid goals. We approved pilot electric vehicle-grid
integration programs. We adopted a new, annual process that requires utilities
to consider solar, storage, and other distributed energy resources as they plan
grid infrastructure improvements. We also adopted a new grid modernization
framework to improve tracking of utility smart grid investments. We adopted a
joint Commission-CAISO framework for how storage can participate in
multiple markets. We approved a new set of advanced functions for smart
inverters, one of which became mandatory in June. The Commission also
approved over two dozen new utility contracts totaling over 1.1 GW of
capacity with a wide variety of innovative distributed energy resource projects,
including demand response, storage, and solar combined with storage.
- Michael Picker, President, California Public Utilities Commission, December
2018.

California Smart Grid Annual Report to the Governor
and the Legislature 2018
1
1. Executive Summary
This Annual Report on California’s Smart Grid activities provides an overview of the California
Public Utility Commission’s (CPUC's or the Commission’s) recommendations for a Smart Grid. It also
reviews the plans and deployment of Smart Grid technologies by the state's three largest electric Investor-
Owned Utilities (IOUs or the Utilities),1 and the IOUs’ estimates for the costs and benefits to ratepayers.2
This report will detail the following:
• CPUC Smart Grid-related activities in 2018 (Section 2);
• IOU Smart Grid project reports and overall ratepayer costs and benefits. (Section 3); and
• CPUC Smart Grid activities that are expected in 2019 (Section 3.2).
Highlights of the 2018 CPUC Smart Grid-related activities include:
• CPUC Distributed Energy Resources (DER)3 Action Plan4 – The Commission continues to
implement its vision to support California’s DER future to facilitate proactive, coordinated, and
forward-thinking development of DER-related policy. The Commission is on course to complete
actions in each of three tracks identified in the DER Action Plan: Rates and Tariffs; Distribution
Planning, Infrastructure, Interconnection and Procurement; and Wholesale DER Market
Integration and Interconnection.
• Distribution Resources Plan (DRP) –The Commission adopted two decisions on DRP policy
issues. The first decision (D.18-08-004)5 approved the methodology and process for updating the
DER Growth Scenarios in distribution planning and adopted the Distribution Investment Deferral
Framework (DIDF), to plan and procure DERs to defer distribution system investments. The
1 The three largest California IOUs are Pacific Gas and Electric Company (PG&E), Southern California Edison
Company (SCE), and San Diego Gas & Electric Company (SDG&E). 2 “…the commission shall report to the Governor and the Legislature on the commission’s recommendations for a
Smart Grid, the plans and deployment of Smart Grid technologies by the state’s electrical corporations, and the
costs and benefits to ratepayers.” (Pub. Util. Code § 913.2). 3 DERs are defined in Pub. Util. Code § 769 as renewable distributed generation, energy storage, demand response,
energy efficiency, and electric vehicles. 4 The DER Action Plan is available at the Energy Division’s Energy Reports and Whitepapers page:
http://www.cpuc.ca.gov/energy_reports/. 5 See the following link for the text of D.18-08-004:
http://docs.cpuc.ca.gov/PublishedDocs/Published/G000/M221/K552/221552166.PDF.

California Smart Grid Annual Report to the Governor
and the Legislature 2018
2
second decision D.18-03-023)6 adopted the Grid Modernization Investment Framework that
provides guidance to the Commission in future General Rate Cases for funding requests on
technological upgrades needed to integrate DERs into the grid. The IOUs implemented the first
annual cycle of the DIDF in compliance with the decision.
• Integrated Distributed Energy Resources (IDER) – The Commission approved four Southern
California Edison (SCE) in-front-of-the-meter energy storage contacts, totaling 9.5 MW, for
Distribution Deferral and Resource Adequacy. The Commission approved PG&E’s request to
issue a competitive request for offer (RFO) to procure DERs that could displace or defer the need
for capital expenditures on traditional distribution infrastructure. PG&E issued this RFO in late
2018.
• Interconnection Rule 21 – Rule 21 Working Group One submitted its recommendations
concerning urgent interconnection improvement issues to the Commission in March 2018 and
Working Group Two submitted its recommendations regarding the Integration Capacity Analysis
and streamlining interconnection issues in October 2018. The Commission convened regular
interconnection discussion forums to facilitate greater cooperation and improvement to the
interconnection process.
• Smart Inverters – In April 2018, the Commission approved revisions to Rule 21 by
incorporating several advanced smart inverter functions and requiring Reactive Power Priority,
which allows distributed generation to provide local voltage support. Reactive Power Priority
became mandatory on June 26, 2018. Since August 2018, the Smart Inverter Working Group
(SIWG) has met weekly to discuss the implementation of smart inverter communications
requirements and other advanced functions, which will allow the grid to support additional
distributed generation while contributing to grid stability.
• Energy Storage – The Commission approved a record setting amount of energy storage: 905.5
MW in 2018. To date the Commission has approved procurement of more than 1.6 gigawatts of
new storage capacity, of which 410 MWs is online and operational, or about 26 percent of total
approved storage capacity. Collectively the IOUs have procured more than the 1,325 MW target
set by Assembly Bill (AB) 2514 (Skinner, Chapter 469, Statutes of 2010)7. By the end of 2018,
6 See the following link for the text of D.18-03-023:
http://docs.cpuc.ca.gov/PublishedDocs/Published/G000/M212/K432/212432689.PDF. 7 For the full text of AB 2514, please see the following link:
https://leginfo.legislature.ca.gov/faces/billNavClient.xhtml?bill_id=200920100AB2514.

California Smart Grid Annual Report to the Governor
and the Legislature 2018
3
San Diego Gas & Electric (SDG&E) met its 165 MW share of that requirement. Pacific Gas &
Electric and Electric (PG&E) requires 39 MW in the customer domain8 and SCE needs 139 MW
in the transmission domain to fulfil their respective 580 MW shares of the target. The
Commission approved 567.5 MW of storage proposed by PG&E to replace more expensive
natural gas contracts representing the largest battery storage projects approved in the world. The
Commission adopted a joint CPUC and California Independent System Operator (CAISO) staff
proposal with a framework for multiple use applications (MUA) for energy storage in Decision
(D.)18-01-003.9 The MUA framework advances the ability of energy storage to provide more
economic value by providing multiple services.
• Plug-In Electric Vehicle Integration – As part of implementing Senate Bill (SB) 350 (De León,
Chapter 547, Statutes of 2015)10, in 2018 the CPUC approved utility programs and pilots at all
three investor-owned utilities with a combined budget of more than $748 million for pilot-scale
vehicle-grid integration and larger-scale transportation electrification infrastructure investment.
The CPUC is currently considering another $1 billion in utility proposals for additional
transportation electrification investment programs.
• Demand Response (DR) –The IOUs integrated their supply-side DR programs into the CAISO
wholesale market. The Commission allocated budgets for the IOUs to run DR pilots in
transmission-constrained local capacity areas, including in disadvantaged communities. Several
contracts were approved by the Commission for market-integrated DR to provide long-term
capacity in locally-constrained areas. The IOUs procured 167 MW of competitive supply-side DR
from third parties for delivery in 2019 under the Demand Response Auction Mechanism pilot
(DRAM). The Commission implemented the “prohibited resources policy” which prohibits the
use of customer-owned fossil fuel resources during demand response events, effective January 1,
2019.
8 The customer domain refers to the customer’s side of the meter (also known as behind-the-meter), rather than the
utility’s side in the distribution grid. 9 For the full text of D.18-01-003 see the following link:
http://docs.cpuc.ca.gov/PublishedDocs/Published/G000/M206/K462/206462341.pdf. 10 Please see the following link for the SB 350 Bill text:
https://leginfo.legislature.ca.gov/faces/billNavClient.xhtml?bill_id=201520160SB350.

California Smart Grid Annual Report to the Governor
and the Legislature 2018
4
2. Introduction
2.1. What is the Smart Grid?
The Smart Grid,11 as defined in the State of California by Senate Bill 17 (Padilla, Chapter 327,
Statutes of 2009)12, is a fundamental change in the existing electricity infrastructure that utilizes advances
in technology to create a safer, greener, more efficient, and more reliable electricity supply. The
objectives in California, per SB 17 and Pub. Util. Code § 8360, are to promote:
• Increased use of cost-effective digital information and control technology to improve reliability,
security, and efficiency of the electric grid;
• Dynamic optimization of grid operations and resources, including appropriate consideration for
asset management and utilization of related grid operations and resources, with cost-effective full
cyber security;
• Deployment and integration of cost-effective distributed resources and generation including
renewable resources;
• Development and incorporation of cost-effective demand response, demand-side resources, and
energy-efficient resources;
• Deployment of cost-effective smart technologies, including real time, automated, interactive
technologies that optimize the physical operation of appliances and consumer devices for
metering, communications concerning grid operations and status, and distribution automation;
• Integration of cost-effective smart appliances and consumer devices;
• Deployment and integration of cost-effective advanced electricity storage and peak-shaving
technologies, including plug-in-electric and hybrid-electric vehicles, and thermal-storage air
conditioning;
• Development of functions that provide consumers with timely information and control options;
11 Per the IEEE (Institute of Electrical and Electronics Engineers), Smart Grid refers to the use of digital
communications and control technology and new energy sources, generation models, and adherence to cross-
jurisdictional regulatory structures to provide an objective collaboration, integration, and interoperability
between computational and control systems, generation, transmission, distribution, customer, operations,
markets, and service providers. 12 Please see the following link for the SB 17 Bill text:
http://leginfo.legislature.ca.gov/faces/billNavClient.xhtml?bill_id=200920100SB17.

California Smart Grid Annual Report to the Governor
and the Legislature 2018
5
• Development of standards for communication and interoperability of appliances and equipment
connected to the electric grid, including the infrastructure serving the grid; and
• Identification and lowering of unreasonable or unnecessary barriers to adoption of Smart Grid
technologies, practices, and services.
2.2. California’s Evolution to Grid Modernization
The CPUC has worked with the California IOUs and the Legislature on numerous fronts throughout
2018 to advance grid modernization. The resulting initiatives are oriented towards making the grid in
California smarter, safer, and better able to accommodate higher penetrations of DERs, while reducing
carbon emissions and improving reliability and resiliency. Recent grid modernization efforts have built
upon smart meter13 deployment, cost reductions in digital control and communications technology, power
electronics, and advanced automation technologies that improve customer reliability and grid resilience.14
The accelerating adoption of customer-side intermittent renewable generation, primarily solar
photovoltaic (PV) systems, has produced new operational challenges and opportunities for the grid, which
is driving the current need for IOU investment in Smart Grid technologies. Modernizing grid
infrastructure, such that it serves as a beneficial platform rather than an impediment for customer adoption
of DERs, is becoming a priority for the CPUC and the IOUs so that DERs can be interconnected to the
grid in a “plug-and-play” manner.15
A planned approach to increase Smart Grid investments is required to increase grid reliability and to
reduce safety risk in light of increasing customer adoption of DERs and traditional distribution
investment deferral by DERs. The Distribution Resources Plan proceeding (R.14-08-013)16 currently
13 Smart meter refers to modern electrical meters that can transmit customer energy consumption information
directly to the utility through its cellular network on a frequent schedule, so the utility does not need to send a
person to obtain this information. 14 Reliability is measured in number of outages and outage duration. IEEE Standard 1366 defines the following
reliability metrics: Customer Average Interruption Duration Index (CAIDI), System Average Interruption
Frequency Index (SAIFI), and System Average Interruption Duration Index (SAIDI). 15 Creating a distribution grid that is “plug-and-play” involves dramatically streamlining and simplifying the
processes for interconnecting to the distribution grid to create a system where high penetrations of DER can be
integrated seamlessly. 16 Please see the following link to the R.14-08-013 Order Instituting Rulemaking:
http://docs.cpuc.ca.gov/PublishedDocs/Published/G000/M103/K223/103223470.pdf.

California Smart Grid Annual Report to the Governor
and the Legislature 2018
6
underway will guide new Smart Grid investment requests in future general rate cases (GRCs)17 to meet
these safety and reliability challenges.18 The DRPs require the IOUs to begin planning and investing in
the distribution system in a way that will enable higher levels of DER adoption than traditional grid
planning processes have previously allowed. DERs have the potential to improve reliability and
resiliency, particularly for essential emergency-response and disaster-recovery services.
The CPUC is working diligently to address all aspects of creating a modern grid for California. The
DER Action Plan serves as a roadmap for decision-makers, staff, and stakeholders working in support of
California’s DER future in order to facilitate proactive, coordinated, and forward-thinking development of
DER-related policy.
2.2.1. Deployment Plan Background
The Commission adopted several Decisions to further the state policy of Grid Modernization through
implementation of the Smart Grid Proceeding (R.08-12-009)19, including establishing that the IOUs file
Smart Grid Deployment Plans (Annual Reports) annually. The three IOUs filed their initial Deployment
Plans on July 1, 2011, as required by SB 17.20 The Deployment Plans were approved by the Commission
in D.13-07-02421 on July 25, 2013. This approval cleared the way for implementation of the deployment
plans as part of each IOU’s GRC. Furthermore, D.13-07-02422 adopted template criteria for the Smart
Grid Annual Reports that the IOUs are required to file annually to demonstrate progress on Smart Grid
deployment.
Through succeeding Decisions, the Smart Grid Proceeding ordered the Utilities to:
• Deploy smart meters and provide downloadable usage data to customers and authorized third
parties, referred to as Customer Data Access (CDA);
• File Smart Grid Deployment Plans and to set the requirements for what the plans must address;
17 General Rate Cases are regulatory proceedings used to address the costs of operating and maintaining the utility
system and the allocation of those costs among customer classes for a given IOU. 18 Pursuant to P.U. Code § 769, CPUC Rulemaking (R.) 14-08-013 is considering the IOUs’ DRPs. 19 Please see the following link to the R.08-12-009 Order Instituting Rulemaking:
http://docs.cpuc.ca.gov/PublishedDocs/WORD_PDF/FINAL_DECISION/95608.PDF. 20 Please see the following link for the SB 17 Bill text:
http://leginfo.legislature.ca.gov/faces/billNavClient.xhtml?bill_id=200920100SB17. 21 Please see the following link for the full text of D.13-07-024:
http://docs.cpuc.ca.gov/PublishedDocs/Published/G000/M075/K390/75390046.PDF. 22 Please see the following link for the full text of D.13-07-024:
http://docs.cpuc.ca.gov/PublishedDocs/Published/G000/M075/K390/75390046.PDF.

California Smart Grid Annual Report to the Governor
and the Legislature 2018
7
• Protect the privacy and security of customer data generated by smart meters;
• Provide Home Area Networks (HAN) capability on the smart meters;
• Adopt metrics to measure the effectiveness of smart grid investments; and
• Convene an Energy Data Access Committee to determine ongoing access
policies and issues.
In 2014, the Commission closed the Smart Grid Proceeding R.08-12-00923, and ordered the IOUs’
Smart Grid Deployment Plans to include the following eight elements:24
1. Smart Grid Vision Statement
2. Deployment Baseline
3. Smart Grid Strategy
4. Grid Security and Cyber Security Strategy
5. Smart Grid Roadmap
6. Cost Estimates
7. Benefits Estimates
8. Metrics
The IOUs filed their 2018 Smart Grid Annual Reports in October 2018.25
2.2.2. Smart Grid Costs and Benefits
The three IOUs are required to report on Smart Grid program costs and associated benefits. The costs
and benefits shown in Table 1 reflect the reporting period for the IOUs’ Smart Grid Annual Reports,
which covers fiscal year 2017-201826. Costs are calculated as the sum of all the Smart Grid programs and
investments implemented by each IOU. Benefits are calculated as a sum of avoided cost of utility
operations, including environmental, customer service, and Transmission & Distribution (T&D) costs, as
23 Please see the following link to the R.08-12-009 Order Instituting Rulemaking:
http://docs.cpuc.ca.gov/PublishedDocs/WORD_PDF/FINAL_DECISION/95608.PDF. 24 Decision (D).14-12-004. 25 The 2018 annual reports, as well prior annual reports, can be found on the CPUC website at:
http://www.cpuc.ca.gov/General.aspx?id=4693. 26 The IOUs were ordered to report data in alignment with the State’s Fiscal Year which corresponds with July 1,
2017 to June 30, 2018.
California Smart Grid Annual Report to the Governor
and the Legislature 2018
8
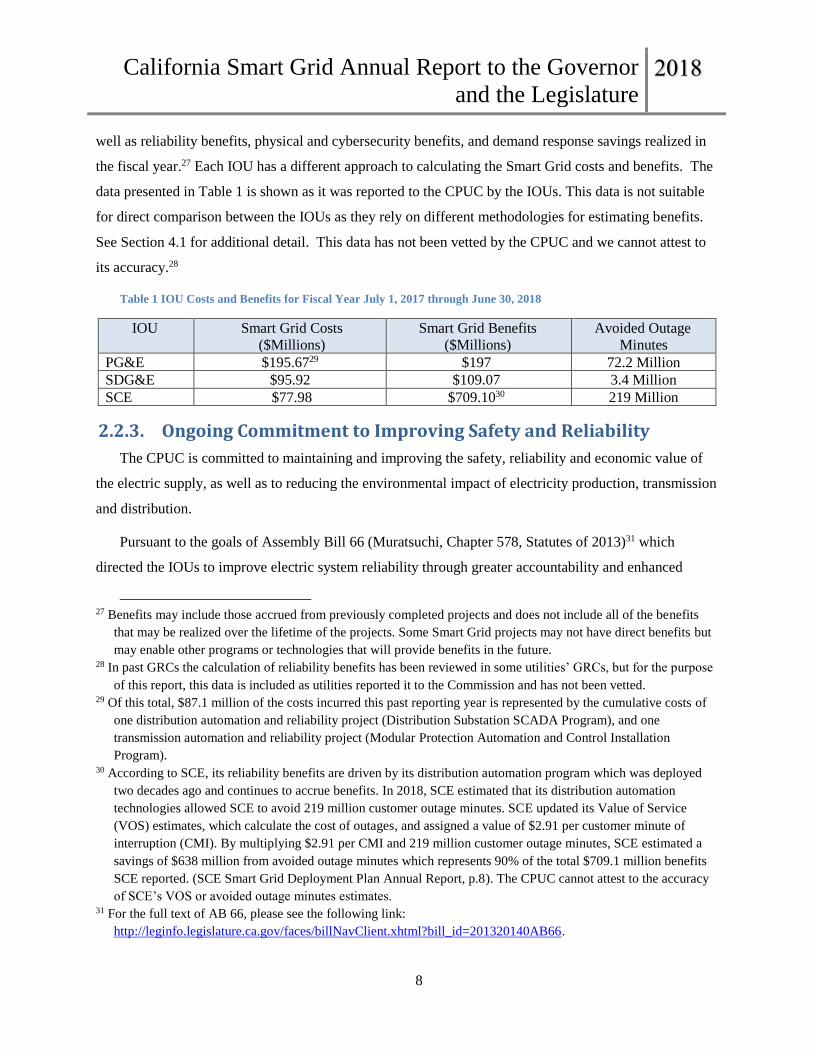
well as reliability benefits, physical and cybersecurity benefits, and demand response savings realized in
the fiscal year.27 Each IOU has a different approach to calculating the Smart Grid costs and benefits. The
data presented in Table 1 is shown as it was reported to the CPUC by the IOUs. This data is not suitable
for direct comparison between the IOUs as they rely on different methodologies for estimating benefits.
See Section 4.1 for additional detail. This data has not been vetted by the CPUC and we cannot attest to
its accuracy.28
Table 1 IOU Costs and Benefits for Fiscal Year July 1, 2017 through June 30, 2018
IOU
Smart Grid Costs
($Millions)
Smart Grid Benefits
($Millions)
Avoided Outage
Minutes
PG&E $195.6729 $197 72.2 Million
SDG&E $95.92 $109.07 3.4 Million
SCE $77.98 $709.1030 219 Million
2.2.3. Ongoing Commitment to Improving Safety and Reliability
The CPUC is committed to maintaining and improving the safety, reliability and economic value of
the electric supply, as well as to reducing the environmental impact of electricity production, transmission
and distribution.
Pursuant to the goals of Assembly Bill 66 (Muratsuchi, Chapter 578, Statutes of 2013)31 which
directed the IOUs to improve electric system reliability through greater accountability and enhanced
27 Benefits may include those accrued from previously completed projects and does not include all of the benefits
that may be realized over the lifetime of the projects. Some Smart Grid projects may not have direct benefits but
may enable other programs or technologies that will provide benefits in the future. 28 In past GRCs the calculation of reliability benefits has been reviewed in some utilities’ GRCs, but for the purpose
of this report, this data is included as utilities reported it to the Commission and has not been vetted. 29 Of this total, $87.1 million of the costs incurred this past reporting year is represented by the cumulative costs of
one distribution automation and reliability project (Distribution Substation SCADA Program), and one
transmission automation and reliability project (Modular Protection Automation and Control Installation
Program). 30 According to SCE, its reliability benefits are driven by its distribution automation program which was deployed
two decades ago and continues to accrue benefits. In 2018, SCE estimated that its distribution automation
technologies allowed SCE to avoid 219 million customer outage minutes. SCE updated its Value of Service
(VOS) estimates, which calculate the cost of outages, and assigned a value of $2.91 per customer minute of
interruption (CMI). By multiplying $2.91 per CMI and 219 million customer outage minutes, SCE estimated a
savings of $638 million from avoided outage minutes which represents 90% of the total $709.1 million benefits
SCE reported. (SCE Smart Grid Deployment Plan Annual Report, p.8). The CPUC cannot attest to the accuracy
of SCE’s VOS or avoided outage minutes estimates. 31 For the full text of AB 66, please see the following link:
http://leginfo.legislature.ca.gov/faces/billNavClient.xhtml?bill_id=201320140AB66.

California Smart Grid Annual Report to the Governor
and the Legislature 2018
9
reporting, the CPUC issued a Decision in January 201632 that required reliability reporting on a more
local basis by the IOUs. The IOUs were also directed to report on top one percent of their worst-
performing circuits and to annually detail their investment plans for mitigating these reliability deficiency
issues. Several Smart Grid technologies deployed by the Utilities, such as Geographic Information
Systems (GIS) and Outage Management Systems (OMS), are expected to be deployed to mitigate
reliability concerns and to automate and improve outage detection while improving reporting.
As the result of the CPUC’s commitment to making safety an integral consideration in all of its
proceedings, the Utilities in Fiscal Year 2017-2018 refined their safety risk assessments in their GRCs.
By identifying, prioritizing, and offering mitigations for their top safety and operational risks, the Utilities
are providing the Commission with a stronger rationale for considering proposed GRC investments in
infrastructure upgrades, improved training, and safer operations. In their GRCs, the IOUs have identified
physical and cyber security vulnerabilities to be among the utility facilities’ top risks. Increasingly,
mitigation proposals involve new Smart Grid technologies that enhance safety, reliability, and resiliency
and to improve monitoring of grid and pipeline operations and distributed energy resources.
The CPUC also focuses on resiliency. Unlike reliability, which is well-defined with specific
quantitative metrics (see Footnote 14 on page 5), resiliency is an emerging Smart Grid attribute.
Resiliency can be characterized as both the ability of the system to resist failure, reduce the magnitude
and/or duration of events that cause outages, and to recover from these events. Improving the ability of
the system to restore operations fully from a high stress situation or event is one of the objectives of many
Smart Grid initiatives. Grid modernization initiatives generally enable the utility to develop situational
awareness that anticipates problems using automated fault location and smart meters. Such information
and technologies contribute to maintaining a more resilient grid by reducing the frequency and duration of
outages and enabling microgrids to operate in island mode.33
32 D.16-01-008 in R.14-12-014. See the following link for the full text of D.16-01-008
http://docs.cpuc.ca.gov/PublishedDocs/Published/G000/M157/K724/157724560.PDF. 33 Island mode refers to when a circuit or microgrid operates in isolation from the distribution grid and can continue
to serve power through DERs when the distribution grid experiences outages and can no longer serve the circuit
or microgrid.

California Smart Grid Annual Report to the Governor
and the Legislature 2018
10
3. Commission Activities Related to Smart Grid in 2018
3.1. 2018 Smart Grid Activities
3.1.1 DER Action Plan
The Commission continues to implement its vision to support California’s DER future to facilitate
proactive, coordinated, and forward-thinking development of DER policy across inter-related
Commission proceedings. The Commission’s Energy and Administrative Law Judge Divisions
participated in a steering committee and developed a management framework to coordinate
implementation of the vision and goals of the DER Action Plan across multiple proceedings.34 Using this
framework, the Commission is on schedule to complete action elements in each of the three tracks of the
DER Action Plan: (1) Rates and Tariffs; (2) Distribution Planning, Infrastructure, Interconnection and
Procurement; and (3) Wholesale DER Market Integration and Interconnection.
In Track 1, Rates and Tariffs, the Commission implemented Action Item 1.3 of the DER Action Plan,
in which the Commission examined fixed charges, time-of-use periods and rates, and nonresidential rate
design in general rate cases. Additionally, the Commission carried out Item 1.13, which is the
establishment of clear marketing, education and outreach plans that maximize customer adoption of time-
varying rates.
In Track 2, Distribution Planning, Infrastructure, Interconnection and Procurement, the Commission
adopted an annual distribution investment deferral process per Item 2.1.c for the IOUs to use to select
opportunities for third party-owned DERs to defer or avoid traditional capital investments in the
distribution system.
Finally, for Track 3, Wholesale DER Market Integration and Interconnection, the Commission
implemented Item 3.1, in which the Commission considered market rules and regulatory policies for DER
Multi-Use Applications in order to promote the ability of storage resources to provide stacked services to
the grid.
34 See the following link to the Commission’s DER Action Plan:
http://www.cpuc.ca.gov/uploadedFiles/CPUC_Public_Website/Content/About_Us/Organization/Commissioners/
Michael_J._Picker/DER%20Action%20Plan%20(5-3-17)%20CLEAN.pdf.

California Smart Grid Annual Report to the Governor
and the Legislature 2018
11
3.1.2 Distribution Resources Plans
Pub. Util. Code §76935 required the IOUs to file Distribution Resource Plans (DRPs) by July 1, 2015.
In the IOUs’ Distribution Resource Plans submitted in 2015, the Commission required the IOUs to
propose contracts, tariffs or other DER procurement mechanisms to maximize the locational benefits and
minimize the incremental costs of distributed resources. The Commission also required the utilities to
identify additional spending necessary to integrate DERs into distribution planning and to modernize their
electric grids; as well as identify the barriers to the deployment of DERs. The Commission’s overarching
goals of this new framework are to lower incremental cost of forecasted DERs, minimize grid impacts,
reduce barriers to DER deployment, and target DER deployment to avoid or defer planned utility
distribution investments. Since California’s climate targets require electrification of the transportation
sector by 2045, DERs play an important role in mitigating load growth on the distribution system and on
transmission in load-constrained areas, which is necessary to limit the costs of meeting California’s
climate targets.
The Commission’s DRPs align with the State’s Smart Grid goals of grid modernization, which
includes greater customer choice (in terms of facilitating behind-the-meter DER deployment), improved
communications systems, and higher levels of automation, all of which can also accommodate two-way
energy flows.36 Many of the projects and activities envisioned as part of the DRP support a smarter,
cleaner grid in which customer-sited DERs not only supply power to the customer’s own load, but also to
other customers on the grid.
The Commission instituted the Distribution Resources Plan Proceeding, R.14-08-01337, to consider
the IOUs’ 2015 DRP Applications across the following three tracks:
Track 1: Analytical/Methodological Issues
This Track is focused on developing the methodologies for two analyses that identify optimal
locations for DER deployment; the analyses were adopted in D.17-09-02638 and implemented in
2018:
35 Pursuant to Assembly Bill 327 (Perea, Chapter 611, Statutes of 2013). 36 Traditional distribution system planning practices, in which the IOUs planned the system for one-way power
flows emanating from centralized power generation, are undergoing dramatic changes as a result of the
requirements of Pub. Util. Code § 769. 37 Please see the following link to the R.14-08-013 Order Instituting Rulemaking:
http://docs.cpuc.ca.gov/PublishedDocs/Published/G000/M103/K223/103223470.pdf.

California Smart Grid Annual Report to the Governor
and the Legislature 2018
12
1. Integration Capacity Analysis (Demonstration Project A): The ICA determines the
available hosting capacity of every distribution circuit in the IOUs’ service territories to
accommodate additional DERs. ICA results were first published through online maps and
downloadable datasets located on the IOUs’ websites at the end of 2018, and will be updated
on a monthly basis.39 The ICA will help DER developers site projects in grid locations that
are less likely to trigger system upgrades; will be used by the IOUs in the annual distribution
planning process to identify proactive upgrades to increase a given area’s hosting capacity in
light of forecasted DER adoption; and will serve as the basis for a streamlined (and
potentially automated) Rule 21 interconnection process.
2. Locational Net Benefits Analysis (Demonstration Project B): The LNBA will determine
optimal locations for DER deployment based on cost-effective opportunities for DERs to
defer or avoid traditional distribution system investments. The LNBA will be updated as part
of the annual distribution planning process. LNBA results that display candidate distribution
investment deferral opportunities were published in online maps and downloadable datasets
as a public tool. (see footnote 39). Additionally, the IOUs will be tasked with reviewing and
selecting deferral projects for solicitation. The LNBA will reflect the benefits of DER
deployment, relative to traditional infrastructure. This information will then inform DER
sourcing activities being determined in the Integration of Distributed Energy Resources
Proceeding (R.14-10-003)40 as well as the Integrated Resource Planning effort (R16-02-
007)41.
38 For the full text of D.17-09-026, please see the following link:
http://docs.cpuc.ca.gov/PublishedDocs/Published/G000/M196/K747/196747754.PDF. 39 Integration Capacity Analysis (ICA) and Locational Benefit Analysis (LNBA) Map can be found in the IOUs
DRP Data Portals found here:
SDG&E: https://www.sdge.com/more-information/customer-generation/enhanced-integration-capacity-analysis-ica.
PG&E: https://www.pge.com/eum/login?TYPE=100663297&REALMOID=06-000d5ced-207d-1b59-a63a-
7f320a31909d&GUID=&SMAUTHREASON=0&METHOD=GET&SMAGENTNAME=-SM-
www%2epge%2ecom&TARGET=-SM-https%3a%2f%2fwww%2epge%2ecom%2fb2b%2fdistribution--
resource--planning%2fintegration--capacity--map%2eshtml.
SCE: https://ltmdrpep.sce.com/drpep/.
40 For the full text of the R.14-10-003 Order Instituting Rulemaking, please see the following link:
http://docs.cpuc.ca.gov/PublishedDocs/Published/G000/M116/K116/116116537.PDF. 41 For the full text of the R.16-02-007 Order Instituting Rulemaking, please see the following link:
http://docs.cpuc.ca.gov/PublishedDocs/Published/G000/M158/K663/158663325.PDF.

California Smart Grid Annual Report to the Governor
and the Legislature 2018
13
Track 2: Demonstration (Demos) and Deployment Projects
Track 2 of the DRP required the IOUs to implement Demonstration and Deployment Projects that aim
to prove the IOUs’ ability to plan and operate the distribution system to manage increasingly higher
DER penetrations including:
1. Demo C: Source DER(s) to defer a traditional infrastructure investment and provide net
benefits. This project is intended to validate the ability of DERs to defer or avoid investments
in traditional distribution infrastructure and to achieve net ratepayer benefits as estimated by
the LNBA. The Commission approved this project for PG&E, SCE and SDG&E in D.17-02-
00742 and D.17-06-01243 in 2017. In 2018, the Commission concluded the projects for PG&E
and SDG&E. PG&E’s and SDG&E’s Demo C DER solicitations were unsuccessful because
no cost-effective DER solution bids were received relative to the cost of the traditional
distribution infrastructure. Regardless, the Commission gained valuable information on the
type of traditional distribution infrastructure projects that can or cannot be deferred by DERs.
These lessons learned are being applied in the IOUs Distribution Investment Deferral
Framework (Track 3). SCE’s Demo C contracts for this project are pending Commission
approval. The Commission expects to review these contracts in 2019.
2. Demo D: Operate the system at high penetrations of DERs. This project calls for the Utilities
to integrate high penetrations of DER into their distribution operations, to demonstrate the
operations of multiple DERs in concert, and to coordinate operations with third parties and
customers. This project was approved for PG&E and SCE in D.17-02-00744 and D.17-06-
01245 in 2017. PG&E’s Demo D DER solicitation was unsuccessful, because it did not
receive cost-effective DER bids. SCE’s Demo D contracts for this project are pending
Commission approval. The Commission expects to review these contracts in 2019.
3. Demo E: Plan and operate a microgrid. This project will demonstrate a microgrid where
DERs (both customer- and utility-owned) serve a significant portion of customer load and
42 For the full text of D.17-02-007, please see the following link:
http://docs.cpuc.ca.gov/PublishedDocs/Published/G000/M176/K178/176178449.PDF. 43 For the full text of D.17-06-012, please see the following link:
http://docs.cpuc.ca.gov/PublishedDocs/Published/G000/M190/K737/190737689.PDF. 44 For the full text of D.17-02-007, please see the following link:
http://docs.cpuc.ca.gov/PublishedDocs/Published/G000/M176/K178/176178449.PDF. 45 For the full text of D.17-06-012, please see the following link:
http://docs.cpuc.ca.gov/PublishedDocs/Published/G000/M190/K737/190737689.PDF.

California Smart Grid Annual Report to the Governor
and the Legislature 2018
14
reliability services. Furthermore, it will demonstrate the use of a DER management system
(DERMS), which is a software solution that monitors, controls, and optimizes both third-
party- and utility-owned DERs. The Commission approved this project for SDG&E and SCE
in D.17-02-00746 and D.17-06-01247, respectively, in 2017. Final results for these projects are
still pending.
Track 3: Policy Issues
In Track 3 of the DRP, the Commission addressed several policy questions related to
incorporating new tools and forecasting methods into existing distribution system planning and
investment processes which the Commission adopted in 2018:
1. DER Growth Scenarios and Distribution Load Forecasting: In D.18-08-00448, the
Commission considered the methodological issues for developing circuit-level forecasts of
DER adoption and distribution load to inform distribution planning, as well as support
process alignment with the CEC’s Integrated Energy Policy Report (IEPR), IRP, Long-Term
Procurement Planning (LTPP), and the CAISO’s Transmission Planning Process (TPP). In
August 2017, the Commission adopted assumptions for the 2017–2018 planning cycle and
approved preliminary methodologies for disaggregating to the circuit level.
2. Grid Modernization Investment Framework: In D.18-03-02349, the Commission adopted a
framework for identifying and evaluating which utility investments in grid modernization are
necessary to integrate cost-effective DERs into distribution planning, and which will also
yield net benefits to ratepayers. With the expansion of DERs, many new technologies have
emerged that work to integrate DERs into grid planning and operations. If the Commission
does not carefully evaluate grid modernization technologies for cost reasonableness, the cost
to ratepayers for widespread adoption of all these technologies could outweigh the benefits
they provide. The Commission needs a decision-making framework that will identify the
necessary investments to the distribution grid that will yield net ratepayer benefits while
46 For the full text of D.17-02-007, please see the following link:
http://docs.cpuc.ca.gov/PublishedDocs/Published/G000/M176/K178/176178449.PDF. 47 For the full text of D.17-06-012, please see the following link:
http://docs.cpuc.ca.gov/PublishedDocs/Published/G000/M190/K737/190737689.PDF. 48 See the following link for the text of D.18-08-004:
http://docs.cpuc.ca.gov/PublishedDocs/Published/G000/M221/K552/221552166.PDF. 49 See the following link for the text of D.18-03-023:
http://docs.cpuc.ca.gov/PublishedDocs/Published/G000/M212/K432/212432689.PDF.

California Smart Grid Annual Report to the Governor
and the Legislature 2018
15
supporting a modern grid that supports high penetrations of DERs and maintains safety and
reliability.
3. Distribution Investment Deferral Framework: In D.18-08-00450, the Commission adopted
a planning framework for identifying, evaluating, and selecting opportunities for DERs to
defer or avoid traditional distribution investments and to produce net ratepayer benefits.
Process alignment between the IOU’s distribution planning process, DER procurement, and
the GRC process is achieved in the Deferral Framework. The IOUs implemented the
framework in 2018 and recommended a portfolio of distribution deferral projects that will be
put out for competitive solicitation in early 2019.
3.1.3 Integrated Distributed Energy Resources
Since 2007, the CPUC has sought to integrate DERs through utility program offerings (e.g. Energy
Efficiency, Demand Response) and more recently, through the Integrated Distributed Energy Resources
(IDER) Proceeding R.14-10-003.51 The Commission’s intent is to integrate these resources and
technologies in order to reduce greenhouse gas (GHG) emissions and to increase ratepayer benefits by
displacing “wires” solutions; i.e., traditional utility planned capital investments.
In December 2016, the Commission issued Decision (D.)16-12-03652 to address the Competitive
Solicitation Framework and Regulatory Incentive Pilot. This decision adopted a technology neutral
competitive solicitation framework for DERs that can be deployed to defer traditional distribution
infrastructure build outs and established a regulatory process to oversee these solicitations. D.16-12-036
authorized a pilot to test a regulatory incentive mechanism through which a utility can earn a four percent
pre-tax incentive on annual payments to DERs. D.16-12-036 required each utility to select at least one
deferral project for the pilot but encouraged the utility to select up to three additional projects to test the
incentive mechanism. Additionally, D.16-12-036 specified seven steps related to pursuing the incentive
pilot, including forming a Distribution Planning Advisory Group (DPAG) to engage stakeholders with
reviewing candidate deferral opportunities. The DPAG advised and consulted with the Utilities regarding
50 See the following link for the text of D.18-08-004:
http://docs.cpuc.ca.gov/PublishedDocs/Published/G000/M221/K552/221552166.PDF. 51 For the full text of the IDER Order Instituting Rulemaking, please see the following link:
http://docs.cpuc.ca.gov/PublishedDocs/Published/G000/M116/K116/116116537.PDF. 52 For the full text of D.16-12-036, please the following link:
http://docs.cpuc.ca.gov/PublishedDocs/Published/G000/M171/K555/171555623.PDF.

California Smart Grid Annual Report to the Governor
and the Legislature 2018
16
the process for considering proposed distribution deferral pilot projects, contingency plans, proposed
counting method, and valuation components for the Incentive Pilot.
In December 2017, the Commission adopted Resolution E-488953 ordering SCE and SDG&E to
move forward with their DER solicitations. The Commission also granted PG&E's request for an
extension to start its solicitation process due to the 2017 North Bay fires. Following the completion of the
solicitation process in 2019, the Commission, with the DPAG, will evaluate the solicitation process and
reconvene the Competitive Solicitation Framework Working Group to develop a technology neutral
solicitation document to be used for future DER solicitations.
Pursuant to D.16-12-036 and Res. E-4889, SCE and SDG&E began their solicitation process in
January 2018. SDG&E selected one project, Circuits 303 and 783 in Carlsbad, for their IDER Pilot. It
considered integrated hybrid resource types to meet the total required distribution capacity for each circuit
project replacement or deferral with deliveries beginning as early as September 1, 2019. SDG&E
completed its solicitation on March 20, 2018 and did not receive any cost-effective bids.
SCE selected two substation upgrade projects, the Eisenhower Project in Cathedral City and the
Newbury Project in Thousand Oaks for their IDER Pilot. SCE considered integrated hybrid resource
types that would increase capacity for these two projects. SCE completed its solicitation in May 2018. On
November 5, 2018, the Commission approved four in-front-of-the-meter energy storage contracts for
Distribution Deferral and Resource Adequacy, totaling 9.5 MW that will defer the substation upgrades for
9.5 years. These projects are the first successful cost effective IDER pilot projects that would defer capital
investment, and the first projects which apply the Commission approved Multi-Use-Application rules
representing added value stacking for ratepayers by procuring multiple services.
In October 2018, the Commission adopted Resolution E-495654 ordering PG&E to start its IDER
solicitation process. PG&E is expected to complete its IDER RFO solicitation in the first quarter of 2019.
3.1.4 Interconnection Rule 21
The Rule 21 tariff sets interconnection, operating, and metering requirements for generation facilities
to be connected to a utility’s distribution system in order to maintain safety and reliability of the
53 For more information, see Resolution E-4889:
http://docs.cpuc.ca.gov/PublishedDocs/Published/G000/M201/K961/201961781.PDF. 54 Please see the following link for the full text of Resolution E-4956:
http://docs.cpuc.ca.gov/PublishedDocs/Published/G000/M235/K815/235815737.PDF.

California Smart Grid Annual Report to the Governor
and the Legislature 2018
17
distribution and transmission systems. Barriers to the deployment of distributed resources are addressed
in the Commission’s Interconnection Rulemaking, R.17-07-00755. In 2018, the Interconnection
Rulemaking considered policy and programmatic changes to streamline the interconnection process. The
March 2018 Working Group One Report56 addressed urgent interconnection issues. The October 2018
Working Group Two Report57 primarily leverages work on the Integration Capacity Analysis from the
utility Distribution Resource Plans Proceeding R.14-08-01358 to further streamline the Fast Track
process59 in Rule 21. The Commission will consider the Working Groups’ recommendations in
forthcoming decisions.
The Commission will also continue implementation of Assembly Bill 2861 (Ting, Chapter 672,
Statutes of 2016)60, which authorizes the CPUC to establish an expedited interconnection dispute
resolution process that strives for a binding resolution of an interconnection dispute within 60 days.
3.1.5 Smart Inverters
Inverters convert Direct Current (DC) to Alternative Current (AC) power and hence are essential for
interconnecting various DERs, including solar PV systems (which produce DC power), to the grid. Smart
inverters provide capabilities beyond those of a standard inverter—autonomous response to voltage and
frequency conditions, safety features, and communications capabilities—and are one of the foundational
building blocks of the Smart Grid. Smart inverters’ primary benefit is to increase the capacity of the
distribution system to accommodate higher penetrations of DERs. Smart Inverters accomplish this by
mitigating some of the grid impacts of intermittent variable resources and enhancing these same DERs’
ability to serve as grid assets. They can also improve operation of the grid through advanced
communications and control. Through the direction of the Commission, the Smart Inverter Working
55 For the full text of the R.17-07-007 Order Instituting Rulemaking, please see the following link:
http://docs.cpuc.ca.gov/PublishedDocs/Published/G000/M192/K079/192079467.PDF. 56 The R.17-07-007 Working Group One Report is accessible through the following link:
http://www.cpuc.ca.gov/uploadedFiles/CPUCWebsite/Content/UtilitiesIndustries/Energy/EnergyPrograms/Infras
tructure/RDI/itcn/R1707007WorkingGroupOneFinalReport.pdf. 57 The R.17-07-007 Working Group two Report is can be found on in the following webpage:
http://www.cpuc.ca.gov/General.aspx?id=6442455170. 58 Please see the following link to the R.14-08-013 Order Instituting Rulemaking:
http://docs.cpuc.ca.gov/PublishedDocs/Published/G000/M103/K223/103223470.pdf. 59 The Fast Track process is a streamlined review process that is based on multiple evaluation screens for
interconnecting net energy metering, non-export, and small exporting facilities. 60 For the full text of AB 2861, please see the following link:
http://leginfo.legislature.ca.gov/faces/billNavClient.xhtml?bill_id=201520160AB2861.

California Smart Grid Annual Report to the Governor
and the Legislature 2018
18
Group (SIWG) has developed inverter functionality recommendations that are being incorporated into the
Electric Rule 21 tariffs. These recommendations are grouped into three phases: Phase 1 describes seven
autonomous smart inverter functions, Phase 2 defines smart inverter communications requirements, and
Phase 3 outlines eight advanced smart inverter functions.
As of September 9, 2017, the IOUs incorporated seven autonomous Phase 1 smart inverter functions
into their Rule 21 tariffs and made these Phase 1 functions mandatory for all inverter-based DERs
interconnecting under Rule 21, pursuant to Commission Decision (D.)14-12-03561 and R.11-09-011.62
The Phase 2 Smart Inverter communications requirements were added to Rule 21 in April 2017 and it is
expected that these capabilities will become mandatory in 2019. Once these requirements are adopted, all
inverter-based generation interconnecting under Rule 21 will be capable of communication and Institute
of Electrical and Electronics Engineers (IEEE) 2030.563 will serve as the default protocol used by IOUs to
communicate to either individual DERs, energy management systems, or DER aggregators. These
communications, when operationalized, will increase utility visibility into grid conditions and allow
DERs to respond to shifting grid needs.
In April 2018, the Commission approved revisions to Rule 21 that incorporate smart inverter Phase 3
advanced functions. The Commission also adopted Reactive Power Priority, which is a powerful tool for
preventing and mitigating voltage rise on the distribution system. Reactive Power Priority became
mandatory in June 2018. Since August, the Smart Inverter Working Group (SIWG) has met weekly to
discuss the implementation of smart inverter Phase 2 communications requirements as well as Phase 3
advanced functions such as “Scheduling Power Values and Modes.” Once implemented, these functions
will increase the amount of DER generation that the grid can accommodate without infrastructure
upgrades and will increase grid safety and stability.
The Phase 2 communications requirements and Phase 3 advanced functions represent higher levels of
DER dispatch and control capabilities which are necessary for leveraging DERs for grid operations. The
inclusion of these requirements in Rule 21 represents a critical step towards the attainment of the CPUC
DER Action Plan goal 2.13 to “fully operationalize advanced (beyond Phase 1) smart inverter
functionalities by 2020 to enhance the integration of DERs into the grid.”
61 For the full text of R.14-12-035, please see the following link:
http://docs.cpuc.ca.gov/PublishedDocs/Published/G000/M143/K827/143827879.PDF. 62 For the full text of R.11-09-011, please see the following link:
http://docs.cpuc.ca.gov/PublishedDocs/WORD_PDF/FINAL_DECISION/144161.PDF. 63 Also known as Smart Energy Profile (SEP) 2.0 Application Protocol Standard.

California Smart Grid Annual Report to the Governor
and the Legislature 2018
19
3.1.6 Energy Storage
The Commission’s energy storage procurement policy was formulated with three primary goals:
1) Grid optimization, including peak reduction, contribution to reliability needs, or deferral of
transmission and distribution upgrade investments;
2) Integration of renewable energy; and
3) GHG reductions in support of state targets.
In response to AB 251464, the Commission established energy storage targets in 2013 of 1,325 MW to
be procured by 2020 and operational by 2024. In 2018, the Commission approved a record setting amount
of energy storage: 905.5 MW. To date the Commission has approved procurement of more than 1.6
gigawatts of new storage capacity to be built in the state, of which 410 MWs are online and operational,
which is about 26 percent of total approved storage capacity. The AB 251465 mandate is to be procured in
three distinct grid domain targets with some flexibility between the grid domain targets. Cumulatively
the utilities have exceeded the 1,325 MW target, but SCE and PG&E still need additional domain-specific
procurement to complete the mandate.66 See Table 2 below for more detail including the grid domains and
targets.
64 For the full text of AB 2514, please see the following link:
https://leginfo.legislature.ca.gov/faces/billNavClient.xhtml?bill_id=200920100AB2514. 65 For the full text of AB 2514, please see the following link:
https://leginfo.legislature.ca.gov/faces/billNavClient.xhtml?bill_id=200920100AB2514. 66 SCE and PG&E are together 178 MW short of meeting the AB 2514 mandate. PG&E requires 39 MW on the
customer domain and SCE needs 139 MW on the transmission domain. SDG&E has met their target.

California Smart Grid Annual Report to the Governor
and the Legislature 2018
20
Table 2. IOU Progress Towards the AB 2514 Energy Storage Target (MW)
Energy storage has been procured to meet local capacity requirements and is a focus of distribution
planning, deferral, and other services. Thus, energy storage is emerging as a crucial backbone of the
Smart Grid. Since the beginning of the California Storage Framework, storage contract prices have
declined between 40% and 50%. The Commission implementing Assembly Bill 2868 (Gatto, Chapter
681, Statutes of 2016)67 which allows for the procurement of up to 500 additional MWs of distribution-
connected energy storage, with up to 25% behind the utility meter.
Energy Division and CAISO developed a joint framework of rules to govern multiple use applications
(MUAs) for storage, which was adopted by the Commission in January 2018 with D.18-01-00368. The
MUAs will allow energy storage devices to provide multiple grid benefits market services, and to realize
their full economic potential. The framework included eleven rules to guide development of MUAs.
D.18-01-003 required the formation of a working group to develop additional recommendations on a
defined set of topics. The working group met multiple times in 2018 and submitted its report to the
Commission on August 9, 2018.
The Commission approved SCE and PG&E’s 2016 RFO energy storage procurement on October 11,
2018, which resulted in 175 MWs of new storage capacity – 135 MWs in the transmission domain; 30
67 For the full text of AB 2868, please see the following link:
https://leginfo.legislature.ca.gov/faces/billTextClient.xhtml?bill_id=201520160AB2868. 68 For the full text of D.18-01-003 see the following link:
http://docs.cpuc.ca.gov/PublishedDocs/Published/G000/M206/K462/206462341.pdf.
Grid Domains
Total Storage
Procurement
per AB 2514
Required by
2020
AB 2514
Driven
Storage
Procurement
as of 2018
Storage
Procurement
through other
CPUC Proceedings
as of 2018
Total Storage
Procurement
Through all Eligible
Proceedings as of
2018
Total Storage
Procurement
Adjusted per AB
2514 Rules as of
2018
Excess/Deficiency
Relative to the
Total AB 2514
Target
Transmission 310 135 557 692 544 234
Distribution 185 36 0 36 185 0
Customer-Side 85 36 10 46 46 -39
Transmission 310 0 120 120 171 -139
Distribution 185 27 112 134 185 0
Customer-Side 85 100 205 306 221 136
Transmission 80 - 110 110 80 0
Distribution 55 - 57 57 56 1
Customer-Side 30 - 29 39 30 0
IOU Total 1,325 334 1,200 1,540 1,518
PG
&E
SCE
SDG
&E

California Smart Grid Annual Report to the Governor
and the Legislature 2018
21
MWs in the distribution domain and 10 MWs behind the meter, in the customer domain. One 20 MW
distribution interconnected project proposed by PG&E will be owned by the utility and will provide both
distribution deferral benefits as well as resource adequacy and wholesale market services, making it the
first MUA project approved by the Commission. The Commission authorized this procurement to count
toward AB 251469 targets.
Additionally, the Commission approved SCE’s second Preferred Resources Pilot (PRP) RFO on July
12, 2018, which included 60 MW of storage in distribution domain and 10 MW of solar plus storage on
the customer side.70 SCE will use this approved procurement in addition to earlier procured DERs from
the first PRP RFO to offset increasing customer demand for electricity in central Orange County that is
partly due to the closure of the San Onofre Nuclear Generating Station (SONGS) and the impending
retirement of nearby ocean-cooled power plants.
On November 8, 2018, the Commission in Resolution E-4949 approved PG&E’s request to procure
567.5 MW of lithium ion batteries in the South Bay-Moss Landing subarea to meet local reliability
needs71. The four projects are estimated to yield $233 million in ratepayer benefits over 10 years and will
likely yield more benefits given that most of the approved storage has a 15 to 20-year lifespan.
In 2018, SDG&E met its obligations under AB 251472 to procure 165 MWs of energy storage, after
the Commission approved its remaining 85 MW of storage needed to partially replace the capacity of
SONGS which retired in 2012. In 2013 and again in 2014, the Commission required SDG&E and SCE to
conduct RFOs for energy storage and preferred resources to replace the capacity of SONGS and the
planned retirement of once through cooled plants
69 For the full text of AB 2514, please see the following link:
https://leginfo.legislature.ca.gov/faces/billNavClient.xhtml?bill_id=200920100AB2514. 70 The Commission in D.18-07-024 approved 125 MW of DERs in total as it also approved 55 MW of demand
response. 71 Of the 567.5 MW of energy storage, there will be one 182.5 MW utility-owned project on the transmission side
that would likely be the largest project in the world when completed, and 385 MW of third party owned energy
storage comprised of 3 different projects (all on the transmission side except for one 10 MW project on the
customer side). 72 For the full text of AB 2514, please see the following link:
https://leginfo.legislature.ca.gov/faces/billNavClient.xhtml?bill_id=200920100AB2514.

California Smart Grid Annual Report to the Governor
and the Legislature 2018
22
3.1.7 Plug-In Electric Vehicle Integration
The State of California aims to have 5 million light-duty73 zero emission vehicles on the road by 2030
and have 250,000 electric vehicle charging stations operational by 2025 in order to help reduce
greenhouse gas emissions to 40 percent below 1990 levels by 2030 and help achieve carbon neutrality by
2045.74 To date, there are approximately 491,000 light-duty zero emission vehicles on the road in
California. Beginning with the Smart Grid Proceeding R.08-12-00975, the Commission began exploring
the potential for plug-in electric vehicles (PEVs) to interact with an increasingly modernized grid. The
CPUC’s activities related to PEVs are broadly categorized into four areas:
1) Charging infrastructure deployment
2) Rates
3) Vehicle-grid integration
4) Rebates and incentives
In 2016, the CPUC issued Decisions authorizing SDG&E,76 SCE,77 and PG&E78 to deploy charging
infrastructure to support PEVs. In 2017, with total budgets of $197 million, the three IOUs continued or
launched their pilots to install the necessary infrastructure to support up to 12,500 charging stations. The
IOUs are installing charging infrastructure in multi-unit dwellings, workplaces, and some public
locations. The IOUs are using various load management techniques, including rate design and demand
response programs, to ensure the new vehicle load is beneficial to the grid.
A 2012 settlement between the CPUC and NRG directed NRG to spend $102.5 million to deploy
infrastructure to support the same location sectors as the IOU programs above, as well as public DC fast
charging and pilot programs to support research and development (R&D) and underserved communities.79
In addition to some of the load management strategies described above, the NRG Settlement is also
testing vehicle-to-grid technologies and energy storage integration as load management strategies.
73 Light-duty refers to passenger vehicles (cars and light trucks) and all other vehicles under 8,500 pounds. 74 See Governor Edmund (Jerry) Brown’s Executive Order B-55-18 to Achieve Carbon Neutrality for more
information https://www.gov.ca.gov/wp-content/uploads/2018/09/9.10.18-Executive-Order.pdf. 75 Please see the following link to the R.08-12-009 Order Instituting Rulemaking:
http://docs.cpuc.ca.gov/PublishedDocs/WORD_PDF/FINAL_DECISION/95608.PDF. 76 For more information see D.16-01-045. 77 See D.16-01-023 for more information. 78 See D.16-12-065 for more information. 79 For more information about the CPUC/NRG settlement agreement, please see the following link:
http://www.cpuc.ca.gov/General.aspx?id=5936.

California Smart Grid Annual Report to the Governor
and the Legislature 2018
23
PG&E, SCE, SDG&E and Liberty Utilities each continue to offer EV time-of-use energy rates for
residential customers to encourage off-peak EV charging. SDG&E also offers a dynamic EV rate for
those that use charging infrastructure deployed in the infrastructure pilot described above.80 SCE and
Liberty have commercial time-of-use rates specifically for commercial EV customers. In 2018 the
Commission also approved three new commercial EV rates for SCE customers, a Public Grid Integrated
Rate for SDG&E to use at DC fast charging stations the utility owns, 81 and an EV TOU Pilot Rate for
Bear Valley customers. In November of 2018, PG&E submitted an application to establish a new
commercial EV rate, which the Commission will be evaluating in 2019.
The CPUC, along with other state agencies, is developing policies that support Vehicle-Grid
Integration (VGI), a framework for utilizing the flexible charging and discharging capabilities of PEVs to
provide grid services. At the end of 2018, the Commission incorporated a staff report into the procedural
record of the new Order Instituting Rulemaking (OIR) regarding Transportation Electrification. This staff
report summarizes the findings and recommendations of a 2017 stakeholder working group on
communication protocols that could enable VGI to scale. Additionally, Energy Division staff is
collaborating with the other state agencies to update the 2014 VGI Roadmap.82
In 2018, the CPUC authorized three Transportation Electrification decisions pursuant to SB 350.83
The CPUC authorized the three large IOUs to spend a combined $42 million on 15 pilot projects, 84 and
an additional $738 million to support large-scale investments to support the electrification of the medium-
and heavy-duty sectors in PG&E and SCE service territories and light-duty sectors in SDG&E and PG&E
service territories. 85 The CPUC also authorized the three small IOUs to spend up to $7.33 million on
eight transportation electrification programs and test a new EV rate, mentioned above.86
80 In SDG&E’s dynamic rate, prices change in response to expected hourly grid conditions. 81 Through this rate, SDG&E directly passes the TOU rate signals through to the driver or customer to encourage
off-peak charging. 82 Please see the following link for the VGI Roadmap: https://www.caiso.com/Documents/Vehicle-
GridIntegrationRoadmap.pdf. 83 Please see the following link for the SB 350 Bill text:
https://leginfo.legislature.ca.gov/faces/billNavClient.xhtml?bill_id=201520160SB350. 84 For more information see D.18-01-024 which is available through the following link:
http://docs.cpuc.ca.gov/PublishedDocs/Published/G000/M204/K670/204670548.PDF. 85 See D.18-05-040 for more information. 86 See D.18-09-034 for more information.

California Smart Grid Annual Report to the Governor
and the Legislature 2018
24
In December 2018, the Commission issued a new OIR regarding Transportation Electrification,
which directs the utilities to develop EV rates that are affordable and beneficial to the grid and directs
staff to develop a framework to guide future IOU investments in Transportation Electrification.
3.1.8 Demand Response
In D.16-09-056,87 the Commission adopted the following goal for the IOU’s demand response (DR)
programs: “Commission-regulated demand response programs shall assist the State in meeting its
environmental objectives, cost-effectively meet the needs of the grid, and enable customers to meet their
energy needs at a reduced cost.”88 The IOUs implemented the first year of five-year DR portfolio adopted
in D.17-12-003,89 including the first-time integration of all supply-side DR programs into the CAISO
wholesale market. The Commission allocated $2.5M budget for IOUs to develop pilots to help shape
policy on targeting demand response in transmission constrained local capacity areas and disadvantaged
communities.
The Commission approved the first market-integrated DR contract based primarily on load reductions
by residential customers to provide about 4.5 MW in long term capacity in the San Diego locally-
constrained area. The Commission approved contracts for 45 MW of market-integrated, behind-the-
meter, storage-based DR, including first time use of batteries deployed in residential homes, to provide
long term capacity in one of SCE’s locally-constrained areas. In addition, the Commission approved
Resolution E-4949 in November 2018 which included a contract for 10 MW of market-integrated,
behind-the-meter, storage-based DR to provide long term capacity in one of PG&E’s locally-constrained
areas.
87 For the full text of D.16-09-056, see the following link:
http://docs.cpuc.ca.gov/PublishedDocs/Published/G000/M167/K725/167725665.PDF. 88 D.16-09-056 also specified principles for DR to be (1) flexible and reliable to support renewable integration and
emission reductions, (2) evolve to complement the continuous changing needs of the grid, (3) DR customers
shall have the right to provide demand response through a service provider of their choice and Utilities shall
support their choice by eliminating barriers to data access, (4) implemented in coordination with rate design, (5)
DR process shall be transparent, (6) market-driven leading to a competitive, technology-neutral, open-market in
California with a preference for services provided by third-parties through performance-based contracts at
competitively determined prices, and dispatched pursuant to wholesale or distribution market instructions,
superseded only for emergency grid conditions. For more information, see D.16-09-056. 89 For the full text of D.17-12-003, see the following link:
http://docs.cpuc.ca.gov/PublishedDocs/Published/G000/M202/K275/202275258.PDF.

California Smart Grid Annual Report to the Governor
and the Legislature 2018
25
In D.17-10-01790, the Commission i) adopted the Competitive Neutrality Cost Causation Principle to
allow community choice aggregators (CCAs) and direct access (DA) providers to create their own DR
programs in competition with Utilities DR programs, ii) established a Supply Side Working Group to
develop proposals to address barriers to integration of DR into CAISO markets and a Load Shift Working
Group to develop a framework for new DR models, and iii) ordered an additional Demand Response
Auction Mechanism DRAM pilot 2018 auction for 2019 deliveries with an authorized budget of $13.5
million to support the development of a competitive third-party DR market .
Pursuant to the last order, the IOUs procured 167 MW of competitive DR from third parties for
delivery in 2019. Per D.16-09-056, Energy Division Staff conducted an evaluation of DRAM pilots
against six criteria specified by the Commission and the Energy Division released an interim report on
July 24, 2018 addressing four of these questions. Energy Division Staff submitted a final report including
results on the two remaining questions (related to CAISO market performance) on January 4, 2019.
The Commission issued Decision (D.)18-11-02991 with rulings as follows:
1. Pauses consideration of DRAM pilot extension until after the DRAM evaluation is released (the
evaluation was released January 4, 2019 and the Proceeding is now considering the DRAM
extension).
2. Adopted a statewide handbook on the purpose, policies and rules of the utilities’ Auto DR
program which provides incentives to customers for automating building load reductions during
DR events.
3. Confirms that Reliability based Demand Response Resource (RDRR) can be used anytime within
the Warning Stage, increasing the flexibility available to CAISO for utilizing this reliability
resource to potentially alleviate an imminent grid emergency condition.
4. Prioritizes third-party customers in the allocation of the megawatts under the two percent cap on
RDRR.
5. Directs IOUs to conduct Pilots focused on economic benefits for disadvantaged communities.
6. Orders a stakeholder process to study whether (and how) battery controls should be included in
the Auto DR incentive program.
90 For the full text of D.17-10-017, please see the following link:
http://docs.cpuc.ca.gov/PublishedDocs/Published/G000/M198/K319/198319901.PDF. 91 For the full text of D.18-11-029, please see the following link:
http://docs.cpuc.ca.gov/PublishedDocs/Published/G000/M248/K670/248670669.pdf.

California Smart Grid Annual Report to the Governor
and the Legislature 2018
26
In line with the state’s focus on reducing greenhouse gas emissions, the Commission implemented a
prohibition, effective January 1, 2019, of customer-owned fossil fuel generators from use during DR
event and launched an associated verification mechanism.
3.1.9 Enhanced Electric Reliability Reporting
Enhanced electric reliability reporting provides an objective standard and information to foster
continuous improvement of reliability issues. Pursuant to the goals of AB 6692 which directs the IOUs to
improve electric system reliability through greater accountability and enhanced reporting, the CPUC
issued a Decision in January 2016 that required reliability reporting on a more local basis by the IOUs.
The IOUs were also directed to report one percent of their worst-performing circuits and to annually
detail their investment plans for mitigating these reliability deficiency issues. Several Smart Grid
technologies deployed by the Utilities, such as Geographic Information Systems (GIS) and Outage
Management Systems (OMS), are expected to be deployed to mitigate reliability concerns and to
automate and improve outage detection while improving reporting.
D.16-01-00893 in R.14-12-014 directs the Utilities to use an enhanced reliability reporting template to
report reliability data to the Commission on July 15 of each year beginning in 2017.94 Reliability data is
reported at the system level as well as division or district level.95 The 2016 Decision requires the IOUs to
identify and report on their worst performing circuits based on two or three years of repeat poor
performance according to quantified reliability metric. The three IOUs report one percent of their worst-
performing circuits, while PacifiCorp, Liberty Utilities, and Bear Valley Electric Service report their
three-, two-, and one-worst performing circuits, respectively and combine their reporting into a single
report for the Commission.
The Decision also allows customers to request reliability information about their circuits via utility
websites and to receive responses in a timely manner. All Utilities will conduct at least one annual public
in-person town hall and webinar presentation about the information in their annual electric reliability
92 For the full text of AB 66, please see the following link:
http://leginfo.legislature.ca.gov/faces/billNavClient.xhtml?bill_id=201320140AB66. 93 See the following link for the full text of D.16-01-008
http://docs.cpuc.ca.gov/PublishedDocs/Published/G000/M157/K724/157724560.PDF. 94 The Electric System Reliability Annual Reports can be found on the CPUC website at:
http://www.cpuc.ca.gov/General.aspx?id=4529. 95 Electric utilities divide their service territories into either Divisions or Districts. Each Division or District consists
of groups of electric circuits.
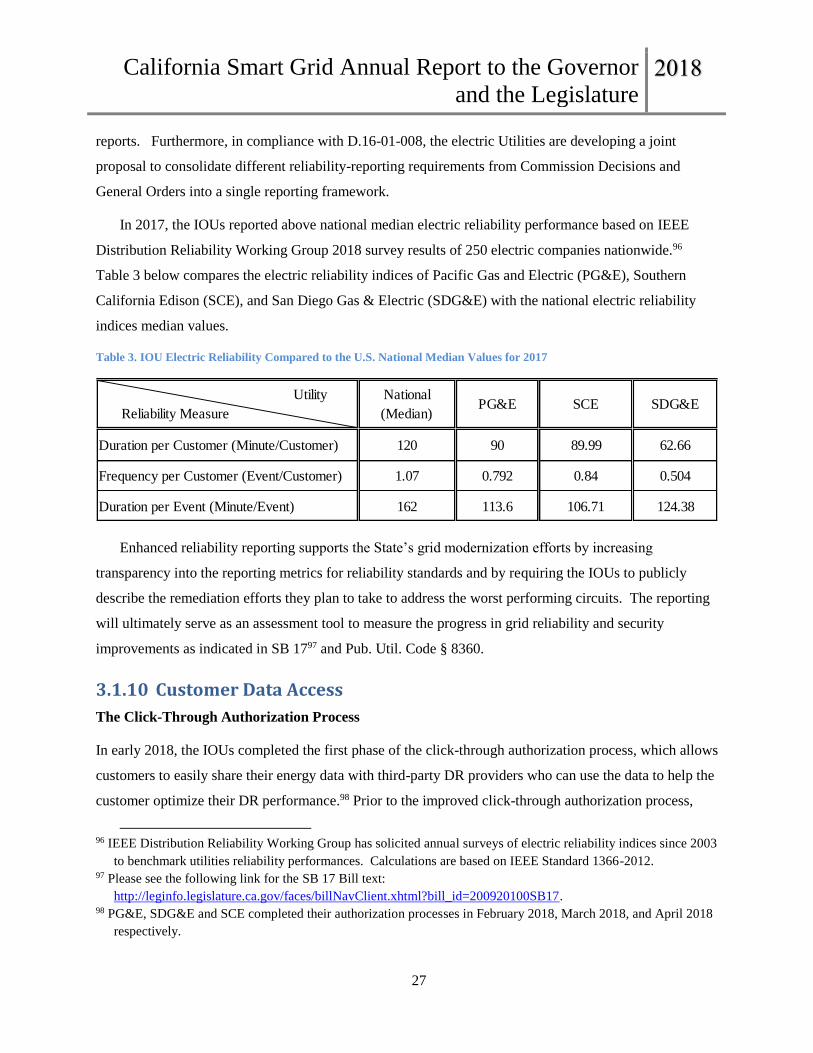
California Smart Grid Annual Report to the Governor
and the Legislature 2018
27
reports. Furthermore, in compliance with D.16-01-008, the electric Utilities are developing a joint
proposal to consolidate different reliability-reporting requirements from Commission Decisions and
General Orders into a single reporting framework.
In 2017, the IOUs reported above national median electric reliability performance based on IEEE
Distribution Reliability Working Group 2018 survey results of 250 electric companies nationwide.96
Table 3 below compares the electric reliability indices of Pacific Gas and Electric (PG&E), Southern
California Edison (SCE), and San Diego Gas & Electric (SDG&E) with the national electric reliability
indices median values.
Table 3. IOU Electric Reliability Compared to the U.S. National Median Values for 2017
Enhanced reliability reporting supports the State’s grid modernization efforts by increasing
transparency into the reporting metrics for reliability standards and by requiring the IOUs to publicly
describe the remediation efforts they plan to take to address the worst performing circuits. The reporting
will ultimately serve as an assessment tool to measure the progress in grid reliability and security
improvements as indicated in SB 1797 and Pub. Util. Code § 8360.
3.1.10 Customer Data Access
The Click-Through Authorization Process
In early 2018, the IOUs completed the first phase of the click-through authorization process, which allows
customers to easily share their energy data with third-party DR providers who can use the data to help the
customer optimize their DR performance.98 Prior to the improved click-through authorization process,
96 IEEE Distribution Reliability Working Group has solicited annual surveys of electric reliability indices since 2003
to benchmark utilities reliability performances. Calculations are based on IEEE Standard 1366-2012. 97 Please see the following link for the SB 17 Bill text:
http://leginfo.legislature.ca.gov/faces/billNavClient.xhtml?bill_id=200920100SB17. 98 PG&E, SDG&E and SCE completed their authorization processes in February 2018, March 2018, and April 2018
respectively.
Utility
Reliability Measure
National
(Median)PG&E SCE SDG&E
Duration per Customer (Minute/Customer) 120 90 89.99 62.66
Frequency per Customer (Event/Customer) 1.07 0.792 0.84 0.504
Duration per Event (Minute/Event) 162 113.6 106.71 124.38
Table 1: Electric Reliability of California Utilities Compare to the Nation Median Values for 2017

California Smart Grid Annual Report to the Governor
and the Legislature 2018
28
customers would either have to fill out a paper authorization form or go through a multi-step online
authorization process on the IOU’s website. The new streamlined process that occurs on the IOU’s
website can be completed in as little as two-screens and four-clicks. Below is a diagram that describes the
process (though each IOU implementation is slightly different):
Expanding the Click-Through Authorization Process
The IOUs filed applications to expand the click-through process on November 26, 2018, per Resolution
E-4868 Ordering Paragraph 29. Resolution E-4868 ordered the IOUs to include in an application,
proposals to:
• Expand the click-through authorization process to DER and energy management providers, which
include consideration of customer protection issues and the evaluation of which data sets should
be available to which providers;
• Make improvements to the click-through authorization processes;
• Improve data delivery processes;
• Offer an alternative click-through authorization process; and
• Deliver the expanded data set, within ninety seconds.
In order to develop a robust application for expanding the click-through solutions to distributed energy
resource providers, in May 2018, the Commission’s Energy Division worked with the Customer Data
Access Committee to solicit feedback on improvements to the click-through process that will be included
in the IOU applications.
Customer Choice Final Paper and Gap Analysis
The Commission published the California Customer Choice Final Paper in August 2018 that included a
section on data access and customer protection.99 The paper briefly explains the current framework for
customer data privacy and authorization and asks whether additional protections are needed. The
Commission also published the Customer Choice Gap Analysis in December 2018, in which Commission
Staff recommended that the Commission open a new rulemaking to further explore data access issues that
are not within the scope of the applications filed in November 2018 to expand the click-through
99 Please see the following link for the California Customer Choice Final Paper:
http://www.cpuc.ca.gov/uploadedFiles/CPUC_Public_Website/Content/Utilities_and_Industries/Energy_-
_Electricity_and_Natural_Gas/Cal%20Customer%20Choice%20Report%208-7-18%20rm.pdf.

California Smart Grid Annual Report to the Governor
and the Legislature 2018
29
process.100 These issues include data access for CCAs, building managers, local governments, and
research institutions, as well as data quality issues.
Energy Atlas: A Geospatial Tool to Combat Climate Change
Since 2014, the CPUC has been part of a group of state and local agencies to support the development of
the Energy Atlas, a geospatial analytical tool developed by UCLA’s California Center for Sustainable
Communities Institute of the Environment. The Energy Atlas is the largest set of disaggregated energy
data in the nation, and uses energy consumption data at the building level, combined with public records,
to reveal previously undetectable patterns about how people, buildings and cities use energy. The tool
helps regional planners and decision makers more effectively target energy program interventions and
develop policies to mitigate and prepare for climate change. Originally limited in scope to Los Angeles
County, CPUC Decision (D.)18-05-041 (Ordering Paragraph 32) directs the utilities to expand the Energy
Atlas to all IOU territories statewide.101,102
3.1.11 Conversion of Mobile Home Park Master Meters to Direct Utility Meters
The Commission’s efforts to phase out master-metering and sub-metering and replace them with
direct utility metering103 will bring the benefits of smart meters to more customers and raise customer
awareness of their electrical usage and costs.
The Commission adopted D.14-03-021 to implement tariffs in a three-year pilot program to convert
10 percent of electric and natural gas master-metered services at mobile home parks (MHPs) and
manufactured housing communities to Utility direct service by the end of 2017.
Utilities have submitted annual status reports to the Commission for 2015 and 2016 and filed Advice
Letters in 2017 to request continuation of the conversion program pursuant to Ordering Paragraph (OP)
100 Additional information on the Customer Gap Analysis can be accessed here:
http://www.cpuc.ca.gov/uploadedFiles/CPUC_Public_Website/Content/Utilities_and_Industries/Energy_-
_Electricity_and_Natural_Gas/Final%20Gap%20Analysis_Choice%20Action%20Plan%2012-31-
18%20Final.pdf. 101 Please see the following link for the text of D.18-05-041:
http://docs.cpuc.ca.gov/PublishedDocs/Published/G000/M215/K706/215706139.PDF. 102 The Energy Atlas is a free, public tool that is available at http://www.energyatlas.ucla.edu/. 103 By default, the replacement meters will be smart meters unless a customer opts out.

California Smart Grid Annual Report to the Governor
and the Legislature 2018
30
13 of D.14-03-021.104 On September 28, 2017, the Commission issued Resolution E-4878105 which
authorized all currently participating electric and gas utilities to continue their Mobile Home Park Utility
Upgrade Pilot Program (MHP Pilot)106 until the earlier date of either December 31, 2019, or the issuance
of a Commission Decision for the continuation, expansion or modification of the program beyond
December 31, 2019. The Resolution projects a minimum of $70 million to extend the Utility Upgrade
program from January 1, 2018 to December 31, 2019.
On May 7, 2018, the Commission approved Order Instituting Rulemaking R.18-04-018107 to Evaluate
the Mobile Home Park Pilot Program and to Adopt Programmatic Modifications. This rulemaking will
determine if the MHP Pilot should become a permanent program beyond 2019, and if programmatic
changes are needed.
3.2. Smart Grid Activities Expected in 2019 at the CPUC
Below is a list of some of the Grid Modernization and Smart Grid development projects anticipated in
2019:
• DER Action Plan – The Commission will continue to support the realization of the vision
expressed in the CPUC DER Action Plan. The Commission will continue to implement many of
the action items in 2019 as described throughout this report. The Commission expects to initiate
or complete the following notable elements in 2019: the consideration of a successor tariff to net
energy metering (Action 1.5), defaulting residential customers to time of use rates pursuant to
R.12-06-013 (Action 1.14), adopting new interconnection rules that leverage the utilities’
Integration Capacity Analyses to streamline DER interconnection processes (Action 2.11), and
continuing to integrate demand response programs into wholesale markets (Actions 3.2 and 3.3).
104 D.14-03-021 OP 13: “Any utility may file a Tier 2 Advice Letter within 45 days of the second annual status
report to request continuation of the conversion program if the actual experience to that point appears to warrant
continuation of the program without major modification. Among other things, the advice letter filing should
specify the application period and the application process and should include a target for converting an additional
number of spaces, either as a whole number or a percentage of the remaining spaces in the utility service territory
potentially eligible for conversion.” See the following link for the full text of D.14-03-021:
http://docs.cpuc.ca.gov/PublishedDocs/Published/G000/M089/K008/89008491.PDF. 105 Please see the following link for Resolution E-4878:
http://docs.cpuc.ca.gov/PublishedDocs/Published/G000/M196/K538/196538125.PDF. 106 The MHP Pilot program converts master meters to direct utilities meters. This increases safety and reliability as
well as electric capacity of the mobile homes. 107 For the full text of the R.18-04-018 Order Instituting Rulemaking, please see the following link:
http://docs.cpuc.ca.gov/PublishedDocs/Published/G000/M214/K124/214124247.PDF.

California Smart Grid Annual Report to the Governor
and the Legislature 2018
31
• Distribution Resources Plan – The IOUs will publish the data portal with complete dataset from
the ICA, LNBA, load and DER forecasts, Grid Needs Assessment and distribution deferral
opportunities by January 1, 2019, and will issue solicitations for distribution deferral projects in
early 2019. The DRP proceeding will complete new methods to quantify locationally sensitive
avoided transmission and distribution costs of DERs to inform a future update to the Avoided
Cost Calculator which is used to determine the cost effectiveness of numerous demand side DER
programs including a planned review of net energy metering (NEM) in 2019.
• Energy Storage – The CPUC Staff anticipates that a new rulemaking may be established to
address remaining and emerging policy issues for energy storage such as greenhouse gas
reductions, microgrids, and renewable integration. Additionally, Staff expects a new OIR on
implementing MUA for DERs could potentially open in 2019. The IOUs will file numerous
storage procurement application in 2019 for procurement related to Aliso Canyon, AB 2868108,
and local generation and transmission capacity needs. Finally, the CPUC will contract for an
evaluation framework and report on the California Storage Framework achievement of storage
goals.
• Interconnection Rule 21 – The Rule 21 Working Groups in 2019 will address: 1) planning,
construction, and billing of distribution upgrade issues, 2) application processing and review
issues, 3) smart inverter issues and coordination with the Integrated Distributed Energy Resources
proceeding, and 4) safety and environmental issues. Phases 2 and 3 of the Rule 21
Interconnection proceeding—addressing small and multi-jurisdictional utility rates and rate-
setting issues—will commence after those Working Groups finalize their recommendations.
• Smart Inverters – In 2019, smart inverter Phase 2 communications requirements and new
advanced functions will be mandatory for all inverter-based generation interconnecting under
Rule 21. Once activated, these functions could increase the amount of renewable generation that
the grid can accommodate without upgrades and will contribute to grid safety and stability.
Rulemaking 17-07-007 will consider operational requirements of smart inverters including rules
and procedures for adjusting smart inverter advanced functions via communication controls.
• Integrated Distributed Energy Resources (IDER) - In early 2019, PG&E will complete its
pilot for a competitive DER solicitation process. Energy Division will review and analyze the
Utilities Evaluation Report on the Competitive Solicitation Process and determine the success of
108 For the full text of AB 2868, please see the following link:
https://leginfo.legislature.ca.gov/faces/billTextClient.xhtml?bill_id=201520160AB2868.

California Smart Grid Annual Report to the Governor
and the Legislature 2018
32
the pilot. Energy Division will review each utility’s technology neutral pro forma contract
document which is intended to be used for future DER solicitations. The IDER proceeding will
complete record development work aimed at adopting non-RFO DER sourcing mechanisms
which intend to expand opportunities for cost-effective DER procurement for more near-term
distribution deferral opportunities and to streamline DER procurement in general.
• Transportation Electrification – As a result of the OIR issued in December of 2018, the CPUC
Energy Division will issue a staff proposal in mid-2019 for a Transportation Electrification
Framework that identifies the priorities for future IOU investment in this space. The framework
will be based on the transportation sector’s ability to support the state in reaching its greenhouse
gas reduction goals and air quality targets. The staff proposal will also discuss the intersection of
transportation with other efforts, including demand response, integrated resource planning, and
grid planning. In addition to the staff proposal, the CPUC is currently reviewing applications
from the IOUs to spend another approximately $1 billion on proposed infrastructure programs.
These efforts will continue into 2019.
• Demand Response - The Load Shift Working Group in Q1 2019 delivered a report proposing
possible market-oriented products to move flexible loads to periods of high renewable generation
to help integrate renewables, create savings by use of lower priced energy, and reduce greenhouse
gas emissions. The Energy Division will lead a stakeholder process in the first quarter of 2019 to
propose DRAM improvements to be considered by the Commission when it takes up the question
of next steps for DRAM. In the spring of 2019, the Commission will lead a stakeholder process
(to develop recommendations on whether (and how) battery controls should be included in the
Auto DR incentive program. The Commission will conduct a new proceeding to consider which
verification measures should be utilized to enforce the prohibition on the use of customer-owned
fossil fuel generators during DR events.
• Customer Data Access – In 2019, the Commission expects that the Click-Through
Authorization Process application proceeding will develop a record on improvements and
expansion of the click-through process that allows customers to share their data with a
third-party DER provider. The Commission may explore additional data access issues
that need resolution in 2019 as part of the Customer Choice Gap Analysis for planning for
customer DER adoption. Additionally, the utilities will issue a request for proposals in
2019 seeking a statewide rollout coordinator for the Energy Atlas, with work expected to
begin in 2020.

California Smart Grid Annual Report to the Governor
and the Legislature 2018
33
• General Rate Cases - The Commission will review PG&E’s 2019 GRC, which will include
several Grid Modernization-related proposed investments. The Commission will issue a final
Decision on SCE’s 2017 GRC which includes significant grid modernization requests.
• Wildfire Safety and Mitigation – Recent devastating wildfires led to heightened interest among
lawmakers, regulators, utilities, and the public in strengthening the utilities ability to reduce
wildfire risk through investments in safety and grid resiliency. In 2019, the Commission is
expected to issue one or more Decisions on the IOU Wildfire Mitigation Plans pursuant to Senate
Bill 901 (Dodd, Chapter 626, Statutes of 2018). The Commission is also expected to rule on
SCE’s Grid Safety and Resiliency application which seeks over $500 million of investments in
wildfire prevention and mitigation. The Commission is examining utility programs to de-energize
power lines in cases of dangerous wildfire conditions that public safety in R.18-12-005109.
4 Smart Grid Projects in California
4.1 Summary of IOU Activities in 2018
The State of California and the California IOUs continued to advance Smart Grid development
initiated in 2009 pursuant to SB 17110. Utility activities are reported in the Smart Grid Annual Reports,
which are filed by the IOUs each October, per D.10-06-047,111 and are organized into the categories
below:
• Customer Empowerment;
• Transmission and Distribution Automation/Utility Operations;
• Cyber and Physical Grid Security;
• Integrated and Cross-Cutting Systems; and
• Asset Management, Safety and Operational Efficiency.
109 Please see the following link for the R.18-12-005 OIR:
http://docs.cpuc.ca.gov/PublishedDocs/Published/G000/M251/K987/251987258.PDF. 110 Please see the following link for the SB 17 Bill text:
http://leginfo.legislature.ca.gov/faces/billNavClient.xhtml?bill_id=200920100SB17. 111 The names of the reports are as follows for SDG&E, SCE and PG&E respectively: “SDG&E Smart Grid
Deployment Plan 2018 Annual Report”, “Southern California Edison Smart Grid Annual Deployment Plan
Update”, and “Pacific Gas and Electric Company Smart Grid Annual Report – 2018.” All these reports can be
found on the CPUC website at: http://www.cpuc.ca.gov/General.aspx?id=4693.

California Smart Grid Annual Report to the Governor
and the Legislature 2018
34
The IOUs are required to report the monetary value of benefits derived from Smart Grid activities.
While the methodology for calculating benefits among the three Utilities has some variability, they all
calculate reliability benefits as the largest benefit of Smart Grid activities. In prior years each Utility
estimated their reliability benefits using a Value-of-Service reliability model developed by the Lawrence
Berkeley National Laboratory (LBNL). This model is used to determine reliability benefits by monetizing
reductions in customer minutes of interruption that are achieved through fault location isolation and
service restoration (FLISR) and other distribution automation technologies.112 While the IOU’s utilize the
same Value of Service Reliability model as the foundation for estimating their reliability benefits, their
estimated value of service measured by dollars per customer minute of interruption (CMI) differ from one
another. For instance, SCE estimates a value of $2.91 for avoided CMI which is slightly higher relative to
PG&E’s estimated $2.68 per avoided CMI. This difference is in part attributed to the different proportions
of various customer classes like commercial, industrial, residential, and agricultural classes that make up
the IOUs’ service territories.
Furthermore, the utilities have different methodologies for estimating the number of avoided outage
minutes that are obtained through smart grid technologies. As was shown on Table 1 on page 7, SCE
estimated 219 million avoided CMI for 2018, which is roughly three times higher than PG&E’s estimated
72.2 million avoided CMI, even though both utilities serve a similar number of customers in similarly-
sized service territories. Additionally, SCE’s avoided CMI figure is about 64 times higher than SDG&E’s
3.4 million CMI, but SDG&E is comparatively a much smaller utility relative to SCE.113 As a
consequence of SCE’s higher estimate for avoided CMI relative to the other IOUs, SCE’s calculated
reliability benefits are significantly higher than those recorded by SDG&E and PG&E. The costs and
112 FLISR is a software system integrated into the utilities’ outage management system that limits the impact of
outages by quickly opening and closing automated switches and reconfiguring the flow of electricity through a
circuit. By reconfiguring the flow of electricity, FLISR can minimize the number of customers impacted by an
outage and to isolate the outage to reduce restoration times. With FLISR, outages that may have been one- to
two-hours in duration can be reduced to less than five minutes. 113 According to SCE and PG&E, this is the result of different estimation methodologies for avoided outages. SCE
calculates their theoretical CMI for each circuit using modeling through a program called CYME and compares
this to the actual CMI for each circuit. SCE takes the difference between the two to obtain the avoided CMI
which can later be used to calculate the reliability benefit by multiplying by $2.91 per CMI. SCE assumes the
benefits of their distribution automation is available on all circuits that have distribution automation technologies
installed. On the other hand, PG&E obtains their estimated avoided CMI from their FLISR program based on
comparing to outage data from 2013 as a baseline. PG&E’s calculated difference represents their avoided CMI
from their smart grid technologies installed since 2013 and similar to SCE, this figure would be multiplied by
their cost per CMI ($2.68) to obtain PG&E’s estimated reliability benefit.

California Smart Grid Annual Report to the Governor
and the Legislature 2018
35
benefits shown in Table 1 on page 7 were accrued from July 1, 2017, to June 30, 2018, which is the
reporting period of the 2018 IOU annual update reports.
According to the IOUs, smart meter deployments continued to provide value during the reporting
period. The Utilities also reported benefits to customers, markets, and the utility from automation
projects. Environmental benefits related to the integration of renewable energy generation resources, both
centralized and distributed, as well as those related to electric vehicles were noted. Other identified
benefits relate to operational, reliability, and demand response/energy conservation. Smart Grid
investments continue to contribute to a safe, reliable, resilient, and sustainable grid.
1. Customer Empowerment
The IOUs consider the customer to be an integral part and prominent driver of the Smart Grid
program. They aim to provide customers with information such as energy usage, rates, energy
conservation, and peak-load reductions. Using this information, customers will be empowered to better
understand and manage their energy use and costs, including their use of time-variant rates. Applications
and tools are designed to meet customers’ evolving communication preferences and expectations. Projects
that deliver information, services, and control pursued by customers themselves and that enable demand
response, dynamic pricing, and HANs are included in this category.
2. Transmission and Distribution Automation/Utility Operations
Transmission Automation and Reliability (TAR) and Distribution Automation and Reliability (DAR)
projects improve the Utilities’ information and control capabilities on both the transmission and
distribution levels of the electric grid. TAR projects provide the wide-area monitoring, protection, and
control tools necessary to monitor bulk power system conditions, to safely and reliably incorporate utility-
scale intermittent power generation; and to prevent emerging threats to transmission system stability.
DAR projects similarly provide the ability to safely and reliably incorporate high penetrations of
distributed energy resources on the distribution level, including the increasing load of electric vehicles.
DAR projects also detect and isolate faults, provide “self-healing”114 benefits, and provide optimization of
voltage and reactive power to enhance power quality and to decrease energy consumption. TAR and DAR
help deliver a Smart Grid that has the infrastructure necessary to support the integration of demand
response, energy efficiency, distributed generation, and energy storage.
114 Self-healing benefits refer system reliability benefits derived from a network of sensors, automated controls, and
advanced software that utilize real-time distribution data to detect and isolate faults and to reconfigure the
distribution network to minimize the customers impacted.

California Smart Grid Annual Report to the Governor
and the Legislature 2018
36
3. Cyber and Physical Grid Security
Physical and cybersecurity investments are becoming more important as the communications and
control systems needed to enable Smart Grid capabilities increase in size and reach. These systems have
the potential to increase the reliability risks of the electric grid if the systems are not properly secured.
The security programs of the IOUs enhance security throughout the network to resist attack, and to
manage compliance and risk. Security is paramount to the full development, implementation, operation,
and management of the Smart Grid.
4. Integrated and Cross-Cutting Systems
Integrated and cross-cutting systems refer to activities that support multiple areas of utility operations
and may involve such systems as grid communications, data management and analytics, and advanced
technology testing. An integrated approach helps to ensure that the overall network is efficient and
delivers benefits across IOU operations and to customers. Integrated communications systems will
provide solutions to enable sensors, metering, maintenance, and grid asset control networks. Over the
long term, these systems will enable information exchange among IOUs, service partners, and customers
by way of secure networks. Advanced technology testing and standards certification are fundamental for
the Utilities to accommodate new devices from vendors. Workforce development and advanced
technology training will also be required to enable the successful deployment of new technologies and to
ensure that the IOUs are prepared to make use of emerging technologies and tools, which will maximize
the value of these technology investments.
5. Asset Management, Safety, and Operational Efficiency
This category enhances monitoring, operating, and optimization capabilities to achieve more efficient
grid operations and to improve asset management. These projects enable the Utilities to manage the
maintenance and replacement of the grid’s infrastructure on a health-basis rather than on a time-in-
service-basis, which should minimize critical equipment failure. This functionality also helps the IOUs
manage costs associated with maintaining and replacing equipment.

California Smart Grid Annual Report to the Governor
and the Legislature 2018
37
4.1.1 Advanced Metering Infrastructure Deployment
Table 4 Advanced Metering Infrastructure (aka Smart Meters) Rollout115 as of Oct. 2018116
IOU
Total Number
of Electric Smart
Meters (Millions)
Cumulative Electric Smart Meter
Opt-outs117
(No. of customers)
Percentage of
Opt-outs
Annual
Customer
Complaints
(escalated) 118
PG&E 5.40 47,967 0.88% 12
SDG&E 1.45 4,217 0.29% 0
SCE 5.12 22,972 0.45% 442
Total 11.97 75,156 0.63% 454
Source: IOU 2018 Smart Grid Reports and Data Requests
In 2007, with Commission approval, the IOUs began full deployment of Advanced Meter
Infrastructure, which was largely completed in 2013. Electric Smart Meter opt-outs refer to customers
who have either declined to adopt smart meters or returned to using analog meters. The percentage of opt-
outs relative to the total number of customer accounts with Smart Meters has remained less than one
percent for all the IOUs. Annual escalated customer complaints have decreased over the past year by 50,
or by 9.92 percent.
4.1.2 Utility De-energization
The State’s Investor Owned Utilities, PG&E, SCE, and SDG&E have general authority to shut off
electric power to protect public safety under California law, specifically California Public Utilities Code
Sections 451 and 399.2(a). This process is called de-energization or Public Safety Power Shutdown
(PSPS). This authority includes shutting off power if the utility reasonably believes that there is an
"imminent and significant risk" that strong winds may topple power lines or cause major vegetation-
related damage to power lines, leading to increased risk of fire.
115 These statistics only include data as reported by the State’s electric Utilities in the Smart Grid Annual Reports.
The State’s gas Utilities have also deployed millions of Smart Meters. 116 The reporting period was from November 1, 2017 to October 31, 2018. 117 Opt-out totals listed here are since the beginning of the Smart Meter programs. 118 Escalated complaints are customer complaints regarding smart meters that have gone through the complaint
process and reached resolution during the reporting period.

California Smart Grid Annual Report to the Governor
and the Legislature 2018
38
The State's utilities will de-energize electric facilities only during periods of extreme fire hazard and
only after weighing several criteria including fuel conditions, weather forecasts, and on the ground real-
time observations. As potentially hazardous conditions develop, the utilities will inform the CPUC,
California Governor's Office of Emergency Service (CalOES), and the California Department of Forestry
and Fire Protection (CAL FIRE) as well as local public safety authorities of the potential for a PSPS
event. Following these notices, the utilities will conduct outreach to impacted customers informing them
of the potential for a power shutdown via multiple channels. If the hazardous conditions continue to
develop the utilities will proceed with de-energizing electric facilities within the impacted area.
Following the weather event utility crews will inspect all de-energized lines and restore power to
impacted communities.
On July 12, 2018, the CPUC adopted rules to strengthen customer notification requirements before de-
energization events and ordered utilities to engage local communities in developing de-energization
programs. Additionally, the CPUC is working with the CalOES, CAL FIRE, and first-responders
throughout the state to address potential impacts of utility de-energization practices on emergency
response activities, including evacuations. The CPUC will continuously assess implementation of de-
energization programs by utilities, including performing a thorough review of de-energization events as
they occur.

California Smart Grid Annual Report to the Governor
and the Legislature 2018
39
4.2 Highlights of San Diego Gas & Electric’s (SDG&E) Smart Grid Deployment
This section provides information on SDG&E’s estimated expenditures and benefits realized during
the reporting period, and it highlights some of SDG&E’s projects.
Costs
Table 5 SDG&E’s Estimated Smart Grid Costs for Fiscal Year July 1, 2017 through June 30, 2018
Task Value
Customer Empowerment and Engagement $1,292,000
Distribution Automation and Reliability $54,031,000
Transmission Automation and Reliability $4,859,000
Asset Management, Safety and Operational Efficiency $25,546,000
Security $8,212,000
Integrated and Cross-Cutting Systems $1,978,000
Total Estimated Costs $95,918,000
Benefits
Table 6 SDG&E’s Estimated Smart Grid Benefits Realized for Fiscal Year July 1, 2017 through June 30, 2018
Benefit Value
Reliability Benefits $34,057,000
Physical and Cybersecurity Benefits $11,714,000
Customer Demand Response Benefits $610,000
Avoided Costs
(Operational, Capital, Environmental) $62,686,000
Total Estimated Benefits $109,067,000
Avoided Outage Minutes 3.4 Million
Highlights of SDG&E’s Smart Grid deployment update include:
• SDG&E saw significant growth in NEM distributed generation (DG) with residential and
commercial customers connecting nearly 21,000 new systems (primarily solar), bringing the total
number of interconnected DG systems interconnected to nearly 134,754;

California Smart Grid Annual Report to the Governor
and the Legislature 2018
40
• Customer energy storage deployments grew rapidly in the commercial/industrial sector and
additional growth is anticipated among residential customers as more products enter the market
and time-of-use rates go into effect;
• There are more than 110 MWs of energy storage connected to SDG&E’s local power grid (34
MW of which are customer-sited) including the world’s largest lithium-ion battery facility— AES
Energy Storage’s 30 MW lithium-ion energy storage facility in Escondido, Ca; and
• Plug-in electric vehicle penetration grew to nearly 30,000 vehicles, which is 4,100 more than the
previous year.
4.2.1 SDG&E Example Projects
• Demand Response Management System (DRMS) – The DRMS project enables integrated
management of SDG&E’s entire demand response portfolio. This includes program and device
management, forecasting, settlement, and analytics/reporting. In Phase 1 of the project, SDG&E
implemented functionality to send text messages, facilitate two-way demand response load
control, and send price signals to meter-connected HAN devices, and monitor device
connectivity. The second phase, which delivers DR post event settlement capabilities for the
capacity bid program and business reporting, began in Q3 of 2017 and was completed in July
2018. Additionally, SDG&E’s project team enabled wholesale market integration for both
programs in its portfolio and for third-party demand response providers.119 .
• Borrego Springs Microgrid – This project seeks to establish a microgrid demonstration at an
existing substation to evaluate the effectiveness of integrating multiple DER technologies, feeder
automation system technologies, and outage management system (OMS) to improve reliability
during outages. The most recent phase of this project enhanced the existing microgrid during the
reporting period by expanding the microgrid to the entire distribution substation. The Borrego
Springs Microgrid can island all three circuits out of Borrego Springs, which has a peak load of
14 MW and serves about 2,500 residential and 300 commercial and industrial customers.
Additionally, the DERMS controller was successfully deployed for the Borrego Microgrid during
the reporting period.
119 Enabling wholesale market integration for third-party demand response providers is also known as direct
participation demand response, which is described in Rule 32. Please see the following link for more
information: https://www.sdge.com/sites/default/files/elec_elec-rules_erule32.pdf.

California Smart Grid Annual Report to the Governor
and the Legislature 2018
41
• Advanced Distribution Management System (ADMS) – The purpose of this project is to
implement new functions within the new Outage Management System/Distribution Management
System (OMS/DMS) that were to enhance distribution grid management. In Phase 1 of the
project, SDG&E implemented OMS enhancements such as service alerts, an outage website, and
mobile improvements. Additionally, SDG&E developed enhanced DMS features for power flow
analysis, Fault Location Analysis, Feeder Load Management, Suggesting Switching, Fault
Location Isolation Service Restoration, and Volt/Volt Amperes Reactive (VAR)120. In Phase 2,
SDG&E focused on modeling and integrating DERs into the DMS to improve power flow
forecasts, to enhance functionality, and to provide visibility to the distribution operator of the
impacts these DERs present to the distribution grid. Phase 3 implemented functionalities that
provide optimal power flow results, the ability to view feeder load management results for any
device on the system and rolled out FLISR in automatic mode to the entire eligible SDG&E
service territory. In 2018, SDG&E implemented database and software upgrades for the network
management system, which included FLISR improvements, automated outbound customer call
interface for outages, a voltage read function for Smart Meters, and the inclusion of customer
history data.
• SCADA Expansion– For this project, SDG&E plans to install 300 SCADA line switches to have
an average of 1.5 switches on every distribution circuit. Additionally, SDG&E will install
SCADA at 13 existing substations. In 2018, SDG&E installed SCADA at the Carlton Hills
substation and has implemented SCADA capabilities at the Capistrano, Poway and Pendleton
substations. SDG&E also identified prospective substation sites for SCADA expansion at
Descanso, Rancho Santa Fe, and Warners substations, which are slated to be completed in 2019.
120 Volt Amperes Reactive (better known as VAR) is a unit of reactive power.

California Smart Grid Annual Report to the Governor
and the Legislature 2018
42
4.3 Highlights of Southern California Edison (SCE) Smart Grid Deployment
This section provides information on SCE’s estimated expenditures and benefits realized during the
reporting period, and it highlights some of SCE’s projects.
Costs
Table 7 SCE’s Estimated Smart Grid Costs for Fiscal Year July 1, 2017 through June 30, 2018
Task Value
Customer Empowerment and Engagement $13,117,000
Distribution Automation and Reliability $52,191,198
Transmission Automation and Reliability $0121
Asset Management, Safety and Operational Efficiency $1,452,574
Security $0122
Integrated and Cross-Cutting Systems $11,215,244
Total Estimated Costs $77,976,016
121 There were no active projects in this category during the reporting period. 122 The Common Cybersecurity Services (CCS) platform project was completed and deployed during the 2016
update reporting period.

California Smart Grid Annual Report to the Governor
and the Legislature 2018
43
Benefits
Table 8 SCE’s Estimated Smart Grid Benefits Realized for Fiscal Year July 1, 2017 through June 30, 2018
Benefits Value
Reliability Benefits123 $638,000,000
Physical and Cybersecurity Benefits N/A124
Customer Demand Response Benefits125 $10,800,000
Avoided Costs
(Operational, Capital, Environmental) $60,300,000
Total Estimated Benefits $709,100,000
Avoided Outage Minutes 219 Million
Highlights of SCE’s Smart Grid deployment update include:
• SCE received approval of a $356 million budget to build out its transportation electrification
infrastructure and has deployed a cumulative total of 941 charge ports at 60 customer sites (462
ports are in disadvantaged communities);
• SCE received approval of two new TOU rate periods to shift its current peak period for 3.3
million residential customers to incentivize them to shift their load to lower cost periods;
• SCE integrated most of SCE’s DR programs into the CAISO market and completed end‐to‐end
integration connectivity from the CAISO Automated Dispatch System down to a customer load
control device;
• SCE installed 357 remote control switches and 6 remote reclosers as part of its efforts to automate
distribution circuits, enhance overall system performance and reliability;
123 In past reports, this benefit was calculated based on Lawrence Berkeley National Laboratory’s Value-of-Service
(VOS) reliability model. In support of SCE’s 2018 GRC filing, SCE has changed how reliability improvements
are calculated that are achieved through distribution automation and how those improvements are valued through
updating its VOS estimates. The other utilities have not similarly updated their VOS estimates. The modified
approach indicates a significant increase in calculated reliability benefits relative to past reports. (Smart Grid
Annual Deployment Plan Update, p.8). As a disclaimer, this data point is shown as it was reported by SCE to the
CPUC. This method has not been vetted by the Commission and the CPUC cannot attest to its accuracy. 124 SCE’s pilot projects did not specifically track physical and cybersecurity costs and benefits. 125 According to SCE, “Demand Response benefits are specifically attributed to demand response enabled by Auto-
DR technology and controllable programmable communicating thermostats for SCE’s PTR-ET-DLC program.”

California Smart Grid Annual Report to the Governor
and the Legislature 2018
44
• SCE implemented distribution Volt/VAR control, in order to coordinate and optimize voltage and
VARs across all circuits fed by a substation, has been completed at 182 substations across SCE’s
service territory.
4.3.1 SCE Example Projects
• 3rd Party Smart Thermostat Program – SCE is working with some of the leading Internet-
connected smart thermostat vendors and system providers to enroll customers in a demand
response program that utilizes smart meter interval data. After the two-year study in 2013 and
2014, and after SCE started the Save Power Day program in June 2015, SCE had approximately
47,947 participants enrolled at the end of the 2018 reporting period and estimates reaching up to
130,000 enrollments by 2020.
• Residential TOU Default Pilot– SCE launched a TOU default pilot in December of 2017.
400,000 residential customers were randomly selected and assigned to one of two new TOU
default rates to test their behavior and retention. SCE launched communications in December
2017 that informed customers of the upcoming change, the potential bill impacts and provided
them with the options of (1) opting out for TOU altogether, (2) switching to another TOU option,
and (3) do nothing and were defaulted in March 2018. The findings will inform SCE as it
prepares for a full of residential TOU beginning in 2020. Findings thus far from the pilot and
survey data have shown that:
o Less than 1% of the defaulted customers have requested to go back to the tiered rate
structure.
o Customer awareness of TOU rate plans increased from 47% to 72%.
o Customer awareness of rate plan options increased from 35% to 41%.
o Customer awareness of being transitioned to a TOU rate increased from 40% to 49%.
• Circuit Automation – SCE began this program in order to automatically or remotely restore
power to customers after outages caused by faults and to minimize the impact on customers of
outages that occur in the ordinary course of business. During the 2018 reporting period, SCE
installed 357 remote control switches, 6 remote sectionalizing reclosers, and spent $13.7 million.
• Charge Ready Program – The Charge Ready Program is an initiative to deploy electric vehicle
charging stations at locations where EVs will be parked for four or more hours, such as multi-
family dwellings, workplaces, fleet parking, and destination centers. SCE also conducts market
education to develop awareness of EVs and their benefits to the grid. As of November 2018, SCE

California Smart Grid Annual Report to the Governor
and the Legislature 2018
45
had 79 sites and 1,280 charge ports committed for overall deployment, and about one-third of
these charge ports are located in disadvantaged communities.
4.4 Highlights of Pacific Gas & Electric (PG&E) Smart Grid Deployment
This section provides information on PG&E’s estimated expenditures and benefits realized during the
reporting period, and it highlights some of PG&E’s projects.
Costs
Table 9 PG&E’s Estimated Smart Grid Costs for Fiscal Year July 1, 2017 through June 30, 2018
Task Value
Customer Empowerment and Engagement $41,429,000
Distribution Automation and Reliability126 $53,450,000
Transmission Automation and Reliability $64,300,000
Asset Management, Safety and Operational Efficiency $9,300,000
Security $5,560,000
Integrated and Cross-Cutting Systems $21,635,000
Total Estimated Costs $195,674,000
Benefits
Table 10 PG&E’s Estimated Smart Grid Benefits Realized for Fiscal Year July 1, 2017 through June 30, 2018
Benefits Value
Customer Reliability Benefit127 $193,500,000
Customer Demand Response Savings $255,100
Avoided Costs
(Operational, Capital, Environmental128) $3,200,000
Total Estimated Benefits $197,000,000
Avoided Outage Minutes129 72.2 million
126 This figure includes $238.8 Million for the Distribution Substation SCADA program incurred since program
inception. $44.8 Million were incurred during the reporting period. 127 PG&E’s customer reliability benefits are derived from calculating the monetary benefits from avoided customer
outage minutes that were achieved through its FLISR program. 128 For details on PG&E’s Environmental developments, please see PG&E’s Corporate Sustainability Report at:
http://www.pgecorp.com/corp/responsibility-sustainability/corporate-responsibility-sustainability.page.

California Smart Grid Annual Report to the Governor
and the Legislature 2018
46
Highlights of PG&E’s Smart Grid deployment update include:
• PG&E’s Electric Program Investment Charge (EPIC) 3 portfolio includes technologies that will
be able to promote grid adaptation to a changing climate and increased wildfire threats;
• Smart Meter outage information improvement reduced an estimated 8,000 “truck rolls”130 and
saved PG&E over $600,000 over the reporting period;
• Enhancing technology capabilities to improve wide-area monitoring, protection, and control
enabled by supervisory control and data acquisition (SCADA) equipment in the transmission and
distribution systems;
• Increasing customer awareness and engagement in managing their energy use, such as through
providing nearly 55,000 EV customers with a time-of-use rate schedule to encourage off-peak
charging;
• Improving PG&E’s capabilities to effectively anticipate, prevent, and respond to a new and
emerging class of cyber and physical threats to the grid.
4.4.1 PG&E Example Projects:
• Distribution Supervisory Control and Data Acquisition (SCADA) Program – This program
is focused on increasing SCADA penetration in the distribution system and improving reliability
for PG&E’s customers. PG&E’s goal is to achieve 100 percent visibility and control over all
critical distribution substation breakers by 2019 through adding or replacing SCADA for
approximately 560 substations and 1,930 breakers. By the end of the 2018 reporting period, the
project had upgraded SCADA in 432 substations and 1,670 breakers.
• Modular Protection Automation and Control (MPAC) Installation Program – This program
aims to deploy pre-engineered, fabricated, and standardized control buildings in transmission
substations. These MPAC upgrades are performed in conjunction with other PG&E transmission
substation upgrade projects such as business conversions, control center consolidation efforts, and
aging asset replacement. As of 2018, PG&E has installed and completed 112 MPAC buildings.
129 The avoided outage minutes are calculated based on customer interruption minutes that were saved as a result of
FLISR technologies. 130 Truck roll refers to a utility dispatch of technicians to investigate electrical equipment during an outage.

California Smart Grid Annual Report to the Governor
and the Legislature 2018
47
• Time Varying Pricing – This program, which includes TOU, peak-day pricing and SmartRate, is
intended to charge customers different rates based on varying system conditions to more closely
align retail and wholesale electricity generation costs and incentivize customers to shift their
energy use to lower cost periods of the day. PG&E administers time varying pricing rates to all
PG&E bundled residential and non-residential customer classes. Peak-day pricing provides
between 25-40 MW of load reduction during the hottest days, which is equal to the generation of
about two peaker plants. As of July 2018, 113,000 residential customers have enrolled in the
SmartRate program, which provides an additional 20-25 MW of load reduction on event days.
Furthermore, over 439,000 small to medium business service agreements have transitioned to
TOU rates of the past 6 years and 160,000 actively participate in the peak day pricing program.
• Electric Vehicle Infrastructure – This program is a three-year pilot designed to enable the
deployment of make-ready infrastructure131 to support up to 7,500 EV level-2 charging ports
located primarily in workplaces and multi-family housing. PG&E launched the program in
January 2018 and received 256 applications for the program by the end of June 2018. At the close
of Q2 2018, 56 sites for charging ports had been approved and moved into final design and
preconstruction phases (including 3 which have completed construction and are fully
operational). PG&E installed 80 ports by the end of the reporting period and is conducting
solicitations for EV chargers.
131 Make-ready refers to the utility making the infrastructure ready for third parties to build out the charging stations
themselves. This entails the trenching, installation of conduit and electrical wire, pulling of wires, installing
concrete installation bases (if needed), potential upgrades of existing electrical infrastructure including panel
additions and transformer replacement, landscape removal, paving, and guard post installation.

California Smart Grid Annual Report to the Governor
and the Legislature 2018
48
5 Conclusion
The Smart Grid policies pursued by the State of California and implemented by the State’s
Utilities continue to generate benefits for California ratepayers. Based on the Utilities’ estimates in
their 2018 smart grid reports, the programs and projects the Utilities have implemented have realized
over $1 billion in benefits in Fiscal Year 2017-2018. However, California still has more to do to
realize the vision of a smart and modern grid that is prepared to meet California’s ambitious energy
and climate goals, as well as the challenges posed by the increasing cyber security threats and risk of
wildfires and other extreme weather events. This will require the coordination of the CPUC and the
electric IOUs to invest further in grid automation, grid hardening, and cybersecurity, smart inverters
as well as increase the penetration of distributed energy resources such as electric vehicles, demand
response, and energy storage. By fulfilling the vision of the DER Action Plan, the CPUC will help
move California towards a sustainable, affordable, efficient, and effective grid of the future. With its
rich tradition of entrepreneurship, technological innovation, and forward-looking regulation,
California will continue to lead the nation in Smart Grid development and deployment.
Top Related