


Languages
Pages
Legal


Ebro CAGE 18 March
2014

1. Introduction
1.1 Ebro today 1.2 Growth model 1.3 Financial model
2. Key Drivers
2.1 Our brands and R+D+I+M 2.2 Intelligent organic and inorganic
growth 2.3 Significant sourcing capacity and
industrial optimisation
3. Conclusion
4. Corporate calendar 2014
5. Disclaimer

1. Introduction

1.1 Ebro today
Ebro Foods is a centenary company with a market capitalisation of EUR 2.5 billion, turnover of EUR 2 billion, EBITDA of EUR 286 million* and a Net Profit of EUR 133 million in 2013. The company has radically changed over the past decade with a strategic plan through which we have:
Pulled out of our original core businesses, sugar and dairy Entered rice (leader) and pasta (2nd producer worldwide) Developed related categories (fresh pasta, sauces…) Become more international
We have also succeeded in converting basic markets with small profit margins into businesses with attractive margins by:
Focusing on innovation and constant development Strongly supporting our principal asset, brands Efficient portfolio management, growing in profitable references and shedding those with a smaller yield Aggressive cost-cutting plan, accompanied by restructuring and optimising industrial facilities Diversification of sourcing, e.g. Thailand, Egypt, India, Morocco, etc.
With a lean, cost effective, flexible, agile structure, Ebro is able to adapt successfully to the circumstances of each market and make fast, effective decisions.
*includes Birkel

1.2 Ebro’s Growth Model
Our growth strategy is a continuous flow, in which:
We operate in categories that we control, expanding geographically with a global ambition. We compete in commodity markets requiring a high level of innovation and efficient raw material management. This pushes us to develop new products and even enter new categories.
1.3 Ebro’s Financial Model
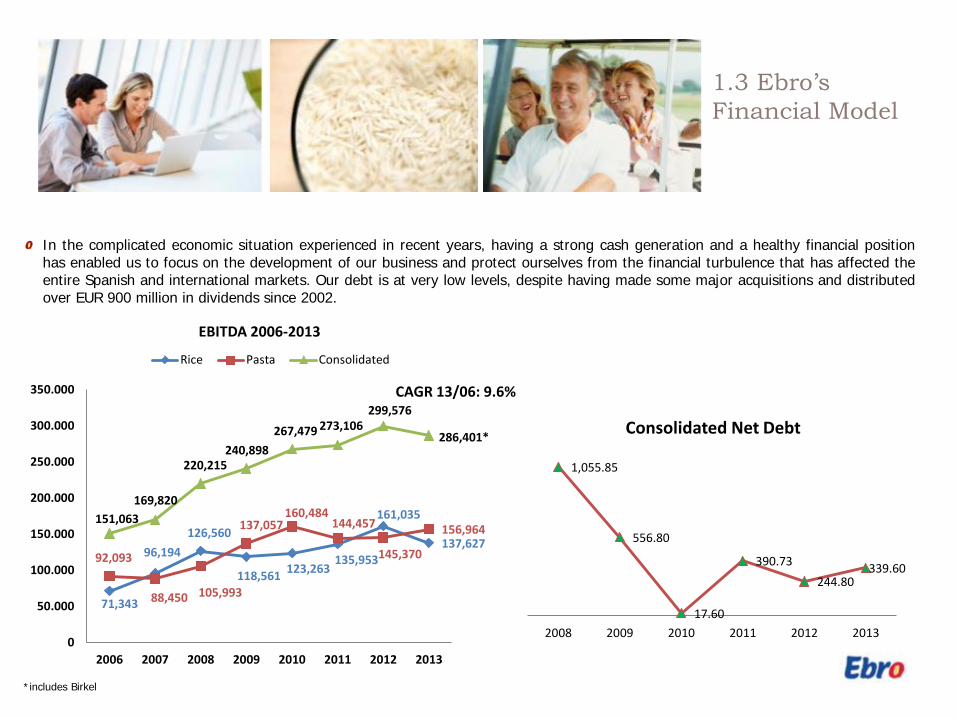
CAGR 13/06: 9.6%
In the complicated economic situation experienced in recent years, having a strong cash generation and a healthy financial position has enabled us to focus on the development of our business and protect ourselves from the financial turbulence that has affected the entire Spanish and international markets. Our debt is at very low levels, despite having made some major acquisitions and distributed over EUR 900 million in dividends since 2002.
1,055.85
556.80
17.60
390.73 244.80
339.60
2008 2009 2010 2011 2012 2013
Consolidated Net Debt
71,343
96,194 126,560
118,561 123,263 135,953
161,035
137,627 92,093
88,450 105,993
137,057 160,484
144,457
145,370
156,964 151,063
169,820
220,215 240,898
267,479 273,106 299,576
286,401*
0
50.000
100.000
150.000
200.000
250.000
300.000
350.000
2006 2007 2008 2009 2010 2011 2012 2013
EBITDA 2006-2013
Rice Pasta Consolidated
*includes Birkel

2.Key Drivers

KEY DRIVERS
BRAND R+D+I+M
A balanced organic
and inorganic growth strategy
SOURCING NETWORK
2. Key drivers

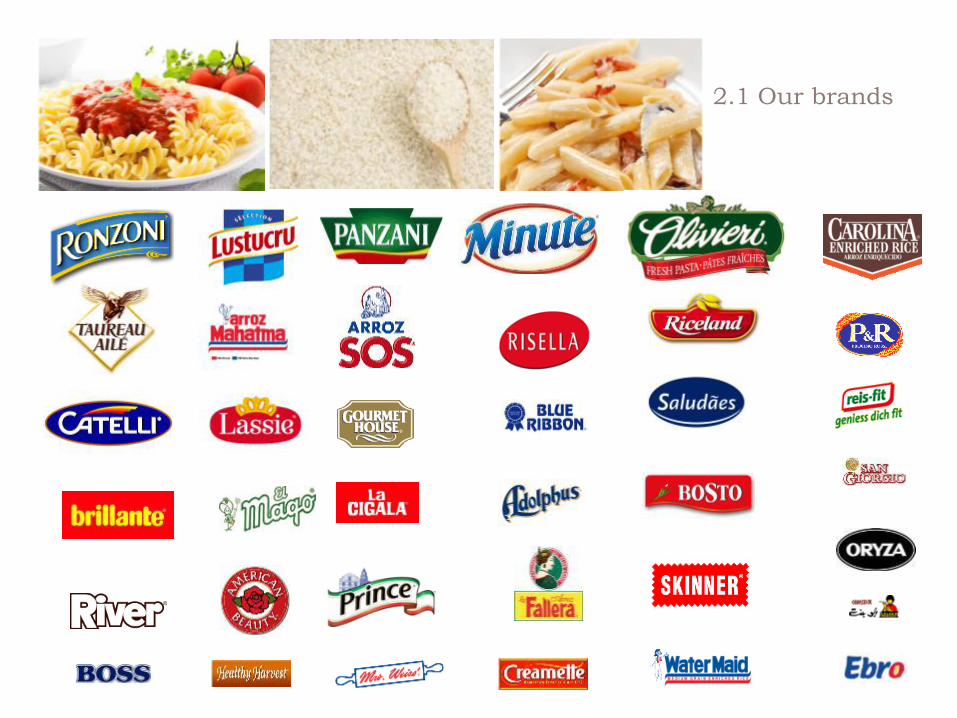
Our brands are our most valuable asset and the basis of our business: they act as a barrier to the entry of rivals while generating value and growth for the group. We operate 65 leading brands and have invested around EUR 1 billion in marketing and advertising them over the past decade. These brands represent, lead and direct consumer trends.
2.1 Our brands

Although we have a significant presence in a large number of countries, Ebro currently operates mainly in the western world. There is an opportunity to export the Ebro model to other parts of the world.
2.1 Our brands
2.1 Our brands
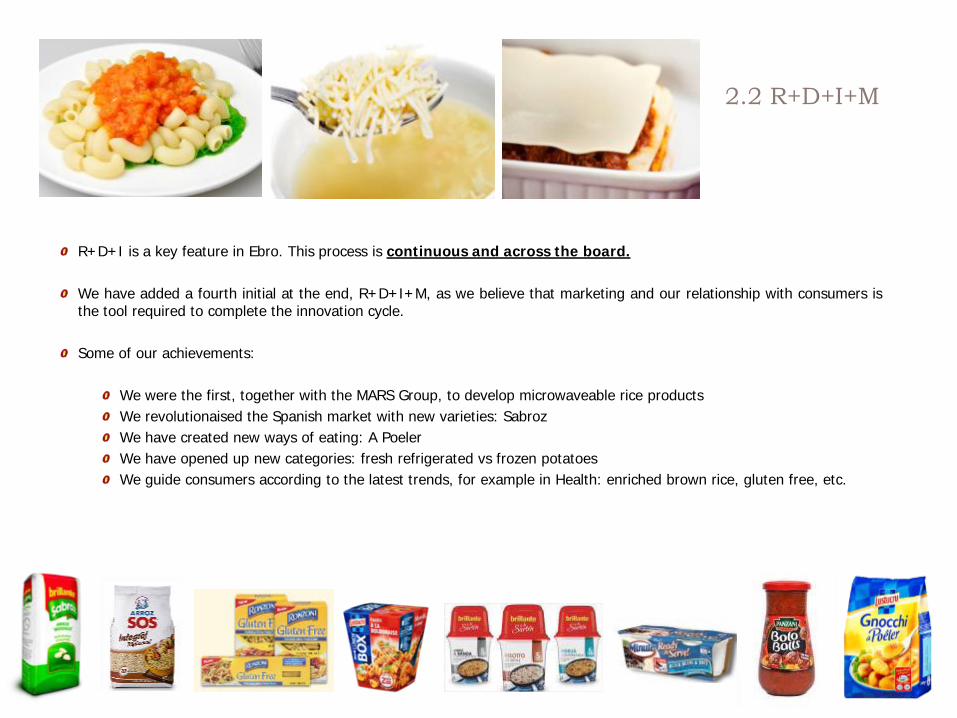
R+D+I is a key feature in Ebro. This process is continuous and across the board. We have added a fourth initial at the end, R+D+I+M, as we believe that marketing and our relationship with consumers is the tool required to complete the innovation cycle. Some of our achievements:
We were the first, together with the MARS Group, to develop microwaveable rice products We revolutionaised the Spanish market with new varieties: Sabroz We have created new ways of eating: A Poeler We have opened up new categories: fresh refrigerated vs frozen potatoes We guide consumers according to the latest trends, for example in Health: enriched brown rice, gluten free, etc.
2.2 R+D+I+M

Ebro has been built up with the idea of becoming world leader in Rice and Pasta. With this aim in mind, we have made a number of investments ( ≅ EUR 2.3 billion) and divestments (≅ EUR 1.7 billion) over the past 10 years, to get where we are today, with two perfectly consolidated platforms from which we study the different channels of growth, both organic and inorganic. When we take a position in a new market, whether through acquisitions or starting from scratch, we apply our Know-how and Expertise in the businesses to take them to the limit in terms of yield and profitability.
14 MEUR 18MEUR
362 MUSD
280 MUSD
120 MCAD
2.3 Intelligent, balanced organic and inorganic growth

Some clear examples of the success of this strategy on which we focus include:
Our growth on mature markets with highly consolidated brands is focused on the purchase of leading brands very well established on the market, through which we can develop all the know-how that sets us apart from the rest and enables our businesses to achieve margins which are difficult to reach in this sector. If we enter markets where there is no well-established local brand, we develop our strongest brands from scratch, as we did with Panzani in the Czech Republic. Our latest acquisitions include two clear examples of:
Inorganic growth, Strom Products (No Yolks and Wacky Mac) and Olivieri, which were acquired to incorporate them in our American businesses and make them grow. Organic growth, the purchase of the rice plant in India. This purchase enables us not only to guarantee supplies of Basmati rice to our subsidiaries, but also to study the development of the local business.
2005 2009 2013
32
81 92 Ebitda $
US PASTA BUSINESS
CAGR 13/05: 14.1%
2.3 Intelligent, balanced organic and inorganic growth
2005 2009 2013
59 76 86
Ebitda €
PASTA EUROPE & REST OF THE WORLD
CAGR 13/05: 4.8%
2005 2009 2013
31
83 90 Ebitda $
US RICE BUSINESS
CAGR 13/05: 14.3%

Thanks to our huge supply capacity, we have larger margins than any other company in the sector. The profit margins that can normally be expected in commodity businesses such as rice and pasta are not very great. But in Ebro we have posted EBITDA margins of 13-17%. Through our industrial presence we are able to obtain supplies practically anywhere in the world, which gives us greater flexibility in respect of raw material purchase prices. We have industrial rice facilities in USA, UK, Spain, Portugal, Denmark, The Netherlands, Belgium, Italy, Morocco, Egypt, Thailand and recently in India, with the purchase of a plant in 2013 in the best Basmati-producing area. Our Industrial pasta facilities are in Canada, USA and France.
2.4 Major supply capacity and industrial optimisation

2.4 Major supply capacity and industrial optimisation

KEY DRIVERS
BRAND
R+D+I+M
Balanced organic
and inorganic growth strategy
SOURCING NETWORK
2. Key Drivers
Our most valued asset
We distinguish ourselves
We consolidate our leadership
Our expertise makes us unique
3. Conclusion
3. Conclusion
After 13 years of changes and restructurings, the company is now at a point where:
We are the first world leader in rice to be present in practically all geographical regions of the world, with capacity to continue growing, both organically and inorganically in the other areas of interest in which we are not yet present.
In pasta our excellent positioning makes us the second pasta producer worldwide with leading brands, and there are still numerous geographical regions to overlap with rice and many related categories to develop (fresh pasta, sauces, potatoes, etc.).
There are still major growth opportunities open to us, through our extensive range of products, which is not established equally in all markets, or by improving our geographical mix, where we have important, attractive alternatives.

2 April Four-monthly payment of ordinary dividend (0.125 EUR/share)
26 February Presentation 2013 full year results
29 April Presentation Q1 results
2 July
30 July
Four-monthly payment of ordinary dividend (0.125 EUR/share)
2 October Four-monthly payment of ordinary dividend (0.125 EUR/share) 30 October Presentation Q3 results and outlook 2015
Presentation H1 results
22 December Payment of extraordinary dividend (0.125 EUR/share)
Corporate Calendar Ebro maintains its commitment to transparency and reporting during 2014 and, accordingly, we announce our Corporate Calendar for the year:

To the best of our knowledge, the estimates contained in this presentation on the future growth of the different businesses and the overall business, market share, financial results and other aspects of the company’s operations and position are accurate as at the date hereof. All the figures set out in this report are calculated according to the International Accounting Standards (IAS). This presentation includes forward-looking statements which represent expectations and beliefs concerning future events that involve risks and uncertainties which could cause actual results to differ materially from those currently anticipated. Analysts and investors should not rely exclusively on these estimates, which are valid only at the date of this presentation. Ebro Foods does not undertake any obligation to update or supplement any forward-looking information as a result of new information, future events or circumstances occurring after the date of this presentation, including, though by no means limited to, changes in the Ebro Foods businesses or in its acquisitions strategy, or to reflect unforeseen events. Analysts and investors are advised to consult the company’s Annual Report and the documents filed with the authorities, especially the National Securities Market Commission (CNMV). The main risks and uncertainties affecting the Group activities are described in Note 28 of the Consolidated Annual Accounts as at 31 December 2012 and the corresponding Directors’ Report, which are available on our web site www.ebrofoods.es. In our opinion there have been no material changes during the year. The Group is exposed to a certain extent to the situation on commodity markets and the possibility of passing any price changes on to consumers. It is also exposed to fluctuations in exchange rates, especially of the dollar, and interest rate variations.
Disclaimer
Top Related