


Languages
Pages
Legal


WhitepaperBusiness Case for Connected
Insurance Ecosystem
Author: Ch�stopher Fernandes, Rodney David, Sanghamitra Paul

-
Synopsis
Analysis and Background
Driving Change
Opportunity and Application of using Sensors
Conclusion
About the Authors
1 .
2 .
3 .
4.
6 .
7.
3
4
6
12
14
15
Contents

SynopsisInsurance as an industry has been impacted by consumer behavior like what is being witnessed in Banking
and Retail industries. The NAIC (National Association of Insurance Commissioners) data on written premium
indicates that there is a slowdown in insurance premium collections. The pattern clearly suggests shifts in
buying behaviors on the personal and commercial insurance side fueled by easier access to data and how
goods and services are consumed by people all over the world. Changing population trends have also
impacted some of this with a visible slowdown in population growth. While the traditional sources of historic
data have long been relied on for product design and go to market strategies, access to data via sensors in
different areas of the insurance life cycle have opened a new avenue for product design shifting the
attention from pure risk transfer to elements of risk mitigation and risk prevention. For the newer insurance
entrants that do not carry the legacy of old transactional systems, a connected ecosystem presents a bigger
opportunity. Riding this wave of technology proliferation traditional insurance carriers have started also
exploring IoT connected sensors as packaged offerings outside of the typical telematics product bundles,
exploring opportunities in property, specialty areas and workers comp.
The data collected as part of this new wave of products being rolled out will set the stage for new product
categories that are priced competitively and can change pricing dynamically in response to market situations
triggered by usage or natural events. In addition to pricing, the process of underwriting and claims
notification are also going to be areas getting impacted by the entry of sensors. These devices could
potentially be connected to the backend systems of insurance carriers feeding real time data, this could be
information that in today’s world is typically updated after the fact or by human operators. The business use
cases are evolving and in the next few years’ carriers and insurance tech companies are poised to shape the
future of an ecosystem of connected devices that will make the selection, pricing and underwriting of risk
change in ways we are only beginning to learn.
The ecosystem of connected devices will provide insights to predict a future that most insurance carriers did
not have the infrastructure to foresee a few decades ago. Today, sensors present an opportunity to manage
and prevent risks in an ecosystem, giving it a whole new dimension.
In this white paper, we discuss how IoT-connected devices in a Connected Insurance Ecosystem, can be
leveraged for risk analysis. We will also highlight how data from different sources can be used for analysis and
decision making, with insights based on current information vs historic experience.
1
L&T Infotech Proprietary 03 / 15
Business Case forConnected Insurance Ecosystem

Analysis and BackgroundThe industry’s approach to ‘risk’ has been relatively unchanged since the very beginning. Simplistically put,
the model has leveraged the concept of risk transfer, coupled with the application of math of probability on
historical data sets. At the heart of any insurance product, the fundamental model has stood the test of time,
and this has worked in the absence of devices that can provide real-time data, in an infrastructure hosted
outside the insurance provider’s network.
Times have changed and technology has evolved to the point where we have the infrastructure, and the
means to capture data pertaining to usage, movement and various other external factors that are pertinent
to the entire risk that an insurer maybe covering. From time immemorial outside of flight, Man’s strongest
desire has been to be able to predict the future. The entire insurance industry has thrived on historic data,
and the ability to calculate the probability of an event occurring based on the historic experience. An
ecosystem with connected sensors, presents a situation where predicting the future is possible with eyes,
ears and insights into the risk covered by the insurance carrier.
IoT-connected devices for the purposes of this white paper fall under the following broad categories.
2
L&T Infotech Proprietary 04 / 15
DataCollection
DataAnalysis
DecisionPoints
RiskManagement
Water Pressure,Leakage,Quality
HVAC -Humidity,Ventilation, Air QualitY
Electric Meters, Supply,Fluctuations inVoltage
Accelerometers,gyroscopic
Fire Sprinklers Systems,Alarms
Location Monitoringsensors for
Sensor data
Demographic Info
Historic Experience
Third party info
Custom view byRisk Class
Trend Analysis
Calculated Metrics
Risk AssessmentAlgorithms
Roles based Persona’s
Scoring Frameworks
Recommendations
On going Updates
Outcome BasedRisk Assessment
Competitive productpricing
Predictive analysis
Claims Monitoring
Reporting Thresholds
Product performancemonitoring
01
02
03
04
05
06
Business Case forConnected Insurance Ecosystem
( GPS enabled withVideo & Audio Capability)

L&T Infotech Proprietary 05 / 15
We foresee the evolution of a connected ecosystem under these six broad categories of devices, which will
fuel data analysis of sensor data with a flavor of demographic info, historical experience and third- party data.
This data can be consumed by complex algorithms forecasting trends and providing insights at the most
granular level of Risk classes. This can happen under a coverage or sub coverage as defined in marketable
products sold by an insurance carrier.
This paradigm shift will be visible in a more responsive risk assessment model, where the calculation metrics
and the risk assessment algorithms will help experts assess and price insurance products. They can use
scoring frameworks in a manner, where the pricing updates can be done in an ongoing manner based on
the sensor data that is collected.
The results of this change in decision points will be witnessed with outcome-based risk assessment and
added benefits of competitive pricing and predictive analytics, that would be closer to the actual experience.
In cases where risk prevention is not a possible outcome, the sensors could serve as recording tools for event
data or real-time product monitoring validating assumptions used for product pricing or definition.
In a study from the National Insurance Crimes Bureau, the average cost of water damage claims was $6965,
with the maximum being as high as $ 26,285 for a single itinerary in a claim for the calendar year of 2015.
However, the count of claims was 1.3 Million for the same period. This translates to roughly 9 Billion plus of
water damage losses alone. Even a 5 to 10 % change in this number, would leave a significant impact. If you
go with a rough estimate of $2000 per incident the investment in sensors would pay for itself, and still
provide additional savings if amortized over a 3 to 5 year period.
Water Damage Counts in 2014 & 2015
January February March April May June July August September October NovemberDecember
0
50,000
100,000
150,000
200,000
250,000
204
,581
1,4
0,4
22
1,32
,753
1,0
9,79
6
1,0
9,79
699
,412
1,12
,269
1,11
,34
5
1,4
0,4
22
1,11
,593
1,13
,04
51,
30,7
61
1,18
,711
1,0
9,59
5
1,25
,793
1,0
7,78
5
1,0
3,73
41,
02,
582
1,17
,868
88,2
23
81,6
94 1,0
3,4
85
91,9
86
90,8
84
Business Case forConnected Insurance Ecosystem

L&T Infotech Proprietary 06 / 15
The Average cost of a repair caused by avoidable circumstances or human negligence pays for the cost of sensor instillations. Water
Damage Facts: Insurance Industry Research from Market Intelligence Reports published by National Insurance Crimes Bureau
D�ving changeMarket leaders are poised to drive this change fueled by one, some or all these reasons:
3
Economic Drivers
Historically, investment earnings were an easy fallback for insurance carriers, and the prospect of a growing
client base to fuel future income was the ray of hope in the midst of catastrophic losses. All this worked just
fine in the 80s-90s, but times are changing and investment incomes are not as lucrative and regulations are
dampening any possibilities to realize massive investment growth.
Average cost of Water Damage
Water Heater…
Frozen Pipe Related Failures
Bathroom Fixtures
Washing Machine Failure (Unoccupied Homes)
Appliance leaks (Overall)
Faulty Plumbing
Flooded House (9-10 inches of water)
Flooded House (18 inches of water)
Water Heater (Valve Failures)
Washing Machine Failures (Occupied Homes)
Water Heater (Supply Line Failures)
Flooded House (1-4 inches of water)
$0 $10,000 $20,000 $30,000
$3,642
$4,218
$4,959
$5,825
$7,800
$8,189
$10,799
$12,308
$13,467
$17,250
$18,930
$26,285
Business Case forConnected Insurance Ecosystem
4,34,058
L&T Infotech Proprietary 07 / 15
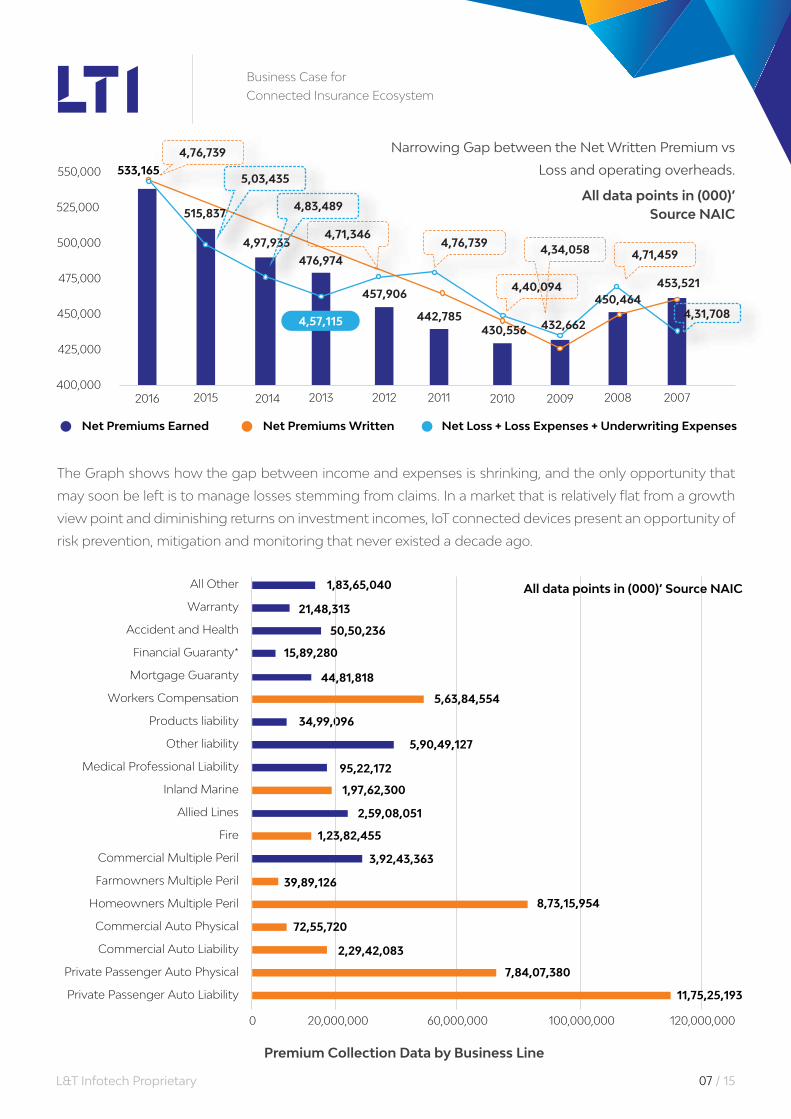
The Graph shows how the gap between income and expenses is shrinking, and the only opportunity that
may soon be left is to manage losses stemming from claims. In a market that is relatively flat from a growth
view point and diminishing returns on investment incomes, IoT connected devices present an opportunity of
risk prevention, mitigation and monitoring that never existed a decade ago.
Narrowing Gap between the Net Written Premium vs
Loss and operating overheads.
All data points in (000)’Source NAIC
Business Case forConnected Insurance Ecosystem
Premium Collection Data by Business Line
Fire
All Other
550,000
525,000
Warranty
Accident and Health
Financial Guaranty*
Mortgage Guaranty
Workers Compensation
Products liability
Other liability
Medical Professional Liability
Inland Marine
Allied Lines
Commercial Multiple Peril
Farmowners Multiple Peril
Homeowners Multiple Peril
Commercial Auto Physical
Commercial Auto Liability
Private Passenger Auto Physical
Private Passenger Auto Liability
0 20,000,000
44,81,818
34,99,096
95,22,172
1,97,62,300
2,59,08,051
3,92,43,363
2,29,42,083
60,000,000 100,000,000 120,000,000
1,83,65,040
21,48,313
50,50,236
15,89,280
5,63,84,554
5,90,49,127
1,23,82,455
39,89,126
8,73,15,954
72,55,720
7,84,07,380
11,75,25,193
All data points in (000)’ Source NAIC
500,000
475,000
425,000
450,000
400,0002016 2015 2014 2013 2012 2011 2010 2009 2008 2007
4,97,933
476,974
457,906
442,785
453,521
Net Premiums Earned Net Premiums Written Net Loss + Loss Expenses + Underwriting Expenses
430,556
4,76,739
4,76,739
4,40,094
4,71,459
4,31,708
4,71,346
5,03,435
4,83,489
432,662
450,464
533,165
515,837
4,57,115

L&T Infotech Proprietary 08 / 15
This Graph highlights the Lines of business we have identified based on written premium data, that presents
a great opportunity for the application of IoT-connected devices to monitor, prevent or mitigate risk.
• Sensors can be used for incentivizing new business targeting more technology savvy customer group in
the Private auto group, which represents over 190 Billion in Written Premiums
• The Written premium by Line of business for the calendar year of 2015
• This represents the list of key lines of business, where risk management services can help in increasing the
profitability
• The maturity of these lines of business with reference to carrier collected data and third-party data, makes
these lines candidates for having a pilot to deploy sensors
• Data collected from the sensors can be leveraged for better pricing
The next 5 years are bound to see the influx of self-driving autonomous cars. How this will impact the
Personal auto segment that represents over 190 Billion dollars of written premium remains to be seen.
The commercial fleet and Commercial auto segments have already started seeing impacts of disruptive
technology. And as the proliferation of connected cars, and cities, gains momentum this segment that is a
big contributor to the written premium will see a tectonic shift from Risk transfer, to smarter risk control
Business Case forConnected Insurance Ecosystem
Applicability of Sensors to Business Line based on Risk Exposure
Private Passenger Auto Liability 117.5
78.4
23
7
3
87
12
19
Private Passenger Auto Physical
Commercial Auto Liability
Commercial Auto Physical
Farm owners Multiple Peril
Homeowners Multiple Peril
Fire
Inland Marine
56Workers Compensation
Line Of BusinessWritten
Premiumin bn Appx. 2015
WaterPressure/
Leakage/ Quality
HVAC-Humidity,Ventilation,Air quality
ElectricMeters Supply
Fluctuations in Voltage
Accelero-meter
gyroscopic
Fire Sprinkler Systems,
Alarms
Location Monitoring
sensors for Equipment
Weak to Strong

L&T Infotech Proprietary 09 / 15
Demographic Drivers
The most interesting data points are on Net premium data collected State wise. Close to 39% of all collection
are from the top 5 states. This clearly indicates that in order to validate any hypothesis, the sensor data from
a few states can be used to validate product pricing definition and associated benefits of a sensor roll out,
before making any attempts of a country wide roll out.
Texas 4,82,21,695New York 4,24,94,444
20,000,000
New
Jers
ey
40,000,000
60,000,000
80,000,000
New
Mex
ico
New
Yor
kN
orth
Car
olin
aN
orth
Dak
ota
Ohi
oO
klah
oma
Ore
gon
Penn
sylv
ania
Rhod
e Is
land
Sout
h C
arol
ina
Sout
h D
akot
aTe
nnes
see
Texa
sU
tah
Verm
ont
Virg
inia
Was
hing
ton
Wes
t Virg
ina
Wisc
onsin
Business Case forConnected Insurance Ecosystem
initiatives fueled by insurers and auto makers alike and the lines of separation will continue to disappear. As
auto makers like Tesla see market opportunity in insurance with their smart cars, the remainder of the auto
industry will also take queue.
0
20,00,000
40,00,000
60,00,000
80,00,000
100,00,000
120,00,000
140,00,000
160,00,000
180,00,000
200,00,000
Source: Automakers & ANDC YTD is for first 4 months of 2017
169,
58,5
63
174,
10,3
20
17,1
77,4
45
16,8
48,
180
54,
61,8
82
175,
39,0
52
174,
70,6
59
165,
31,0
70
155,
82,13
6
144,
92,3
98
127,
78,8
85
115,
89,8
44
104,
31,5
10
132,
45,7
18
161,
54,0
54
165,
60,9
89
169,
97,2
03
169,
13,3
51
166,
75,6
48

L&T Infotech Proprietary 10 / 15
California, 67,423,426
Florida, 44,143,145
illinois, 23,732,508
20,000,000
Illini
os
Indi
an
40,000,000
60,000,000
80,000,000
20,000,000
Low
a
Kans
as
Kent
ucky
Loui
siana
Mai
ne
Mar
ylan
dM
assa
chus
etts
Mic
higa
nM
inne
sota
Miss
isipp
iM
issou
riM
onta
naN
ebra
ska
Nev
ada
New
Ham
pshi
re
40,000,000
Business Case forConnected Insurance Ecosystem
Workforce Trends
The workforce is seeing some radical shifts with middle and senior management seeing a visible shift of
decision makers under the age of 40. This will also have an impact on the technology roadmap that some
insurance companies will embark on. The personal affinity and technology adoption mindset of the decision
makers will be translated into professional buying decisions and adoption of IoT sensors.
All data points in (000)’
20 to 24
Data from Bureau of Labor Statstic
Data for 59,438,000 jobs pertaining to
Management, professional, and related occupations
from the overall employed population of
151,436,000 for the year 2016
0 5,000 10,000 15,000 20,000 25,000 30,000 35,000
16 to 19
25 to 34
35 to 44
45 to 54
55 to 64
> 65
Age
Data for overall employed population of
151,436,000 for the year 2016
396
3,118
13,561 13,926 13,818
10,689
3,931
0
2,000
4,000
6,000
8,000
10,000
12,000
14,000
16,000
16 to 19years
20 to 24years
25 to 34years
35 to 44years
45 to 54years
55 to 64years
65 yearsand over
Data from Bureau of Labor Statstic
All data points in (000)’
8,916
25,524
32,720
31,562
33,72214,027
4,965

L&T Infotech Proprietary 11 / 15
Consumer Trends
Last mile consumers are poised to be dominated by a subset of younger customers, whose buying choices
and technology adoption are radically skewed towards a more digital experience.
Business Case forConnected Insurance Ecosystem
Pastoral Pride 4.98
Cultural Connections 5.22
Golden Year Guardians 8.02
Aspirational Fusion 2.95
Economic Challenges 4.13
Significant Singles 4.84
Families in Motion 2.97
Singles and Starters 10.96
Power Elite 5.34
Booming with Confidence 6.61
Thriving Boomers 6.11
Family Union
Autumn Years
5.16
6.25
Blue Sky Boomers 6.58
Categories % mix
Flourishing Families 4.52
Suburban Style 4.85
Promising Families 3.36
Young, City Solos 3.18
Middle-class Melting Pot 3.97
Another application of sensor technology put to use, is in areas where backup sunk pumps kick into action
on the alert of minor flooding incidents detected by sensors installed on the floor of basements. While claims
are bound to happen, the introduction of sensors can reduce or even prevent an incident from occurring in
certain instances.
In the Workers Compensation area, sensors offer the possibilities of tracking the movement of staff and
movable assets and sending alerts to staff on the proximity to heavy machinery or high fatality prone zones.
L&T Infotech Proprietary 12 / 15
Traces of this shift are apparent in some of the disruption seen in the retail sector. Amazon’s cashier less
grocery shopping model or the driverless cars of the future are all an indication of shifting demographic
patterns. A younger customer base will also have similar expectations from the insurance buying and
servicing journey. Connected devices fill this void and better align to a digital experience for the entire
insurance value chain. The Data from Experian in the table below Segments the US Customer Base with the
top 39 % of buying consumers being under the age of 40.
Declining cost of Sensors & energy storing devices:
The declining cost of sensors and batteries getting more efficient, will fuel adoption of sensors as some of
the hindrances for entry of sensors in risk monitoring and prevention are overcome.
Usage data:
It could be an onboard sensor or a monitoring video cam with motion detection, the possibility of a risk event
is tied to usage. Even in the event where a claim event is triggered for reasons outside of equipment usage,
the device can be used for capturing event data used to derive Subrogation revenue from the party at fault.
Opportunity and Applica�on of using SensorsMarket leaders are poised to drive this change fueled by one, some or all these reasons:
4
Pricing differentiator:
The data collected, can be used to better price risk in order to make the insurance product more competitive.
Regional insights, demographic data on usage patterns and movement of people, with reference to assets
covered under different types of insurance coverage can provide additional insight to pricing.
Risk Prevention:
The data collected providing insights into preventing or reducing the risk events from occurring, present the
biggest possibility for IoT sensor usage in insurance. Water damage losses is one of the key areas for using
sensors. Industry research has captured some very thought provoking data points. For instance, a recent
study from the National insurance Crimes Bureau, points to data suggesting that a significant percentage of
water damage losses could be prevented or reduced by introduction of water pressure sensing devices
designed to switch off water mains in the event of sudden water pressure changes, due to frozen water pipes.
Business Case forConnected Insurance Ecosystem
L&T Infotech Proprietary 13/ 15
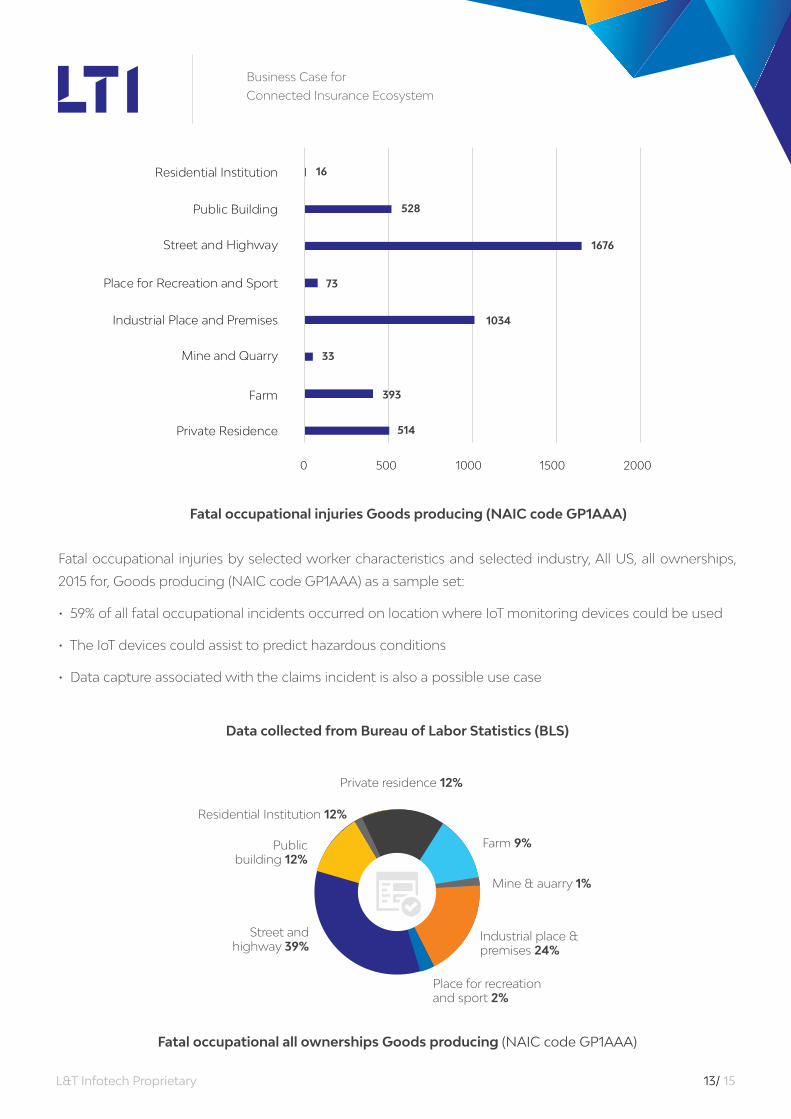
Fatal occupational injuries Goods producing (NAIC code GP1AAA)
0 500 1000 1500 2000
Private Residence
Farm
Mine and Quarry
Industrial Place and Premises
Place for Recreation and Sport
Street and Highway
Public Building
Residential Institution
Fatal occupational injuries by selected worker characteristics and selected industry, All US, all ownerships,
2015 for, Goods producing (NAIC code GP1AAA) as a sample set:
• 59% of all fatal occupational incidents occurred on location where IoT monitoring devices could be used
• The IoT devices could assist to predict hazardous conditions
• Data capture associated with the claims incident is also a possible use case
Data collected from Bureau of Labor Statistics (BLS)
Fatal occupational all ownerships Goods producing (NAIC code GP1AAA)
Street and highway 39%
Place for recreation and sport 2%
Industrial place & premises 24%
Public building 12%
Farm 9%
Mine & auarry 1%
Private residence 12%
Residential Institution 12%
Business Case forConnected Insurance Ecosystem
16
528
1676
73
1034
33
393
514

L&T Infotech Proprietary 14/ 15
Business Case forConnected Insurance Ecosystem
With the shift in goods and services, there is a possibility that personal and commercial auto segments will
change drastically due safer and smarter vehicles on the road, and carriers will be forced to revisit pricing and
new emerging product segments in response to this. Connected homes and commercial establishments
also present the same shift in trends requiring Insurance carriers to bundle their product offerings with
sensor bundles that could pre-empt an incident.
Another major influence to the proliferation of connected devices is going to be driven by the retail segment,
where there is a silent revolution in progress with smart Televisions, and home appliances that will eventually
impact the insurance ecosystem as well. All this will be connected with overarching analytic platforms and
computing capabilities that are defying Moore’s law, with the pace at which technology is driving progress
in the area of Big data and Analytics.
The future of insurance is going to be defined by connected devices that will provide data in short cycles
over an infrastructure channel that will help carriers price products more dynamically and responsively to
customers and market needs. Despite all the progress we make on the technology front, incidents are bound
to happen and risk will still be present.
The only difference will be that the census and historic loss experience data will be replaced by data coming
as a regular feed from connected devices, and the algorithms to predict the probability of events will get
smarter as an outcome.
The dawn of smart cities, homes, cars, workplaces & living spaces are the only natural progression.
Insurance-as-a-service will need to catch up with the ecosystem it is created to cater to. The data collected
from industry sources and our hypothesis from it, points in this direction. The carriers that approach this
opportunity with the openness to change and adapt with the ecosystem that they service, will thrive in the
decades to come. A classic example of this can been seen in the entertainment industry, where names like
Blockbuster bear witness to the wrath of not keeping pace with the ecosystem that they serviced. As
technology moved from physical devices to streaming entertainment over the internet, blockbusters
inability to keep pace with these changes took its toll on the existence of the firm, and made way for
streaming service like Netflix to quickly change the way entertainment was delivered over a digital medium.
Similar changes can be expected in how connected devices will impact the insurance industry; and there is
a possibility of seeing the lines between Insurance companies and technology firms blur. The insurance
carriers that recognize these changes and react in a timely manner, will reap the benefits of this technology
wave set to change the industry.
Conclusion5

L&T Infotech Proprietary 15/ 15
About the author(s)6
Christopher Fernandes is Director Solutions in Insurance in LTI. He is an Insurance
Solutions Leader, with a focus on Big Data Analytics, Robotic Process Automation
and Packaged Solutions delivery. Focusing on key clients serviced by LTI, with an
added responsibility to articulate Go-to-Market strategy for new offerings in the
P&C and Life Domain in the US. He has also worked in insurance companies
managing business operations as part of start up operations and subsequently
moved to technology consulting helping insurance & health care companies
improve process controls and innovate business operations.
Rodney David is in Consulting Practice in LTI. He has over 2 years of experience in
Account Management Support & Proposal Bid Management. He has a good
understanding of the key industry trends and key issues impacting the Insurance
industry in North America. He is also involved in Insurance solutions designing. He
holds a Master's degree in Business Administration and Bachelor’s degree in
Management Studies.
www.Lntinfotech.com
LTI (NSE: LTI) is a global technology consulting and digital solutions company, helping more than 250 clients succeed in a converging world. With operations in 27 countries, we go the extra mile for our clients and accelerate their digital transformation with LTI’s Mosaic platform, enabling their mobile, social, analytics, IoT and cloud journeys. Founded 20 years ago as the information technology division of the Larsen & Toubro group, our unique heritage gives us unrivaled real-world expertise to solve the most complex challenges of enterprises across all industries. Each day, our team of more than 20,000 LTItes enable our clients to improve the effectiveness of their business and technology operations, and deliver value to their customers, employees and shareholders. Find more at www.Lntinfotech.com or follow us at @LTI_Global
www.Lntinfotech.com
Sanghamitra Paul is a Senior Business Analyst (Insurance) in Consulting Practice in
LTI. She has experience working with leading, US-based insurance companies. Her
expertise includes Data Analysis, Client handling and establishing relationships with
critical business stakeholders in the project, and acting as a liaison between
Business and Technology. She has an engineering (IT) degree and is working in both
P&C and Life Insurance, taking care of Functional and Technical aspects in
Requirement gathering and Designing solutions.
Business Case forConnected Insurance Ecosystem
Top Related