


Languages
Pages
Legal

Build System Performance Data Analytics Using Wave
Jasmin Nakic Lead Performance Engineer [email protected] @jnakic
Explore performance and business data using powerful visualization tools
Anil Jacob Lead Performance Engineer [email protected]
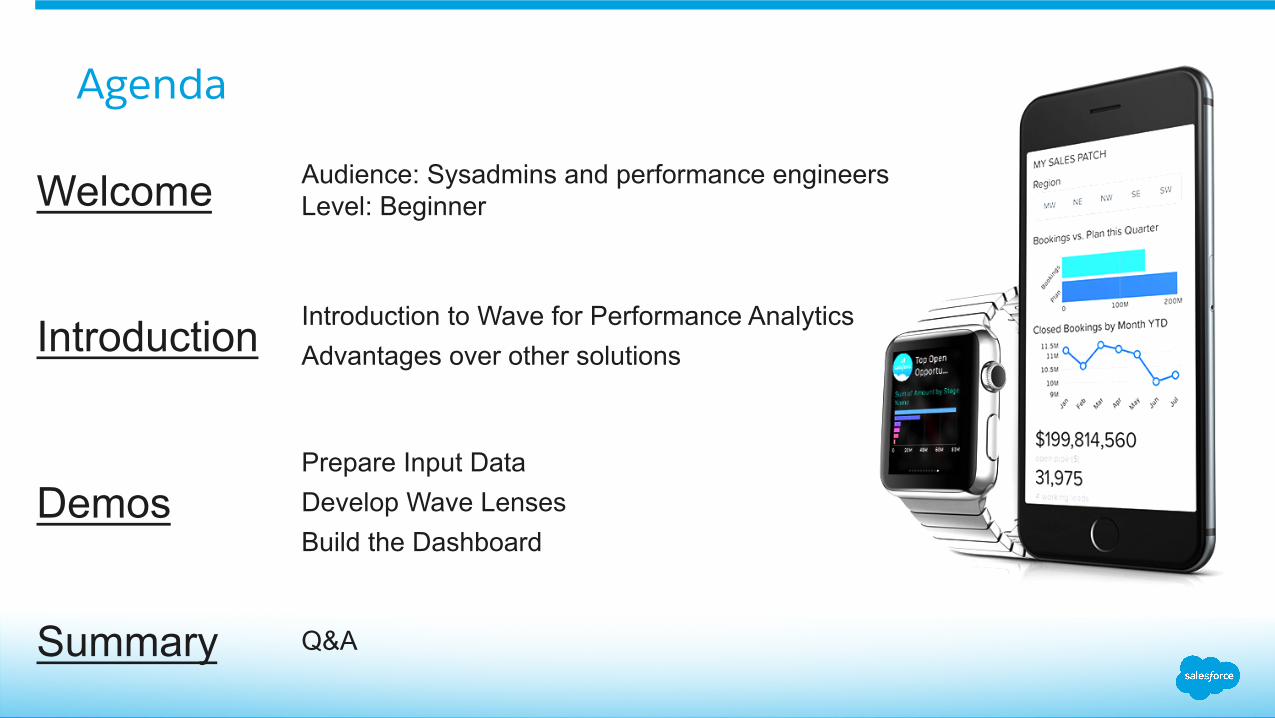
Agenda
Welcome Audience: Sysadmins and performance engineers Level: Beginner
Introduction Introduction to Wave for Performance Analytics Advantages over other solutions
Demos Prepare Input Data Develop Wave Lenses Build the Dashboard
Summary Q&A
Safe harbor statement under the Private Securities Litigation Reform Act of 1995:
This presentation may contain forward-looking statements that involve risks, uncertainties, and assumptions. If any such uncertainties materialize or if any of the assumptions proves incorrect, the results of salesforce.com, inc. could differ materially from the results expressed or implied by the forward-looking statements we make. All statements other than statements of historical fact could be deemed forward-looking, including any projections of product or service availability, subscriber growth, earnings, revenues, or other financial items and any statements regarding strategies or plans of management for future operations, statements of belief, any statements concerning new, planned, or upgraded services or technology developments and customer contracts or use of our services.
The risks and uncertainties referred to above include – but are not limited to – risks associated with developing and delivering new functionality for our service, new products and services, our new business model, our past operating losses, possible fluctuations in our operating results and rate of growth, interruptions or delays in our Web hosting, breach of our security measures, the outcome of any litigation, risks associated with completed and any possible mergers and acquisitions, the immature market in which we operate, our relatively limited operating history, our ability to expand, retain, and motivate our employees and manage our growth, new releases of our service and successful customer deployment, our limited history reselling non-salesforce.com products, and utilization and selling to larger enterprise customers. Further information on potential factors that could affect the financial results of salesforce.com, inc. is included in our annual report on Form 10-K for the most recent fiscal year and in our quarterly report on Form 10-Q for the most recent fiscal quarter. These documents and others containing important disclosures are available on the SEC Filings section of the Investor Information section of our Web site.
Any unreleased services or features referenced in this or other presentations, press releases or public statements are not currently available and may not be delivered on time or at all. Customers who purchase our services should make the purchase decisions based upon features that are currently available. Salesforce.com, inc. assumes no obligation and does not intend to update these forward-looking statements.
Safe Harbor
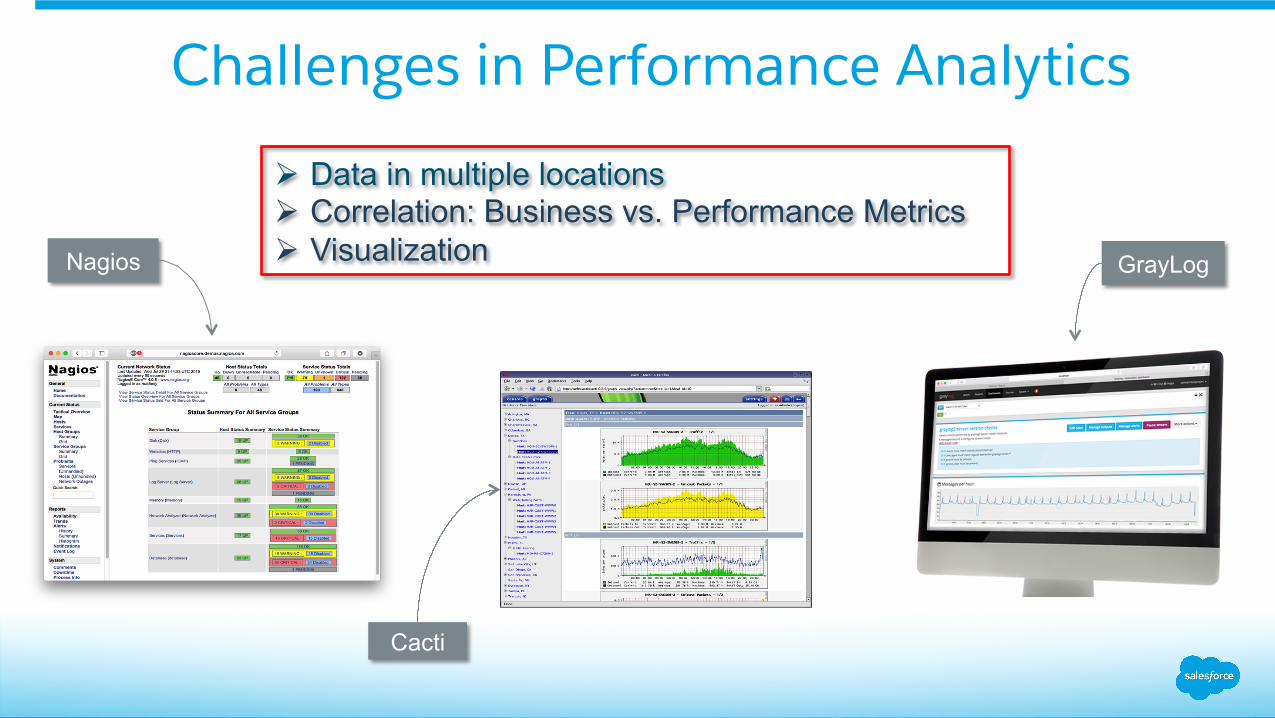
Challenges in Performance Analytics
Ø Data in multiple locations Ø Correlation: Business vs. Performance Metrics Ø Visualization Nagios
Cacti
GrayLog
Performance Analytics Using Wave
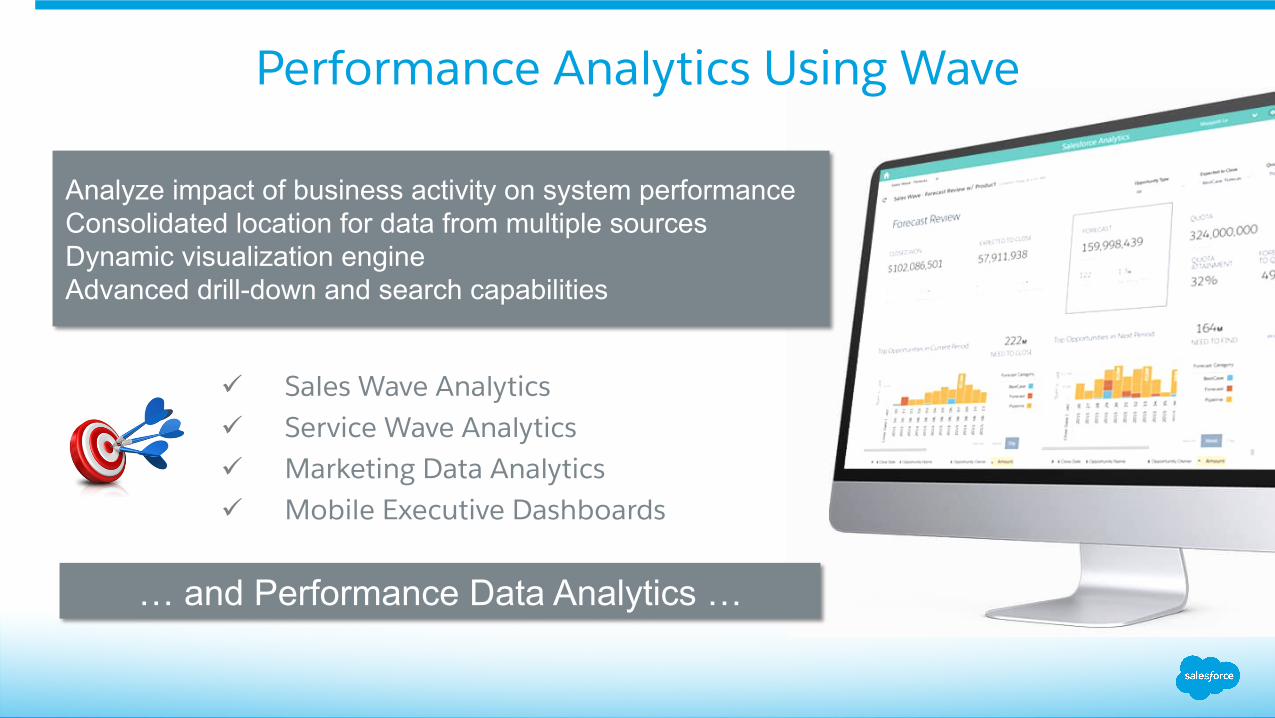
ü Sales Wave Analytics ü Service Wave Analytics ü Marketing Data Analytics ü Mobile Executive Dashboards
… and Performance Data Analytics …
Analyze impact of business activity on system performance Consolidated location for data from multiple sources Dynamic visualization engine Advanced drill-down and search capabilities
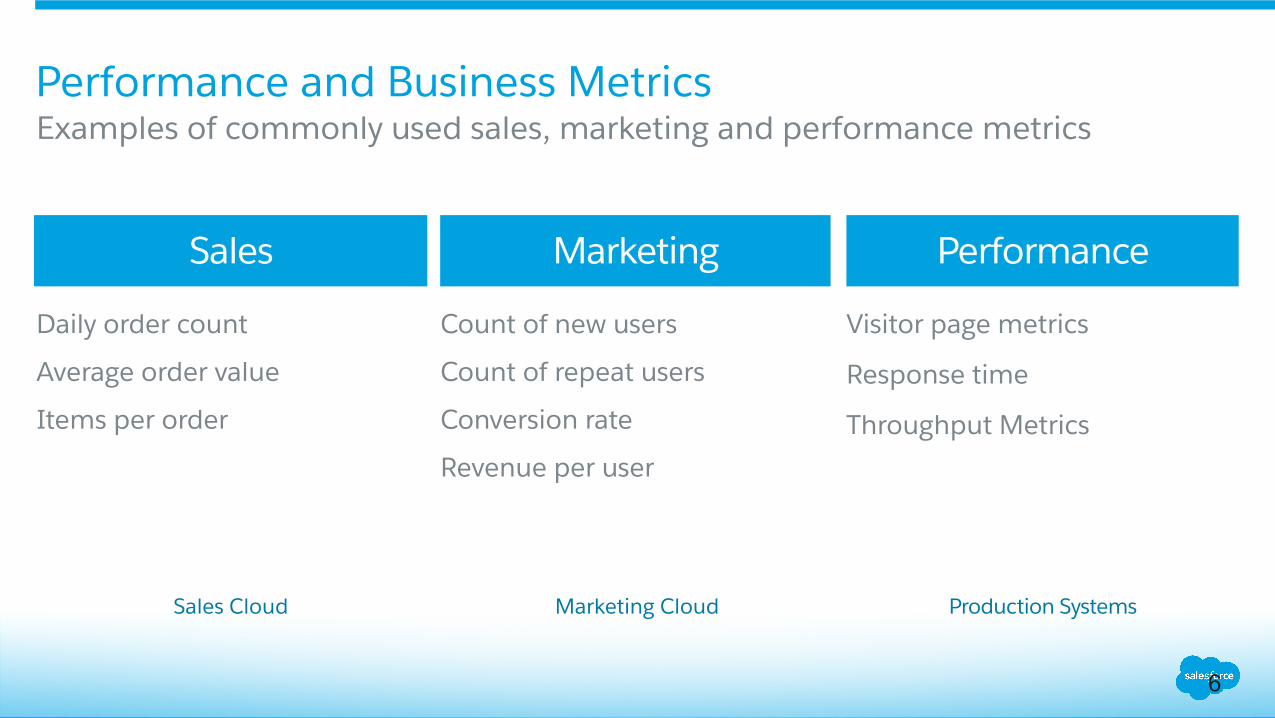
Daily order count
Average order value
Items per order
Count of new users
Count of repeat users
Conversion rate
Revenue per user
Visitor page metrics
Response time
Throughput Metrics
Sales Marketing Performance
Production Systems Sales Cloud Marketing Cloud
Performance and Business Metrics Examples of commonly used sales, marketing and performance metrics
6
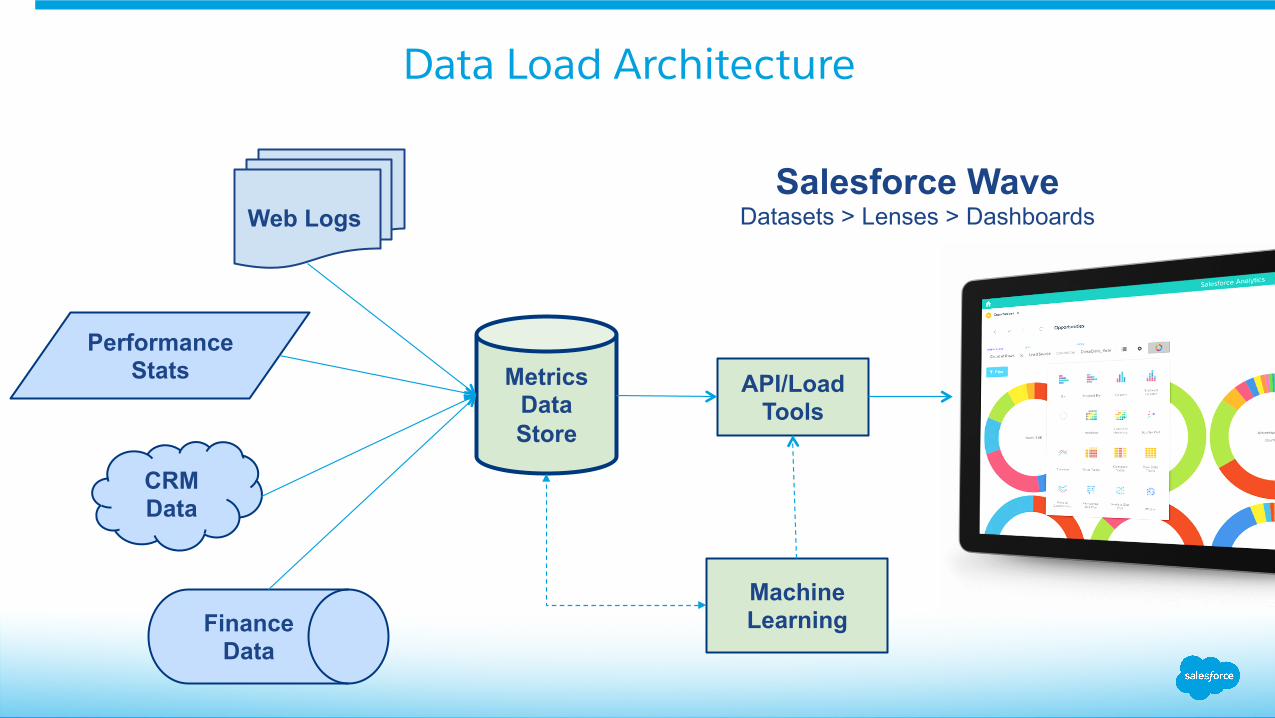
Data Load Architecture
Metrics Data Store
API/Load Tools
Machine Learning
Web Logs
Performance Stats
CRM Data
Finance Data
Salesforce Wave Datasets > Lenses > Dashboards
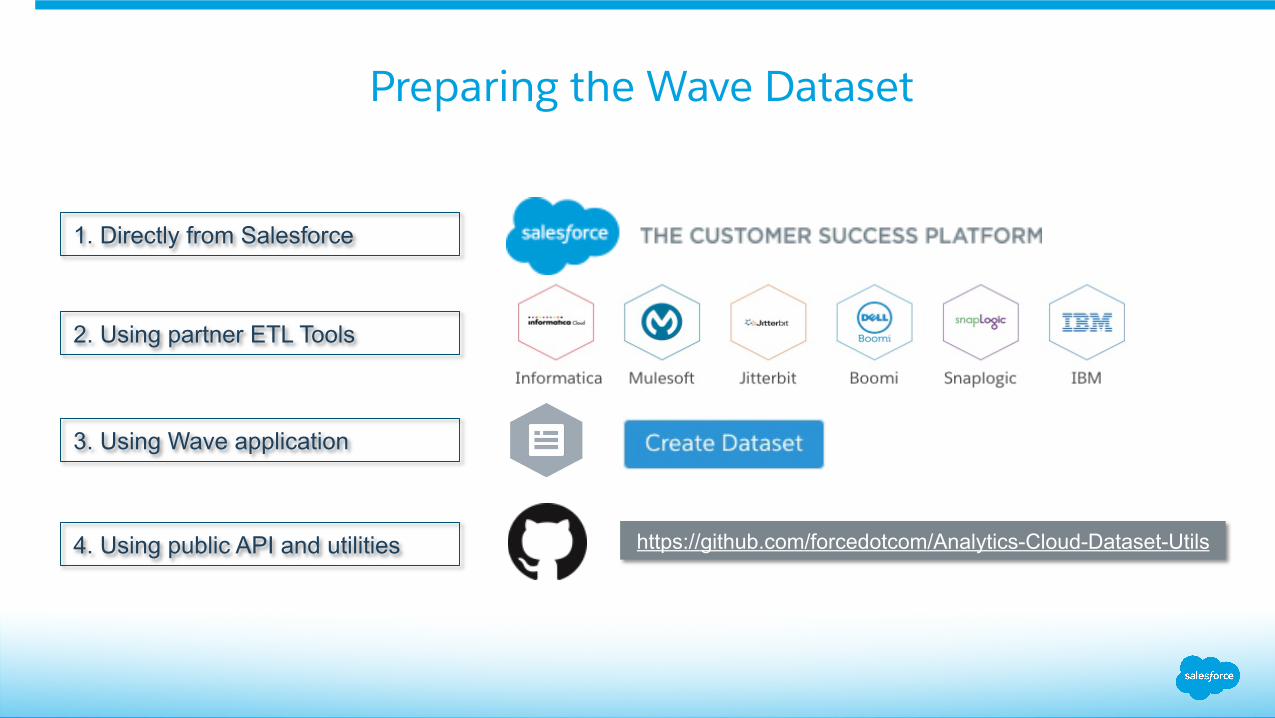
Preparing the Wave Dataset
https://github.com/forcedotcom/Analytics-Cloud-Dataset-Utils
1. Directly from Salesforce
2. Using partner ETL Tools
3. Using Wave application
4. Using public API and utilities
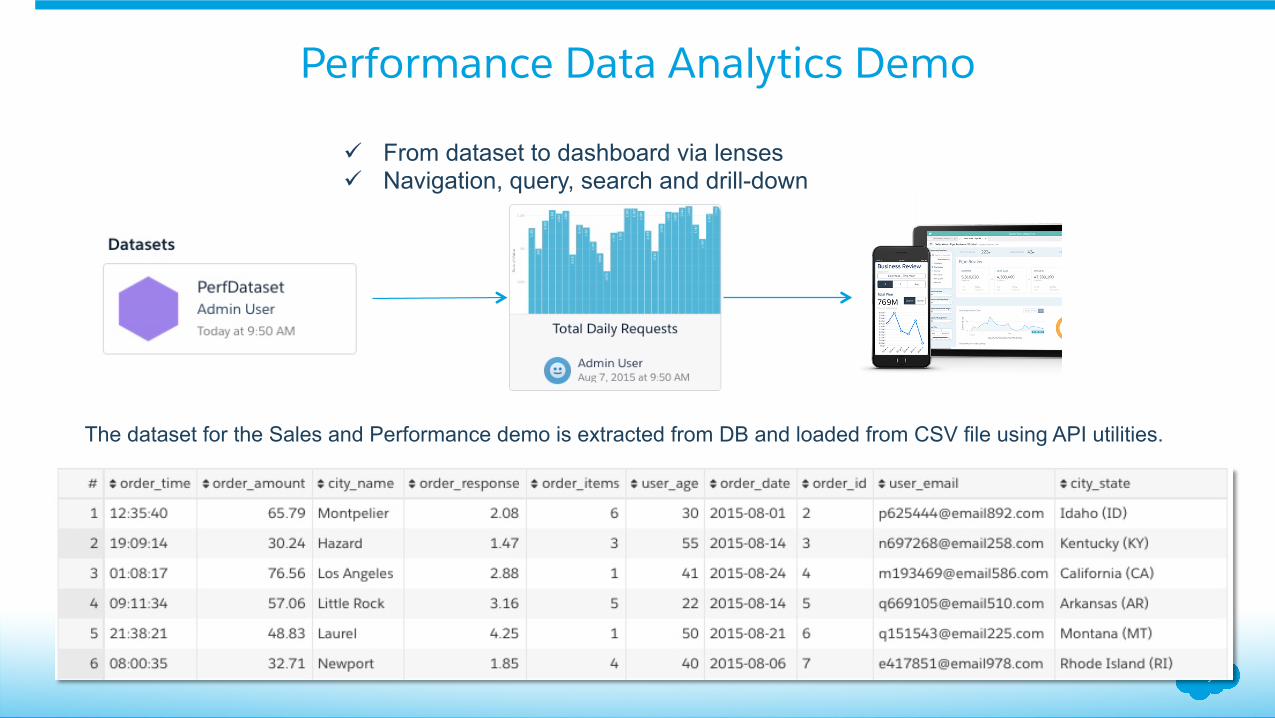
Performance Data Analytics Demo
The dataset for the Sales and Performance demo is extracted from DB and loaded from CSV file using API utilities.
ü From dataset to dashboard via lenses ü Navigation, query, search and drill-down
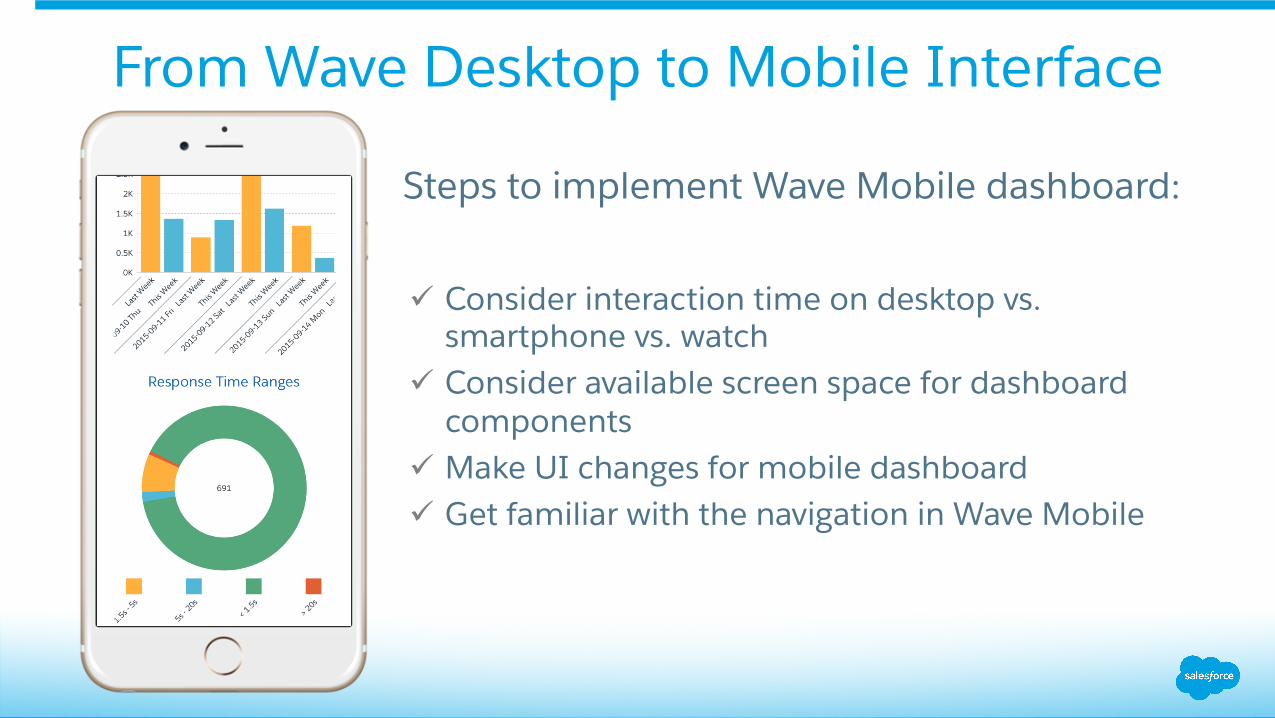
From Wave Desktop to Mobile Interface
Steps to implement Wave Mobile dashboard:
ü Consider interaction time on desktop vs. smartphone vs. watch
ü Consider available screen space for dashboard components
ü Make UI changes for mobile dashboard ü Get familiar with the navigation in Wave Mobile
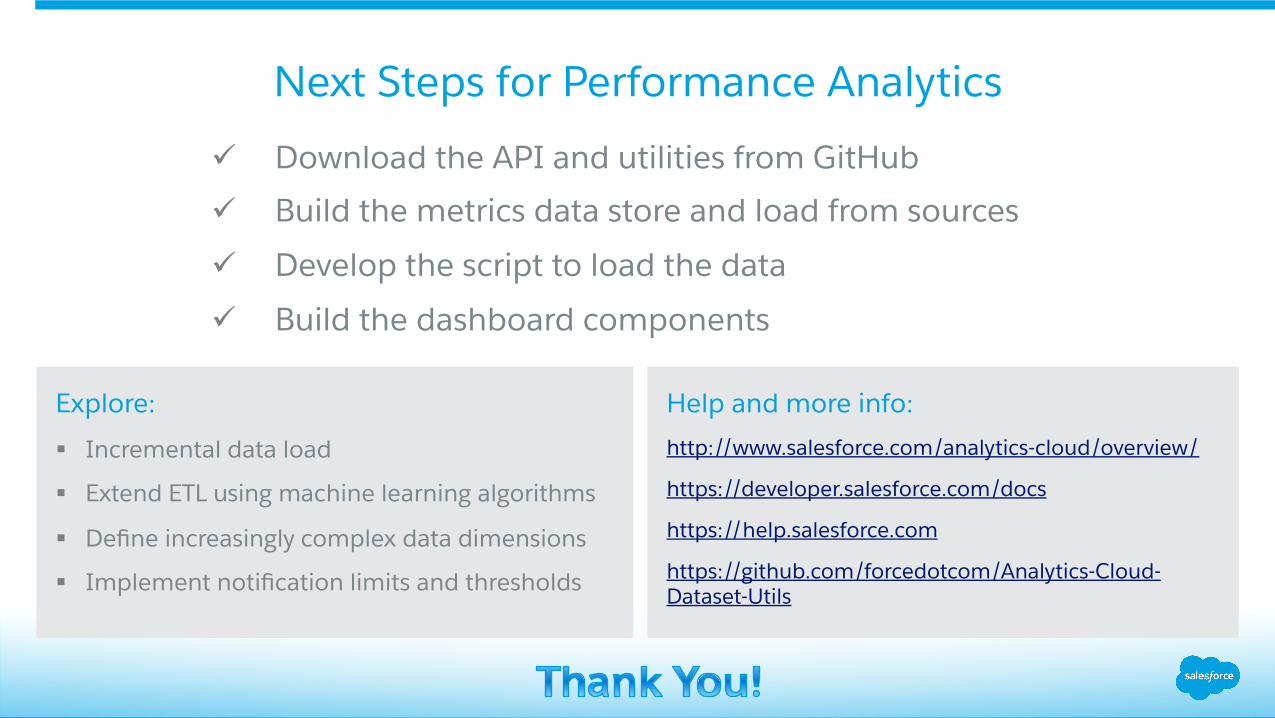
Explore:
§ Incremental data load
§ Extend ETL using machine learning algorithms
§ Define increasingly complex data dimensions
§ Implement notification limits and thresholds
Help and more info:
http://www.salesforce.com/analytics-cloud/overview/
https://developer.salesforce.com/docs
https://help.salesforce.com
https://github.com/forcedotcom/Analytics-Cloud-Dataset-Utils
Next Steps for Performance Analytics
ü Download the API and utilities from GitHub
ü Build the metrics data store and load from sources
ü Develop the script to load the data
ü Build the dashboard components
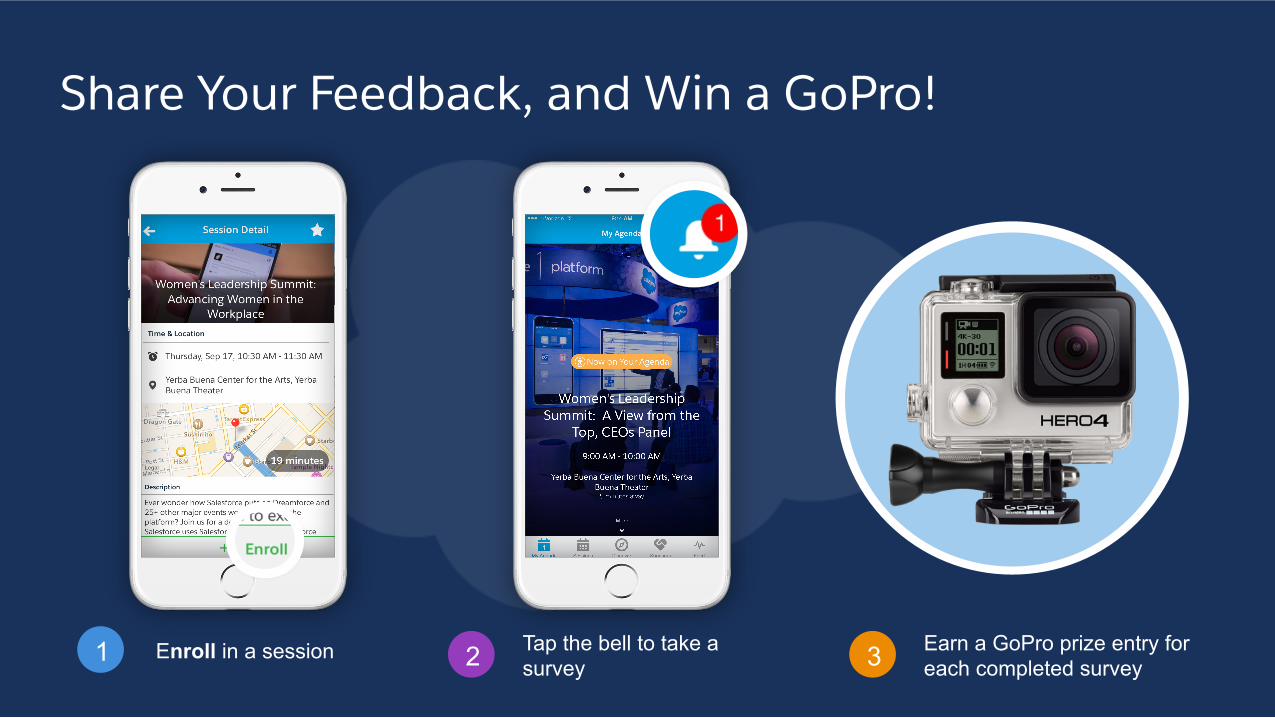
Share Your Feedback, and Win a GoPro!
3 Earn a GoPro prize entry for each completed survey
Tap the bell to take a survey 2Enroll in a session 1
Top Related