


Languages
Pages
Legal


BTSGIF General PresentationJune 2021

Disclaimer
This is not prospectus of BTS Rail Mass Transit Growth Infrastructure Fund (“BTSGIF” or “the Fund”). Investment in the Funds contains certain risk. Before investing, please carefully study the prospectusof the Funds. An investment in investment units shall not be deemed as deposit of money. The unitholders may receive an amount of any return that is more or less than the initial amount invested.Furthermore, the Fund has intention to invest in infrastructure projects which is a long-term investment; as a consequence, the investors ought to be aware of its risks from and returns on investment ininvestment units.
This Fund invests in the future net farebox revenue from the Core BTS SkyTrain System. Its value may decrease along with elapse of the concession term, thus decreasing the value of the investmentunits accordingly. The unitholders will receive return of initial investment in the form of dividend and capital return. Once the term expires according to the Net Revenue Purchase and TransferAgreement that the Fund has invested in, the value of the investment units may decrease to Baht zero.
This document has been prepared solely for the information purpose. The information contained herein is general and does not constitute advice or opinion, and should not be regarded as a substitutefor detailed advice in individual cases. None of this information in this document constitutes an offer to treat, buy or sell any security or to participate in any trading strategy. Third parties cannot deriveany rights from this document. While particular attention has been paid to the contents of this document, no guarantee, warranty or representation, express or implied, is given to the accuracy,correctness or completeness thereof. Any information given in this document may be subject to change or update without notice. No liability (such as, but not limited to, direct, consequential, special,punitive or indirect damages) will be accepted for any loss sustained by readers as a result of using this document or basing decisions on it. Please note that the investment is not a deposit of money andmay be subject to certain risks. The value of your investment may rise or fall and also past performance is not insisting of future performance and shall in no event be deemed as such.
For more information relating to the Fund, please visit www.btsgif.com or www.bblam.co.th
2BTSGIF General Presentation

3
Page
I. BTSGIF at a Glance 4
II. BTSGIF Investment Highlights 9
III. BTSGIF Performance Summary 18
IV. Conclusion 22
Appendix
Infrastructure Funds (IFFs) 24
BTSGIF’s Structure 28
BTSGIF’s Initial Assets and Right to Purchase 30
Existing Bangkok Mass Transit Network 31
Targeted Lines by BTS Group 32
BTSGIF Farebox Revenue and Costs Forecast 34
BTSGIF Performance 38
Saint Louis Station (S4) 46
Loss on Valuation of Investment 47
BTS Historical Fare Adjustment 50
Contents
BTSGIF General Presentation

4
BTSGIF At a Glance
THB
62.5bn
Raised from IPO Concession expiry in 2029
≈8 years
remaining
Annual ridership in core network
(FY 20/21)
≈ 125mn trips
(408,341 trips / Weekday )
8.6%
CAGR
of Farebox revenue (19 yrs since inception to FY19/20)
of Core BTS SkyTrain(FY 20/21)
56.7%
EBITDA margin
Annual payout(FY 20/21)
THB 0.308
Per unit
✓ BTSGIF is the first Infrastructure Fund in Thailand✓ Invest in the 23.5km of BTS Core Network with 8 years concession remaining✓ Position to benefit from passenger growth, fare increase and operating
leverage on Core Network✓ Seek for new opportunities from mass transit infrastructure projects
with strong cash flow potential
Stock code BTSGIF
Outstanding shares (mn) 5,788
Market capitalisation (THB mn)* 28,940
Market capitalisation (USD mn)* 926
Closing price* 5.00
BTSGIF Stock information
BTSGIF General PresentationSection I: BTSGIF at a Glance
*as of 31 May 2021

5
BTSGIF At a GlanceInvest in 23.5km of BTS Core Network, 8 years concession remaining
Fund Name BTS Rail Mass Transit Growth Infrastructure Fund (“BTSGIF”)
Sponsors BTS Group Holdings PCL (“BTSG”) and Bangkok Mass Transit System PCL (“BTSC”)
Fund Management Company
BBL Asset Management Co., Ltd. (“BBLAM”)
Fund Supervisor Standard Chartered Bank (Thai) Pcl. (“SCBT”)
Initial Asset • Future net farebox revenue (Farebox revenue less related operating cost and CAPEX) from the Core BTS SkyTrain system (23.5km)
• Concession period ending 4 December 2029 (approximately 8 years remaining)
• Initial Investment cost : THB 61,399mn• American Appraisal appraisal value:
THB 61,000mn (Discount rate 9.0%)• fnAsia appraisal value: THB 59,400mn (Discount
rate 8.8%)(1)
Total Investment Units 5,788mn investment units
Par Value THB 10.8 per investment unit(THB 9.692 per investment unit as of Mar 2021)
Registered Capital THB 62,510.4mn; THB 56,097.3mn as of Mar 2021
Lock-up Arrangement Lock-up of BTSG’s 33.3% holding of BTSGIF units for 10 years from FY 13/14 to FY 22/23
(1) Discount cash flow without adjusting Mid-Year Convention
DARK GREENMO CHIT – ON NUT17.0km
LIGHT GREENNATIONAL STADIUM -SAPHAN TAKSIN6.5km
• 30-year concession (ending 4 Dec 2029) to exclusively collect ridership fare (and bear related expenses and capital expenditure)
• 23 stations over 23.5km located at CBD area of Bangkok• All investments made by BTSC: Including civil works, E&M and trains
(except land acquisition) • No revenue sharing or concession fees to BMA
BTSGIF General PresentationSection I: BTSGIF at a Glance
Fund summary Initial asset: Core BTS SkyTrain system (until 2029)

6
BTSGIF At a GlanceStrong governance framework: one-third investment by BTS with 10 years lock-up
BTSGIF
Fund Supervisor(Standard Chartered Bank (Thai))
Fund Management Company(BBL Asset Management Co. Ltd)
BTSC
33.3%(lock up 10 yrs from FY 13/14 to FY 22/23)
Public Investors
66.7%
BTSG
Infrastructure Fund Manager
• Ongoing management of BTSGIF
• Monitor BTSC’s operation
• Appointed by BBLAM
• Committees must include experts in Sky Train business
• Give investment advice on investment to fund manager
BTSC BoardControls
• Comprise of 1/3 from BTSG, 1/3 from BBLAM and 1/3 as independent directors
• Resolution on Reserved Matters requires at least 2 votes from BBLAM
Nominate Board Representatives at BTSC
• Monitor BTSC’s operation and compliance under NRTA
• Exercise veto vote on Reserved Matters
97.5%
Investment AdvisoryCommittee
Fund Management
NRTA* between BTSC and BTSGIF
Fund Supervisor Agreement
• Supervise Fund Management Company • Make payment for fund expenses • Keep fund’s assets
* NRTA: Net Revenue Purchase and Transfer Agreement
BTSGIF General PresentationSection I: BTSGIF at a Glance
Management structure

7
BTSGIF At a GlanceSecure net farebox revenue transferred to BTSGIF
I. Net farebox revenue (transferred to BTSGIF daily)
FAREBOX REVENUE OPERATING EXPENSES
CAPITAL EXPENDITURE
II. Incentive fee
▪ All farebox revenue from passengers in the Core BTS SkyTrain system
▪ Other revenue and compensation from any person under, arising out of or relating to concession or the farebox revenue of the Core BTS SkyTrain system
▪ Excludes revenue from O&M business extension, media business and revenue from BTSC’s other business
Cost relevant to the Core BTS SkyTrainsystem such as
• maintenance expense,
• staff cost,
• electricity, etc.
New rolling stock for the Core BTS SkyTrain system to serve future ridership
net ofPAYABLE BY BTSGIF TO BTSC ONLY WHEN NET FAREBOX REVENUE EXCEEDS BUDGET
1. NO INCENTIVE FEEIf actual net farebox revenue ≤ 100% of Budget
2. 10% INCENTIVE FEEOn actual amount exceeding 100% but not exceeding 125% of budget
3. FEE FROM ITEM 2 PLUS 15% OF THE INCREMENTAL AMOUNT EXCEEDING 125%If actual amount > 125% of budget
BTSGIF General PresentationSection I: BTSGIF at a Glance
BTSGIF revenue

8
Contents
BTSGIF General Presentation
Page
I. BTSGIF at a Glance 4
II. BTSGIF Investment Highlights 9
III. BTSGIF Performance Summary 18
IV. Conclusion 22
Appendix
Infrastructure Funds (IFFs) 24
BTSGIF’s Structure 28
BTSGIF’s Initial Assets and Right to Purchase 30
Existing Bangkok Mass Transit Network 31
Targeted Lines by BTS Group 32
BTSGIF’s Farebox Revenue and Costs Forecast 34
BTSGIF’s Performance 38
Saint Louis Station (S4) 46
Loss on Valuation of Investment 47
BTS Historical Fare Adjustment 50

9
BTSGIF Investment Highlights
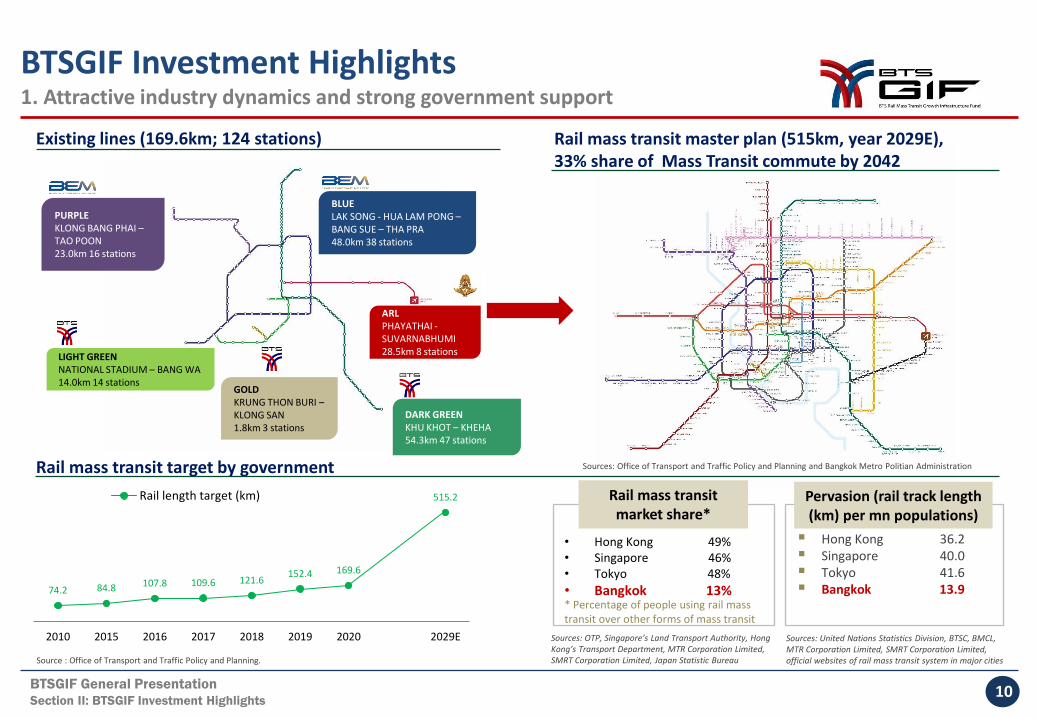
1 Attractive industry dynamics and strong government support• Government’s plan is to expand mass transit network from 169.6km currently to 515.2km in 2029• Market share of mass transit is expected to increase from 13% to over 33% in 2037• The Thai government has made explicit its policy to develop Bangkok’s infrastructure by investing in mass transit projects
4 Efficient operations with significant operating leverage• Sustainable margin from the strong operational performance and operating leverage• Good margin compared to regional mass transit peers
2Resilient business with proven track record • Ridership has showed resilient growth, pass through several situations (CAGR 7.6% since inception to FY 19/20)
5 Ample capacity for future growth with limited CAPEX
3Exclusive concession with flexibility to increase fares• Able to increase fare in the core network without BMA’s or national government’s approval, in case under the authorised fare
6BTSC’s personnel with extensive experience in the mass transit business
7Substantial investment opportunities from accretive mass transit expansion
BTSGIF General PresentationSection II: BTSGIF Investment Highlights
• Additional 46x 4-car trains to accommodate passengers in existing network and new Green Line extensions (3x4 car trains were allocated to BTSGIF and used in the Core Network)
• RoFR and call option on BTS existing contracts (30-yr O&M contracts and concession extension) as well as new mass transit lines by BTS• Also able to seek out non-BTS related infrastructure opportunities and focus on projects with strong cash flow potential
• Developer: BTS core network constructed in 35 months• Operator: 20-years’ experience in operating the SkyTrain green line network
10
BTSGIF Investment Highlights1. Attractive industry dynamics and strong government support
Rail mass transit target by government Sources: Office of Transport and Traffic Policy and Planning and Bangkok Metro Politian Administration
Source : Office of Transport and Traffic Policy and Planning.
BTSGIF General PresentationSection II: BTSGIF Investment Highlights
Existing lines (169.6km; 124 stations) Rail mass transit master plan (515km, year 2029E), 33% share of Mass Transit commute by 2042
Rail mass transit market share*
• Hong Kong 49%• Singapore 46%• Tokyo 48%
• Bangkok 13%
Sources: OTP, Singapore’s Land Transport Authority, Hong Kong’s Transport Department, MTR Corporation Limited, SMRT Corporation Limited, Japan Statistic Bureau
DARK GREENKHU KHOT – KHEHA54.3km 47 stations
ARLPHAYATHAI -SUVARNABHUMI28.5km 8 stationsLIGHT GREEN
NATIONAL STADIUM – BANG WA14.0km 14 stations
BLUELAK SONG - HUA LAM PONG –BANG SUE – THA PRA48.0km 38 stations
PURPLEKLONG BANG PHAI –TAO POON23.0km 16 stations
▪ Hong Kong 36.2▪ Singapore 40.0▪ Tokyo 41.6▪ Bangkok 13.9
Pervasion (rail track length (km) per mn populations)
* Percentage of people using rail mass transit over other forms of mass transit
Sources: United Nations Statistics Division, BTSC, BMCL, MTR Corporation Limited, SMRT Corporation Limited, official websites of rail mass transit system in major cities
GOLDKRUNG THON BURI –KLONG SAN1.8km 3 stations
74.2 84.8 107.8 109.6 121.6152.4 169.6
515.2
2010 2015 2016 2017 2018 2019 2020 2029E
Rail length target (km)

1,4
19
1,7
80
2,1
22
2,2
94
2,5
73
2,8
17
3,0
66
3,2
24
3,2
92
3,4
85
3,5
45
4,2
97
4,8
96
5,6
77
5,8
74
6,3
97
6,6
36
6,8
21
6,9
62
6,8
14
3,7
1559
79 96
105 118
132 139 133 136 144 145
176 197
215 219233 238.0 241.2 241.0 236.9
124.9
FY00/01
FY01/02
FY02/03
FY03/04
FY04/05
FY05/06
FY06/07
FY07/08
FY08/09
FY09/10
FY10/11
FY11/12
FY12/13
FY13/14
FY14/15
FY15/16
FY16/17
FY17/18
FY18/19
FY19/20
FY20/21
Farebox revenue (THB mn) Ridership (mn trips)
11
BTSGIF Investment Highlights2. Resilient business with proven track record
Jul 04: Opening of Bangkok MRT System (Blue line)
May 10: Opening of Bangkok BRT;
Thai political protests
Aug 10: Opening of Airport Rail Link
Oct – Nov 11: Floods
Aug 11: On Nut –Bearing extension opening
INITIAL GROWTHRIDERSHIP CAGR (3 YRS): 21%
STABLE GROWTHRIDERSHIP CAGR (5 YRS): 5%
FASTER GROWTHRIDERSHIP CAGR (5 YRS) 10%
Dec 99: BTS SkyTrainservice opening
Mar 07: First fare rate increase
May 09: Opening of Silom Line extension
▪ Farebox revenue CAGR: 8.6%▪ Ridership CAGR: 7.6%
GROWTH (19 YRS to FY 19/20)
BTSGIF General PresentationSection II: BTSGIF Investment Highlights
Jul 15: 30-Day Cards Promotion
adjustment
Jan 16: Stored Value Cards
(Purse) Promotion
Cancellation
Aug 16: Opening of MRT System (Purple line) Apr 13: Sale of net
farebox revenue to BTSGIF
Nov 13: Thai political protests
Dec 13: Wongwian Yai – Bang Waextension opening
Jun 13: Fare increaseApr 17: Opening of Samrong station
and increase extension fare Aug 17: Opening of the interchange station
on MRT System (Blue & Purple line)Oct 17 : Fare increase
Dec 18: Opening of Southern Green Line
STABLE GROWTHRIDERSHIP CAGR (6 YRS): 2%
Apr 20: COVID-19and Purse
Promotion Cancellation
Jun-Dec 20: Opening of
Northern Green line extension
Jul-Sep 19: Opening of Blue
line Extension
Aug-Dec 19: Opening of
Northern Green line extension
Jan-Mar 20:COVID-19
Feb 21: Opening of Saint Louis
station

26
.4
26
.9
27
.5
28
.0
28
.3
29
.0
29
.0
29
.7
6.5%1.6% 2.4% 1.6% 1.4% 2.2% 0.2% 2.5%
FY 13/14 FY 14/15 FY 15/16 FY 16/17 FY 17/18 FY 18/19 FY 19/20 FY 20/21
Average Fare (THB/trip) Average Fare Growth (%YoY) ONE-DAY PASS FY19/20 AVG FARE THB 36.1
PURSE (Stored Value Card)* FY19/20 AVG FARE THB 28.6
12
▪ Can be adjusted no more than once every 18 months by making announcement to BMA and public 30 days in advance
▪ Must not exceed the Authorised fare
EFFECTIVE FARE
▪ Normal situation: upon change of Bangkok’s CPI >=5%, may adjust up to 7% (No approval required)
▪ Special situation: upon change of CPI (>= 9%), USD/THB foreign exchange rate, interest rate or electricity costs (BMA approval required)
AUTHORISED FARE
BTSGIF Investment Highlights3. Exclusive concession with flexibility to increase fares
BTSGIF General PresentationSection II: BTSGIF Investment Highlights
Fare adjustment mechanism Distance-based fare by number of stations
Historical average fare (excl. extraordinary events) Ridership by ticket types
FY20/21SJC
FY19/20 AVG FARE THB 33.130-DAY PASS (ADULT)*FY20/21 AVG FARE THB 28.4
Average fare (Avg fare) was excluded the extraordinary events* Counted as Rabbit Cards (67%)
30-DAY PASS (STUDENT)* FY20/21 AVG FARE THB 23.9
20.1
26.8
33.5
40.2
46.9
53.6
60.3
16.0
23.026.0
30.033.0
37.040.0
44.0
0 1 2 3 4 5 6 7 8 9 10 11 12 13
PRESENT EFFECTIVE FARE (OCT’17)
POTENTIAL FARE UPSIDE
AUTHORISED FARE (APR’13)
THB
NO. OF STATIONS
33%
32%
29%
5%1%
29%
33%
34%
4%0%
FY19/20

66.1%
41.9%
70.4%
29.6%
56.70%
-3.50%
BTS Sky Train* Hong Kong MTR**
FY 18/19 FY 19/20 FY 20/21
13
BTSGIF Investment Highlights4. Efficient operations with significant operating leverage
BTSGIF General PresentationSection II: BTSGIF Investment Highlights
Ridership and Fare growth EBITDA margin comparison with regional peers
Key costs breakdown Historical maintenance and overhaul
*FY ending 31 Mar 2019, 2020, 2021**FY ending 31 Dec 2018, 2019, 2020
215 219233 238 241 241 237
125
26.426.9
27.528.0
28.329.0 29.0
29.7
FY 13/14 FY 14/15 FY 15/16 FY 16/17 FY 17/18 FY 18/19 FY 19/20 FY 20/21
Core BTS SkyTrain Ridership (mn trips) Fare (THB per trip)
31% 33% 35% 36% 33.3% 34.4% 35.0%
25% 24% 21% 22% 19.8% 23.1%29.1%
21% 20% 18% 18%16.3%
18.5%20.0%2% 1%
1% 1%0.9%
0.9%
1.2%4% 4%4% 4%
2.9%3.5%
4.1%6% 6%5% 5%
5.3%4.6%
4.8%11% 11% 16% 15% 21.5% 15.1%5.8%
FY 14/15 FY 15/16 FY 16/17 FY 17/18 FY 18/19 FY 19/20 FY20/21
Capital expenditures
Administrative andother expenses Selling expenses
Property insurancepremium Utilities expenses
Maintenance costs
Employees expenses
339383 381 342 341 352 363 365
7995 75
85 124 115 91 94
FY 13/14 FY 14/15 FY 15/16 FY 16/17 FY 17/18 FY 18/19 FY 19/20 FY 20/21
General maintenance expenses Major overhaul expenses
(THB mn)

14
BTSGIF Investment Highlights5. Ample capacity for future growth with limited CAPEX
* Passenger per hour per direction based on 6-car trains and 2min frequency in sky line** Based on 4-car trains and 2.4min frequency in sky line (Sukhumvit Line)
*** The 3 new four-carriage trains (totaling 12 carriages) was added to the core line. Cost to be allocated to BTSGIF was approximately THB 652mn.
Fleet Expansion
X22*** 88 +42.3%
X24 96 +32.4%~THB 9.6bn
Total New Fleet X46 184
Previous Fleet NO. OF TRAINS TOTAL CARRIAGES CAPACITY INCREASE (CUMULATIVE)
INDICATIVE CAPEX (THB mn)
X35 105 FULLY PAID
X12 48
35
FULLY PAID
FULLY PAID
X5 20 FULLY PAID
Total Previous Fleet X52 208
Already fully operated in Feb 2014
Expect to order in 2017, expect to be delivered in 2019
Already fully delivered
SYSTEM DESIGN
CAPACITY
OF 50,000 PPHPD*
CURRENT
CAPACITY
OF 25,000** PPHPD
Already operated in May 2013
Already fully operated in Feb 2014
Already fully delivered
BTSGIF General PresentationSection II: BTSGIF Investment Highlights

15
BTSGIF Investment Highlights6. BTSC’s personnel with extensive experience in the mass transit business
The BTSC team is composed of personnel with extensive experience in the mass transit business
Reliable operations team
• 21-year track record
• All operations conducted in-house
• Service reliability recognised globally to be of a high standard
• Maintained full service operation and suffered no major asset damage during natural disasters
Impeccable safety record
• Lloyd’s Register: Certificate of Safety Management Systems
• OHSAS 18001:2007: Certificate of Cleanliness and Safety
• ISO9001:2008
• No major system accidents in the past 20-year operation
Strong management
expertise
• Mr. Keeree Kanjanapas
Executive Chairman
• Mr. Surapong Laoha-Unya
Executive Director / Chief Executive Officer / (Acting) Chief Administrative Officer
• Dr. Anat Arbhabhirama
Executive Committee Member / Chairman of Advisory Committee
• Mr. Kong Chi Keung
Executive Committee Member / Chief Financial Officer
BTSGIF General PresentationSection II: BTSGIF Investment Highlights
• Mr. Sumit Srisantithum
Executive Committee Member / Chief Operating Officer

16
BTSGIF Investment Highlights7. Substantial investment opportunities from accretive mass transit expansion
BTSGIF General PresentationSection II: BTSGIF Investment Highlights
Existing BTS SkyTrain (68.3km under O&M contracts) BTS Group’s Other Lines
BTSC to receive pre-determined annual O&M fee for the O&M for BTS existing contracts (O&M contracts and concession extension)
I. Green line extension zone I (ending 2 May 2042)Sukhumvit Extension (On Nut – Bearing) and
Silom Extension (Saphan Taksin – Bang Wa)
II. Green line extension zone II (ending 2 May 2042)
Sukhumvit Extension (Bearing – Kheha and Ha Yaek Lat Prao – Khu Khot)III. Core SkyTrain System after concession expires(12 years from 5 Dec 2029 to 2 May 2042)
44.8km of existing extensions & 23.5km of core network (post 2029)
77.5 km targeted lines by BTS Group for bidding in the next 4 yearsBTS TARGET ROUTE AUTHORITY DISTANCE
(KM) NO. OF
STATIONEXPECTED
OPERATING
GREEN EXT. (WESTERN)
BANG WA - TALING CHAN BMA 7.0 6 2025
LRT BANG NA - SUVARNABHUMI BMA 18.3 14 2024
GREY PHASE 1 WATCHARAPHON – THONG LO BMA 16.3 15 2024
ORANGE (E) THAILAND CULTURAL CENTER - MIN BURI
MRTA 22.5 17 2023
ORANGE (W) BANG KHUN NON - THAILAND CULTURAL CENTER
MRTA 13.4 11 2026
66.7km Gold Line, Pink & Yellow Monorail Lines
NORTHERN GREEN LINEMO CHIT - KHU KHOT19.0KM
LAT PHRAO – SAM RONG30.4KM
EXT. ZONE IIKHAE RAI – MIN BURI 34.5KM
PINK
YELLOW
EXT. ZONE I : 12.8KM
KRUNG THONBURI BTS STATION – KHLONG SAN 1.8KM
GOLD PHASE 1
Under construction
SAPHAN TAKSIN –BANG WA7.5KM
EXT. ZONE I
ONNUT – BEARING5.3KM
EXT. ZONE I
BEARING - KHEHA13.0KM
EXT. ZONE II
EXT. ZONE II : 32.0KM

17
Contents
BTSGIF General Presentation
Page
I. BTSGIF at a Glance 4
II. BTSGIF Investment Highlights 9
III. BTSGIF Performance Summary 18
IV. Conclusion 22
Appendix
Infrastructure Funds (IFFs) 24
BTSGIF’s Structure 28
BTSGIF’s Initial Assets and Right to Purchase 30
Existing Bangkok Mass Transit Network 31
Targeted Lines by BTS Group 32
BTSGIF Farebox Revenue and Costs Forecast 34
BTSGIF Performance 38
Saint Louis Station (S4) 46
Loss on Valuation of Investment 47
BTS Historical Fare Adjustment 50

18
BTSGIF Performance SummaryFinancial performance summary
1
Income Statement (THB mn) FY 16/17 FY 17/18 FY 18/19 FY 19/20 FY 20/21
Total income 4,593.5 4,712.4 4,620.7 4,818.7 2,112.6
Income from investment in NRTA 4,576.0 4,696.3 4,603.0 4,798.4 2,107.8
Total fund expense (THB mn) (110.9) (90.9) (95.3) (88.7) (75.2)
Net investment income (THB mn) 4,482.6 4,621.5 4,525.4 4,730.0 2,037.4
Total distribution available to unitholders 4,498.8 4,621.5 4,525.4 4,690.0 1,785.4
Balance Sheet (THB mn)
NAV 67,025.8 66,588.0 60,119.3 53,408.0 45,321.9
Interest-bearing Debt - - - - -
Per unit Data (THB per unit)
NAV per unit 11.5801 11.5045 10.3868 9.2273 7.8303
Dividend per unit 0.772 0.798 0.611 0.284 -
Capital return per unit 0.000 0.000 0.169 0.491 0.308
Total distribution available to unitholdersper unit
0.772 0.798 0.780 0.775 0.308
Capital per unit (beginning period) 10.611 10.611 10.611 10.442 9.951
Key ratio
Dividend yield* 7.3% 7.5% 5.8% 2.7% -
Debt/Equity No leverage
* Dividend per unit / capital per unit
For FY 20/21, total income decreased by 56.2% YoY from the decrease in income from investment in NRTA which was largely caused by the decrease in ridership from the impact of the COVID-19 pandemic situation which outweighing the feeder impact from the newly opened stations in the Northern Green Line Extension and Saint Louis station.
BTSGIF paid its total distribution to unitholders in 2 formsi) dividend payment (at least 90% of adjusted net profit
if the Fund has sufficient retained earnings)ii) capital return from amortisation of fund issuance cost (for FY
13/14 to FY 15/16) and from a decrease in value of Investment.
1
2
3
2
3
Currently, BTSGIF has no interest-bearing debt. Per IFF criteria, BTSGIF is able to leverage at maximum of 3 times of equity.
Core network ridership and fare*
BTSGIF General PresentationSection III: BTSGIF Performance Summary
* The fare was adjusted for extraordinary events for comparison purpose.
215 219 233 238 241 241 237
125
26.4 26.927.5 28.0 28.3
29.0 29.0 29.7
FY 13/14 FY 14/15 FY 15/16 FY 16/17 FY 17/18 FY 18/19 FY 19/20 FY 20/21
Core BTS SkyTrain Ridership (mn trips) Fare (THB per trip)

3,707 3,890 4,392 4,499 4,622 4,525 4,690
1,785
4.9%12.9%
2.4% 2.7% -2.1% 3.6%
-61.9%
FY 13/14 FY 14/15 FY 15/16 FY 16/17 FY 17/18 FY 18/19 FY 19/20 FY 20/21
Total distribution available to unitholders
Total distribution available to unitholders Growth (%YoY)
3,353 3,520 4,021 4,483 4,622 4,525 4,730
2,037
5.0%14.2% 11.5%
3.1% -2.1% 4.5%
-56.9%
FY 13/14 FY 14/15 FY 15/16 FY 16/17 FY 17/18 FY 18/19 FY 19/20 FY 20/21
Net investment income Net investment income Growth (%YoY)
5,470 5,874 6,397 6,636 6,821 6,962 6,814
3,715
7.4% 8.9% 3.7% 2.8% 2.1% -2.1%
-45.5%
FY 13/14 FY 14/15 FY 15/16 FY 16/17 FY 17/18 FY 18/19 FY 19/20 FY 20/21
Farebox revenue Farebox revenue Growth (%YoY)
19
BTSGIF Performance SummaryKey financial highlights
THB mn THB mn
THB mn THB mn
FY 13/14 started from 17 April 2013 to 31 March 2014 **Total distribution available to unitholders includes capital return (paid from excess cash of fund)
Revenue (gross farebox revenue) Income from investment in NRTA
Net investment income* Total distribution available to unitholders**
FY 13/14 started from 17 April 2013 to 31 March 2014FY 13/14 started from 17 April 2013 to 31 March 2014
FY 13/14 started from 17 April 2013 to 31 March 2014
*Income from investment in NRTA less fund expenses
BTSGIF General PresentationSection III: BTSGIF Performance Summary
3,774 3,957 4,475 4,576 4,696 4,603 4,798
2,108
4.9%13.1%
2.2% 2.6% -2.0% 4.2%
-56.1%
FY 13/14 FY 14/15 FY 15/16 FY 16/17 FY 17/18 FY 18/19 FY 19/20 FY 20/21
Income from investment in NRTA (EBITDA)
Income from investment in NRTA (EBITDA) Growth (%YoY)

20
BTSGIF Performance SummaryConstant return to unitholders through dividend payment and capital return
No. of Unit % of total
1 BTS GROUP HOLDINGS PCL 1,929,000,000 33.3%
2 BANGKOK LIFE ASSURANCE PCL 377,489,000 6.5%
3 LAND AND HOUSE BANK PCL 277,651,100 4.8%
4 SOCIAL SECURITY OFFICE 243,817,100 4.2%
5 LH FINANCIAL GROUP PUBLIC COMPANY 165,460,800 2.9%
6 KRUNGTHAI-AXA LIFE INSURANCE PUBLIC COMPANY LIMITED
139,848,400 2.4%
7 SOUTH EAST ASIA UK (TYPE C) NOMINEES LTD 130,755,624 2.3%
8 MR.KEEREE KANCHANAPAS 123,703,580 2.1%
9 LAND AND HOUSE SECURITIES PCL 104,757,800 1.8%
10 MUANG THAI LIFE INSURANCE PCL 70,218,200 1.2%
BTSGIF General PresentationSection III: BTSGIF Performance Summary
- Dividend policy: in aggregate for each financial year, payout shall not be less than 90%
of adjusted net profit1, if the Fund has sufficient retained earning (more than once a year)
- Capital return Policy: to return excess liquidity (if any; i.e. cash from amortisation of
fund issuance costs, unrealised loss (non-cash expense)) by way of decreasing unit value.
Distribution to unitholders
(Total distribution of THB 31.8bn or THB 5.499 per unit since IPO)
Top 10 unitholders (1 Mar 2021)
Unitholders breakdown by type (1 Mar 2021)
1 Adjusted net profit = BTSGIF net profit less unrealised gain from the appraisal of assets and other adjustment items
to be in line with the cash-basis of BTSGIF
DISTRIBUTION
Total 5,788 mnshares
BTS Group, 33.3%
Institutional -Thai, 37.1%
Individual -Thai, 23.9%
Institutional -Foreign, 5.3%
Individual -Foreign, 0.4%
0.000 0.125 0.064 0.000 0.000 0.169
0.4910.308
0.579
0.606 0.692 0.772 0.798 0.611 0.284
0.000
0.579
0.731 0.756 0.772 0.798 0.7800.775
0.308
FY 13/14 FY 14/15 FY 15/16 FY 16/17 FY 17/18 FY 18/19 FY 19/20 FY 20/21
Capital Return Dividend

21
Contents
BTSGIF General Presentation
Page
I. BTSGIF at a Glance 4
II. BTSGIF Investment Highlights 9
III. BTSGIF Performance Summary 18
IV. Conclusion 22
Appendix
Infrastructure Funds (IFFs) 24
BTSGIF’s Structure 28
BTSGIF’s Initial Assets and Right to Purchase 30
Existing Bangkok Mass Transit Network 31
Targeted Lines by BTS Group 32
BTSGIF Farebox Revenue and Costs Forecast 34
BTSGIF Performance 38
Saint Louis Station (S4) 46
Loss on Valuation of Investment 47
BTS Historical Fare Adjustment 50

Investment Highlights
Delivering on Investors Expectation• Yield through dividend payment and capital return • Tax benefit (exempt 10% income tax from dividend receipt for 10 years for individual)
Security• Creditor step-in rights • 1/3 of BTSC board membership are nominated by the Fund• BTSG pledges all of its BTSC shares (97.5%) to guarantee BTSC’s obligations
Sponsor Alignment of Interest• 1/3 holding by BTS Group • 10 years lock up until 2023
Growth Opportunities• Resilience ridership and flexibility to increase fare • Acquisition growth:-
▪ Call option and RoFR for BTS existing and future lines - 68.3km (44.8km of existing extensions & 23.5km of core network post 2029) under O&M contracts - 66.7km BTS Group’s other lines- 77.5km ongoing projects targeted by BTS Group
▪ Non-BTS infrastructure projects with strong cashflow potential
Ability to Leverage• Able to leverage up to 3 times of equity
22
Conclusion
BTSGIF General PresentationSection IV: Conclusion

23
Contents
BTSGIF General Presentation
Page
I. BTSGIF at a Glance 4
II. BTSGIF Investment Highlights 9
III. BTSGIF Performance Summary 18
IV. Conclusion 22
Appendix
Infrastructure Funds (IFFs) 24
BTSGIF’s Structure 28
BTSGIF’s Initial Assets and Right to Purchase 30
Existing Bangkok Mass Transit Network 31
Targeted Lines by BTS Group 32
BTSGIF Farebox Revenue and Costs Forecast 34
BTSGIF Performance 38
Saint Louis Station (S4) 46
Loss on Valuation of Investment 47
BTS Historical Fare Adjustment 50

1. Rail mass transit
2. Power plant
3. Water supply
4. Toll road/ Express way
5. Airport
6. Deep seaport
7. Telecommunication
8. Alternative energy
9. Water supply management/ Irrigation
10. Natural disaster preventive system
11. Waste management
12. Multi-infrastructure relevant to
11 types above
24
Infrastructure Funds (IFFs)Appendix: Background of Infrastructure Fund
An Infrastructure Fund is an entity that raises capital
from the public to invest in 12 infrastructure assets.
Infrastructure Assets
Infrastructure Fund
Public Investors
Assets Owner
Investor
Purpose of Infrastructure Fund
Government and Capital Market Regulatory Bodies’ initiative
• To develop the country's infrastructure
• To allow access to infrastructure projects for a broader range of investors
• New financing alternative in order to speed up country’s infrastructure projects and to release public debt burden
✓ IFF is exempted from corporate income tax in Thailand
✓ Dividends received by individuals (Thailand and non-Thai) will be exempt from income tax for 10 years
✓ Payout of not less than 90% of adjusted net income p.a.
Tax efficient investment vehicle that allows public market participants (institutional and retails) access to yield generating infrastructure investments.
What is an Infrastructure Fund?
BTSGIF General PresentationAppendix: Background of Infrastructure Fund
12 categorised assets in Infrastructure Fund
Key benefits of Infrastructure Fund
24

25
Infrastructure Funds (IFFs)Appendix: Key features of IFFs (an alternative tax efficient structure)
Infrastructure Fund (IFF) Property Fund (PFUND) Real Estate Investment Trust (REIT)
Permissible investment assets • 12 specified infrastructure assets and• Able to invest in green field projects
i) not exceed 30% of total assets and sell to public (>= 500 buyers, list the investment units in SET)ii) exceed 30% of total assets and sell to high net worth investors (HNW) only (>= 35 buyers, must list the investment units within 3 years after completion)
Invest in specified types of real estates under positive list (whether leasehold or freehold)
• Invest in specified real estates or• Wholly own (not less than 99% of shares) a
company established as the REIT (property holding business)
• Able to invest in green field projects (with some limitations)
Foreign Investment Allowed (but only for projects that benefits widely to public in Thailand)
Not allowed Allowed
Investment Requirement Must invest at least 75% of total asset value ininfrastructure assets no later than 6 months from the fund registration date
Must invest at least 75% of NAV in real estatesor the leasehold rights of real estates
Must invest at least 75% of total asset value in real estates or the leasehold rights of real estates
Minimum paid-up capital after the offering (THB mn)
THB 2,000mn THB 500mn THB 500mn
Leverage Not exceed 3 times of equity Not exceed 10% of net asset value Not exceed 35% of total asset value(given no investment credit rating)Not exceed 60% of total asset value (the REIT obtains an investment credit rating)
Dividend payout Minimum of 90% of annual adjusted net profit Minimum of 90% of annual adjusted net profit Minimum of 90% of annual adjusted net profit
Tax implication(investor level)
For individual (Thai & foreign): exempt tax on dividend for 10 years / no tax on capital gainFor Thai corporate: 10% WHT on dividend for non-listed company / 20% CIT for dividend (Exempt 50% for non-listed & 100% for listed company if holding units for not less than 3 months before and after payment date) / 20% CIT for capital gainFor foreign corporate: 10% WHT on dividend / 15% WHT on capital gain
For Thai individual: 10% WHT on dividend / no tax on capital gainFor Thai corporate: 10% WHT on dividend / 20% CIT for dividend / 20% CIT for capital gainFor foreign individual & corporate: N/A
For individual (Thai & foreign): 10% WHT on dividend / no tax on capital gainFor Thai corporate: 10% WHT on dividend / 20% CIT for dividend / 20% CIT for capital gainFor foreign corporate: 10% WHT on dividend / N/A for capital gain
Total market capitalisation* THB 311bn (currently 9 funds in Thailand) THB 347bn (currently 59 funds/REITs in Thailand)
BTSGIF General PresentationAppendix: Key features of IFFs
*As of 31 May 2021

Sector Transportation & Logistics Info & Communication Technology Energy & Utilities Energy & Utilities
Sponsor Name / % of shares*
BTS Group Holding Public Co., Ltd (33.33%)
Jasmine International Public Co., Ltd(19.00%)
Buriram Sugar Public Co., Ltd (33.05%)
Super Energy Public Co., Ltd (20.00%)
First-day Trade 19 Apr 2013 16 Feb 2015 7 Aug 2017 21 Aug 2019
Size of fund Cap (THB bn)*
56.1 78.8 3.1 5.1
Par Value (THB)* 9.692 9.0000 and 9.8516 8.73 9.96
No. of Units (mn) 5,788 8,000 350 515
Market Cap** (THB bn)
28.8 77.2 2.2 5.6
Underlying Asset Future net farebox revenue to begenerated from the operation ofthe Core BTS SkyTrain System untilthe Concession Expiry Date, which isDec 2029
Ownership of 980,000 core kilometersfiber optic network for broadbandinternet of Triple T Broadband Plc. (TTTBB).The lease of 80% of fiber optic networkwill expire in Feb 2026.The remaining 20%, JASIF can renew the contract every 3 years
Right to the Net Revenue Purchaseand Transfer Agreement of BuriramEnergy Co., Ltd. (expiry in Aug 2028)
and Buriram Power Co., Ltd.,(expiry in April 2035), subsidiariesof Buriram Sugar Public CompanyLimited (BRR)
Right to the Net Revenue Purchaseand Transfer Agreement of17 Aunyawee Co., Ltd. and HealthPlanet Management (Thailand)Co., Ltd. (expiry in Dec 2041),subsidiaries of Super Energy PublicCompany Limited (SUPER)
Mgmt Company BBLAM BBLAM BBLAM BBLAM
Infrastructure Funds (IFFs) Appendix: Infrastructure Funds in Thailand
26BTSGIF General PresentationAppendix: Infrastructure Funds in Thailand
* Information as of latest available date on SET** Information as of 31 May 2021

ABPIF DIF EGATIF TFFIF KBSPIF
Sector Energy & UtilitiesInfo & Communication Technology
Energy & Utilities Transportation & Logistics Energy & Utilities
Sponsor Name / % of shares*
AMATA B. Grimm Power Co., Ltd (29.97%)
TRUE Corporation Public Co., Ltd (23.38%)
Electricity Generating Authority of Thailand (25.00%)
Expressway Authority of Thailand(MOF held 10.00%)
Kornburi Sugar Public Co., Ltd.(15.00%)
First-day Trade 27 Sep 2013 27 Dec 2013 13 Jul 2015 31 Oct 2018 24 Aug 2020
Size of fund Cap (THB bn)*
1.6 106.3 20.3 45.5 2.8
Par Value / (THB)*
2.584 10.00 9.718 9.9569 10.00
No. of Units (mn) 600 10,631.7 2,085.5 4,570 280
Market Cap** (THB bn)
1.5 129.7 25.2 38.2 2.8
Underlying Asset Revenue Sharing Agreement with “B.Grimm 1 and
B.Grimm 2” which carry out power plant business until Sep 2019 and Sep 2022 respectively in AmataNakorn Industrial Estate, Chonburi
Right to the rental revenues of 6,332 telecommunication towers and ownership of 9,727 telecommunication towers, core fiber-optic cable grids and related transmission equipment (FOC system) and long-term lease of core fiber-optic cable
Future Availability Revenue obtainable from North Bangkok Power Plant Block 1, a Contracted Capacity of 670 MW, which is operated and owned by EGAT, for the period of 20 years
Right to receive 45% of the Net Toll Revenue collected from the initial expressways for a period of 30 years from the Transfer Date in the Revenue Transfer Agreement or RTA
Right to receive 62% of the Revenue from small power plant owned by KKP under power purchase agreement (PPA) with EGAT (22 MW) and KBS (3 MW) for the remaining period of approx. 19 years
Mgmt Company KASSET SCBAM KTAM KTAM & MFC KTAM
Infrastructure Funds (IFFs)Appendix: Infrastructure Funds in Thailand (Cont’)
27BTSGIF General PresentationAppendix: Infrastructure Funds in Thailand
* Information as of latest available date on SET** Information as of 31 May 2021

28
BTSGIF’s StructureAppendix: Transaction structure
BTSGIF General PresentationAppendix: Transaction structure
Transaction Structure
BTSC is awarded a concession from BMA
• BTSC has rights to operate the system and to receive revenue from the core 23.5 km (in full) from providing services to the public.
• At the end concession, BTSC will need to transfer assets to BMA.
• BTSC also provides O&M service to BMA to operate extension part of sky-train and is thus entitled to receive O&M fee from BMA
BTSGIF purchases all future net revenue from BTSC until the end of concession
• BTSC continues to operate the system under the concession
• BTSC will transfer net revenue to BTSGIF (i.e.revenues less operating expenses and capital expenditure)
Conceptual Framework
BTSGIF is entitled to receive farebox revenue from BTSC, net of relevant operating cost and capital
expenditure
Net Revenue Operating Assets
BTSC owns assets (including new assets invested during BTSGIF life) and some assets to be
transferred to BMA at the end of concession
BTSGIF
Public Investors
66.7%
BTSG
BTSC
SkyTrainBusiness
33.3%
Receive NetFuture Revenue
Transfer of
Future Net Revenue
Cash payment of purchase price
Other BTSG’sBusinesses
Other BTSC’sBusinesses
Key Protection Mechanism for BTSGIF Investor
Right to participate in corporate governance of BTSC
and its business
Protection 1
Contractual obligations / covenants on BTSC and BTSG
Protection 2
Step-in-mechanism
Protection 3

29
BTSGIF’s StructureAppendix: Structure of Step-in Mechanism
BTSGIF General PresentationAppendix: Structure of Step-in Mechanism
BTSGIF BTSG
3. Share Sales and Purchase Agreement
• BTSGIF has its right to buy BTSC’ shares
• Exercisable upon EOD under the Net Revenue Purchase and
Transfer Agreement, e.g. breach agreement by either BTSG or
BTSC
4. Share Pledge
• BTSG pledges shares in BTSC to BTSGIF and share certificates
will be deposited with the Trustee
• Enforceable by BTSGIF upon breach of BTSG Undertaking or
BTSG Corporate Guarantee
BTSGIF can step-in in case of default under 1 or 2
2. Sponsor Support and Guarantee Agreement
• BTSG to maintain shareholding in BTSC and not to create any encumbrances over BTSC’s shares
• To vote for person nominated by BTSGIF to be BTSC board of director
• BTSG to pledge BTSC’s shares (97.5%) to guarantee obligations
• Guarantee BTSG’s obligation under the Net Revenue Purchase and Transfer Agreement (Liability to BTSGIF limited to the transfer or value of BTSC shares)
• BTSGIF has right to purchase and right of first refusal to invest in BTSG’s assets
BTSG BTSGIF
1. Net Revenue Purchase and Transfer Agreement
• BTSC to deliver net cash from the core BTS skytrain business to BTSGIF
• BTSGIF can propose to be BTSC’s board of director for 1/3
• Reserved matters shall be approved by at least 2 director representatives from the Fund
• BTSGIF approves the operating budget
• BTSGIF has right to purchase and right of first refusal to invest in BTSC’s assets
• Criteria for new borrowing and new investment of BTSC
BTSC BTSGIF
Agr
eem
ent
Step
-in
Mec
han
ism

30
BTSGIF’s Initial Assets and Right to PurchaseAppendix: Initial assets and right to purchase
BTSGIF General PresentationAppendix: Initial Assets and Right to Purchase
▪ 30-year concession (ending 4 Dec 2029) to exclusively collect ridership fare (and bear related expenses and capital expenditure)
▪ 23 stations over 23.5 km in CBD: Connecting Bangkok’s most important business and tourist destinations
▪ All investments made by BTSC: Including civil works, E&M and trains (except land acquisition) from private sector sources
▪ No revenue sharing or concession fees for BMA
BTSC to receive pre-determined annual O&M fee for the operation and maintenance of the system
− Green line extension (ending 2 May 2042)
o Sukhumvit Extension (On Nut – Kheha / Mo Chit – Khu Khot)
o Silom Extension (Saphan Taksin – Bang Wa)
− Core SkyTrain System after concession expires (ending 2 May 2042)
DARK GREENMO CHIT – ON NUT17.0km
LIGHT GREENNATIONAL STADIUM –SAPHAN TAKSIN6.5km
SILOM EXTENSIONSaphan Taksin – Bang Wa7.5km
SUKHUMVIT EXTENSIONOn Nut – Kheha
18.3km
CORE NETWORK
Initial assets (Core BTS SkyTrain system ) Right to purchase (O&M Business)
SUKHUMVIT EXTENSIONMo Chit – Khu Khot
19.0km

LINE ROUTEDISTANCE
(KM)OPERATING
SINCE
DARK GREEN (CORE) MO CHIT – ON NUT 17.0 DEC 99
LIGHT GREEN (CORE) NATIONAL STADIUM – SAPHAN TAKSIN 6.5 DEC 99
BLUE BANG SUE – HUA LAMPHONG 20.0 JUL 04
LIGHT GREEN (EXT.) SAPHAN TAKSIN – WONGWIAN YAI 2.2 MAY 09
AIRPORT LINK (RED LINE) PHAYATHAI – SUVARNABHUMI 28.5 AUG 10
DARK GREEN (EXT.) ON NUT – BEARING 5.3 AUG 11
LIGHT GREEN (EXT.) WONGWIAN YAI – BANG WA 5.3 DEC 13
PURPLE KHLONG BANG PHAI – TAO POON 23.0 AUG 16
DARK GREEN (EXT.) BEARING – SAMRONG 1.8 APR 17
BLUE (EXT.) TAO POON – BANG SUE 1.2 AUG 17
DARK GREEN (EXT.) SAMRONG – KHEHA 11.2 DEC 18
DARK GREEN (EXT.) MO CHIT – HA YAEK LAT PHRAO 1.8 AUG 19
BLUE (EXT.) HUA LAMPHONG – LAK SONG 16.0 SEP 19
DARK GREEN (EXT.) HA YAEK LAT PHRAO – KASETSART U. 3.2 DEC 19
BLUE (EXT.) TAO POON – THA PRA 10.8 DEC 19
DARK GREEN (EXT.) KASETSART U. – WAT PRA SRI 4.2 JUN 20
DARK GREEN (EXT.) WAT PRA SRI – KHO KHOT 9.8 DEC 20
GOLD KRUNG THON BURI – KLONG SAN 1.8 DEC 20 *BEM ridership excluded purple line. BTS ridership, BEM ridership and ARL ridership were based on company’s website as of 2019.
31BTSGIF General PresentationAppendix: Existing Bangkok Mass Transit Network
CORE NETWORK
AVERAGE WEEKDAY RIDERSHIP MARKET SHARE IN 2019 (JAN-DEC)
Total Average Weekday Ridership of 1.3mn tripsEXTENSIONS TO OUR CURRENT CORE NETWORK
Existing Bangkok Mass Transit Network Total of 169.6km, 124 stations (2 common stations, Siam and Tao Poon)
DARK GREENKHU KHOT –KHEHA54.3km 47 stations
ARLPHAYATHAI -SUVARNABHUMI28.5km 8 stations
LIGHT GREENNATIONAL STADIUM –BANG WA14.0km 14 stations
BLUELAK SONG - HUA LAM PONG – BANG SUE – THA PRA48.0km 38 stations
PURPLEKHLONG BANG PHAI – TAO POON23.0km 16 stations
787,000 (61%)
433,000 (33%)
79,000 (6%)
GOLDKRUNG THON BURI –KLONG SAN1.8km 3 stations

32
Targeted Lines by BTS Group Focused on 5 lines in next 4 years
BTSGIF General PresentationAppendix: Targeted Lines by BTS Group
77.5km interested line for bidding in next 4 years
Line Route AuthorityTargeted operate
yearConstruction
progressNo. of station
Distance (km)
GREEN EXT. (WESTERN) BANG WA - TALING CHAN BMA 2025 6 7.0
LRT BANG NA - SUVARNABHUMI BMA 2024 14 18.3
GREY (PHASE I) WATCHARAPHON - THONG LO BMA 2024 15 16.3
ORANGE (EASTERN) THAILAND CULTURAL CENTER - MIN BURI MRTA 2023 UNDER CONSTRUCTION 17 22.5
ORANGE (WESTERN) BANG KHUN NON - THAILAND CULTURAL CENTER MRTA 2026 11 13.4
BLUE BANG KHAE - BHUDHAMONTHON 4 MRTA n/a 4 8.0
PURPLE (SOUTHERN) TAO POON - RAT BURANA MRTA 2026 17 23.6
DARK RED BANG SUE – HUA LUM PHONG SRT 2024 5 6.5
DARK RED BANG SUE - RANGSIT SRT 2021 UNDER CONSTRUCTION 8 26.3
LIGHT RED BANG SUE – MAKKASAN – HUAMAK SRT 2024 9 19.0
LIGHT RED BANG SUE – TALING CHAN SRT 2021 UNDER CONSTRUCTION 4 15.0
Total (km) 175.9
77.5km
EXTENSIONS TO BTS CURRENT LINES LINES CONNECTING TO BTS LINES
Sources: Office of Transport and Traffic Policy and Planning, Mass Rapid Transit Authority of Thailand, Bangkok Metropolitan Administration, State Railway of Thailand, Ministry of Transport, Bangkok Expressway and Metro Public Company Limited (BEM), BTS Group Holdings Public Company Limited (BTS)

33
GREY LINE• Watcharaphol – Rama 9 Bridge (26.0km)• Expected bidding (phase I): 2021• Target operation (phase I): 2024
Phase I: Watcharaphol – Thong Lo (16.3km)
LIGHT RAIL TRANSIT (LRT)• Bang Na – Suvarnabhumi (18.3km).• Expected bidding: 2021• Target operation: 2024WESTERN GREEN LINE EXTENSION
• Bang Wa – Taling Chan (7.0km)• Expected O&M award: 2022• Target operation: 2025
ORANGE LINE• Bang Khun Non – Min Buri (35.9km)• Expected O&M award: 2021• Target operation: 2023 (eastern) and
2026 (western)
Sources: Office of Transport and Traffic Policy and Planning, Mass Rapid Transit Authority of Thailand,Bangkok Metropolitan Administration, Ministry of Transport, BTS Group Holdings PCL.
Targeted Lines by BTS GroupTargeted lines map
BTSGIF General PresentationAppendix: Targeted Lines by BTS Group

11
0
34
BTSGIF Farebox Revenue and Costs Forecast Appendix: Forecasted Ridership until FY 29/30 by Systra MVA (Thailand)
Projected ridership
CAGRRidership
(FY 18/19A – FY 29/30)
3.3%
CAGRFare
(FY 18/19A – FY 29/30)
2.1%
CAGRFB Revenue
(FY 18/19A – FY 29/30)
5.5%
CAGRNet FB Revenue
(FY 18/19A – FY 29/30)
7.4%
Note: These projections were derived from valuation report by C.I.T. Appraisal Co., Ltd. (CIT) which the forecast and assumptions were based on Systra MVA (Thailand), except for FY 21/22F was based on BTSC. FY 13/14A, ridership was for the full year of FY 13/14. FY29/30F (1 Apr 29 – 4 Dec 29), ridership growth was prorated to the full year.
Actual ridership
21
5
21
9
23
3
23
8
24
1
24
1
23
7
12
5
13
8
21
6 25
5
27
5
29
4
30
8
32
8
33
3
23
4
1.9% 6.3% 2.4% 1.3% -0.1% -1.7%
-47.3%
10.4%
56.7%
17.9%8.2% 6.9% 4.6% 6.4% 1.6% 3.4%
Forecasted ridership YoY growth (%)
BTSGIF General PresentationAppendix: Forecasted Ridership until FY 29/30

4,0
16
Actual farebox revenue
35
BTSGIF Farebox Revenue and Costs Forecast Appendix: Forecast of Farebox Revenue until FY 29/30 by Systra MVA (Thailand)
Projected farebox revenue derived from valuation report
Note: These projections were derived from valuation report by C.I.T. Appraisal Co., Ltd. (CIT) which the forecast and assumptions were based on Systra MVA (Thailand), except for FY 21/22F was based on BTSC. FY 13/14A, farebox revenue was for the full year of FY 13/14. FY29/30F (1 Apr 29 – 4 Dec 29), farebox revenue growth was prorated to the full year.
5,6
77
5,8
74
6,3
97
6,6
36
6,8
21
6,9
62
6,8
14
3,7
15
4,1
15
6,7
30
7,8
83
9,0
40
9,7
99
10
,71
5
11
,35
0
12
,03
8
8,5
12
3.5% 8.9% 3.7% 2.8% 2.1%-2.1%
-45.5%
10.8%
63.6%
17.1% 14.7% 8.4% 9.4% 5.9% 6.1% 4.1%
Forecasted farebox revenue Farebox revenue growth (%YoY)
BTSGIF General PresentationAppendix: Forecasted Farebox Revenue until FY 29/30

3,2
54
36
BTSGIF Farebox Revenue and Costs ForecastAppendix: Projected Net Cashflow until FY 29/30 from Valuation Report
Actual net cashflow
Note: Net cashflow has deducted additional investment costs for the construction and improvement of S4 and S6 stations.These projections were derived from valuation report by C.I.T. Appraisal Co., Ltd. (CIT) which the forecast and assumptions were based on Systra MVA (Thailand) and Infra Asia (Thailand) Ltd, except for FY 21/22F was based on BTSC. FY29/30F (1 Apr 29 – 4 Dec 29), net Cashflow growth was prorated to the full year.
Projected net cashflow derived from valuation report
3,7
74
3,9
57
4,4
75
4,5
43
4,6
96
4,6
03
4,7
58
1,8
56
2,3
26
4,2
42
5,4
65
6,6
54
7,3
63
8,1
54
8,7
19
9,5
83
6,8
79
4.9% 13.1%1.5% 3.4% -2.0% 3.4%
-61.0%
25.3%
82.4%
28.8% 21.8%10.6% 10.7% 6.9% 9.9% 5.6%
Forecasted net cashflow per Systra MVA (Thailand) & Infra Asia (Thailand) Net cashflow growth (YoY)
BTSGIF General PresentationAppendix: Forecasted Net Cashflow until FY 29/30

33 40 252 60 220 120 - - - - - --251 150 84
161 6 - -75 207 220
83 171 424 143 87
88 148 145
162 145 182 173 139 78
1,6
20
1,7
10
1,7
02
1,7
27
1,8
04
1,8
51
1,7
11
1,5
14
1,6
41
2,1
20
2,1
53
2,2
24
2,2
91
2,3
79
2,4
58
2,3
17
1,5
55
1,696 1,917 1,922
2,093 2,125 2,359
2,056 1,859 1,789
2,488 2,418 2,386 2,436 2,561 2,631 2,456
1,633
FY 13/14A FY 14/15A FY 15/16A FY 16/17A FY 17/18A FY 18/19A FY 19/20A FY 20/21A FY 21/22 FY 22/23 FY 23/24 FY 24/25 FY 25/26 FY 26/27 FY 27/28 FY 28/29 FY 29/30
OPEX CAPEX (others) CAPEX (rolling stocks) Additional Investment
37
BTSGIF Farebox Revenue and Costs Forecast Appendix: Costs and additional investment projection
Key costs guidance
Costs and Additional Investment Projection
Sources: Estimated based on valuation report from C.I.T. Appraisal Co., Ltd. (CIT) which the forecast and assumptions were based on Infra Asia (Thailand) Ltd.’s report and updated CAPEX and additional investment from BTSC. Except for FY 21/22 was based on BTSC.
Unit: THB mn
*Maintenance expenses mainly composed of Siemens lump-sum contracts for current and 3 new trains, expected THB 383mn p.a. (avg on a smooth basis) and the non-Siemens lump-sum contract (in-house P&C maintenance).
Source: Estimated base on Infra Asia forecast and updated CAPEX and additional investment from BTSC. Except FY 21/22 total costs were based on BTSC.
Normalised guidance p.a. (THB mn)from FY 21/22 to FY 28/29 (8 years)
% of total
OPEX 2,198 92%
Maintenance expenses* 763 32%
Staff cost 778 33%
Utilities expense 413 17%
Others 244 10%
CAPEX (others) 148 6%
Additional Investment 50 2%
Total costs and additional investment 2,396 100%
BTSGIF General PresentationAppendix: Costs and Additional Investment Projection

38
BTSGIF PerformanceAppendix: Income Statement
(Unit: THB mn)FY 20/21(1 Apr 20-31 Mar 21)
FY 19/20(1 Apr 19-31 Mar 20)
FY 18/19(1 Apr 18-31 Mar 19)
FY 17/18(1 Apr 17 -31 Mar 18)
Income from investment in NRTA 2,107 4,799 4,603 4,696
Interest income 5 20 18 16
Total Income 2,112 4,819 4,621 4,712
Fund management fee and expenses 67 74 85 81
Other expenses 8 15 10 10
Total Expenses 75 89 95 91
Net Investment Income 2,037 4,730 4,525 4,621
Total gains (losses) on valuation of investments (7,872) (6,730) (6,300) (400)
Changes in Net Assets resulting from Operations (5,835) (2,000) (1,775) 4,221
Net Investment Income Margin (%) 96% 98% 98% 98%
THB/Unit THB/Unit THB/Unit THB/Unit
Net income available to the unitholders (to be paid as dividend if the Fund has sufficient retained earnings) (5,835) (1.008) (2,000) (0.345) (1,775) (0.306) 4,221 0.729
Add back excess liquidity from loss on valuation of investments* 7,620 1.316 6,690 1.155 6,300 1.088 400 0.069
Total distribution available to unitholders 1,785 0.308 4,690 0.810 4,525 0.781 4,621 0.798
BTSGIF General PresentationAppendix: BTSGIF Income Statement
* Net from investment cost for Saint Louis station of THB 252mn in FY 20/21 and THB 40mn in FY 19/20

39
BTSGIF PerformanceAppendix: Income Statement
BTSGIF General PresentationAppendix: BTSGIF Income Statement
Unit (THB mn) 4Q 20/21 4Q 19/20 % YoY 3Q 20/21 % QoQ
Income from investment in NRTA
(see details in slide 41)424 978 (57)% 805 (47)%
Interest income 1 4 (79)% 1 (37)%
Total Income 425 982 (57)% 806 (47)%
Fund management fee and expenses 16 17 (7)% 16 1%
Other expenses 2 3 (8)% 1 115%
Total Expenses 18 20 (7)% 17 9%
Net Investment Income 407 962 (58)% 789 (48)%
Total net losses on valuation of investments (5,642) (5,907) 4.5% (2,965) (90)%
Changes in Net Assets resulting from Operations (5,235) (4,945) (6)% (2,176) (141)%
Net Investment Income Margin (%) 96% 98% 98%
THB/Unit THB/Unit THB/Unit
Net income available to the unitholders(to be paid as dividend if the fund has sufficient retained earnings)
(5,235) (0.904) (4,945) (0.854) (6)% (2,176) (0.375) (141)%
Add back excess liquidity from loss on valuation of investments*
5,520 0.953 5,890 1.017 (6)% 2,900 0.500 90%
Total distribution available to unitholders 285 0.049 945 0.163 (70)% 724 0.125 (61)%
* Net from investment cost for Saint Louis station of THB 122mn in 4Q20/21, THB 18mn in 4Q19/20 and THB 66mn in 3Q20/21.

(Unit: THB mn) FY 20/21
(1 Apr 20 –31 Mar 21)
FY 19/20(1 Apr 19 –31 Mar 20)
% YoYFY 18/19
(1 Apr 18 –31 Mar 19)
% YoY
Farebox revenues 3,715 6,814 (45)% 6,963 (2)%
Total O&M costs 1,607 2,016 (20)% 2,360 (15)%
Employees expenses 562 693 (19)% 786 (12)%
Maintenance costs 467 466 0% 468 (0)%
Utilities expenses 322 373 (14)% 384 (3)%
Property insurance premium 19 17 12% 21 (20)%
Selling expenses 67 70 (4)% 68 (8)%
Administrative and other expenses 77 93 (17)% 124 (21)%
Capital expenditures 93 304 (70)% 508 (40)%
Total income from investment in NRTA 2,108 4,798 (56)% 4,603 4%
Income from investment in NRTA margin (%) 57% 70% 66%
40
BTSGIF PerformanceAppendix: Total Income from Investment in NRTA
BTSGIF General PresentationAppendix: BTSGIF Total Income from Investment in NRTA
1
1 In FY 18/19, farebox revenue was after deducting net free-trip allowance to passengers from train services disruption of THB 18mn.

Unit (THB mn) 4Q 20/21 4Q 19/20Change
(YoY)% YoY 3Q 20/21
Change
(QoQ)% QoQ
Farebox revenues 851 1,457 (606) (42)% 1,167 (316) (27)%
Total operating and maintenance costs 427 479 (52) (11)% 362 64 18%
Employees expenses 121 148 (27) (18)% 125 (4) (3)%
Maintenance costs 126 141 (15) (11)% 114 12 11%
Utilities expenses 78 91 (13) (14)% 79 (2) (2)%
Property insurance premium 19 17 2 12% 0 19 N/A
Selling expenses 28 16 12 69% 14 14 94%
Administrative and other expenses 30 27 3 14% 15 15 106%
Capital expenditures 25 39 (14) (37)% 15 10 64%
Total income from investment in NRTA 424 978 (554) (57)% 805 (381) (47)%
Income from investment in NRTA margin (%) 50% 67% 69%
41
BTSGIF PerformanceAppendix: Total Income from Investment in NRTA
BTSGIF General PresentationAppendix: BTSGIF Total Income from Investment in NRTA

42
BTSGIF PerformanceAppendix: Balance Sheet
(Unit : THB mn) 31 Mar 2021 31 Mar 2020 31 Mar 2019 31 Mar 2018
Investment in NRTA
(at cost)
44,790
61,724
52,410
61,472
59,100
61,432
65,400
(61,432)
Investment in Securities and Cash 672 998 1,173 1,216
Other Assets 17 54 5 65
Total Assets 45,479 53,462 60,278 66,681
Total Liabilities 157 54 159 93
Net Asset Value 45,322 53,408 60,119 66,588
Capital Received from Unitholders 56,097 58,349 61,416 61,417
Retained Earnings (10,775) (4,941) (1,297) 5,171
NAV per Unit (THB) 7.8303 9.2273 10.3868 11.5045
BTSGIF General PresentationAppendix: BTSGIF Balance Sheet

43
BTSGIF PerformanceAppendix: Historical Distribution
BTSGIF General PresentationAppendix: Historical Distribution
1 Adjusted net profit = BTSGIF net profit less unrealised gain from the appraisal of assets andother adjustment items to be in line with the cash-basis of BTSGIF
Dividend Payment: Payout of not less than 90% of adjusted net profit1 p.a.and retained earnings (quarterly payment), andprohibit to pay dividend if the fund had retained deficit.
Capital Return: The Fund has excess liquidity (cash from amortisation offund issuance costs and unrealized loss on investment(non-cash expense)) and reduce its registered capital
TOTAL RETURN
* Payout from FY13/14 – 14/15 performances
FY Period No. Dividend Payment(THB per unit) No. Capital Return
(THB per unit)Total
(THB per unit)
13/14 17 Apr 2013 – 31 Mar 2014 1-4 0.579 - - 0.579
14/15 1 Apr 2014 – 31 Mar 2015 5-8 0.606 1-2* 0.125 0.731
15/16 1 Apr 2015 – 31 Mar 2016 9-12 0.692 3 0.064 0.756
16/17 1 Apr 2016 – 31 Mar 2017 13-16 0.772 - - 0.772
17/18 1 Apr 2017 – 31 Mar 2018 17-20 0.798 - - 0.798
18/19 1 Apr 2018 – 31 Mar 2019 21-23 0.611 4 0.169 0.780
19/20 1 Apr 2019 – 31 Mar 2020 24-25 0.284 5-8 0.491 0.775
20/21 1 Apr 2020 – 31 Mar 2021 - - 9-11 0.308 0.308
Total 17 Apr 2013 – 31 Mar 2021 1-25 4.342 1-11 1.157 5.499
0.000 0.125 0.064 0.000 0.000 0.169
0.4910.308
0.579
0.606 0.692 0.772 0.798 0.611 0.284
0.000
0.579
0.731 0.756 0.772 0.798 0.7800.775
0.308
FY 13/14 FY 14/15 FY 15/16 FY 16/17 FY 17/18 FY 18/19 FY 19/20 FY 20/21
Capital Return Dividend

28.0 28.3 29.0 29.0 29.7
1.6% 1.4%
2.2%
0.2%
2.5%
FY 16/17 FY 17/18 FY 18/19 FY 19/20 FY 20/21
Average Fare (THB/trip) Average Fare Growth (%YoY)
FY 20/21
Ridership 124.9mn trips, -47.3% YoY
Average fare (excluding impact of free-trip this year and allowance last year)
THB 29.7/trip, +2.5% YoY
Average weekday ridership 408,341 trips,-44.2% YoY
44
YEARLY HISTORICAL AVERAGE FARE & GROWTHYEARLY HISTORICAL RIDERSHIP & GROWTH
SUMMARY
BTSGIF PerformanceAppendix: Historical Ridership & Fare
BTSGIF General PresentationAppendix: Historical Ridership & Fare
EXPLANATION
FY 20/21 Ridership: decreased primarily from the COVID-19 impact
since April 2020 and new waves throughout this year.
Average fare: THB 29.7/trip, increasing by 2.5% YoY primarily from
the removal of the discount on stored value card (Purse) to be
the same fare as single journey card since April 2020
Note: Average fares above were adjusted for extraordinary events for comparison purpose.
238.0 241.2 241.0 236.9
124.9
2.4% 1.3% -0.1% -1.7%
-47.3%
FY 16/17 FY 17/18 FY 18/19 FY 19/20 FY 20/21
Ridership (mn trips) Ridership Growth (%YoY)

28.9 29.9 29.6 29.6 30.0
-1.3%
3.6%
-1.2%0.2%
1.4%
-0.2% 3.0%
2.7%1.1%
3.9%
4Q 19/20 1Q 20/21 2Q 20/21 3Q 20/21 4Q 20/21
Average Fare (THB/trip) Average Fare Growth (% QoQ) Average Fare Growth (% YoY)
45
QUARTERLY HISTORICAL AVERAGE FARE & GROWTHQUARTERLY HISTORICAL RIDERSHIP & GROWTH
BTSGIF PerformanceAppendix: Historical Ridership & Fare
BTSGIF General PresentationAppendix: Historical Ridership & Fare
* Average fares above were adjusted for extraordinary events for comparison purpose.
4Q 20/21
Ridership 28.4mn trips, -43.8% YoY, -28.1% QoQ
Average fare THB 30.0/trip, 3.9% YoY, 1.4% QoQ
Average weekday ridership 366,370 trips, -41.9% YoY, -29.0% QoQ
EXPLANATIONSUMMARY
50.4
18.5
38.7 39.428.4
-19.9%
-63.4%
109.2%
2.0%-28.1%-17.5%
-69.0%-39.5% -37.4% -43.8%
4Q 19/20 1Q 20/21 2Q 20/21 3Q 20/21 4Q 20/21
Ridership (mn trips) Ridership Growth (% QoQ) Ridership Growth (% YoY)
4Q 20/21 ridership declined by 43.8% YoY and 28.1% QoQ primarily
from the COVID-19 impact and the new wave started in late
December 2020 mainly derived from Samut Sakhon cluster.
4Q 20/21 average fare increased 3.9% YoY and 1.4% QoQ.
YoY increase was primarily from
i) the removal of the discount on stored value card (Purse)
since Apr 2020 and
ii) revenue recognition for non-claimed trips of monthly passes which
were extended the using period because of COVID-19 situation
since last year.

46BTSGIF General PresentationAppendix: Saint Louis Station (S4)
Saint Louis Station (S4) (Formerly Suksa Wittaya Station)Appendix: Project details and tentative timeline
• 570m from Surasak station (S5) and 610m from Chong Nonsi station (S3)
• Side platform station similar to S3 and S5 with typical stairs and escalator
• Total investment cost ~THB 650mn
• The Fund will provide 50% of the investment cost, using existing cash
Project details Tentative timeline
Additional FY 2021/22E(first operating year)
Ridership ~10,600 trips / weekday
Gross farebox revenue ~THB 119mn p.a.
Net farebox revenue ~THB 90mn p.a.
Winner announcement with final price
15 Oct 2015 BMA Approval
Submission of bidding documentJan 2016
Trustee ApprovalJun 2016
Signed construction contractAug 2016
S4 Operation
All related work finish
3 months
2 months
18 months
2.5 months
Apr 2016
2 months
BMA Approval and started construction
Sep 2019
36 months
Jul 2021
Progress of the construction work as of Apr 2021
Revised Plan Actual Early/Delay
100.0% 99.8% -0.2%
8 Feb 2021

47BTSGIF General PresentationAppendix: Changes of Key Factors in Valuation Reports
Loss on Valuation of InvestmentAppendix: Changes of Key Factors in Valuation Reports
KEY FACTOR PREVIOUS REPORT (MAR 19) PREVIOUS REPORT (MAR 20) CURRENT REPORT (MAR 21)
1. COVID-19 • No COVID-19 • Impact from COVID-19 Phase 1 • Impact from COVID-19 Phase 3
2. Lower economic growth rate (GDP)
• 4.0% for 2019-2021• 3.5% for 2022-2026 • 3.0% from 2027 onwards
• 2.4% for 2019• (2.0)% for 2020• 4.5% for 2021• 3.5% for 2022-2026 • 3.0% from 2027 onwards
• 2.3% for 2019• (6.1)% for 2020• 3.0% for 2021• 4.6% for 2022• 4.0% for 2023-2026 • 3.5% from 2027 onwards
3. Lower inflation rateand delay the fare increase
• 2.5%Assume fare increase in Apr 2020
• 0.9% for 2019-2020• 2.25% from 2021 onwardsAssume fare increase Apr 2020
• 0.7% for 2019• (0.8)% for 2020• 1.5% for 2021• 1.0% for 2022• 2.25% from 2023 onwardsAssume fare increase Apr 2022
4. Integrated fare structure ofMRTA lines (one-time entry fee)
Fare integration; Blue, Purple, Orange (one-time entry fee)
Fare integration; Blue, Purple, Orange (one-time entry fee)(unchanged from Mar 19)
Fare integration; Blue, Purple, Orange, Pink, Yellow (one-time entry fee)
5. Delay in the implementation ofdual track & the impact of closure of Saphan Taksin station
Closure 2 years and expected dual track implementation in 2022
Closure 2 years and expected dual track implementation in 2023
Closure 2 years and expected dual track implementation in 2024
6. Delay of the opening of Green Line Extension
• Bang Wa - Taling Chanin 2022
• Bang Wa - Taling Chanin 2024
• Bang Wa - Taling Chanin 2025
7. Delay of Suksa Wittaya station 2020 2021 2021 (unchanged from Mar 20)
Valuation decrease 4Q 18/19 = THB 5.3bn 4Q 19/20 = THB 5.9bn 4Q 20/21 = THB 5.5bn

48BTSGIF General PresentationAppendix: Key Factors to a Decrease in Valuation
Loss on Valuation of InvestmentAppendix: Key Factors to a Decrease in Valuation
KEY FACTOR PREVIOUS REPORT MAR 20(as of DEC 20)
CURRENT REPORT(MAR 21)
CHANGE
1. COVID-19 • Impact from COVID-19 Phase 2, net cash flow decrease THB 3.4bn in 4Q 20/21 and FY21/22
• Impact from COVID-19 Phase 3,net cash flow decrease another THB 2.8bn in FY 21/22 and FY22/23
-
2. Lower economic growth rate(GDP) and the number of tourists in Bangkok
Impact on ridership growth(CAGR from FY18/19A – FY29/30)
Ridership CAGR = 3.5% Ridership CAGR = 3.3% -
3. Lower inflation rate (CPI) and delay of fare increase
Impact on average fare(CAGR from FY18/19A – FY29/30)
Assume fare increase in Apr 2020
Fare CAGR = 2.5%
Assume fare increase in Apr 2022
Fare CAGR = 2.1%
Delay 2 years
4. Delay of the opening of Green Line Bang Wa - Taling Chan
Open 2024 Open 2025 Delay 1 year
5. Increase in discount rate 5.60% 5.75%
Valuation decrease 3Q 20/21 = THB (2.9)bn 4Q 20/21 = THB (5.5)bn

49BTSGIF General PresentationAppendix: Changes of Key Factors in Valuation Reports
Loss on Valuation of InvestmentAppendix: Changes of Key Factors to a Decrease in Valuation
Components of a change in valuation of THB 5.5bn
Valuation as of 31 Mar 2021 was THB 44.8bn, decreasing from THB 50.3bn as of 31 Dec 2020. A decrease of THB 5.5bn was from
1. A decrease in present value (PV) of revenue : THB 7.5bn; deduct
2. An increase in PV of expense: THB 1.7bn; deduct
3. An increase in valuation from a shortened period net by an increase in discount rate: THB 0.3bn
The impact of the COVID-19 outbreak
• Valuation decrease by THB 2.9bn
The impact of changes in GDP & Inflation from 2019 onwards and other factors
• GDP impact on ridership• Inflation impact on fare and expenses• Other factors impact on ridership
Resulting to a decrease in valuation by THB 2.9bn
The impact of shortened period
Due to PV of remaining CF increased higher than the absence of 4Q20/21 CF
• Valuation increase by THB 0.6bn
The impact of discount rate
From 5.6% to 5.75%
• Valuation decrease by THB 0.3bn
50.3 44.8
(2.9) (4.6)
1.7 0.6
(0.3)
Valuation31 Dec 20
Revenue decrease fromCOVID-19
Revenue decrease fromFY23/24 onwards
Expense decrease Shortened period Discount rate change Valuation31 Mar 21
Total PV of revenue decrease 7.5bn

50BTSGIF General PresentationAppendix: Historical Fare Adjustment
BTS Historical Fare AdjustmentAppendix: Historical Fare Adjustment
No. Detail Date AdjustmentAvg Annual Fare / trip
YoY Annual Fare Growth
1 Increase in SJT Mar 07Increased effective fare (SJT) from THB 10-40 to THB 15-40
FY 07/08 = THB 24.2
+9.5% YoY
2 Increase in SJT Jun 13Increased effective fare (SJT) from THB 15-40 to THB 15-42
FY 13/14 = THB 26.4
+6.5% YoY
3Promotional Adjustment
Jan 14Increased STV card to effective fare (SJT)
but gave discount THB 1 per tripFY 14/15
= THB 26.9+1.6% YoY
4Promotional Adjustment
Jul 15Removed some discount on monthly pass and
increase one day cardFY 15/16
= THB 27.5+2.4% YoY
5Promotional Adjustment
Jan 16 Removed THB 1 per trip discount on STV cardFY 16/17
= THB 28.0+1.6% YoY
6 Increase in SJT Oct 17Increased effective fare (SJT)
from THB 15-42 to THB 16-44 andIncreased monthly pass card by THB 1 per trip
FY 17/18 = THB 28.3
+1.4% YoY
7Promotional Adjustment
Apr 18Increased STV card to effective fare (SJT)
but gave discount THB 1 per tripFY 18/19
= THB 29.0+2.2% YoY
8Promotional Adjustment
Apr 20 Removed THB 1 per trip discount on STV cardFY 20/21
= THB 29.7+2.5% YoY
* Average fares above were adjusted for extraordinary events for comparison purpose.
Top Related