


Languages
Pages
Legal

2013-14 STRATEGIC PARTNERSHIPHARRIS CENTRE STUDENT RESEARCH FUND2013-14 HARRIS CENTRE RBC WATER RESEARCH AND OUTREACH FUND2013-14 APPLIED RESEARCH FUND2015-16 HARRIS CENTRE - MMSB WASTE MANAGEMENT APPLIED RESEARCH FUND
CORNER
HE ZHANG, TAHIR HUSAIN & YUAN CHENMEMORIAL UNIVERSITY MARCH 2017
PULP AND
WASTE MANAGEMENT
BROOK
PAPER MILL
The Harris Centre – MMSB Waste Management Applied Research Fund 2015/2016
FINAL REPORT
Corner Brook Pulp and Paper Mill Waste Management
Submitted to
The Harris Centre
Memorial University of Newfoundland
Prepared by
He Zhang, Tahir Husain and Yuan Chen
Faculty of Engineering and Applied Science Memorial University of Newfoundland
St. John’s, NL, Canada A1B3X5
March, 2017
1

Acknowledgements
The support provided by the Harris Centre at Memorial University in the form of the Harris
Centre MMSB Waste Management Applied Research Fund is highly appreciated. Appreciation
is also extended to the Corner Brook Pulp and Paper Limited for providing fly ash samples for
this project.
2

Executive Summary
The fly ash generated from Corner Brook Pulp and Paper Limited was transformed to activated
carbon through physical activation process in a high temperature tube furnace in this study.
Effects of two factors including activation temperature and activation time were investigated.
Iodine number, methylene blue value, surface microstructure, surface area and pore volume
were all analyzed to assess the adsorption capacity of different carbon samples. In this study, the
sample activated under 850 °C for 2 hours has the highest iodine number (704.53 mg/g) and
methylene blue value (193.47 mg/g). Hence, it is selected to conduct further assessment on
surface area and pore volume. Comparing the CBPP FA-Clean sample with the CBPP FA-
850 °C-2hr sample, it is investigated that the surface area was significantly increased from
486.44 m2/g to 847.26 m2/g. Meanwhile, the pore volume increased from 0.18 cm3/g to 0.28
cm3/g. The result of scanning electron microscopy also reveals that there are lots of pores
developed on the sample surface after activation at 850 °C for 2 hrs.
Batch test was conducted to evaluate the adsorption efficiency of the CBPP FA-850 °C-2hr on
natural organic matter removal. The isotherm revealed that the use of 0.5 g (AC) /L (water) has
the highest adsorption effectiveness, it is hence selected as the dose in column filtration
experiment. A column filtration technology was then developed to further evaluate the
adsorption capacity of the activated carbon. The column is 30 cm length and 40 mm diameter,
and the CBPP FA-850 °C-2hr sample was placed at the bottom of the column to act as a carbon
barrier. Water sample from a local community was continuously passed through the column for
24 hours. The organic matter, measured as total organic matter, in the water sample before and
after the filtration was analyzed. Results indicate that more than 60% of the organic matter can
be removed by the carbon barrier within 2 hours filtration. It is also discovered that the carbon
barrier is more effective in the adsorption of light-sensitive organic matters.
Above all, this study can not only help CBPP with their waste management, but also provide a
cost-effective approach which can be potentially applied in the water treatment field.
3
Table of Contents
Acknowledgements ........................................................................................................................ 2 Executive Summary ....................................................................................................................... 3 Table of Contents ........................................................................................................................... 4 List of Figures ................................................................................................................................ 6 List of Tables .................................................................................................................................. 7 1 Background Information ....................................................................................................... 8
1.1 Current waste management status in Corner Brook Pulp and Paper Ltd. ......................... 8 1.2 Application of activated carbon derived from fly ash ...................................................... 8 1.3 Previous work on fly ash................................................................................................... 9 1.4 Objective and scope of work ............................................................................................. 9
2 Characterization of CBPP fly ash ....................................................................................... 11 2.1 Methodology ................................................................................................................... 11
2.1.1 Particle size ................................................................................................................. 11 2.1.2 pH ................................................................................................................................ 11 2.1.3 Moisture content .......................................................................................................... 11 2.1.4 Ash content .................................................................................................................. 12 2.1.5 Carbon content ............................................................................................................ 12 2.1.6 Metal content ............................................................................................................... 12 2.1.7 Iodine number ............................................................................................................. 12 2.1.8 Methylene blue value .................................................................................................. 13
2.2 Results and discussion .................................................................................................... 14 2.2.1 Particle size ................................................................................................................. 14 2.2.2 pH, moisture content, ash content, carbon content, IN and MBV .............................. 14 2.2.3 Metal content ............................................................................................................... 15
3 Activation of CBPP Fly Ash ................................................................................................. 16 3.1 Methodology ................................................................................................................... 16
3.1.1 Effect of activation temperature .................................................................................. 16 3.1.2 Effect of activation time .............................................................................................. 16 3.1.3 Scanning electron microscopy (SEM) ......................................................................... 17 3.1.4 Surface area and pore volume ..................................................................................... 17
3.2 Results and discussion .................................................................................................... 18 3.2.1 Effect of activation temperature .................................................................................. 18 3.2.2 Effect of activation time .............................................................................................. 19 3.2.3 Scanning electron microscopy (SEM) ......................................................................... 20 3.2.4 Surface area and pore volume ..................................................................................... 21
4 Batch Test Evaluation of CBPP Activated Carbon ........................................................... 23
4

4.1 Characterization of water samples .................................................................................. 23 4.1.1 Methodology ............................................................................................................... 23 4.1.2 Results and discussion ................................................................................................. 23
4.2 Evaluation of organic matter adsorption through jar test experiments ........................... 24 4.2.1 Methodology ............................................................................................................... 24 4.2.2 Results and discussions ............................................................................................... 24
5 Development of Carbon Filtration Technology ................................................................. 27 5.1 Design of a carbon filtration system ............................................................................... 27 5.2 Evaluation of system performance.................................................................................. 28
5.2.1 Methodology ............................................................................................................... 28 5.2.2 Results and discussion ................................................................................................. 28
6 Conclusions and Recommendations .................................................................................... 31 6.1 Conclusions ..................................................................................................................... 31 6.2 Recommendations ........................................................................................................... 32
References ..................................................................................................................................... 33
5

List of Figures
Figure 2-1 CBPP FA particle size distribution after grinding ....................................................... 14 Figure 3-1 Iodine No. and MB value of CBPP samples activated at different temperatures ........ 19 Figure 3-2 Iodine No. and MB value of CBPP samples activated with different time lengths ..... 20 Figure 3-3 SEM images of carbon particles surface microstructures ............................................ 21 Figure 3-4 N2 adsorption-desorption isotherm linear plot of CBPP FA-Clean ............................. 22 Figure 3-5 N2 adsorption-desorption isotherm linear plot of CBPP AC-850°C-2hr ..................... 22 Figure 4-1 TOC adsorption kinetics by CBPP-AC with different doses ....................................... 25 Figure 4-2 TOC adsorption isotherm by CBPP-AC with different doses ..................................... 26 Figure 4-3 UV deduction by CBPP-AC with different doses ....................................................... 26 Figure 5-1 A sketch of carbon filtration system ............................................................................ 28 Figure 5-2 TOC concentration in column effluent within 24-hrs filtration ................................... 30 Figure 5-3 UV254 in column effluent within 24-hrs filtration ........................................................ 30
6

List of Tables
Table 2-1 Characterization of CBPP raw and clean FA samples .................................................. 15 Table 2-2 Metal contents in CBPP FA before and after acid-washing ......................................... 15 Table 3-1 Characterization of CBPP FA and AC samples ............................................................ 19 Table 3-2 Characterization of 850°C-activated CBPP AC samples .............................................. 20 Table 3-3 Surface area and pore volume of CBPP clean and activated carbon ............................ 21 Table 4-1 Characteristics of community intake source water ....................................................... 24
7

1 Background Information
1.1 Current waste management status in Corner Brook Pulp and Paper Ltd.
Corner Brook Pulp and Paper (CBPP) Ltd. utilizes a thermo-mechanical pulping process to
produce standard newsprint and other specialty newsprint grades. The unit production capacity
of CBPP has reached almost 700 tons of newsprint per day, and the plant plays an important role
in promoting the economic growth of western Newfoundland.
The pulp and paper manufacturing process is supported by steam generated from mill boilers.
The main boiler (#7) in CBPP burns a mixture of Bunker C fuel, waste oil fuel, and hog fuel,
while the backup or supplementary boilers (#3 and #6) combust Bunker C fuel. Bunker C fuel,
also known as No. 6 Fuel oil, is a high-viscosity residual oil. Hog fuel is a mix of coarse chips of
bark from trees, saw dust, and wood fiber. To control air emissions released to the atmospheres
during the mill operation, the main boiler is equipped with emission control devices including
mechanical dust collectors, low oxides of nitrogen (NOx) burners, and a wet scrubber. Each year,
a significant amount of fly ashes, including boiler ash and bottom ash, are generated from mill
operation and disposed to landfills (Department of Environment and Climate Change, 2017).
1.2 Application of activated carbon derived from fly ash
The application of activated carbon derived from fly ash can be utilized in both gas and water
treatment for the adsorption of various contaminants, and related studies have been done by
many researchers. Aslam et al. (2015) have synthesized activated carbon from oil fly ash. The
removal of H2S from industrial gas stream by the activated carbon was analyzed, and a
maximum of 0.3001 mg/g adsorption capacity has been reached. Salehin et al. (2016) studied
the removal of different heavy metals from aqueous solutions by the activated carbon generated
from physical activation, and complete removal of copper and lead was observed at a neutral pH
level. The adsorption of selenium in surface and groundwater using copper-impregnated
activated carbon was investigated by Jegadeesan et al. (2015), the electrostatic forces are
confirmed to have significant impact on the adsorption results. The activated carbon obtained
from oil-fired fly ash has also been identified to be suitable for SO2 and NOx treatment in
Davini’s study (2002).
8

1.3 Previous work on fly ash
Our group has been working on the fly ash and extracted carbon and their potential application
for many years. It is proved that the oil fly ash can be employed as a stabilizer or filling material
in cement manufacture (Mofarrah, 2014). It can also act as an adsorbent which can effectively
remove phenols, methylene blue, lead, and chromium VI from wastewater streams by up to 92%
(Mofarrah and Husain, 2013; Mofarrah, 2014). Moreover, the oil fly ash-derived activated
carbon is capable of removing natural organic matter from intake water sources for the local
communities (i.e., Pouch Cove, Torbay, etc.) in NL. Results of the case study in Pouch Cove
indicates that more than 70% of the organic matter has been removed from the source water, it
thus prevented the formation of disinfection by products in their drinking-water supply system
(Husain et al., 2012; Ahmad, 2013).
1.4 Objective and scope of work
The objective of the study is to convert the waste materials (i.e. fly ash) into a valuable product
which can then be utilized to improve water quality in source water pretreatment in local
communities. The finding of the study will reduce the amount of ashes ending up in landfill and
thus save the landfill space and associated disposal cost.
Although commercial available activated carbon has proven applications in filtration technology
for water and wastewater treatment for the removal of various contaminants, it is not widely
employed at many industrial plants due to the high cost of raw precursor materials. Therefore,
there is a trend to find alternative cost-effective precursors from wastes and industrial by-
products (Ahmed and Dhedan, 2012; Gode and Pehlivan, 2006). The conversion of waste
products into adsorbents for pollution control would not only help in reducing the disposal cost
but also provide a cost-effective alternative for the activated carbon generation (Kurniawan et al.,
2006).
Among industrial wastes, carbon-rich fly ash has been extensively studied for the adsorptions of
both inorganic and organic pollutants from air and aqueous solutions (Banerjee et al., 2004;
Sarkar and Acharya, 2006). One major reason for selecting ashes from pulp and paper mill for
activated carbon development is that the mill boilers generally combust residual oil and wood
residue which leads to high carbon content in fly ash. Preliminary analysis of the CBPP fly ash
indicates that its carbon content is around 80%, which is quite high and suitable to be utilized as
an adsorbent in developing a cost-effective filtration technology.
9

In this study, raw fly ash from CPBB will be firstly characterized and cleaned to eliminate the
impurities. The cleaned carbon will then be activated at different activation temperatures for
different activation times. The adsorption of iodine and methylene blue will be analyzed for the
evaluation of surface area and pore volume development. The activated carbon with biggest
surface area and pore volume will be applied in a column filtration technology. To determine the
effectiveness of the developed activated carbon filtration technology, the intake source water
from a local community was examined for the removal of organic matter through a 24-hour
laboratory filtration experiment. The findings of this study will not only help CBPP Ltd. to save
the cost of landfill and waste management, but also benefit the local communities in NL to
improve their water quality.
10

2 Characterization of CBPP fly ash
Fly ash (FA) samples generated by CBPP were collected and delivered to the Environment
Laboratory located in the Department of Engineering and Applied Science at Memorial
University of Newfoundland.
2.1 Methodology
The raw FA sample was firstly grinded into powder before characterization. The raw powder
sample was then washed with 5% HNO3 solution on a carbon to acid ratio of 1 g per 10 mL at
60 °C for 2 hrs to recover unburnt carbon and remove impurities from the FA. After filtration,
the particles were cleaned with distilled water for several times to eliminate any acid residue. At
last, the filtered clean FA was dried at 110 °C overnight before activation use. Characterization
of particle size, pH, moisture, ash content, carbon content, Iodine number, methylene blue value,
and metal elements were conducted for both raw and clean FA samples. Detailed methods are
listed in the following sections.
2.1.1 Particle size
The particle size of raw FA sample after grinding was determined by using a Horiba Particle
Laser Scattered Particles Size Analyzer (Model LA-950) in Earth Resources Research and
Analysis Facility (TERRA).
2.1.2 pH
The pH of the samples was analyzed following the ASTM method D38738-05 (2017). Simply,
100 mL of boiling deionized water was added to 10 g of an FA sample and kept boiling on the
hot plate for 15 mins. The filtrate was then cooled to room temperature, and a pH meter was
used to measure the pH values of raw and clean FA samples.
2.1.3 Moisture content
Moisture content was determined by the ASTM method D2867-09 (2014). A crucible with lid
was weighed and recorded. A 2 g FA sample was weighed and transferred into the crucible, and
the crucible and lid were dried in a conventional oven at 110 ± 5 °C to a constant weight. After
cooled down to room temperature in a desiccator, the crucible and lid were weighed again. The
moisture content can be calculated as
11
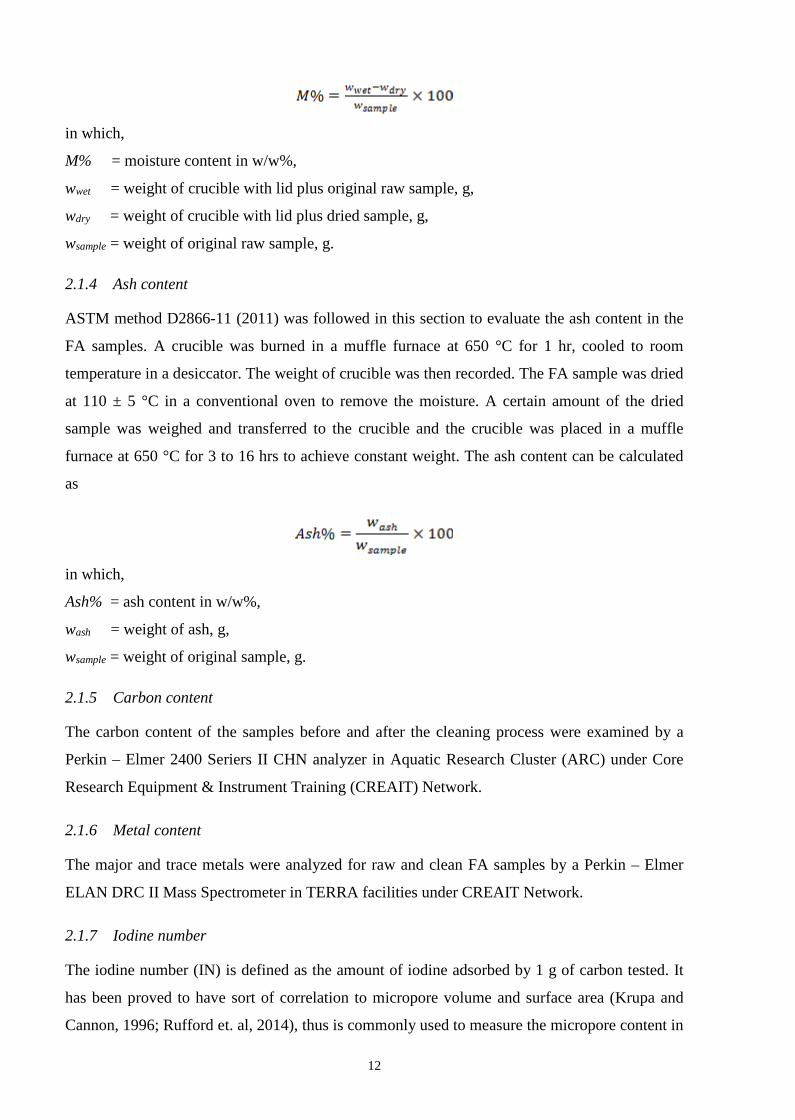
in which,
M% = moisture content in w/w%,
wwet = weight of crucible with lid plus original raw sample, g,
wdry = weight of crucible with lid plus dried sample, g,
wsample = weight of original raw sample, g.
2.1.4 Ash content
ASTM method D2866-11 (2011) was followed in this section to evaluate the ash content in the
FA samples. A crucible was burned in a muffle furnace at 650 °C for 1 hr, cooled to room
temperature in a desiccator. The weight of crucible was then recorded. The FA sample was dried
at 110 ± 5 °C in a conventional oven to remove the moisture. A certain amount of the dried
sample was weighed and transferred to the crucible and the crucible was placed in a muffle
furnace at 650 °C for 3 to 16 hrs to achieve constant weight. The ash content can be calculated
as
in which,
Ash% = ash content in w/w%,
wash = weight of ash, g,
wsample = weight of original sample, g.
2.1.5 Carbon content
The carbon content of the samples before and after the cleaning process were examined by a
Perkin – Elmer 2400 Seriers II CHN analyzer in Aquatic Research Cluster (ARC) under Core
Research Equipment & Instrument Training (CREAIT) Network.
2.1.6 Metal content
The major and trace metals were analyzed for raw and clean FA samples by a Perkin – Elmer
ELAN DRC II Mass Spectrometer in TERRA facilities under CREAIT Network.
2.1.7 Iodine number
The iodine number (IN) is defined as the amount of iodine adsorbed by 1 g of carbon tested. It
has been proved to have sort of correlation to micropore volume and surface area (Krupa and
Cannon, 1996; Rufford et. al, 2014), thus is commonly used to measure the micropore content in
12

a carbon sample. In this case, it was determined by following the ASTM method D4607-14
(2014). About 0.2 gram of the carbon sample was mixed with 15 mL 0.1 N (normality) iodine
solution in a 50 mL Erlenmeyer flask. The flask was then placed on a laboratory shaker and
shaken for 15 mins at 200 rpm. When the shaking was finished, the carbon sample was filtered
out and 10 mL of the filtrate was titrated with 0.1 N sodium thiosulfate solution. A few drops of
starch solution was used as the indicator for titration. The iodine number can be calculated as
in which,
IN = iodine number, mg/g,
C0 = concentration of iodine solution, 0.1N,
V0 = volume of iodine solution mixed with sample, mL,
C1 = concentration of sodium thiosulfate solution, 0.1N,
V1 = volume of sodium thiosulfate solution consumed in titration, mL,
DF = dilution factor, in this case is 1.5,
MC = weight of carbon sample, g.
2.1.8 Methylene blue value
Methylene blue is one of the organic dyes that has been frequently used to characterize the
mesoporous structures of a carbon sample since the molecular sizes of methylene blue are
usually over 1 nm (Yan et. al, 2009; Attia et. al, 2008; Janoš et. al, 2003). The methylene blue
value (MBV) is defined as the amount of methylene blue adsorbed by 1 g of carbon tested. The
method applied to determine the methylene blue value is derived from GB/T 7702.6 (2008). In
general, about 0.1 g of carbon sample was mixed with 10 mL methylene blue stock solution
(1500 mg/L) in a 50 mL Erlenmeyer flask. The flask was then placed on a laboratory shaker and
shaken for 30 mins at 200 rpm. After filtration, the filtrate was transferred to a 10 mm cuvette
and analyzed for UV absorbance at the wavelength of 665 nm by using a UV/Vis
spectrophotometer (Thermo Scientific Genesys). The methylene blue value can be calculated as
in which,
MBV = methylene blue value, mg/g,
C0 = concentration of methylene blue stock solution, mg/mL,
C1 = concentration of methylene blue solution after filtration, mg/mL,
V = volume of methylene blue solution mixed with carbon, mL, 13

MC = weight of carbon sample, g.
2.2 Results and discussion
2.2.1 Particle size
The particle size of raw FA sample was analyzed. Figure 2-1 shows the particle size distribution
of the tested sample. From Figure 2-1, more than 25% of CBPP raw FA has the particle size of
15 to 31 µm; about 60% of it was evenly distributed in the range of 37 to 300 µm; the minimum
and maximum particle sizes were 7.8 and 710 µm, respectively.
1 10 1000
2
4
6
8
10
12
14
16
18
Particle diameter (µm)
Volu
me
(%)
-10
0
10
20
30
40
50
60
70
80
90
100
Cumulative volum
e (%)
Figure 2-1 CBPP FA particle size distribution after grinding
2.2.2 pH, moisture content, ash content, carbon content, IN and MBV
The characteristics of pH, moisture content, ash content, carbon content, iodine number and
methylene blue value for both raw and cleaned CBPP FA samples were examined. Results are
shown in Table 2-1. Since the raw FA sample was cleaned by 5% HNO3 solution, the clean FA
shows strong acidity while the raw FA is alkaline. The acids left in the FA samples could be
removed in the following activation process. Most moisture and ash content were reduced after
the cleaning process, which indicates the effectiveness of using nitric acid solution as cleaning
reagent. Meanwhile, the reduction of ash content also resulted in the increase of carbon content
of the FA sample, which would further benefit the activation process. The iodine number
decreased and the methylene blue value increased after cleaning, which means some impurities 14
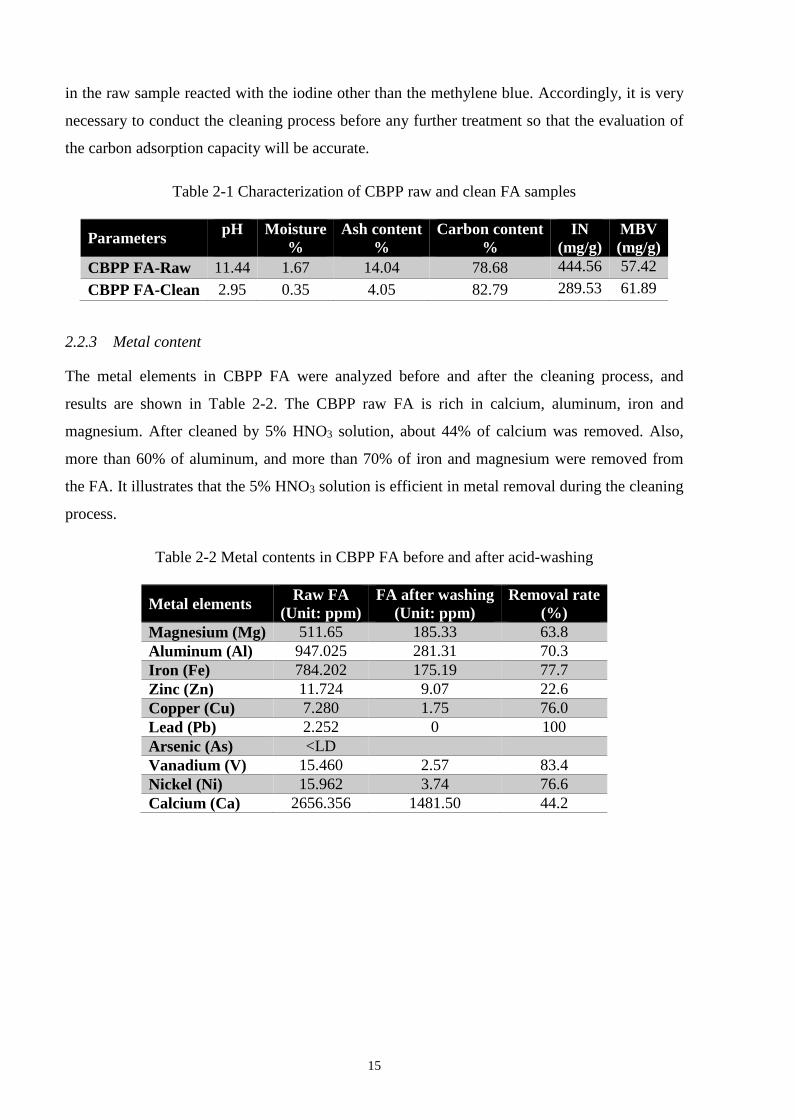
in the raw sample reacted with the iodine other than the methylene blue. Accordingly, it is very
necessary to conduct the cleaning process before any further treatment so that the evaluation of
the carbon adsorption capacity will be accurate.
Table 2-1 Characterization of CBPP raw and clean FA samples
Parameters pH
Moisture %
Ash content %
Carbon content %
IN (mg/g)
MBV (mg/g)
CBPP FA-Raw 11.44 1.67 14.04 78.68 444.56 57.42 CBPP FA-Clean 2.95 0.35 4.05 82.79 289.53 61.89
2.2.3 Metal content
The metal elements in CBPP FA were analyzed before and after the cleaning process, and
results are shown in Table 2-2. The CBPP raw FA is rich in calcium, aluminum, iron and
magnesium. After cleaned by 5% HNO3 solution, about 44% of calcium was removed. Also,
more than 60% of aluminum, and more than 70% of iron and magnesium were removed from
the FA. It illustrates that the 5% HNO3 solution is efficient in metal removal during the cleaning
process.
Table 2-2 Metal contents in CBPP FA before and after acid-washing
Metal elements Raw FA (Unit: ppm)
FA after washing (Unit: ppm)
Removal rate (%)
Magnesium (Mg) 511.65 185.33 63.8 Aluminum (Al) 947.025 281.31 70.3 Iron (Fe) 784.202 175.19 77.7 Zinc (Zn) 11.724 9.07 22.6 Copper (Cu) 7.280 1.75 76.0 Lead (Pb) 2.252 0 100 Arsenic (As) <LD Vanadium (V) 15.460 2.57 83.4 Nickel (Ni) 15.962 3.74 76.6 Calcium (Ca) 2656.356 1481.50 44.2
15

3 Activation of CBPP Fly Ash
This study only focuses on physical activation of this wood based fly ash. Comparing with
chemical activation, physical activation usually generates cleaner activated carbon (AC)
products which are more suitable for water treatment technology development. Iodine number,
methylene blue value, Scanning electron microscopy (SEM), as well as Brunauer, Emmett and
Teller (BET) analysis were all used to assess the surface area and pore volume development.
Since there are some limitations and difficulties in sending samples to other universities for
analysis like BET, meanwhile, the analysis of iodine and methylene blue adsorption is more
convenient to be done in our own lab, the iodine number and methylene blue value were mainly
used as indicators for surface area and pore volume development. Only the sample with highest
iodine number and methylene blue value was sent together with clean carbon sample for BET
analysis.
3.1 Methodology
3.1.1 Effect of activation temperature
In this part, a programmable Lindberg/Blue M tube furnace was used for both carbonization and
activation processes. The temperatures examined were 650 °C, 700 °C, 750 °C, 800 °C, 850 °C
and 900 °C, respectively. In carbonization process, about 6 grams of the CBPP clean FA was
firstly heated from room temperature to a desired temperature at a rate of 10 °C/min under N2
flow (75 cm3/min). Once reaching the desired temperature, the carbonization was continued for
another hour. This was then followed by a 1-hour activation process under CO2 flow (75
cm3/min) at the same temperature. The AC samples generated at different temperatures together
with CBPP raw and clean FA samples were analyzed for loss of ignition, iodine number, and
methylene blue value. The sample with high iodine number and methylene blue value was
selected to evaluate the effect of activation time.
3.1.2 Effect of activation time
In this part of experiment, the CBPP clean FA sample was carbonized and activated under the
selected activation temperature for 1 hour, 2 hours, and 3 hours, respectively. The AC samples
generated in this part were analyzed for iodine number and methylene blue value. The one with
high iodine number and methylene blue value was employed in the following water filtration
experiments.
16
3.1.3 Scanning electron microscopy (SEM)
To further evaluate the activation process, an SEM instrument from TERRA facilities was used
to observe the surface microstructure and morphology of the carbon sample before and after
activation.
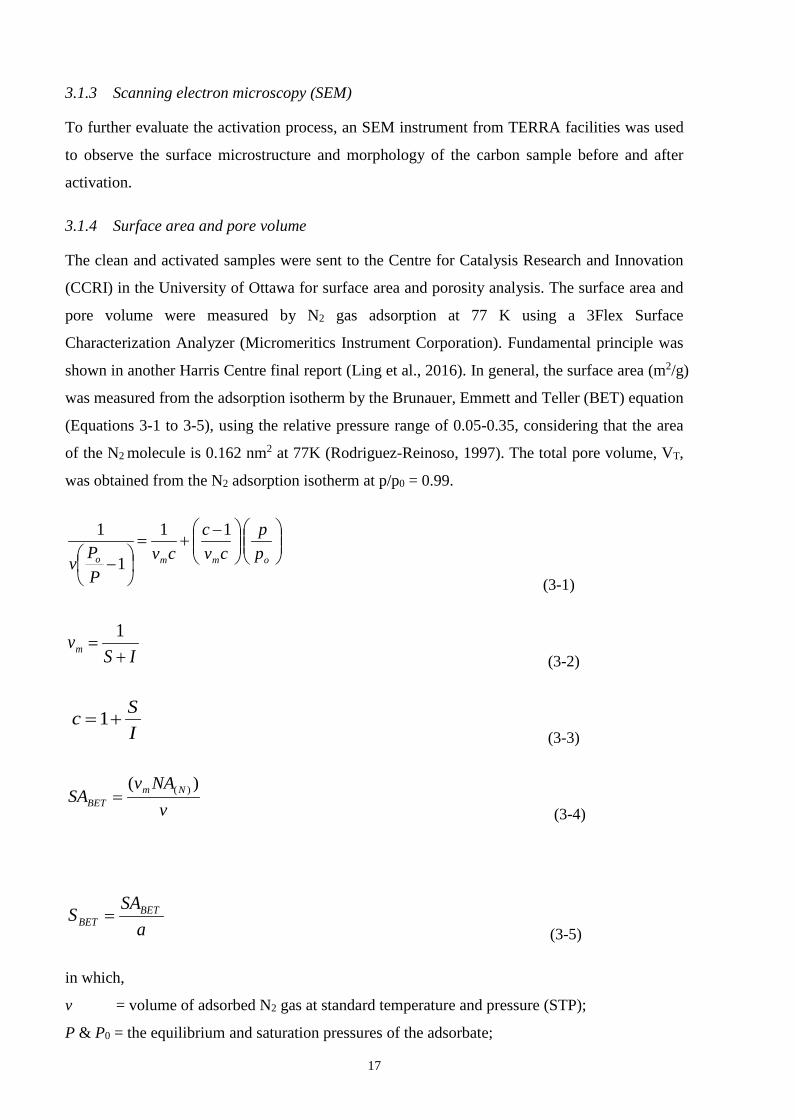
3.1.4 Surface area and pore volume
The clean and activated samples were sent to the Centre for Catalysis Research and Innovation
(CCRI) in the University of Ottawa for surface area and porosity analysis. The surface area and
pore volume were measured by N2 gas adsorption at 77 K using a 3Flex Surface
Characterization Analyzer (Micromeritics Instrument Corporation). Fundamental principle was
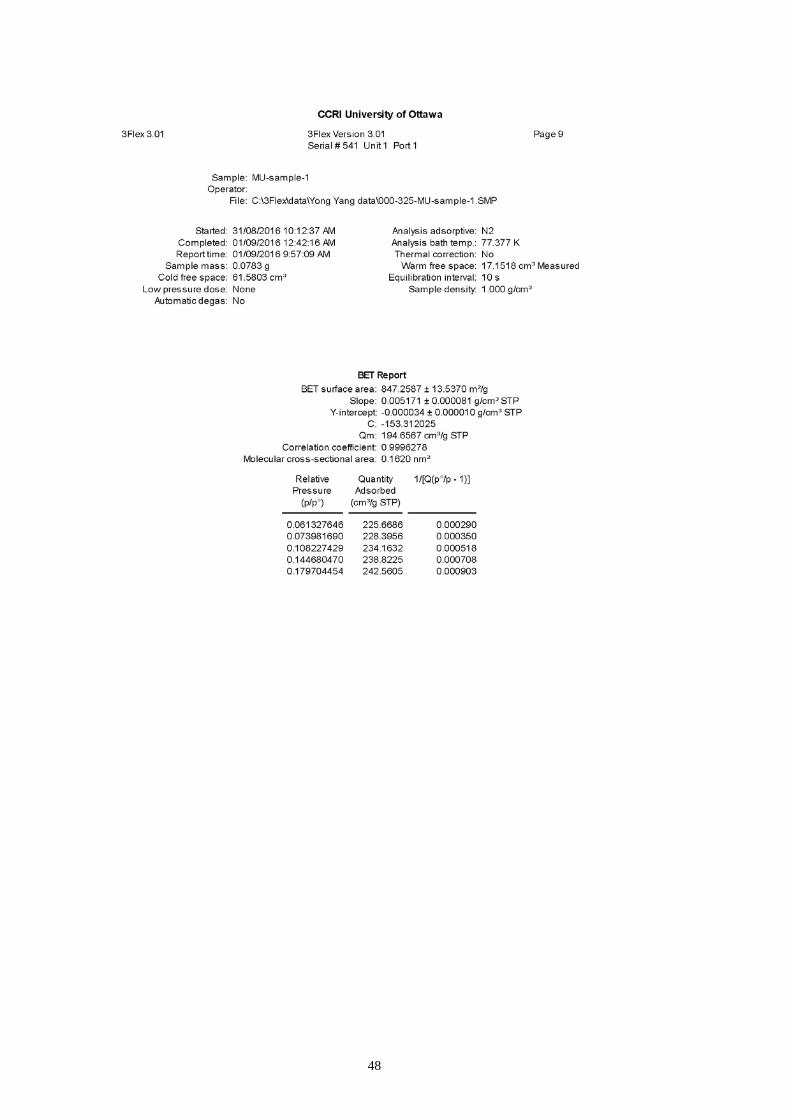
shown in another Harris Centre final report (Ling et al., 2016). In general, the surface area (m2/g)
was measured from the adsorption isotherm by the Brunauer, Emmett and Teller (BET) equation
(Equations 3-1 to 3-5), using the relative pressure range of 0.05-0.35, considering that the area
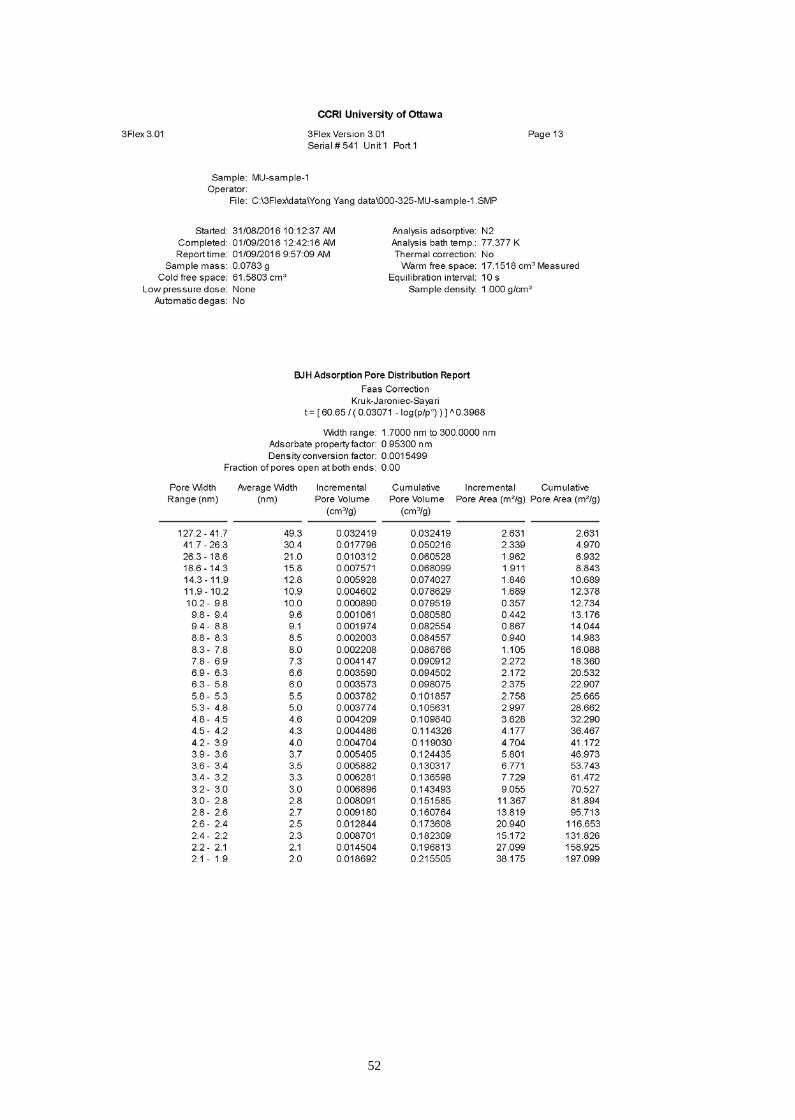
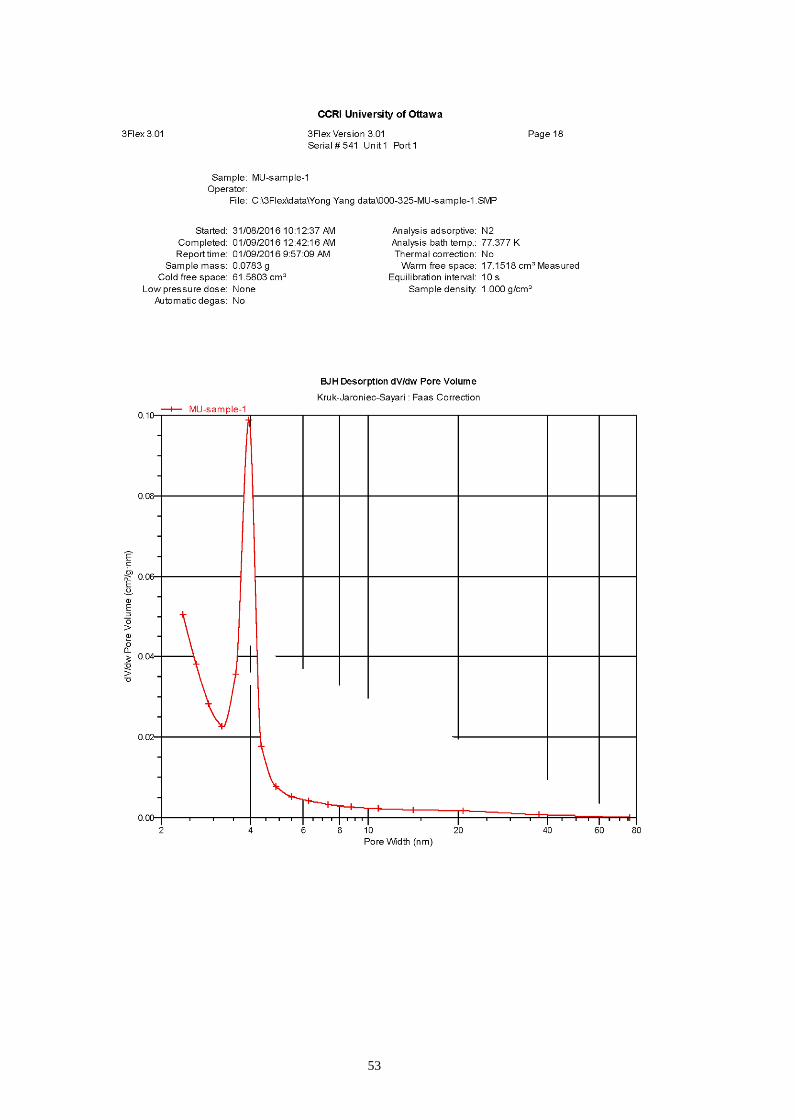
of the N2 molecule is 0.162 nm2 at 77K (Rodriguez-Reinoso, 1997). The total pore volume, VT,
was obtained from the N2 adsorption isotherm at p/p0 = 0.99.
−+=
− ommo p
pcv
ccv
PPv
11
1
1
(3-1)
ISvm +
=1
(3-2)
ISc +=1
(3-3)
vNAv
SA NmBET
)( )(= (3-4)
aSAS BET
BET = (3-5)
in which,
v = volume of adsorbed N2 gas at standard temperature and pressure (STP);
P & P0 = the equilibrium and saturation pressures of the adsorbate;
17
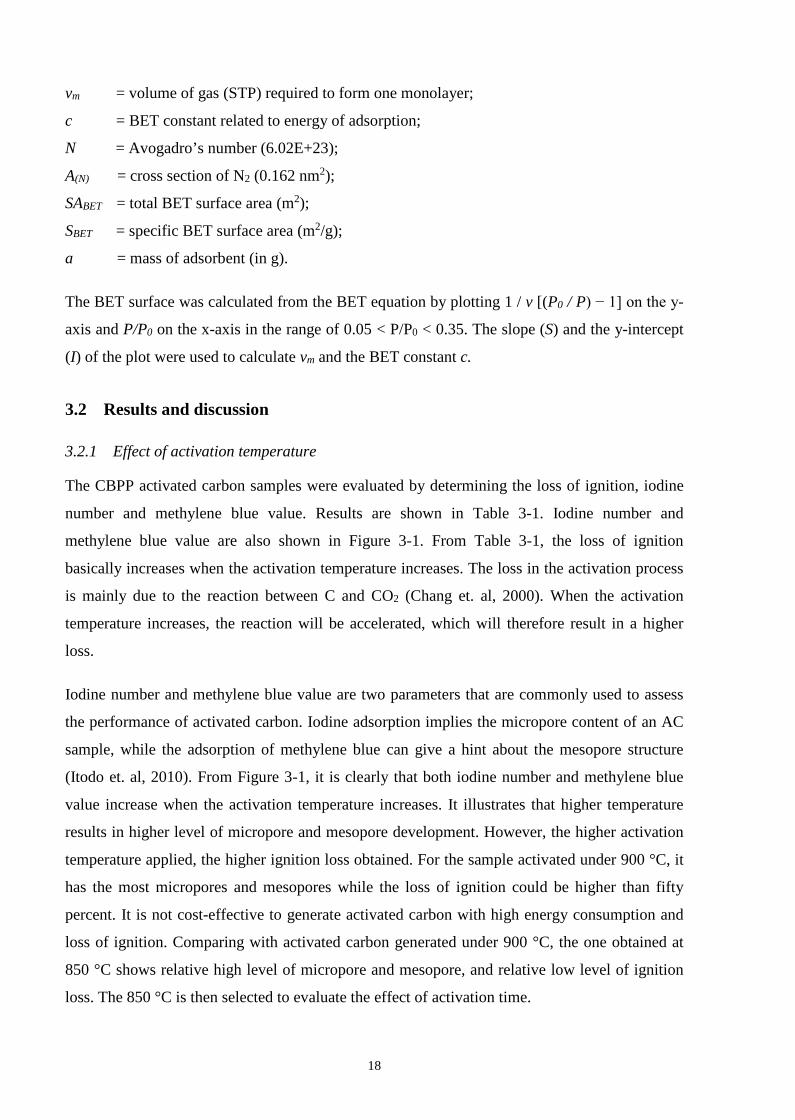
vm = volume of gas (STP) required to form one monolayer;
c = BET constant related to energy of adsorption;
N = Avogadro’s number (6.02E+23);
A(N) = cross section of N2 (0.162 nm2);
SABET = total BET surface area (m2);
SBET = specific BET surface area (m2/g);
a = mass of adsorbent (in g).
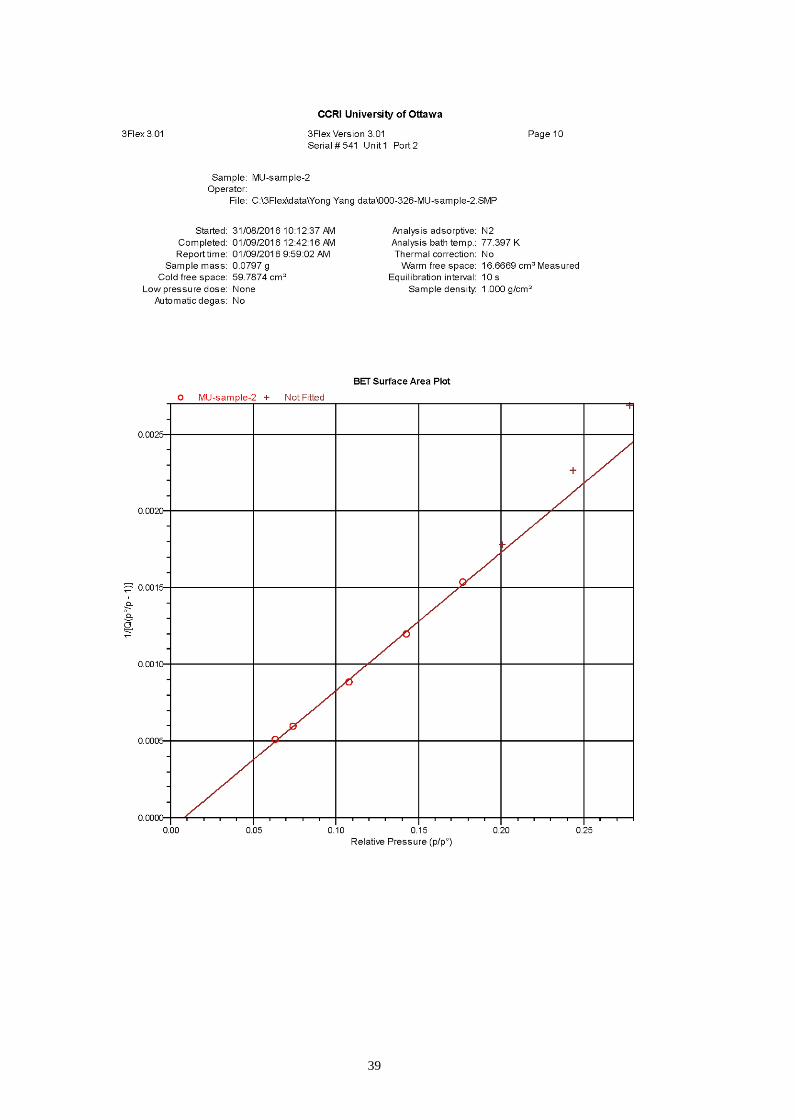
The BET surface was calculated from the BET equation by plotting 1 / v [(P0 / P) − 1] on the y-
axis and P/P0 on the x-axis in the range of 0.05 < P/P0 < 0.35. The slope (S) and the y-intercept
(I) of the plot were used to calculate vm and the BET constant c.
3.2 Results and discussion
3.2.1 Effect of activation temperature
The CBPP activated carbon samples were evaluated by determining the loss of ignition, iodine
number and methylene blue value. Results are shown in Table 3-1. Iodine number and
methylene blue value are also shown in Figure 3-1. From Table 3-1, the loss of ignition
basically increases when the activation temperature increases. The loss in the activation process
is mainly due to the reaction between C and CO2 (Chang et. al, 2000). When the activation
temperature increases, the reaction will be accelerated, which will therefore result in a higher
loss.
Iodine number and methylene blue value are two parameters that are commonly used to assess
the performance of activated carbon. Iodine adsorption implies the micropore content of an AC
sample, while the adsorption of methylene blue can give a hint about the mesopore structure
(Itodo et. al, 2010). From Figure 3-1, it is clearly that both iodine number and methylene blue
value increase when the activation temperature increases. It illustrates that higher temperature
results in higher level of micropore and mesopore development. However, the higher activation
temperature applied, the higher ignition loss obtained. For the sample activated under 900 °C, it
has the most micropores and mesopores while the loss of ignition could be higher than fifty
percent. It is not cost-effective to generate activated carbon with high energy consumption and
loss of ignition. Comparing with activated carbon generated under 900 °C, the one obtained at
850 °C shows relative high level of micropore and mesopore, and relative low level of ignition
loss. The 850 °C is then selected to evaluate the effect of activation time.
18

Table 3-1 Characterization of CBPP FA and AC samples
Samples Loss of ignition (%)
Iodine No. (mg/g)
Methylene blue value (mg/g)
CBPP AC-650°C 7.79 529.66 71.57 CBPP AC-700°C 14.29 552.92 73.84 CBPP AC-750°C 13.70 469.26 76.7 CBPP AC-800°C 22.22 502 107.19 CBPP AC-850°C 36.84 515.16 142.98 CBPP AC-900°C 53.75 760.91 169.33
650 700 750 800 850 900
450
500
550
600
650
700
750
800
Iodine No. MB Value
Temperature (°C)
I (m
g/g)
60
80
100
120
140
160
180
MB (m
g/g)
Figure 3-1 Iodine No. and MB value of CBPP samples activated at different temperatures
3.2.2 Effect of activation time
After testing different activation temperatures, different activation time periods were also
examined. Results of iodine number and methylene blue value were shown in Table 3-2 and
Figure 3-2. The results of iodine number and methylene blue value illustrate that the sample
being activated under 850 °C for 2 hours has the most micropores and mesopores. It is hence
selected to conduct the adsorption tests on real water samples.
19

Table 3-2 Characterization of 850°C-activated CBPP AC samples
Samples Iodine No. (mg/g)
Methylene blue value (mg/g)
CBPP AC-850°C-1hr 515.16 142.98 CBPP AC-850°C-2hr 704.53 193.47 CBPP AC-850°C-3hr 617.63 148.24
0 1 2 3 4500
550
600
650
700 Iodine No. MB Value
Activation time (hr)
I (m
g/g)
140
150
160
170
180
190
200
MB (m
g/g)
Figure 3-2 Iodine No. and MB value of CBPP samples activated with different time lengths
3.2.3 Scanning electron microscopy (SEM)
The surface microstructure images of CBPP FA-Clean and CBPP AC-850°C-2hr are observed
by SEM and shown below. Comparing Figure 3-3 (a) with (b), a dense porous structure was
formed after activation, which is in accordance with the results of iodine and methylene blue
tests.
20

Figure 3-3 SEM images of carbon particles surface microstructures: (a) before activation; (b)
after activation
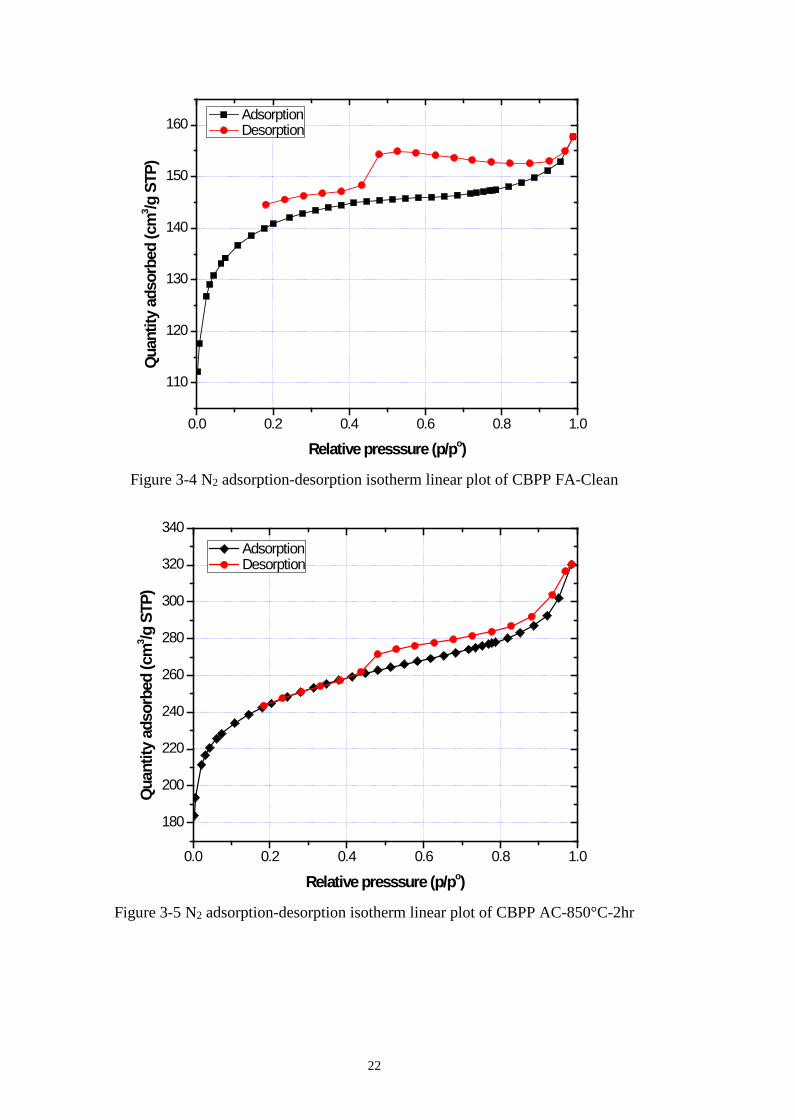
3.2.4 Surface area and pore volume
The BET surface area and porosity analysis was conducted to further assess how well the CBPP
carbon has been activated. As listed in Table 3-3, there is a significant improvement on surface
area, micropore area and pore volume in the sample after activation. Nitrogen (N2) adsorption-
desorption isotherm curves for both samples are also plotted in Figure 3-4 and Figure 3-5,
respectively. It is revealed that the adsorption rate of the carbon sample is highly improved after
activation, which is also in accordance with the iodine and methylene blue test results. More
information of BET surface area and porosity analysis can be found in appendices A and B.
Table 3-3 Surface area and pore volume of CBPP clean and activated carbon
Samples Surface area (m2/g)
Micropore area (m2/g)
Pore volume (cm3/g)
CBPP FA-Clean 486.44 402.50 0.18 CBPP AC-850°C-2hr 847.26 619.49 0.28
a) b)
21
0.0 0.2 0.4 0.6 0.8 1.0
110
120
130
140
150
160
Quan
tity
adso
rbed
(cm
3 /g S
TP)
Relative presssure (p/po)
Adsorption Desorption
Figure 3-4 N2 adsorption-desorption isotherm linear plot of CBPP FA-Clean
0.0 0.2 0.4 0.6 0.8 1.0
180
200
220
240
260
280
300
320
340
Quan
tity
adso
rbed
(cm
3 /g S
TP)
Relative presssure (p/po)
Adsorption Desorption
Figure 3-5 N2 adsorption-desorption isotherm linear plot of CBPP AC-850°C-2hr
22

4 Batch Test Evaluation of CBPP Activated Carbon
After evaluating the adsorption capacity of iodine and methylene blue by CBPP AC, real water
samples was applied to further evaluate the adsorption of organic matter through batch test.
Small rural communities in NL are suffering from the problem of disinfection by products
(DBPs) in their drinking water for many years. Since those communities have very small
populations and are lack of sufficient budget to install and maintain water treatment facilities,
the most common way of source water pretreatment is to add chlorine for disinfection purpose
(ENVC, 2015). Once the source water contains high level of natural organic matters, the DBPs,
which have been identified as potential health hazards in long-term exposure, are formed in the
drinking water (USEPA, 2009; ENVC, 2009a). Hence, this part of study mainly evaluated the
performance of the CBPP AC-850°C-2hr on the adsorption of natural organic matters in real
water samples using a jar test.
4.1 Characterization of water samples
4.1.1 Methodology
The source water sample was collected from a local community that highly concerns about the
DBPs in their drinking water systems. The natural organic matter in the source water was
characterized by measuring the total organic carbon (TOC). Other parameters of pH, alkalinity,
color, turbidity, UV at the wavelength of 254 nm, and total dissolved solids (TDS) were also
characterized.
4.1.2 Results and discussion
The characteristics of the source water sample are listed in Table 4-1. The pH, turbidity and
TDS of the analyzed source water are all within the Canadian drinking water quality guidelines.
Only the level of color exceeds that in the guideline. Color is prevalent in natural source waters
especially surface waters. The higher level of color indicates more organic matter in the water.
23
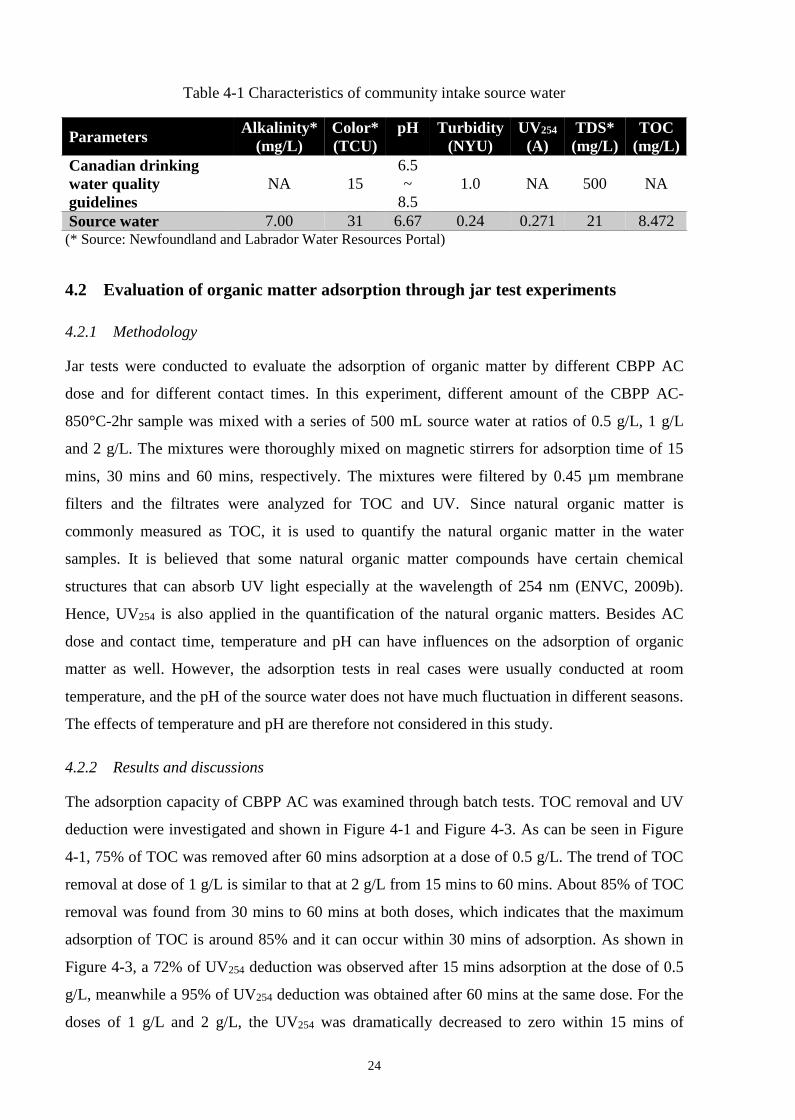
Table 4-1 Characteristics of community intake source water
Parameters Alkalinity* (mg/L)
Color* (TCU)
pH
Turbidity (NYU)
UV254 (A)
TDS* (mg/L)
TOC (mg/L)
Canadian drinking water quality guidelines
NA 15 6.5 ~
8.5 1.0 NA 500 NA
Source water 7.00 31 6.67 0.24 0.271 21 8.472 (* Source: Newfoundland and Labrador Water Resources Portal)
4.2 Evaluation of organic matter adsorption through jar test experiments
4.2.1 Methodology
Jar tests were conducted to evaluate the adsorption of organic matter by different CBPP AC
dose and for different contact times. In this experiment, different amount of the CBPP AC-
850°C-2hr sample was mixed with a series of 500 mL source water at ratios of 0.5 g/L, 1 g/L
and 2 g/L. The mixtures were thoroughly mixed on magnetic stirrers for adsorption time of 15
mins, 30 mins and 60 mins, respectively. The mixtures were filtered by 0.45 µm membrane
filters and the filtrates were analyzed for TOC and UV. Since natural organic matter is
commonly measured as TOC, it is used to quantify the natural organic matter in the water
samples. It is believed that some natural organic matter compounds have certain chemical
structures that can absorb UV light especially at the wavelength of 254 nm (ENVC, 2009b).
Hence, UV254 is also applied in the quantification of the natural organic matters. Besides AC
dose and contact time, temperature and pH can have influences on the adsorption of organic
matter as well. However, the adsorption tests in real cases were usually conducted at room
temperature, and the pH of the source water does not have much fluctuation in different seasons.
The effects of temperature and pH are therefore not considered in this study.
4.2.2 Results and discussions
The adsorption capacity of CBPP AC was examined through batch tests. TOC removal and UV
deduction were investigated and shown in Figure 4-1 and Figure 4-3. As can be seen in Figure
4-1, 75% of TOC was removed after 60 mins adsorption at a dose of 0.5 g/L. The trend of TOC
removal at dose of 1 g/L is similar to that at 2 g/L from 15 mins to 60 mins. About 85% of TOC
removal was found from 30 mins to 60 mins at both doses, which indicates that the maximum
adsorption of TOC is around 85% and it can occur within 30 mins of adsorption. As shown in
Figure 4-3, a 72% of UV254 deduction was observed after 15 mins adsorption at the dose of 0.5
g/L, meanwhile a 95% of UV254 deduction was obtained after 60 mins at the same dose. For the
doses of 1 g/L and 2 g/L, the UV254 was dramatically decreased to zero within 15 mins of
24
adsorption, which illustrates the CBPP AC is extremely effective in UV254 deduction in the
adsorption experiments. Comparing TOC removal with UV254 deduction at the carbon dose of 1
g/L with 15 mins adsorption time, 74% of TOC was removed while 100% UV254 deduction was
detected. As stated earlier, both TOC and UV were used to quantify the organic matter. The big
difference in the TOC removal and UV deduction results implied that some of the organic
compounds in the water sample cannot absorb UV light at the wavelength of 254 nm. From
another point of view, it also illustrates that this CBPP AC is more effective in the adsorption of
light-sensitive organic matters. The same phenomenon was also discovered in the column
experiment in the next chapter.
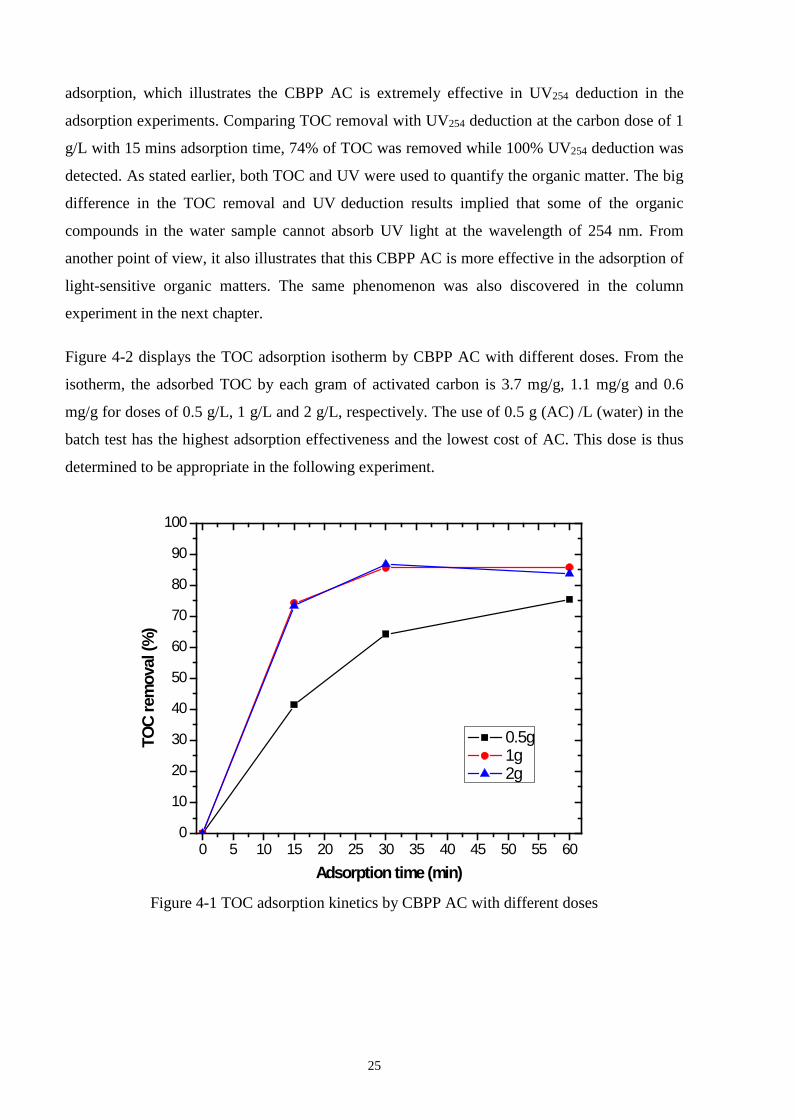
Figure 4-2 displays the TOC adsorption isotherm by CBPP AC with different doses. From the
isotherm, the adsorbed TOC by each gram of activated carbon is 3.7 mg/g, 1.1 mg/g and 0.6
mg/g for doses of 0.5 g/L, 1 g/L and 2 g/L, respectively. The use of 0.5 g (AC) /L (water) in the
batch test has the highest adsorption effectiveness and the lowest cost of AC. This dose is thus
determined to be appropriate in the following experiment.
0 5 10 15 20 25 30 35 40 45 50 55 600
10
20
30
40
50
60
70
80
90
100
TOC
rem
oval
(%)
Adsorption time (min)
0.5g 1g 2g
Figure 4-1 TOC adsorption kinetics by CBPP AC with different doses
25

0.4 0.6 0.8 1.0 1.2 1.4 1.6 1.8 2.0 2.2
0.5
1.0
1.5
2.0
2.5
3.0
3.5
4.0
Adso
rbed
TOC
(mg/
g A
C)
AC dose (g)
Figure 4-2 TOC adsorption isotherm by CBPP AC with different doses
0 6 12 18 24 30 36 42 48 54 600
10
20
30
40
50
60
70
80
90
100
110
UV d
educ
tion
(%)
Adsorption time (min)
0.5g 1g 2g
Figure 4-3 UV deduction by CBPP AC with different doses
26

5 Development of Carbon Filtration Technology
Carbon filtration technology has been widely applied in water and wastewater treatment for
many years. Commercialized carbon filtration systems are frequently designed to be in the form
of fixed bed adsorption units. Hence, in the last part of this study, a lab scale fixed bed carbon
filtration system was developed, and a preliminary test was conducted to estimate the adsorption
efficiency of CBPP AC on natural organic matter in real water samples.
5.1 Design of a carbon filtration system
An acrylic glass column with 30 cm length and 40 mm diameter is made to implement the
carbon filtration technology in the lab. In general, a 0.45 µm membrane filter paper is placed at
the bottom of the column and 5 g CBPP AC-850°C-2hr sample is then packed into the column.
The column top part is connected to a water reservoir which contains water samples to be
treated, and the water will pass through the column in a down flow mode. A peristaltic pump is
connected at the column outflow to control the filtration speed. A sketch of the filtration system
is displayed in Figure 4-1. When the water enters the column, and passes through the carbon
barrier, the natural organic matter in water can be adsorbed by the activated carbon so that the
formation of DBPs can be avoided or mitigated.
27
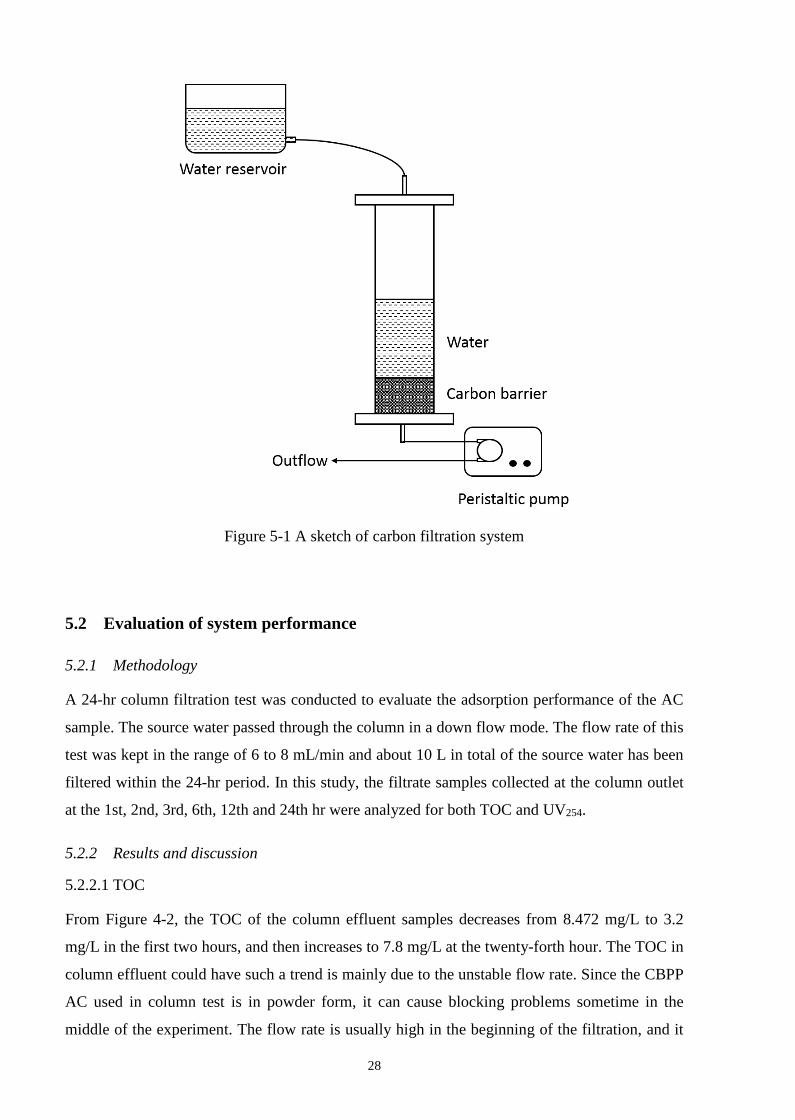
Figure 5-1 A sketch of carbon filtration system
5.2 Evaluation of system performance
5.2.1 Methodology
A 24-hr column filtration test was conducted to evaluate the adsorption performance of the AC
sample. The source water passed through the column in a down flow mode. The flow rate of this
test was kept in the range of 6 to 8 mL/min and about 10 L in total of the source water has been
filtered within the 24-hr period. In this study, the filtrate samples collected at the column outlet
at the 1st, 2nd, 3rd, 6th, 12th and 24th hr were analyzed for both TOC and UV254.
5.2.2 Results and discussion
5.2.2.1 TOC
From Figure 4-2, the TOC of the column effluent samples decreases from 8.472 mg/L to 3.2
mg/L in the first two hours, and then increases to 7.8 mg/L at the twenty-forth hour. The TOC in
column effluent could have such a trend is mainly due to the unstable flow rate. Since the CBPP
AC used in column test is in powder form, it can cause blocking problems sometime in the
middle of the experiment. The flow rate is usually high in the beginning of the filtration, and it
28

will gradually become slow. When the flow rate slows down, the contact time between carbon
and water sample will be extended. Therefore, the TOC in the column effluent was decreasing in
the first few hours. To overcome the blocking problem, a granular type of activated carbon is
suggested in future study.
Comparing the original source water with the column effluent sample at the end of the second
hour, more than 60% of the organic matter has been adsorbed or removed by the carbon barrier.
After 2 hours, the organic matter in the column effluent starts to increase but still below the
original level, which implies that the adsorption rate of the carbon barrier is decreasing. After 24
hours, the TOC of the column effluent sample is close to 8 mg/L, which reveals that the carbon
barrier becomes almost saturated. Continuous filtration after 24 hours is therefore not suggested.
5.2.2.2 UV
From Figure 4-3, the result of UV254 has a similar trend as that of TOC, because of the blocking
problem in the column. The UV254 of the column outflow sample decreases from 0.271 A to
0.04 A within three hours filtration, and then it increases to 0.164 A at the end of twenty-four
hour. The TOC of the 24th hour sample is about 92% of the original water sample, which
indicates the carbon barrier is 92% saturated. However, the UV254 of the same sample is only
61% of the original water sample, which implies the carbon barrier is only 61% saturated. The
big difference in the saturation degree from both results could possibly because some natural
organic matters in the source water do not have UV-absorbing chemical structures. It also
proves that the CBPP AC is more effective in adsorbing light sensitive organic matters. This
phenomenon is also observed in the batch test, which may hint that the TOC results are more
reliable than the UV results in this study.
29

0 2 4 6 8 10 12 14 16 18 20 22 24
3
4
5
6
7
8
TOC
(mg/
L)
Filtration time (hour)
Figure 5-2 TOC concentration in column effluent within 24-hrs filtration
0 2 4 6 8 10 12 14 16 18 20 22 24
0.04
0.06
0.08
0.10
0.12
0.14
0.16
0.18
UV25
4 (A
)
Filtration time (hour)
Figure 5-3 UV254 in column effluent within 24-hrs filtration
30

6 Conclusions and Recommendations
6.1 Conclusions
The fly ash generated from Corner Brook Pulp and Paper Ltd. was transformed to activated
carbon in a high temperature tube furnace in this study. Effects of two factors including
activation temperature and activation time were investigated. Iodine number, methylene blue
value, surface microstructure, surface area and pore volume were all analyzed to assess the
adsorption capacity of different carbon samples. Iodine number and methylene blue value of a
activated carbon sample can have sort of correlations to its surface area and pore volume, the
higher the iodine number and methylene blue value are, the larger the surface area and pore
volume the sample has. Due to the difficulties in sending multiple samples for analysis in
another university, only the clean carbon and the activated carbon with highest iodine number
and methylene blue value are sent for BET analysis. In this study, the sample activated under
850 °C for 2 hrs has the highest iodine number (704.53 mg/g) and methylene blue value (193.47
mg/g). Hence, it is selected to conduct further assessment on surface area and pore volume.
Comparing the CBPP FA-Clean sample with the CBPP FA-850 °C-2hr sample, it is investigated
that the surface area was significantly increased from 486.44 m2/g to 847.26 m2/g. Meanwhile,
the pore volume increased from 0.18 cm3/g to 0.28 cm3/g. The result of scanning electron
microscopy also reveals that there are lots of pores developed on the sample surface after
activation at 850 °C for 2 hrs.
The generation of activated carbon from fly ash can help CBPP with their waste management,
and the activated carbon with high adsorption capacity can have some further applications such
as water treatment. Batch test was firstly conducted to evaluate the adsorption efficiency of the
CBPP FA-850 °C-2hr on natural organic matter removal. It is revealed that the use of 0.5 g (AC)
/L (water) has the highest adsorption effectiveness, and the CBPP AC is more effective in the
adsorption of light-sensitive organic matters. A column filtration technology was then developed
to further evaluate the adsorption capacity of the activated carbon. The column is 30 cm length
and 40 mm diameter, and the CBPP FA-850 °C-2hr sample was placed at the bottom of the
column to act as a carbon barrier. Water sample from a local community was continuously
passed through the column for 24 hours. The organic matter, measured as total organic matter,
in the water sample before and after the filtration was analyzed. Results indicate that more than
60% of the organic matter can be removed by the carbon barrier within 2 hours filtration.
31

Results also illustrate that the carbon barrier is effective in the decrease of UV254. Above all, the
activated carbon generated from CBPP fly ash is proved to be potentially applied in the water
treatment area.
6.2 Recommendations
The column filtration experiment was conducted for 24 hours in the laboratory. After 2 hours,
the organic matter in the column outflow starts to increase which implies that the activated
carbon is gradually getting saturated. Therefore, continuous filtration beyond 24 hours is not
suitable for the water sample in this study. To make the activated carbon more applicable in
water treatment, the adsorption capacity of the carbon should be further improved, which means
the carbon surface area and pore volume should be further developed. Some methods such as
chemical, and steam activation are recommended.
Moreover, granular activated carbon is suggested to be applied in a column filtration system,
since the use of activated carbon powder can cause blocking problems and difficulties in the
flow rate control. More research should be conducted on the granulation of the lab-generated
activated carbon and the assessment of its performance in column filtration systems in the future
study.
In addition, the regeneration of activated carbon is another point that should be considered in the
feasibility study since the regeneration of activated carbon is more convenient and cost-effective
to the small communities. The carbon barrier after filtration experiment can be reactivated
following the same activation conditions so that the regeneration effect can be evaluated.
Finally, a leaching test should be conducted on the generated activated carbon to make sure no
impurities will be leached into the water after treatment.
32

References
Ahmad, M. (2013). Affordable filtration technology of safe drinking water for rural Newfoundland, M.Eng. Thesis, Memorial University of Newfoundland, St. John’s, Canada.
Ahmed, M. J., & Dhedan, S. K. (2012). Equilibrium isotherms and kinetics modeling of methylene blue adsorption on agricultural wastes-based activated carbons. Fluid Phase Equilibria, vol. 317, pp. 9-14.
Aslam, Z., Shawabkeh, R. A., Hussein, I. A., Al-Baghli, N., & Eic, M. (2015). Synthesis of activated carbon from oil fly ash for removal of H2S from gas stream. Applied Surface Science, 327, 107-115.
ASTM D2866-11. (2011). Standard Test Method for Total Ash Content of Activated Carbon, ASTM International, West Conshohocken, PA, 2011, https://doi.org/10.1520/D2866-11
ASTM D2867-09. (2014). Standard Test Methods for Moisture in Activated Carbon, ASTM International, West Conshohocken, PA, 2014, https://doi.org/10.1520/D2867-09R14
ASTM D3838-05. (2017). Standard Test Method for pH of Activated Carbon, ASTM International, West Conshohocken, PA, 2017, https://doi.org/10.1520/D3838-05R17
ASTM D4607-14. (2014). Standard Test Method for Determination of Iodine Number of Activated Carbon, ASTM International, West Conshohocken, PA, 2014, https://doi.org/10.1520/D4607-14
Attia, A. A., Girgis, B. S., & Fathy, N. A. (2008). Removal of methylene blue by carbons derived from peach stones by H3PO4 activation: batch and column studies. Dyes and Pigments, 76(1), 282-289.
Banarjee, S. S., Joshi, M. V., & Jayaram, R. V. (2004). Removal of Cr (VI) and Hg (II) from aqueous solutions using fly ash and impregnated fly ash. Sep. Sci. Technol, vol. 39 (7), pp. 1611-1629.
Chang, C. F., Chang, C. Y., & Tsai, W. T. (2000). Effects of burn-off and activation temperature on preparation of activated carbon from corn cob agrowaste by CO2 and steam. Journal of Colloid and Interface Science, 232(1), 45-49.
Davini, P. (2002). Flue gas treatment by activated carbon obtained from oil-fired fly ash. Carbon, 40(11), 1973-1979.
Department of Environment and Climate Change. (2017). Government of Newfoundland and Labrador. http://www.ecc.gov.nl.ca/env_protection/ics/pulp.html
ENVC. (2009a). Best management practices for the control of disinfection by-products in drinking water systems in Newfoundland and Labrador. Government of Newfoundland and Labrador, Department of Environment and Conservation, Water Resources Management Division. St. John’s, NL.
ENVC. (2009b). Study on characteristics and removal of natural organic matter in drinking water systems in Newfoundland and Labrador. Government of Newfoundland and Labrador, Department of Environment and Conservation, Water Resources Management Division. St. John’s, NL.
ENVC. (2015). Drinking water safety annual report 2015. Government of Newfoundland and Labrador, Department of Environment and Conservation, Water Resources Management Division. St. John’s, NL.
Gode, F., & Pehlivan, E. (2006). Chromium (VI) adsorption by brown coals. Energy Sources, vol. 28 (5), pp. 447-457.
Husain, T., Ahmad, M., & Mofarrah, A. (2012). 15th Canadian Drinking Water Conference, 21-23 Nov., Kelowna, BC, Canada.
Itodo, A. U., Abdulrahman, F. W., Hassan, L. G., Maigandi, S. A., & Itodo, H. U. (2010). Application of methylene blue and iodine adsorption in the measurement of specific surface area by four acid and salt treated activated carbons. NY Sci J, 3(5), 25-33.
33

Janoš, P., Buchtova, H., & Rýznarová, M. (2003). Sorption of dyes from aqueous solutions onto fly ash. Water research, 37(20), 4938-4944.
Jegadeesan, G. B., Mondal, K., & Lalvani, S. B. (2015). Adsorption of Se (IV) and Se (VI) Using Copper-Impregnated Activated Carbon and Fly Ash-Extracted Char Carbon. Water, Air, & Soil Pollution, 226(8), 234.
Krupa, N. E., & Cannon, F. S. (1996). GAC: pore structure versus dye adsorption. American Water Works Association. Journal, 88(6), 94.
Kurniawan, T. A., Chan, G. Y. S., Lo, W., & Babel, S. (2006). Comparisons of low-cost adsorbents for treating wastewaters laden with heavy metals. Science of the Total Environment, 366: 409-426.
Ling, J. J., Zhang, H., & Husain, T. (2016). Safe drinking water supply for small and rural communities in Newfoundland and Labrador with a case study of Pouch Cove. The Harris Centre – RBC Water Research and Outreach Fund, final report. https://www.mun.ca/harriscentre/reports/Final-RBC_Water_2013-14.pdf
Mofarrah A. (2014). Environmental management and potential use of heavy oil fly ash, PhD Thesis, Memorial University of Newfoundland, St. John’s, NL, Canada.
Mofarrah, A., & Husain, T. (2013). Evaluation of environmental pollution and possible management options of heavy oil fly ash. Journal of Material Cycles and Waste Management, 15(1), 73-81.
National Standard of the People’s Republic of China. (2008). Test method for granular activated carbon from coal-determination of methylene blue adsorption. GB/T 7702.6-2008.
Rodriguez-Reinoso, F. (1997). In: Introduction to carbon technology. Marsh H., Heintz E.A., and Rodriguez-Reinoso, F., ed. Alicante: Printer of the University of Alicante, 35-101.
Rufford, T. R., Hulicova-Jurcakova, D., & Zhu, J. (Ed.). (2014). Green carbon materials: advances and applications. Pan Stanford Publishing.
Salehin, S., Aburizaiza, A. S., & Barakat, M. A. (2016). Activated carbon from residual oil fly ash for heavy metals removal from aqueous solution. Desalination and Water Treatment, 57(1), 278-287.
Sarkar, M., & Acharya, K. P. (2006). Use of fly ash for the removal of phenol and its analogues from contaminated water. Waste Management, vol. 26, pp. 559-570.
U.S.EPA. (2009). National primary drinking water regulation. EPA 816-F-09-0004. Yan, C., Wang, C., Yao, J., Zhang, L., & Liu, X. (2009). Adsorption of methylene blue on
mesoporous carbons prepared using acid-and alkaline-treated zeolite X as the template. Colloids and Surfaces A: Physicochemical and Engineering Aspects, 333(1), 115-119.
34

Appendix A
BET surface area and porosity analysis report of the CBPP FA-Clean sample.
35

36

37

38
39

40

41

42

43

44

Appendix B
BET surface area and porosity analysis report of the CBPP AC-850°C-2hr sample.
45

46

47
48

49

50

51
52
53
Top Related