


Languages
Pages
Legal


Bronchiectasis Domiciliary treatment
Prof. Adam Hill
Royal Infirmary and University of Edinburgh
Plan of talk
• Background of bronchiectasis
• Who requires IV antibiotics
• Domiciliary treatment
• Results to date….

PROBLEM • CHRONIC COUGH
• CHRONIC SPUTUM PRODUCTION
• RECURRENT CHEST INFECTIONS
• FATIGUE… MALAISE…. CHEST PAIN... POOR QOL

Ref N INF IMMUNE CT ABPA CF Ciliary IBD Asp Cong No cause
1995 123 42% 4% 4% 30%
2000 150 29% 8% 3% 7% 3% 2% 1% 4% 1% 53%
2003 100 33% 1% 6% 1% 41%
2015* 236 17.4% 7.1% 4.7% 3% 4.6% See CT
2.5% See CF/Cil
47.9%
2015 $$
1258 20% 5.8% 10% 40%
Nicotra et al Chest1995;108:955-61 Pasteur et al Am J Respir Crit Care Med 2000;162:1277-84 Kelly et al Eur J Intern Med 2003;14:488-92 Altenburg Neth J Med MAY 2 0 15 , V OL . 7 3 , N O 4 Lonni Ann Am Thorac Soc Vol 12, No 12, pp 1764–1770, Dec 2015
*Asthma 11.4% $$ Asthma 3.3%; COPD 15%

Primary care database Study population 18 793
Asthma 7988 (42.5)
Chronic obstructive pulmonary disease 6774 (36.1)
HIV 1300 (6.9)
Rheumatoid arthritis 1163 (6.2)
Other connective tissue diseases 969 (5.2)
Inflammatory bowel disease 527 (2.8)
Bone marrow transplant 20 (0.11)
Hypogammaglobulinaemia 172 (0.9)
Allergic bronchopulmonary aspergillosis 339 (1.8)
None of these comorbidities 6422 (34.2)
Jennifer K. Quint et al. Eur Respir J 2016;47:186-193

Conventional Microbiology Culture pathogenic microorganisms were isolated in 75% of patients Environmental mycobacteria 2-30%; Metanalysis 9.2%
Am J Respir Crit Care Med. 2012;186(7):657-65
38.6
21
12.4
11.4
9.7
9.3Haemophilusinfluenzae
Pseudomonasaeruginosa
Staphylococcusaureus
Moraxellacatarrhalis
Streptococcuspneumoniae
Others
Arch Med Sci 2014; 10: 661-8

• 21 Cohort studies • 3,683 patients
Ps. aeruginosa
Thorax. 2012 Oct;67(10):928-30.
Thorax. 2014 Mar;69(3):292-4.
OR
Mortality 2.95, 95% CI 1.98-4.40
Hospital admissions 6.57, 95% CI 3.19-13.51
Mean difference exacerbations 0.97 per year, 95% CI 0.64-1.30
SGRQ 18.2, 95% CI 14.7-21.8
0
5
10
15
20
25
30
2010 2011 2012
Pseudomonasaeruginosa
201020112012
Ann Am Thor Soc2015 Sep 10

BTS Gx 1010- needing antibiotics?
Exacerbations requiring
antibiotic therapy
Increased cough + wheeze +
breathlessness + systemic upset
Increased sputum
purulence
Increased sputum volume or change
of viscosity

IV ANTIBIOTICS FOR 14 DAYS BTS Gx 2010
• NEED HOSPITAL ADMISSION BECAUSE SEVERE EXACERBATION • FAILURE OF AN APPROPRIATE ORAL ANTIBIOTIC
• HAS A PATHOGEN ONLY RESPONSIVE TO INTRAVENOUS ANTIBIOTIC THERAPY eg. Ps. aeruginosa

UK %
ITALY %
People with bronchiectasis receiving intravenous antibiotic treatment to have an objective evaluation of the efficacy of their treatment and the result recorded
78 N/A
Services for people with bronchiectasis to include provision of home intravenous antibiotic treatment for exacerbations in selected patients
40 2.3
Thorax. 2014 Mar;69(3):292-4. Eur Respir J. 2016 Jul;48(1):244-8
Quality Standards for Bronchiectasis

Domiciliary treatment
• Respiratory nurse specialists *3
• Pharmacist- information booklets; epipen
• Long lines; portacatheters
• Website with video
www.bronchiectasis.scot.nhs.uk
• Assessments
1] assess safe to deliver self administered therapy
2] baseline assessment, d7 and d14

IV Antibiotic therapy N=196 over 5y
40.8
16.3
42.9 Hospital ESD Home
Primary Care Respiratory Medicine (2014) 24, 14090
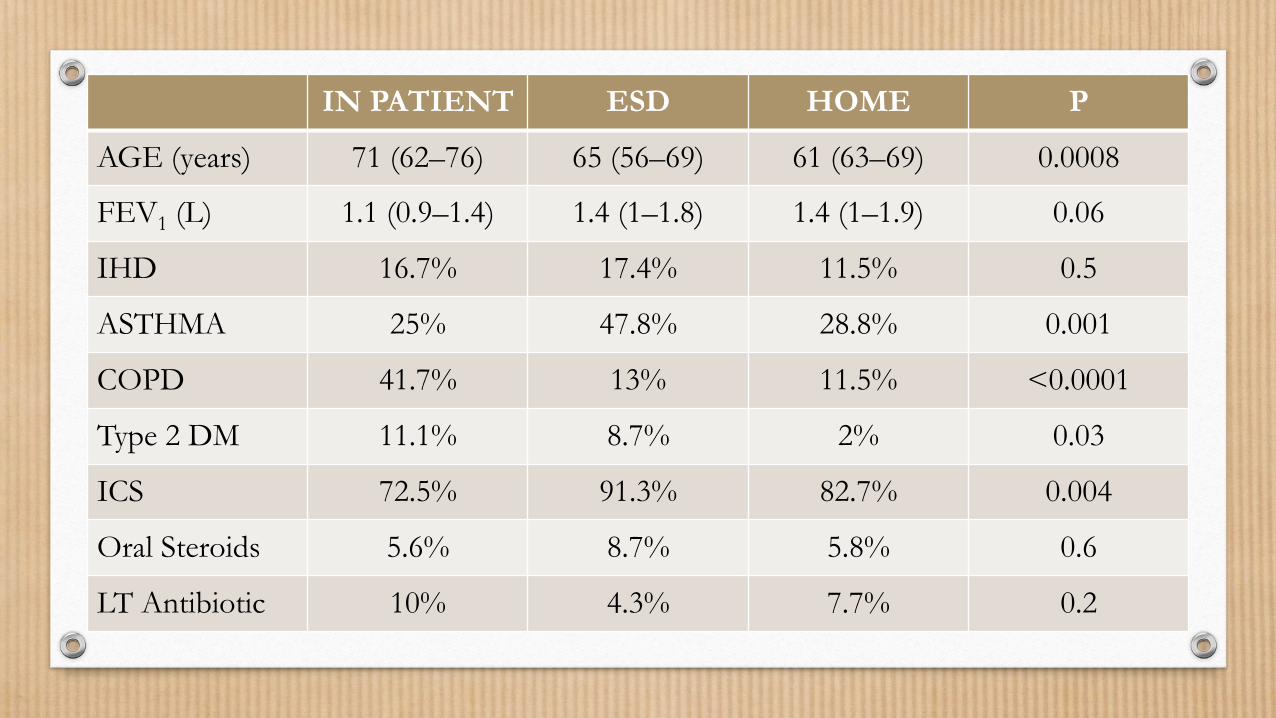
IN PATIENT ESD HOME P
AGE (years) 71 (62–76) 65 (56–69) 61 (63–69) 0.0008
FEV1 (L) 1.1 (0.9–1.4) 1.4 (1–1.8) 1.4 (1–1.9) 0.06
IHD 16.7% 17.4% 11.5% 0.5
ASTHMA 25% 47.8% 28.8% 0.001
COPD 41.7% 13% 11.5% <0.0001
Type 2 DM 11.1% 8.7% 2% 0.03
ICS 72.5% 91.3% 82.7% 0.004
Oral Steroids 5.6% 8.7% 5.8% 0.6
LT Antibiotic 10% 4.3% 7.7% 0.2
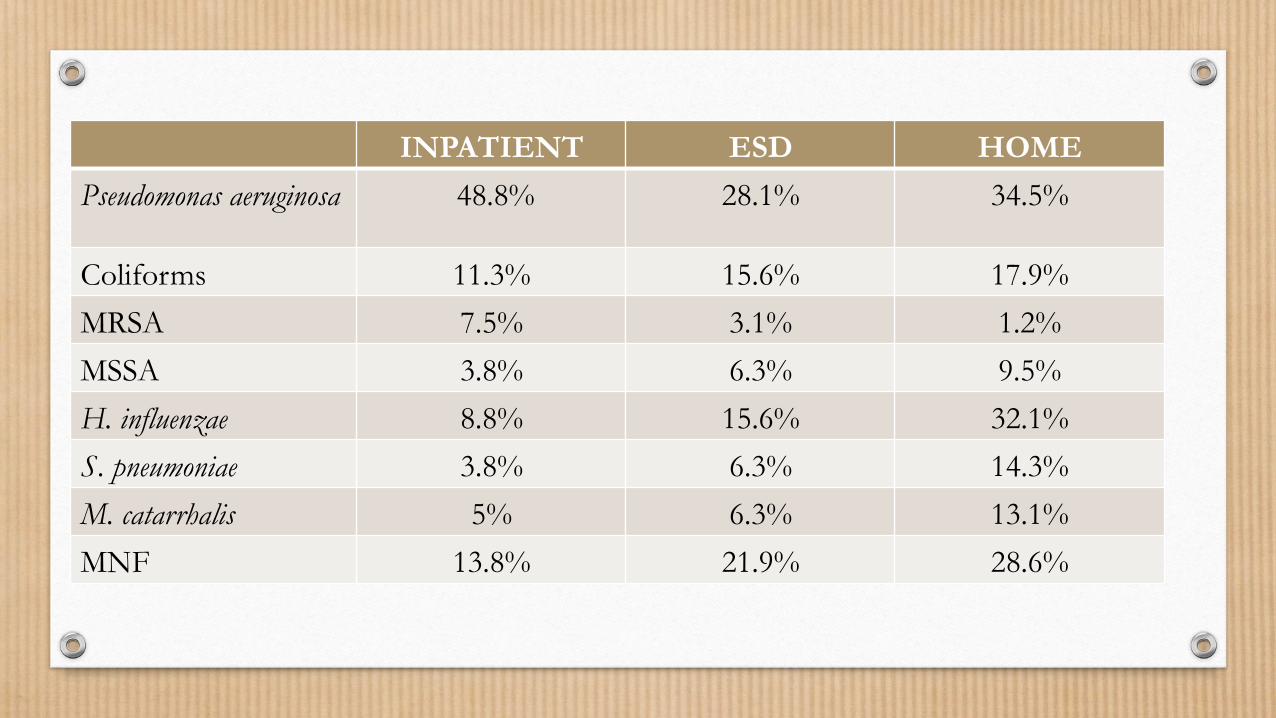
INPATIENT ESD HOME
Pseudomonas aeruginosa 48.8% 28.1% 34.5%
Coliforms 11.3% 15.6% 17.9%
MRSA 7.5% 3.1% 1.2%
MSSA 3.8% 6.3% 9.5%
H. influenzae 8.8% 15.6% 32.1%
S. pneumoniae 3.8% 6.3% 14.3%
M. catarrhalis 5% 6.3% 13.1%
MNF 13.8% 21.9% 28.6%
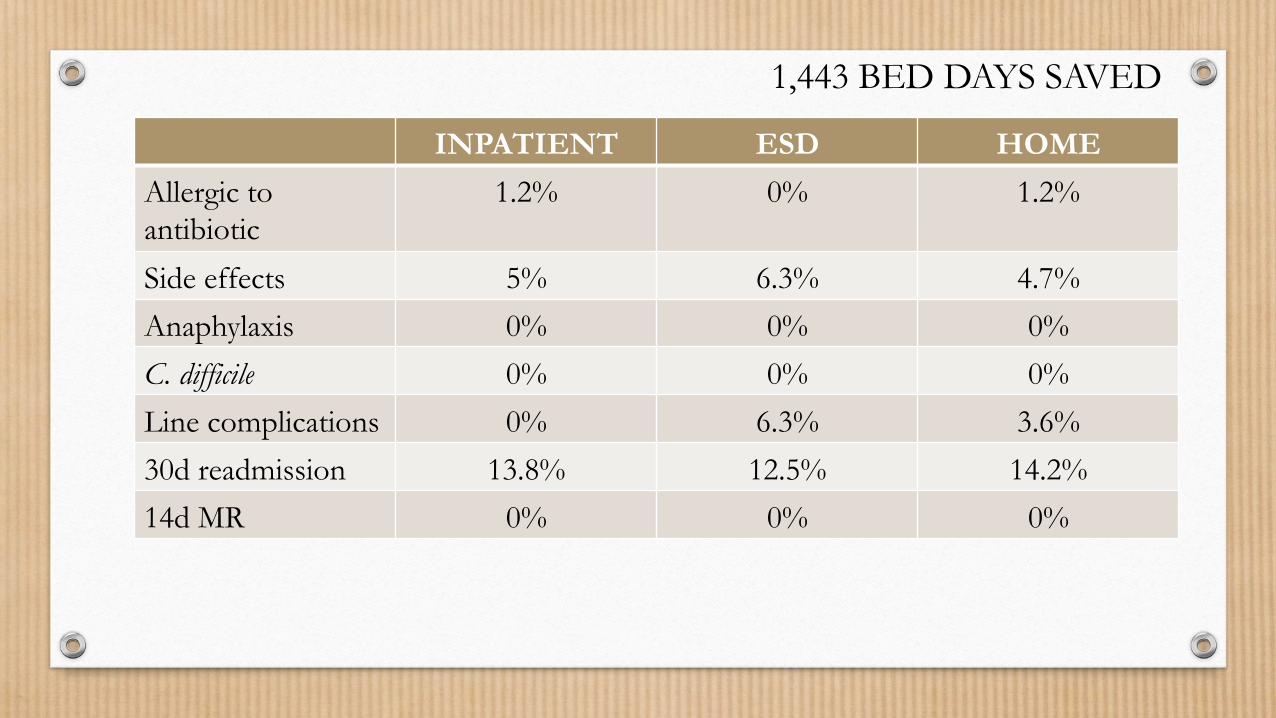
INPATIENT ESD HOME
Allergic to antibiotic
1.2% 0% 1.2%
Side effects 5% 6.3% 4.7%
Anaphylaxis 0% 0% 0%
C. difficile 0% 0% 0%
Line complications 0% 6.3% 3.6%
30d readmission 13.8% 12.5% 14.2%
14d MR 0% 0% 0%
1,443 BED DAYS SAVED
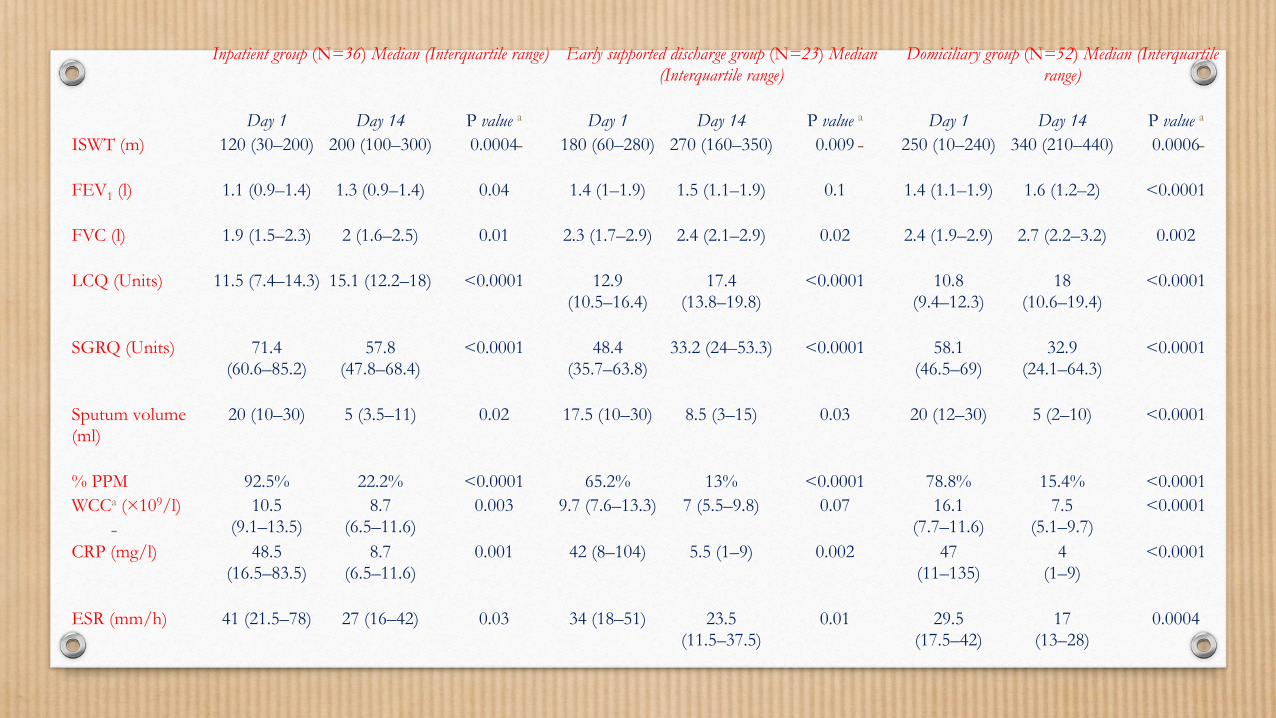
Inpatient group (N=36) Median (Interquartile range) Early supported discharge group (N=23) Median (Interquartile range)
Domiciliary group (N=52) Median (Interquartile range)
Day 1 Day 14 P value a Day 1 Day 14 P value a Day 1 Day 14 P value a ISWT (m) 120 (30–200) 200 (100–300) 0.0004 180 (60–280) 270 (160–350) 0.009 250 (10–240) 340 (210–440) 0.0006
FEV1 (l) 1.1 (0.9–1.4) 1.3 (0.9–1.4) 0.04 1.4 (1–1.9) 1.5 (1.1–1.9) 0.1 1.4 (1.1–1.9) 1.6 (1.2–2) <0.0001
FVC (l) 1.9 (1.5–2.3) 2 (1.6–2.5) 0.01 2.3 (1.7–2.9) 2.4 (2.1–2.9) 0.02 2.4 (1.9–2.9) 2.7 (2.2–3.2) 0.002
LCQ (Units) 11.5 (7.4–14.3) 15.1 (12.2–18) <0.0001 12.9 (10.5–16.4)
17.4 (13.8–19.8)
<0.0001 10.8 (9.4–12.3)
18 (10.6–19.4)
<0.0001
SGRQ (Units) 71.4 (60.6–85.2)
57.8 (47.8–68.4)
<0.0001 48.4 (35.7–63.8)
33.2 (24–53.3) <0.0001 58.1 (46.5–69)
32.9 (24.1–64.3)
<0.0001
Sputum volume (ml)
20 (10–30) 5 (3.5–11) 0.02 17.5 (10–30) 8.5 (3–15) 0.03 20 (12–30) 5 (2–10) <0.0001
% PPM 92.5% 22.2% <0.0001 65.2% 13% <0.0001 78.8% 15.4% <0.0001 WCCa (×109/l) 10.5
(9.1–13.5) 8.7
(6.5–11.6) 0.003 9.7 (7.6–13.3) 7 (5.5–9.8) 0.07 16.1
(7.7–11.6) 7.5
(5.1–9.7) <0.0001
CRP (mg/l) 48.5 (16.5–83.5)
8.7 (6.5–11.6)
0.001 42 (8–104) 5.5 (1–9) 0.002 47 (11–135)
4 (1–9)
<0.0001
ESR (mm/h) 41 (21.5–78) 27 (16–42) 0.03 34 (18–51) 23.5 (11.5–37.5)
0.01 29.5 (17.5–42)
17 (13–28)
0.0004

IV Antibiotic therapy N=243 over 2y
13.9% via emergency services
27.2
11.5 61.3
% treated Ivs
Hospital ESD Home
Anaphylaxis IV access related complications
30d readmission
MR
Hospital 0% 3% 10.6% 3%
ESD 0% 7.1% 17.8% 0%
Home 0% 0.7% 1.3% 0%
MV analysis- risk factors for hospital treatment • High BSI • Presentation to emergency services
QJM. 2016 Nov;109(11):723-729.

Summary
• About 60-70% patients needing intravenous antibiotics can be taught to deliver at home
• This can be done safely with limited morbidity and no increase in mortality
• Main complications relate to line issues but infrequent
• This service has majorly reduced hospital bed days and promoted treatment in the community….

Top Related