


Languages
Pages
Legal


Briefing Book Table of Contents
Implementation Assessment Tool
D.C. Preparation Meeting August 23-24, 2009
Introduction
A. Welcome and Logistics Memo B. Agenda C. List of Participants D. Participant Biographies
Background Information
A. The Carter Center’s Access to Information Project B. Carter Center Implementation Assessment Tool Concept Paper C. Carter Center Research: Draft Model Implementation Plan
Relevant Articles and Studies
A. The Development of Instruments to Measure Democratic Governance: Central Tasks and Basic Problems, Gerardo L. Munck
B. Open Democracy Advice Centre: Openness & Responsiveness Awards 2008, ODAC a. ODAC GKA Indicators 2008 b. ODAC Information Officer Questionnaire
C. The Global Integrity Report: 2008, Methodology White Paper, Global Integrity D. Access to Information Monitoring Initiative, World Bank E. Open Government: beyond static measures, Involve for the OECD F. Safeguarding the Right to Information, RaaG & NCPRI G. The Assessment Indicator System for FOI Work in Shanghai, Webing & Snell H. The Access to Information Monitoring Tool, OSI

August 19, 2009
Dear Colleague: In a few days you will be traveling to Washington, D.C. for our implementation assessment tool preparatory meeting, and we are so pleased that you are able to join us. We are certain that this meeting will be productive and enlightening as we share our distinctive expertise to design the ATI implementation assessment tool. During the course of our short time together, we hope that we will take great strides in determining the key components necessary for full and effective implementation of an access to information regime. Once these actions/inputs are identified and quantified, we will then explore the appropriate indicators and means for data collection and measurement. At the end of the two days, we will conclude with a discussion of the necessary next steps in developing and advancing the ATI Implementation Assessment Tool. By the time we have come to the end of Monday, we hope to have identified the baskets/core values; indicators and sub-indicators; and means of measurement. This is a tall order, but one of which I am sure we are capable. Methodology This first working group meeting is limited to under 10 participants, each expert in his/her field. As such, the sessions are designed to begin with a minimal presentation followed by open discussion. At certain points in the meeting, we may break participants into smaller groups to consider specific issues, and then reconvene for continuing discussions and decisions. At the end of each session, we hope to have a clear set of conclusions or next steps necessary to reach conclusion. Briefing Materials Included you will find some briefing materials that will hopefully serve to set a foundation for our discussion. The ATI Implementation Assessment Tool concept note will further explain the objectives of the tool and our thinking to date. We also have attached some research related to ATI implementation plans from a number of countries around the world, demonstrating where there is some consensus on key implementation activities. Finally, you will find references to a number of other related ATI studies, papers focused on implementation, and useful background reading regarding indicators and measurements. Please bring the relevant briefing materials with you – we will not be able to print out full materials at the meeting.
Below are some logistical details to facilitate your time in Washington, D.C.: Meeting Locations Sunday, August 23rd
4:00pm – 7:00pm, followed immediately by dinner Hotel Tabard Inn 1739 N. Street NW Washington, D.C. 20036 Monday, August 24th
9:00am – 6:00pm Global Integrity 1029 Vermont Avenue NW Suite 600 Washington, D.C. 20005 Transport and Expenses You should already have received your travel itinerary. All participants are traveling with an American Express e-ticket. Please plan to take a taxi from the airport to the hotel upon your arrival. The standard fare is between $20 and $45 depending on whether you are traveling from Ronald Reagan Washington National Airport (DCA) or Washington Dulles International Airport (IAD) respectively. Please keep your receipt so that you can be reimbursed for this expense. You will be staying at the Hotel Tabard Inn, located at: 1739 N. Street NW Washington, D.C. 20036 1-202-785-6173 http://www.tabardinn.com/ The Carter Center will cover the costs of your hotel, airfare, transportation to/from the airport, and any meals during your travel. The Carter Center cannot pay for alcohol, personal items and purchases, business center use, or personal telephone calls. You will only need to provide your personal credit card to the front desk for personal expenses and incidentals. Wireless internet is available free of charge throughout the hotel. For any allowable incurred expenses, please retain your receipts, fill out the attached invoice, and mail them to the following address for reimbursement: Kari Mackey Assistant Project Coordinator The Carter Center 453 Freedom Parkway Atlanta, GA 30307 Should you have any questions regarding travel reimbursements, please contact Kari at 404-420-5183 or [email protected].

As many of you will need to depart directly from Global Integrity’s office to the airport on Monday, please check out of the hotel prior to the start of the meetings. Weather and Attire The average weather in Washington, D.C. during the month of August is a high of 87 degrees Fahrenheit and a low of 65 degrees with high humidity. Plan for warm weather during the day and cooler weather in the evening. The Sunday meeting and dinner will be casual while Monday’s meeting will be business casual attire. Meals Sunday, August 23rd Sunday’s dinner will be held at 7:15pm in the Hotel Tabard Inn restaurant located on the first floor of the hotel. Monday, August 24th A continental breakfast is included with the hotel accommodations and is served from 7am-10am in the Tabard Inn restaurant. Lunch and snacks will be provided by Global Integrity during the meeting. Enclosed please find orientation and reference materials. If you have additional materials that you would like to share with the other participants, please send them to me for copying or bring them with you to the meeting. Kari will be available during the meetings and via cell phone at (770) 845-4416 to provide logistical information and assistance. As always, if you have any questions or concerns please feel free to contact me at (404) 420-5146 or via cell phone at (404) 840-2566. Safe travels and we look forward to seeing you soon,
Laura Neuman Access to Information Project Manager Associate Director, the Americas Program
Agenda
Implementation Assessment Tool D.C. Preparation Meeting
August 23-24, 2009
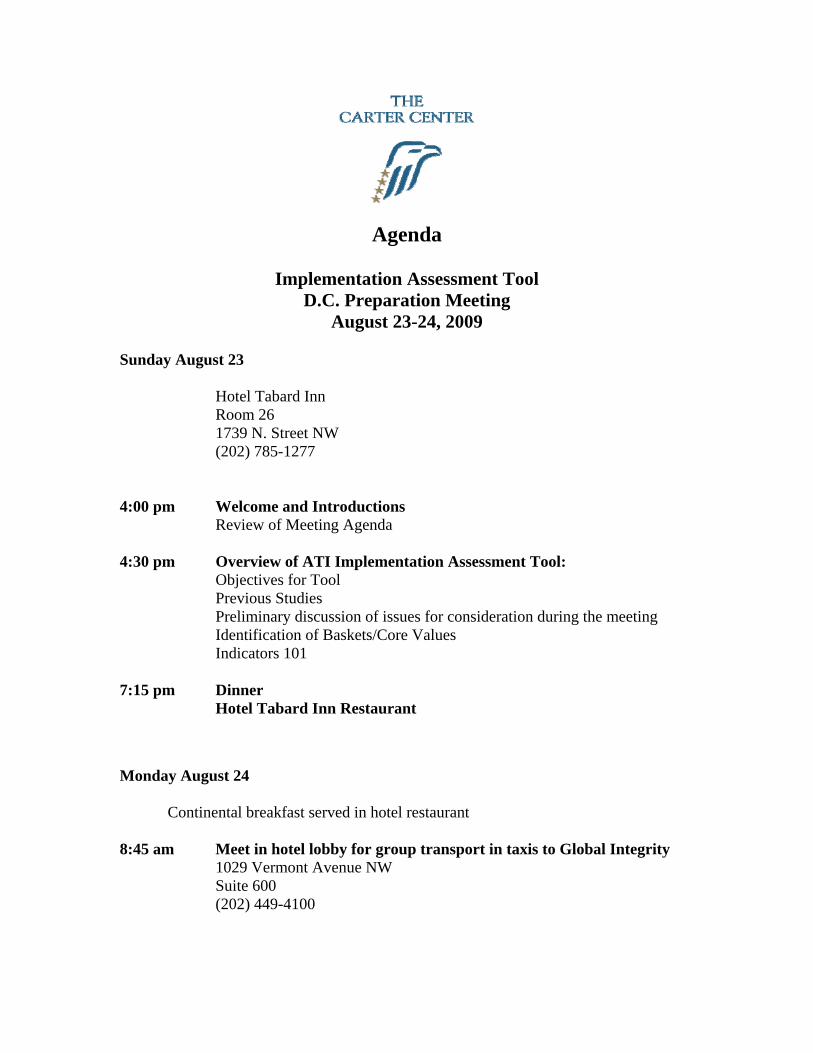
Sunday August 23
Hotel Tabard Inn Room 26 1739 N. Street NW (202) 785-1277
4:00 pm Welcome and Introductions Review of Meeting Agenda 4:30 pm Overview of ATI Implementation Assessment Tool:
Objectives for Tool Previous Studies Preliminary discussion of issues for consideration during the meeting Identification of Baskets/Core Values Indicators 101
7:15 pm Dinner Hotel Tabard Inn Restaurant
Monday August 24 Continental breakfast served in hotel restaurant 8:45 am Meet in hotel lobby for group transport in taxis to Global Integrity
1029 Vermont Avenue NW Suite 600 (202) 449-4100

9:00 am What are we measuring? Discussion and determination of key components for ATI implementation 12:30 pm Lunch and Open Discussion 1:15 pm How will we measure these components? Discussion and determination of indicators
Discussion of weighting indicators Discussion of data gathering
Discussion of scoring/aggregation 5:30 pm Next Steps 6:00 pm Meeting adjourns

Participant List
Implementation Assessment Tool D.C. Preparation Meeting
August 23-24, 2009 Richard Calland (participating via Skype) Part-time Executive Director, Open Democracy Advice Center (ODAC) & Acting Manager, Economic Governance Program, Institute for Democracy in South Africa (IDASA) 27 214675600 [email protected] Kevin Dunion Information Commissioner Information Commissioner Scotland 01334 464610 [email protected] Carole Excell Senior Associate The Access Initiative World Resources Institute, USA [email protected] Juan Pablo Guerrero Commissioner, Federal Institute of Access to Public Information, Mexico 5255 50 04 24 09 [email protected] Nathaniel Heller Co-Founder, Managing Director Global Integrity, USA 1-202-449-4100 [email protected] Raymond June Senior Researcher Global Integrity, USA 1-202-449-4100 [email protected]
Gerardo Munck Professor of International Relations School of International Relations, University Southern California, USA 1-213-821-2720 [email protected] Laura Neuman Access to Information Project Manager and Associate Director, Americas Program, Carter Center, USA 1 404-420-5146 [email protected] Alasdair Roberts Rappaport Professor of Law and Public Policy Suffolk University Law School, USA 1-617-573-8544 [email protected] Carter Center Staff Sarah Dougherty Senior Program Associate Access to Information Project Americas Program, Carter Center, USA 1 404-420-5182 [email protected] Kari Mackey Assistant Project Coordinator Access to Information Project Americas Program, Carter Center, USA 1 404-420-5183 [email protected]
Participant Biographies
Implementation Assessment Tool D.C. Preparation Meeting
August 23-24, 2009
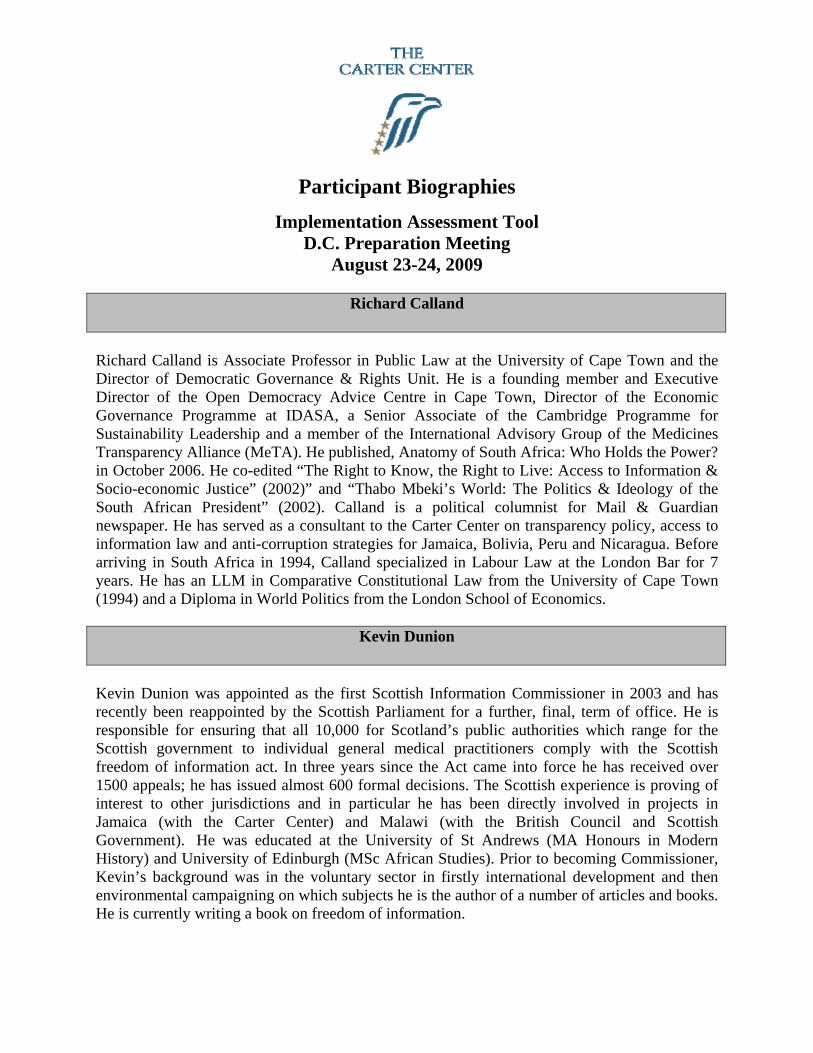
Richard Calland
Richard Calland is Associate Professor in Public Law at the University of Cape Town and the Director of Democratic Governance & Rights Unit. He is a founding member and Executive Director of the Open Democracy Advice Centre in Cape Town, Director of the Economic Governance Programme at IDASA, a Senior Associate of the Cambridge Programme for Sustainability Leadership and a member of the International Advisory Group of the Medicines Transparency Alliance (MeTA). He published, Anatomy of South Africa: Who Holds the Power? in October 2006. He co-edited “The Right to Know, the Right to Live: Access to Information & Socio-economic Justice” (2002)” and “Thabo Mbeki’s World: The Politics & Ideology of the South African President” (2002). Calland is a political columnist for Mail & Guardian newspaper. He has served as a consultant to the Carter Center on transparency policy, access to information law and anti-corruption strategies for Jamaica, Bolivia, Peru and Nicaragua. Before arriving in South Africa in 1994, Calland specialized in Labour Law at the London Bar for 7 years. He has an LLM in Comparative Constitutional Law from the University of Cape Town (1994) and a Diploma in World Politics from the London School of Economics.
Kevin Dunion
Kevin Dunion was appointed as the first Scottish Information Commissioner in 2003 and has recently been reappointed by the Scottish Parliament for a further, final, term of office. He is responsible for ensuring that all 10,000 for Scotland’s public authorities which range for the Scottish government to individual general medical practitioners comply with the Scottish freedom of information act. In three years since the Act came into force he has received over 1500 appeals; he has issued almost 600 formal decisions. The Scottish experience is proving of interest to other jurisdictions and in particular he has been directly involved in projects in Jamaica (with the Carter Center) and Malawi (with the British Council and Scottish Government). He was educated at the University of St Andrews (MA Honours in Modern History) and University of Edinburgh (MSc African Studies). Prior to becoming Commissioner, Kevin’s background was in the voluntary sector in firstly international development and then environmental campaigning on which subjects he is the author of a number of articles and books. He is currently writing a book on freedom of information.

Carole Excell
Carole Excell has recently joined the World Resources Institute, Washington Dc as a Senior Associate, for the Access Initiative, a network dedicated to ensuring that citizens have the right and ability to influence decisions about the natural resources that sustain their communities. She is the former Coordinator for the FOI Unit of the Cayman Islands government which was in charge of ensuring the effective implementation of the FOI law. She previously served as The Carter Center Field Representative in Jamaica working on the Access to Information Project where she conducted analysis on legal and policy issues associated with the right to information and acted as the Secretariat to the Volunteer Attorneys Panel, a panel of lawyers who provide pro bono services to civil society organizations and indigent persons. Mrs. Excell is an Attorney-at-law with a LLB from the University of the West Indies and Certificate of Legal Education from the Norman Manley Law School, Mona. She has a Master’s Degree in Environmental Law from the University of Aberdeen in Scotland. She has seven years working experience working for the Government of Jamaica on environmental and planning issues both at the Natural Resources Conservation Authority and then at its successor the National Environment and Planning Agency.
Juan Pablo Guerrero Amparán
Juan Pablo Guerrero is one of the five commissioners of the Information Commission at the Federal level in Mexico. He was appointed by the Mexican President for the period 2002-2009; his nomination was unanimously supported by the Senate. He is the Chairman of IFAI’s Commission for FOIA Enforcement and was the General Coordinator of an Institutional Project to extend use of Mexico’s access to information right among poor communities (2005-07). As one of the founders of the IFAI, he was deeply involved in its institutional design, decisions concerning its basic functioning rules, hiring its first personnel and constructing the tools to enable the use of the right to information in Mexico (close to 400,000 requests to date). Regarding the interpretation of the law, he has consistently favored the mandate of the “presumption of maximum openness”, a commitment that can be verified in the more than 400 dissenting votes in which he argued in favor of the disclosure of the requested information. He has completed his Ph. D. coursework in Political Science and Public Policy at the Institut d’Études Politiques de Paris and holds a Master’s Degrees in Public Policy from IEP-Paris and in Economics and International Politics from SAIS of the Johns Hopkins University.
Nathaniel Heller
Nathaniel Heller has split time between social entrepreneurship, investigative reporting and traditional public service since 1999, when he joined the Center for Public Integrity and began, along with Marianne Camerer and Charles Lewis, to develop the Integrity Indicators and conceptual model for what would become Global Integrity. At the Center, Heller reported on public service and government accountability; his work was covered by the Associated Press, The Washington Post, The New York Times, Los Angeles Times, USA Today, Chicago Tribune, Moscow Times, The Guardian (London), and Newsweek. In 2002 he joined the State Department, focusing on European security and transatlantic relations. He later served as a foreign policy fellow to Senator Edward Kennedy in 2004. In 2005, Heller returned to stand up Global Integrity as an independent international organization tracking governance and corruption trends around the world and has led the group since.

Raymond June
Raymond June is a Senior Researcher at Global Integrity. He designs and implements new research methodology, provides analysis and writing for the Global Integrity Report, and coordinates international fieldwork. He received his Ph.D. from the University of California, Berkeley and is a specialist in governance, anti-corruption, qualitative research methods, monitoring and evaluation, and knowledge production. His regional specialty is Eastern Europe, with a secondary focus on Melanesia/Pacific Islands and Africa in his applied work. Raymond has pursued ethnographic research in the Czech Republic, where he examined the processes through which transnational anti-corruption policy ideas took root locally. This project, which has resulted in two publications, was supported by grants from the Wenner-Gren Foundation, American Council of Learned Societies, Woodrow Wilson International Center for Scholars, and University of California, Berkeley. Before joining Global Integrity, he was Faculty Fellow at American University’s Terrorism, Transnational Crime and Corruption Center.
Gerardo Munck
Gerardo Munck, Argentinian by birth, is a professor in the School of International Relations at the University of Southern California. He received his Ph.D. in political science from the University of California, San Diego (UCSD) and is a specialist on political regimes and democracy, methodology, and Latin America. His books include Regimes and Democracy in Latin America (Oxford, 2007); Passion, Craft, and Method in Comparative Politics (with Richard Snyder; Johns Hopkins, 2007); and Authoritarianism and Democratization. Soldiers and Workers in Argentina, 1976-83 (Penn State, 1998). He collaborated in the preparation of United Nations Development Programme’s (UNDP) report Democracy in Latin America (2004) and is currently active in various initiatives to promote and monitor democracy.
Laura Neuman
Laura Neuman is Associate Director for the Americas Program and the Access to Information Project Manager for the Carter Center. She directs, develops and implements the Center’s transparency projects, including projects in Jamaica, Bolivia, Nicaragua, Mali, Liberia, and China and at the hemispheric level in the Americas. She most recently organized and managed the International Conference on the Right to Public Information for more than 125 participants from 40 countries and the follow-on Americas Conference on the Right of Access to Information. Ms. Neuman edited six widely distributed guidebooks on fostering transparency and preventing corruption, has been published in a number of books and paper series, and has presented at numerous international seminars relating to access to information legislation, implementation and enforcement. Ms. Neuman is a member of the Initiative for Policy Dialogue task force on transparency an International Associate to the Open Democracy Advice Center, South Africa, and has served as a consultant to the World Bank, Inter-American Development Bank, and a number of governments. Ms. Neuman also has led and participated in international election monitoring missions throughout the Western hemisphere. Prior to joining The Carter Center in August 1999, she was senior staff attorney for Senior Law at Legal Action of Wisconsin. She is a 1993 graduate of the University of Wisconsin law school.

Alasdair Roberts
Alasdair Roberts is the first holder of the Jerome Lyle Rappaport Chair in Law and Public Policy at Suffolk University Law School. Formerly he held the position of professor of public administration in the Maxwell School of Citizenship and Public Affairs at Syracuse University. His last book, Blacked Out: Government Secrecy in the Information Age, received the 2006 Book Award from the US National Academy of Public Administration, the 2007 Book Award from the American Society for Public Administration’s section on Public Administration Research, and the 2007 Best Book Award from the Public and Nonprofit Division of the US Academy of Management. His next book, The Collapse of Fortress Bush: The Crisis of Authority in American Government, will be published by New York University Press in January 2008. A Canadian, Professor Roberts received a JD from the University of Toronto in 1984, a Master’s Degree in Public Policy from Harvard University in 1986, and a Ph.D. in Public Policy from Harvard University in 1994. He has had fellowships with the Open Society Institute and the Wilson Center for Scholars, and is presently an Honorary Research Fellow of the School of Public Policy, University of College London.

The Carter Center’s Access to Information Project
Project Origins and Previous Work
In 1999, The Carter Center’s Americas Program began a number of short pilot anti-corruption and transparency initiatives in the western hemisphere. From that broader compass, we developed the longer-term and more specific Access to Information (ATI) Project. Building on our success with the Jamaica access to information programming, which passed and implemented the law during our project, we expanded our programming to include support of the Organization of American States (OAS) and additional core country work in Bolivia, Nicaragua, Mali, Liberia, and China. Over the past decade, the Carter Center has become a leader on the issue of passage, implementation, enforcement, and use of information regimes. We conceived and drafted a functioning “voluntary transparency strategy,” now modified and being implemented in different forms in Bolivia and Mali. Our model of working with both governments and civil society remains unique, as does our continuing presence in target countries, evidenced by our previous long-term engagement in Jamaica, Bolivia, Nicaragua and Mali. In February 2008, the Center hosted the International Conference on the Right to Public Information – a gathering of more than 125 representatives of diverse stakeholder groups from 40 countries – to critically examine the field of access to information. With former U.S. President Jimmy Carter's facilitation and vision, disparate groups from around the world developed a shared agenda for the mutual advancement of the right to information and its associated benefits, captured in the widely disseminated Atlanta Declaration and Plan of Action for the Advancement of the Right of Access to Information. As a follow-up to the International Conference, The Carter Center, in collaboration with the Organization of American States (OAS), the Andean Juridical Committee, and the Knight Center for Journalism in the Americas held the Americas Regional Conference on the Right of Access to Information in Lima Peru from April 28-30th 2009. The conference convened more than 100 persons – representing all the key stakeholder groups - from 18 countries in the Americas to explore the key issues affecting the right of access to information. The conference culminated with the issuance of the Americas Regional Findings and Plan of Action for the Advancement of the Right of Access to Information, which serves as a supplement to the global Atlanta Declaration of 2008.
Next Steps
Our current ATI portfolio builds upon on this past work in core countries, key moment interventions, working with the OAS, and the successful international and regional conferences on access to public information. Using our lessons learned, we are developing the concept of a citizen-centered approach to transparency, with continuing emphasis on implementation challenges, and increasing the scholarship and tools available to all stakeholders in their efforts to advance the right of access to information. In the coming years, the Carter Center will work in three pillars, which
include 1) supporting intergovernmental organizations, such as the OAS, to help member states to fulfill citizens’ rights of access to information, 2) assisting specific governments to meet citizens’ needs for information, and 3) encouraging and promoting stakeholders to be even more effective at advancing a citizen-centered right of access to information.
Intergovernmental Organizations Over the next few years, the OAS plans to develop regional standards, including a model law and plan for implementation, as well as potentially an Inter-American convention on the right of access to information. Based on past experiences with regional mechanisms and conventions, there is a real concern that without strong civil society and expert engagement, the instrument may embrace the minimal standards rather than strive for the ideals and may fail to include effective compliance mechanisms. Building on our ATI expertise and invitation of the OAS, The Carter Center will participate as a member of the OAS working group to develop regional instruments that provide appropriate guidance to member states, seeking to ensure that the needs of the citizens are served, and provide civil society a voice in the process.
Core Country Work The Carter Center will continue to engage in a more comprehensive way in targeted core countries. Passing a law is simply the first stage to establishing a right of access to information. Governments also must implement and enforce the law, and citizens must begin using their new right of access to information. To increase the impact of these efforts, the Center will engage and promote our new “citizen-centered” approach. Our access to information core country work in Liberia, China, and potentially Ecuador or another Latin American country will utilize our contacts at the highest levels of government to support the state to meet citizens’ requirements for information through increased awareness of the needs and potential instruments that may be applied, helping to build institutional capacity to implement these instruments, and positively engaging civil society.
Tools, Coordination, and Scholarship In order to move the field to the next level (i.e. advancement, consolidation, and sustainability), the key stakeholders and the community of practice - governments, civil society, international and national NGOs, media, private sector, donors and scholars - need additional evaluative tools, coordination, and scholarship. Therefore, The Carter Center will advance innovative tools and pilot studies related to the right of access to information, including regional action plans, an access to information legislation implementation assessment tool, and pilot case studies related to internal disclosure of development information by the key international financial institutions. Additionally, the Center will convene stakeholders to build consensus about and apply best practices and encourage critical scholarship and knowledge development. We will distill and share lessons learned, with an emphasis on the value and functioning of a citizen-centered approach, implementation related issues, and policy vs. practice.

Access to Information Implementation Assessment Tool
Concept Note
The past decade has witnessed incredible achievements in the area of the right of access to information. More than 4 billion persons around the globe are now afforded some legal rights to information through access to information regulation. But in order to move the field to the next level (i.e. advancement, consolidation, and sustainability), The Carter Center believes that the key stakeholders and the community of practice - governments, civil society, international and national NGOs, media, private sector, donors and scholars - need additional evaluative tools, coordination, and scholarship. In the area of access to information, there has been much discussion on the principles and necessary provisions for good legislation. In fact, one may argue that an international norm on access to information laws has emerged. Moreover, there is much consensus on the desired outcome of an access to information regime - individuals having a right to seek and receive accurate, complete and timely information through a specific request or via automatic publication. In fact, there have been a number of initiatives to draft model laws and promote key statutory principles, as well as important studies undertaken to assess government compliance with its law and the extent to which persons who request information can receive it. For example, OSI Justice Initiative’s Transparency and Silence provided a comparative study of 14 countries, based on almost 1900 requests, with the goal of identifying whether government agencies responded to requests. The OECD is presently preparing the Open Government: beyond static measures to track compliance with the law, and the World Bank has drafted a terms of reference for the development of an Access to Information Monitoring Initiative. However, in all of these and the myriad other studies, the focus has been on the outcome of implementation, i.e. are persons able to receive the information requested, while there remains a dearth of information regarding the middle stage of establishing a right of access to information - the law’s implementation. The Carter Center hopes to advance a study focused on this central piece of the equation – the implementation of the law – with a particular emphasis on the government inputs to ensure the desired outcomes.
1

Objectives The objectives of the access to information legislation implementation assessment tool (IAT) are to:
1. Diagnose the extent of implementation of the access to information legislation;
2. Provide a potential implementation roadmap for governments and public entities uncertain of the most critical implementation activities; and
3. Supply important information for understanding implementation and for additional scholarship.
The IAT is intended to provide governments, civil society, donors and international organizations the data necessary to easily identify the extent of agency implementation.1 Experience has demonstrated that not all parts of government are as successful (or unsuccessful) as others. Thus, it may be misleading to characterize a government as succeeding or failing in implementation as governments are not monolithic. Therefore, the IAT will focus on the public administrative bodies rather than the government as a whole. The assessment tool will signal where an agency has succeeded in completing implementation activities and where there is a need for additional inputs or focus, so that the government and its agencies may overcome challenges and positively advance in their implementation efforts. The IAT will be looking at “the boring bits2,” the necessary ingredients to ensure the effectiveness of implementation and the desired outcomes. The tool will include a set of indicators to assess the extent to which the law has been implemented in a ministry or agency, with indicators based on a set of “key inputs/activities.” The agency will then be assessed against these key inputs. These “inputs” are similar to what others might call “best practices.” However, at present there is no universal consensus or norm on implementation best practice. As part of designing the IAT, we will convene working groups of experts on implementation to identify the key inputs/recommended practices and then peer review these indicators. We likely will identify baskets and key necessary activities within each of these categories. For example, the major baskets might include Infrastructure and Strategy; Record-keeping; and Training with indicators and sub-indicators under each. The IAT may be designed to provide a total per basket/category, with each activity weighted equally. In addition to quantitative data, we may include a narrative that provides supplementary qualitative information and accompanying explanations for the 1 As Ministries and agencies differ greatly within a given government, we will focus our pilot on specific public bodies rather than generalize these experiences across all of government. Experience has demonstrated that not all parts of government are as successful (or unsuccessful) as others. Thus, it may be misleading to characterize a government as succeeding or failing in implementation as governments are not monolithic. 2 Professor Alan Doig coined this term in his paper “Getting the Boring Bits Right First” when discussing capacity building for anti-corruption agencies.
2

3
measurements. The overall findings from the IAT will, by their nature, be agency and country specific, and they will not be presented as a ranking against other countries achievements. Methodology The Carter Center access to information implementation tool will build from the other studies and indicators, including the Open Democracy Advice Centre’s implementation index framework, taking into account the lessons that they have learned in its more limited application. In addition, we will consider existing national and agency-specific implementation plans to identify the areas of consensus, i.e. key inputs that all included in their plans. Working with a group of implementation and indicator experts, we will develop a set of key inputs for implementation and indicators to assess/measure these inputs. Unlike other existing studies, the IAT will not be based on making a series of requests as that would measure the outputs (does the agency respond to the request fully, accurately and timely) rather than the inputs. Following the initial design of the IAT, the Carter Center will convene a group of experts to peer review the indicators, application methodology, and sampling (country and ministry/agency) determinations. We will then employ the IAT in a number of ministries/agencies in 10 pilot country assessments. The mix of countries included in the pilot will likely be based on their level of development3, number of years that the law has been in effect, and geographic region. Potential countries include: Mexico, Jamaica, Ecuador, South Africa, Uganda, United Kingdom, Canada, Thailand, India, Hungary, and/or Bulgaria. We will apply the tool in the same agencies in each pilot country. We likely will partner with Global Integrity to pilot the IAT utilizing its network of social scientists and journalists and its developed indicator tracking software. In advance of applying the indicators, we will develop a manual and training for all social scientists engaged in the pilot. With the completion of the first set of pilot studies - which may not be the full 10 countries - The Carter Center will reconvene the peer reviewers and the social scientists that piloted the IAT to consider findings, identify obstacles and problems, and make any necessary adjustments to the tool. There may be additional opportunities for local peer review as well. As necessary, the revised indicators will then be piloted in the remaining countries. Lastly, the Center will document the findings, both from the pilot countries as well as related to the IAT. In the final year of the project (year 3) the Center will broadly disseminate all findings and the IAT methodology itself.
3 We will use the World Bank‘s Country Classification for income-level.

THE CARTER CENTER DRAFT
Access to Information Implementation Guidelines*
Category Sub-category
Action point Start Date
End Date
Completed Yes/No
Proactive Disclosure-
Information to be disclosed
Publish information from each institution that falls under the FOI automatic disclosure regulations including: expenditures; assets; acquisitions; executive summaries of investigations and studies; agreements/accords; budgets; annual operating plans; lists of services and how to access them; operative and normative frameworks; operational manuals; project plans financed by the institution and cooperative relationships; and contact information
Publish updates, developments, and changes to the information listed above in a regular, timely manner
Identify what information that is likely to be requested that is already available and include that information in the proactive disclosure scheme
Publicize the existence of proactive information publication as well as instructions on how to find it
Publication Scheme
Design and implement/adopt a universal publication scheme/template that will be used by all obliged institutions to proactively disclose the information listed in point 1 of “Information to be disclosed”
Training and Awareness
Training Analyze training needs and develop a training plan/strategy that includes dates for seminars/workshops as well as objectives
Train information officials and those responsible for training programs in how to train institution/agency staff and those from other stakeholder groups.
Design training/sensitization/awareness seminars/workshops that are specific to each institution that is obligated under the law; state and local government institutions; civil society organizations; the media; attorneys and legal officials; and citizens
Conduct agency specific/stakeholder specific workshops and training seminars as well as training sessions for information heads, officials, managers, and officers.

Produce/publish training guides and manuals specific to the needs and functions of institutions and employees at all levels throughout those institutions including: chief officers, department heads, information managers, and public authority staff as well as the key stakeholder groups listed above
Ensure that all staff, at all levels within each obliged institution understand their ATI responsibilities and how to carry out those responsibilities
Review training progress, test competency levels, and follow up as necessary
Liaison and development of contracts with overseas experts on FOI training
Conduct training seminars for Information Managers and Records Officers
Develop and make available online ATI training resources
Awareness Make the information officials/officers, agency employees, the public, the media, and civil society aware of the ATI implementation plan, as well as their new responsibilities with regard to ATI
Publish and publicize policy on proactive disclosure, information release, and appeals
Develop and implement a strategic plan for the media campaign to create and sustain awareness of the ATI law and educate groups on how to use it.
Initiate media campaign to create and sustain awareness of the ATI law including bulletins, awareness ads, and commercials
Produce and widely distribute information materials, guides, and manuals to citizens, civil society, lawyers, and the media on request procedures, appeals procedures, and necessary information to facilitate access to information
Review effectiveness of awareness campaign with group specific surveys and questionnaires, and follow up as necessary
Provide list of available resources to aid in implementation such as records management, networking, IT procedures, training and awareness
Provide extensive list of useful contacts that can be referred to with questions
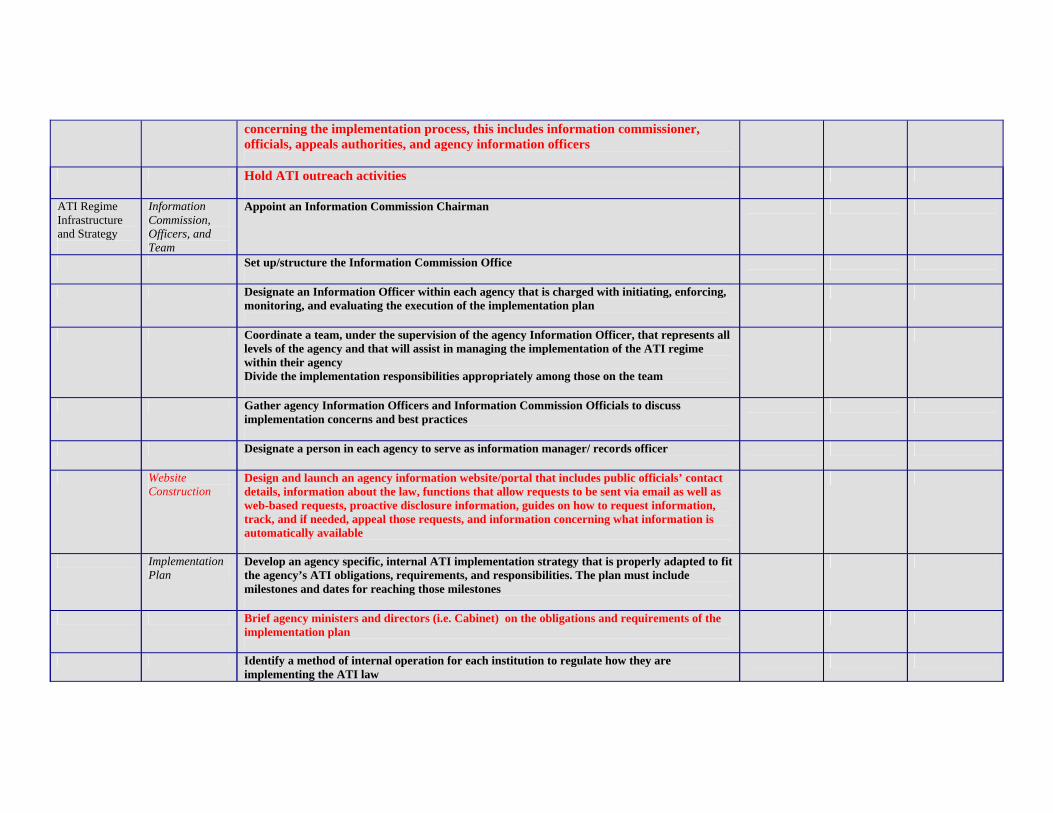
concerning the implementation process, this includes information commissioner, officials, appeals authorities, and agency information officers
Hold ATI outreach activities
ATI Regime Infrastructure and Strategy
Information Commission, Officers, and Team
Appoint an Information Commission Chairman
Set up/structure the Information Commission Office
Designate an Information Officer within each agency that is charged with initiating, enforcing, monitoring, and evaluating the execution of the implementation plan
Coordinate a team, under the supervision of the agency Information Officer, that represents all levels of the agency and that will assist in managing the implementation of the ATI regime within their agency Divide the implementation responsibilities appropriately among those on the team
Gather agency Information Officers and Information Commission Officials to discuss implementation concerns and best practices
Designate a person in each agency to serve as information manager/ records officer
Website Construction
Design and launch an agency information website/portal that includes public officials’ contact details, information about the law, functions that allow requests to be sent via email as well as web-based requests, proactive disclosure information, guides on how to request information, track, and if needed, appeal those requests, and information concerning what information is automatically available
Implementation Plan
Develop an agency specific, internal ATI implementation strategy that is properly adapted to fit the agency’s ATI obligations, requirements, and responsibilities. The plan must include milestones and dates for reaching those milestones
Brief agency ministers and directors (i.e. Cabinet) on the obligations and requirements of the implementation plan
Identify a method of internal operation for each institution to regulate how they are implementing the ATI law
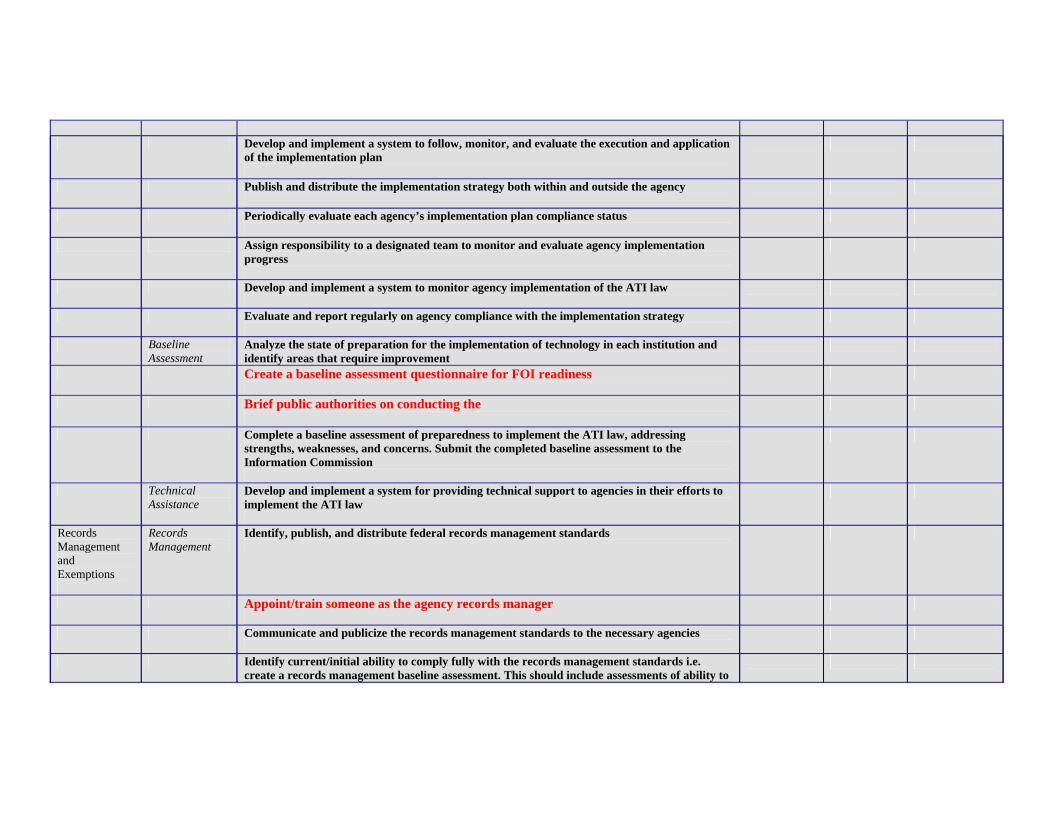
Develop and implement a system to follow, monitor, and evaluate the execution and application
of the implementation plan
Publish and distribute the implementation strategy both within and outside the agency
Periodically evaluate each agency’s implementation plan compliance status
Assign responsibility to a designated team to monitor and evaluate agency implementation progress
Develop and implement a system to monitor agency implementation of the ATI law
Evaluate and report regularly on agency compliance with the implementation strategy
Baseline Assessment
Analyze the state of preparation for the implementation of technology in each institution and identify areas that require improvement
Create a baseline assessment questionnaire for FOI readiness
Brief public authorities on conducting the
Complete a baseline assessment of preparedness to implement the ATI law, addressing strengths, weaknesses, and concerns. Submit the completed baseline assessment to the Information Commission
Technical Assistance
Develop and implement a system for providing technical support to agencies in their efforts to implement the ATI law
Records Management and Exemptions
Records Management
Identify, publish, and distribute federal records management standards
Appoint/train someone as the agency records manager
Communicate and publicize the records management standards to the necessary agencies
Identify current/initial ability to comply fully with the records management standards i.e. create a records management baseline assessment. This should include assessments of ability to

locate, identify, and reproduce documents stored in both electronic and paper form.
Develop and implement an agency plan for records management that complies with the federal records management standards
Create, disclose, and publicize an inventory of currently held records
Devise and implement a disposal timetable for records
Devise a system of benchmarks to monitor the progress of implementing the records management infrastructure
Review and adapt as necessary document formats to facilitate release under the act and change format of new documents as is required to make disclosure easier
Put systems in place for editing documents
Records Management and Exemptions
Exemptions Define and disclose to the information commission and the public what information held within the agency is to be restricted from public access. Agencies must include reasons for non-disclosure
Prepare an index of restricted and secret information as defined by the law
Monitoring, Evaluation, and managing of requests
Managing and monitoring requests
Develop and implement systems for receiving, documenting, formatting, analyzing, and addressing ATI requests
Develop and implement a system for evaluating the effectiveness and efficiency of how the agency deals with information requests
Develop and implement a system for tracking and monitoring agency information requests
Test system thoroughly to ensure functioning
Electronic Tracking
Develop a strategy for provision of appropriate IT systems for the ATI infrastructure
Implement a web-based, electronic tool that requesters may use to identify the status of their ATI request.

Create a system of technical support for uses of the web-based e-tracking system
Networking, Communication and Third Party Information
External Networking and Communication
Coordinate, under the direction of the Information Commission, a communication network connecting all agencies and facilitating efficient transfers of information and information regarding requests
Produce a list of contacts in other public bodies to aid the transfer of requests when a particular agency does not hold information
Develop and implement a support network for information officials, officers and agency employees to communicate problems and concerns as well as best practices. This can take the form of online forums, call centers or regular publications
Develop and implement a strategy for connecting and integrating the information commission and the obligated institutions’ electronic portals
Hold periodic meetings between ministers, information officials, and information officers to discuss successes and concerns
Create a means or outlet for citizens, civil society, lawyers, and the media to voice concerns, problems, or difficulties using the ATI law
Internal Networking and Communication
Develop and implement an electronic communications network between information managers and employees
Develop and implement methods of communications for frequent users of the ATI law
Third Party Information
Identify third party information held in the agency
*This implementation guide is a compiled summary of nine national implementation plans from countries including Bolivia, Nicaragua, Honduras, the Cayman Islands, United Kingdom, and India. The implementation plans used as reference for this guide were all plans meant to be issued by a central government and used by agencies and institutions of that government. Actions points in black font were held in common by at least two of the nine plans examined, though most of these action points were included in more

than two plans. The action points listed in red font only appeared in one of the nine plans, but were included because they were seen as contributing to the depth of the overall implementation agenda. The plans used are listed below. Bolivia Estrategia de Transparencia Voluntaria (Bolivia) http://www.cartercenter.org/resources/pdfs/peace/americas/bolivia_voluntary_openness_spanish.pdf Nic Borrador estrategica volutaria de accesso a información (EVA) (Nicaragua) http://www.inec.gob.ni/eva/borradoreva.pdf UK 2 Access to Information: The public’s right to know, the right to personal privacy, and the right of public authorities to work effectively (United Kingdom0 http://www.ceforum.org/filestore/publications/OFMDFM_AccessLeaflet.pdf UK 3 Model Action Plan for preparation for the implementation of the Freedom of Information Act 200-Department of Constitutional Affairs (United Kingdom) http://www.foi.gov.uk/map/modactplan.htm India 1 Capacity Building for Access to Information Project Components http://www.r2inet.org/nia/Components.do (India) CI 1 Model Action Plan for public authorities to implement the Cayman Island FoL (Cayman Islands) http://www.foi.gov.ky/pls/portal/docs/PAGE/FOIHOME/IMPLEMENTATION/PROCESS/FOI%20MODEL%20ACTION%20PLAN%20FOR%20PUBLIC%20AUTHORITIES%20VERSION%2018SEPT07%20(2)%20(2).PDF CI 2. Information Freedom: Cayman Islands Government Implementation Plan for the FoI law, July 2007-November 2010 (Cayman Islands) http://www.foi.gov.ky/pls/portal/docs/PAGE/FOIHOME/IMPLEMENTATION/FOISC/CIG%20IMPLEMENTATION%20PLAN%20FOR%20THE%20FOI%20LAW%20-%20JULY%202007%20-%20JANUARY%202010.PDF Chile Plan de Implementación de la Ley N°20.285 de Transparencia de la Función Pública y de Acceso a la Información de la Administración del Estado Fase 1 (Chile) http://www.ssbiobio.cl/documentos/ley20285_presentacion_fase_1.pdf HND 2 Instituto de Acceso a la Información Publica: Estrategia y plan de implementación del sistema nacional de acceso a la información publica (SINAIP) (Honduras) http://www.iaip.gob.hn/pdf/ESTRATEGIA%20Y%20PLAN%20DE%20IMPLEMENTACION%20DEL%20SISTEMA%20NACIONAL%20DE%20ACCESO%20A%20LA%20INFORMACION%20PUBLICA%20(%20SINAIP%20).pdf
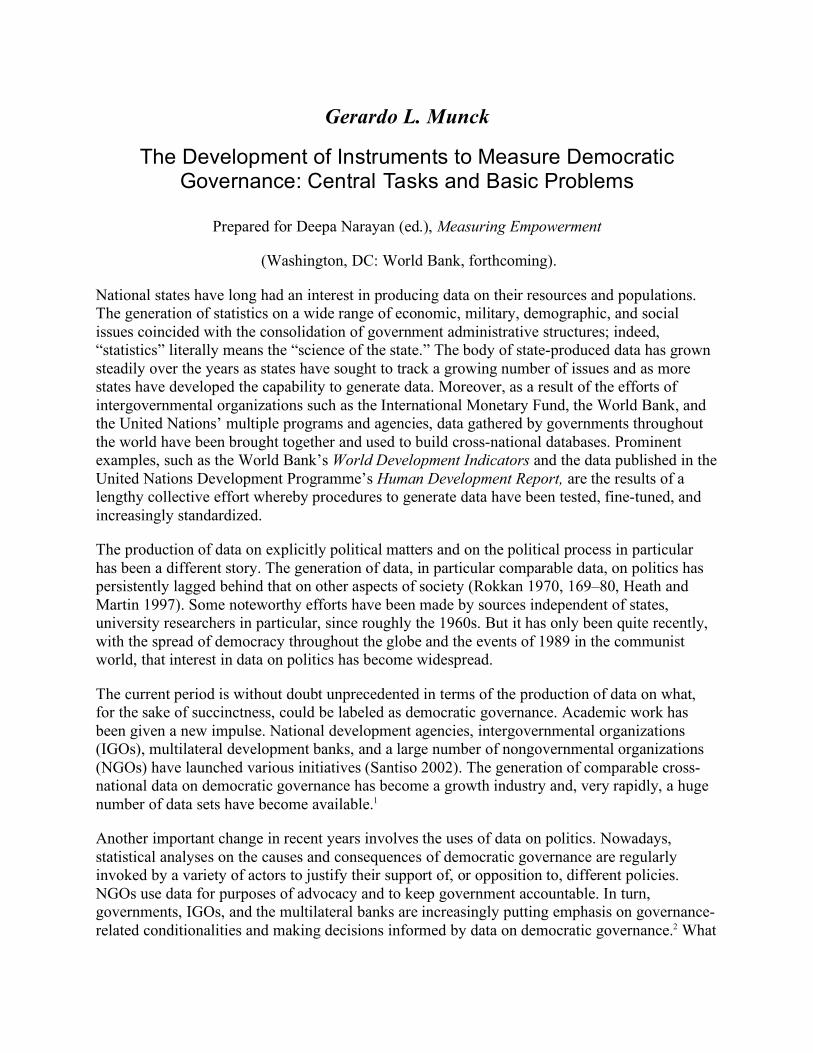
Gerardo L. Munck
The Development of Instruments to Measure Democratic Governance: Central Tasks and Basic Problems
Prepared for Deepa Narayan (ed.), Measuring Empowerment
(Washington, DC: World Bank, forthcoming).
National states have long had an interest in producing data on their resources and populations. The generation of statistics on a wide range of economic, military, demographic, and social issues coincided with the consolidation of government administrative structures; indeed, “statistics” literally means the “science of the state.” The body of state-produced data has grown steadily over the years as states have sought to track a growing number of issues and as more states have developed the capability to generate data. Moreover, as a result of the efforts of intergovernmental organizations such as the International Monetary Fund, the World Bank, and the United Nations’ multiple programs and agencies, data gathered by governments throughout the world have been brought together and used to build cross-national databases. Prominent examples, such as the World Bank’s World Development Indicators and the data published in the United Nations Development Programme’s Human Development Report, are the results of a lengthy collective effort whereby procedures to generate data have been tested, fine-tuned, and increasingly standardized.
The production of data on explicitly political matters and on the political process in particular has been a different story. The generation of data, in particular comparable data, on politics has persistently lagged behind that on other aspects of society (Rokkan 1970, 169–80, Heath and Martin 1997). Some noteworthy efforts have been made by sources independent of states, university researchers in particular, since roughly the 1960s. But it has only been quite recently, with the spread of democracy throughout the globe and the events of 1989 in the communist world, that interest in data on politics has become widespread.
The current period is without doubt unprecedented in terms of the production of data on what, for the sake of succinctness, could be labeled as democratic governance. Academic work has been given a new impulse. National development agencies, intergovernmental organizations (IGOs), multilateral development banks, and a large number of nongovernmental organizations (NGOs) have launched various initiatives (Santiso 2002). The generation of comparable cross-national data on democratic governance has become a growth industry and, very rapidly, a huge number of data sets have become available.1
Another important change in recent years involves the uses of data on politics. Nowadays, statistical analyses on the causes and consequences of democratic governance are regularly invoked by a variety of actors to justify their support of, or opposition to, different policies. NGOs use data for purposes of advocacy and to keep government accountable. In turn, governments, IGOs, and the multilateral banks are increasingly putting emphasis on governance-related conditionalities and making decisions informed by data on democratic governance.2 What

1
used to be primarily an academic quest has become deeply enmeshed with politics, as data on politics have become part of the political process itself.
These developments reflect an appreciation of politics as a central aspect of society and are largely salutary. Most significantly, they offer the promise of increased knowledge about politics and the use of this knowledge to improve policy making and accountability. But they also raise some concerns. Producers of data on democratic governance usually present their data as scientific products. Even when they do not, the reception of data by the public, and to a large extent by public officials, is influenced by the special status associated with information presented in quantitative, statistical terms. Indeed, one of the selling points of data on democratic governance is that they draw on the power of an association with science. Yet this claimed or assumed scientific status verges on being a misrepresentation of the current state of knowledge regarding the measurement of democratic governance.
The fact is that we still do not have measuring instruments that have been sufficiently tested and refined, and that garner a broad consensus. Many current instruments are open to serious methodological critique and also differ, sometimes quite considerably, with regard to fundamental features (Munck and Verkuilen 2002). Data generated on supposedly the same concepts can lead to significant divergences in the way the world is described and the causes seen to affect outcomes of interest (Casper and Tufis 2002). Despite recent advances, we are still at an early, relatively exploratory phase in the measurement of democratic governance.
This chapter focuses on one key implication of this assessment of the state of knowledge: the need to develop instruments to measure democratic governance in a highly valid and reliable manner. It does not propose new instruments and does not even consider any of the available instruments in depth. Rather, it considers current attempts at measurement as a whole and discusses, first, some central tasks to be tackled in the development of measuring instruments, and second, some basic problems with measuring instruments that should be avoided. The overall aim is to take stock of where we stand and to offer suggestions as to how future work might be oriented.
An appendix to the chapter presents a select list of data sets on democratic governance. This list shows that currently available data sets constitute a considerable resource. Recent efforts have resulted in data sets on a range of aspects of the electoral process, on governmental institutions and the decision-making process, on the rule of law, and so on. Yet the discussion of the continuing challenges regarding the construction of measuring instruments suggests the need to use these existing data sets with caution. Until measuring instruments that address the tasks and resolve the problems discussed in this chapter have been developed, the data generated with existing instruments should be used with deliberate care and prudence.
Central Tasks in the Development of Measuring Instruments
Measuring instruments are not ends in themselves but rather tools used to generate data. Thus, once established measuring instruments are available, they recede into the background and attention focuses on the data produced with these instruments. However, because we still lack instruments that can be used to measure democratic governance in a sufficiently valid and reliable manner, a focus on instruments is justified. Though existing work offers important clues
2
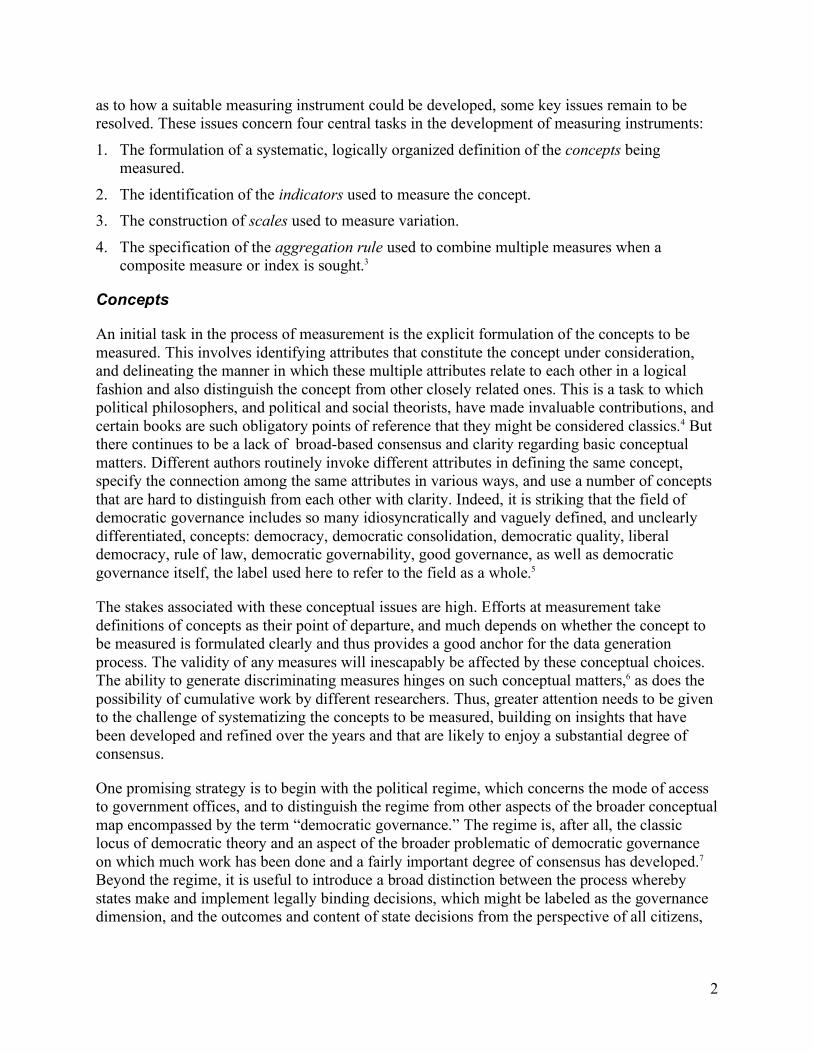
as to how a suitable measuring instrument could be developed, some key issues remain to be resolved. These issues concern four central tasks in the development of measuring instruments:
1. The formulation of a systematic, logically organized definition of the concepts being measured.
2. The identification of the indicators used to measure the concept. 3. The construction of scales used to measure variation.
4. The specification of the aggregation rule used to combine multiple measures when a composite measure or index is sought.3
Concepts
An initial task in the process of measurement is the explicit formulation of the concepts to be measured. This involves identifying attributes that constitute the concept under consideration, and delineating the manner in which these multiple attributes relate to each other in a logical fashion and also distinguish the concept from other closely related ones. This is a task to which political philosophers, and political and social theorists, have made invaluable contributions, and certain books are such obligatory points of reference that they might be considered classics.4 But there continues to be a lack of broad-based consensus and clarity regarding basic conceptual matters. Different authors routinely invoke different attributes in defining the same concept, specify the connection among the same attributes in various ways, and use a number of concepts that are hard to distinguish from each other with clarity. Indeed, it is striking that the field of democratic governance includes so many idiosyncratically and vaguely defined, and unclearly differentiated, concepts: democracy, democratic consolidation, democratic quality, liberal democracy, rule of law, democratic governability, good governance, as well as democratic governance itself, the label used here to refer to the field as a whole.5
The stakes associated with these conceptual issues are high. Efforts at measurement take definitions of concepts as their point of departure, and much depends on whether the concept to be measured is formulated clearly and thus provides a good anchor for the data generation process. The validity of any measures will inescapably be affected by these conceptual choices. The ability to generate discriminating measures hinges on such conceptual matters,6 as does the possibility of cumulative work by different researchers. Thus, greater attention needs to be given to the challenge of systematizing the concepts to be measured, building on insights that have been developed and refined over the years and that are likely to enjoy a substantial degree of consensus.
One promising strategy is to begin with the political regime, which concerns the mode of access to government offices, and to distinguish the regime from other aspects of the broader conceptual map encompassed by the term “democratic governance.” The regime is, after all, the classic locus of democratic theory and an aspect of the broader problematic of democratic governance on which much work has been done and a fairly important degree of consensus has developed.7 Beyond the regime, it is useful to introduce a broad distinction between the process whereby states make and implement legally binding decisions, which might be labeled as the governance dimension, and the outcomes and content of state decisions from the perspective of all citizens,

3
including those that occupy a position within the state, which might be labeled as the rule of law dimension (table 19.1).
Table 19.1 The Concepts of Political Regime, Governance, and Rule of Law
Concept Political regime Governance Rule of law
Aspect of the political process
Access to government offices
Decision making within the state
State treatment of citizens
Some central elements Elections and their competitiveness, inclusiveness, fairness, etc.
Candidate selection process
Electoral system
Executive-legislative relations
Judiciary
Federalism
Bureaucracy
Mechanisms of direct democracy
Corruption
Civil and human rights
Property rights
Press freedom
This proposal, to be sure, is tentative. Yet it drives home a key and somewhat unappreciated point: especially when the concepts of interest are broad in scope, concepts must be logically disaggregated. Indeed, unless the boundaries among closely related concepts are specified, the problem of conceptual conflation undercuts the possibility of advancing an analytic approach. Moreover, this proposal also provides a basis for beginning a focused discussion of the linkages among the central concepts used by distinct communities of scholars and practitioners who use different concepts yet are clearly grappling with the same underlying issues. Such linkages have been discussed in the context of the concepts of democracy, human rights, and human development.8
A conceptual linkage of particular interest in the context of measurement issues is that between democratic governance and empowerment. Empowerment has been understood as referring to “the expansion of assets and capabilities of poor people to participate in, negotiate with, influence, control, and hold accountable institutions that affect their lives” (Narayan 2002, 14). It is seen as entailing four core elements: access to information, inclusion and participation, accountability, and local organizational capacity (18–22). Clearly, multiple points of overlap exist with the concepts used in the literature on democratic governance. Empowerment and democratic governance share a concern with citizens’ ability to exercise control over state power, an issue seen as multidimensional. More pointedly, information, inclusion, accountability, and organization are all central to the ways in which analysts of democratic governance evaluate citizens’ access to government offices and their continued involvement in decision making between elections. There are, therefore, fruitful points of convergence between the concepts that
4
deserve to be further explored. But there are also differences, such as the greater emphasis within the empowerment framework on the ways in which material resources affect citizens’ ability to effectively exercise their rights, and the attention within the democratic governance framework to the ways governments are constituted and decisions are made within the state. These differences suggest that one key challenge is to coherently weave together frameworks that have been developed with similar motivations in mind, that is, to offer an encompassing approach to the study of societies.
Indicators
A second task to be tackled in developing a measuring instrument concerns the choice of indicators, that is, the observables used to operationalize various concepts. This task has been addressed quite rigorously in discussions by academics about the measurement of democracy, democratic institutions, and human rights.9 Other important contributions include various manuals and handbooks prepared by NGOs, IGOs, and development agencies on broad topics such as democracy and democratic governance (USAID 1998, 2000a; Beetham et al. 2001), as well as on more specific topics such as electoral observation (NDI 1995; OSCE/ODIHR 1997), corruption (USAID 1999; see also Heidenheimer and Johnston 2002), and gender equality (OECD/DAC 1998; ECLAC 1999; UNECE 2001; see also Apodaca 1998). Finally, this task has been addressed by a large number of conferences and many working groups that bring together academics and practitioners with representatives of various NGOs, IGOs, and development agencies (UN 2000).10
The work on indicators in recent years has produced important advances. As a result, current knowledge is considerably more sophisticated than it was some two decades ago. Nonetheless, existing indicators suffer from some problems, a central one being the failure to ensure that indicators fully tap into the meaning of the concepts being measured. In this regard, it should be noted that the common strategy of focusing on formal institutions is problematic. At the very least, the measurement of democratic governance must consider whether actors act according to the rules of formal institutions. And if actors do not channel their actions through formal rules, the behavior of these actors has to be registered in some other way. Thus it is clearly the case that such institutions are only part of what needs to be measured and that measurement cannot be reduced to a matter of formal rules. Yet overcoming this shortcoming is anything but easy, for it is quite difficult to identify indicators beyond formal institutions that capture the actual political process and are also firmly rooted in observables. Put in more technical terms, a lingering problem that affects many efforts at defining indicators is their inability to measure concepts both fully, so as to ensure content validity, and on the basis of observables, so as to guarantee replicability.
Scales
A third task to be undertaken in developing a measuring instrument is the construction of scales that spell out the level of measurement selected to measure variation. This task has direct implications for the potential use of data, whether for the purpose of academic analysis or—as is increasingly the case—for monitoring collectively determined goals. Yet relatively little work has focused on how to think about variation in the attributes of democratic governance.
5
Moreover, the debate that has taken place, on the choice between dichotomous and continuous measures of democracy, has generated little agreement (Collier and Adcock 1999).
The gaps in our knowledge regarding this task are indeed quite large. We need to devise ways to construct scales that capture the rich variety of intermediary possibilities in a systematic way and hence to identify multiple thresholds, to link each threshold with concrete situations or events with clear normative content, and to explicitly address the relationship among thresholds. These are all basic issues that affect the possibility of constructing meaningful scales to measure the attributes of democratic governance and should be the focus of more research.11
Aggregation Rule
Finally, a fourth task that is frequently relevant in constructing a measuring instrument concerns the specification of the aggregation rule used to combine multiple measures. This is not a necessary step in generating data. But there is a clear benefit to combining data on the various attributes of a concept: the creation of a summary score that synthesizes a sometimes quite large amount of data. This advantage partly explains why data generation has commonly included, as one goal, the creation of indices. However, a satisfactory way to address this task has still not been found. Some useful guidance concerning an aggregation rule can be drawn from existing theory and indices, but various problems persist. Most critically, attention to theory has been relatively absent. This is the case with data-driven methods, but even ostensibly theory-driven methods are presented in quite an ad hoc manner, with little justification, or simply rely on default options. Moreover, there is little consensus concerning how disaggregate data should be aggregated into an index.12
More work is thus needed on the following issues. First, it is necessary to address the relationship between indicators and the concept being measured and specify whether indicators are considered “cause” or “effect” indicators of the concept (Bollen and Lennox 1991).13 Second, if the indicators are considered to be “cause” indicators, it is necessary to explicitly theorize the status of each indicator and the relationship among all indicators and justify whether indicators should be treated as necessary conditions or whether substitutability and compensation among indicators might be envisioned (Verkuilen 2002, ch. 4). Third, more needs to be done to integrate theory and testing in the determination of an aggregation rule. These are central issues that have nonetheless rarely been addressed in a systematic manner in current efforts to develop measuring instruments.
Basic Problems with Measuring Instruments
The development of suitable measuring instruments also requires, more urgently, the avoidance of some basic problems. Such problems are not only common but also highly consequential, being found in various proposals that link data to policy choices and political conditionalities. Indeed, if the generation of data on democratic governance and the use of these data as an input in the policy process are to gain legitimacy, it will probably depend more than anything else on the concerted effort to understand and overcome these shortcomings. Thus, even though these problems are associated with the tasks discussed above, a separate discussion of five basic problems is merited.

6
Incomplete Measuring Instruments
Various initiatives that purport to use measures of democratic governance to monitor compliance with certain standards offer vague enunciations of principles (for example, the European Union’s accession democracy clause) or a list of items or questions (for example, the African Peer Review Mechanism of the New Partnership for Africa’s Development).14 These enunciations or lists provide some sense of which concepts are to be measured. But they are not measuring instruments, in that they are silent on a broad range of issues that are required to construct a measuring instrument. And the incomplete specification of a measuring instrument opens the door to the generation of data in an ad hoc way that is susceptible to political manipulation. If data are to be used in making political decisions, it is imperative to recognize that a list of items or questions provides, at best, a point of departure, and to fully assume the responsibility of developing a measuring instrument.
Denying Methodological Choices
A standard approach to preventing the political manipulation of data is to emphasize the need for objective data, the idea being that such data are not subject to politicking. But the commonly invoked distinction between objective and subjective data (see, for example, UNDP 2002, 36–37) is frequently associated with a simplistic view of the data generation process that can actually hide significant biases. The human element cannot be removed from the measurement process, since a broad range of methodological choices necessarily go into the construction of a measuring instrument. Thus, the best that can be done is to be up-front and explicit about these methodological choices, to justify them theoretically and subject them to empirical testing, and to allow independent observers to scrutinize and contest these choices by making the entire process of measurement transparent. This is the most effective way to generate good data and to guard against the real danger: not subjective data but rather arbitrary measures that rest on claims to authority.15
Delinking Methodological Choices from the Concept Being Measured
If choices and hence subjectivity are an intrinsic aspect of measurement, it is critical to ensure that the multiple choices involved in the construction of measures are always made in light of the ultimate goal of the measurement exercise: the measurement of a certain concept. This is so obvious that it might appear an unnecessary warning. Yet the delinking of methodology from the concept being measured is a mistake made by such significant initiatives as the Millennium Challenge Account (MCA) of the U.S. government. Indeed, while the MCA supposedly uses data as a means to identify countries that are democratic—the guiding idea being that democracies make better use of development aid and should thus be targeted—the methodology used to generate a list of target countries does not capture the concept of democracy and does not guarantee that democracies will be identified.16 When it comes to constructing measuring instruments and especially when methodological choices might be presented as technical in nature, it is essential to constantly link these choices explicitly and carefully back to the concept being measured.

7
Presenting Measurement as a Perfect Science
The results of the measurement process—quantitative data—tend to be taken, and sometimes are presented, as flawless measures. But such interpretations overlook one of the central points in measurement theory: that error is an inescapable part of any attempt at measurement. This is not merely a technical issue that might be sidestepped at little cost. Nor is it a fatal flaw that implies that the resulting measures should be distrusted and, at an extreme, rejected. Rather, all this point implies is that measurement is a precise but not a perfect science, and that measurement error should be factored into an estimate of the degree of confidence that is attached to data. Yet this critical point is frequently overlooked and data are presented as though they were error-free, something that can lead to mistaken results. A prominent example of such a problem is, again, the MCA.17 But it is not an isolated example. Therefore, efforts to construct measuring instruments and to interpret data must be forthcoming about the unavoidable nature of measurement error and must factor such error into any conclusions derived from the analysis of data.
Overcomplexification
Finally, it is not a bad thing to consider displays of technical virtuosity in measurement exercises with a degree of suspicion. To be sure, measurement involves a range of sometimes quite complex issues and these should all be given the attention they deserve. But it is also useful to emphasize that good data are readily interpretable and to warn against overcomplexification. Indeed, there are grounds to suspect that a measuring instrument that is hard to grasp reduces the accessibility and interpretability of data without necessarily adding to their validity. Numerous examples of such overcomplexification exist in the field of democratic governance and a sign of this is the real difficulty even experts face in conveying the meaning of many indices in ways that make real, tangible sense. Thus, a good rule of thumb in constructing measuring instruments is to keep things as simple as possible.
Conclusion
The distance between science and politics has been greatly reduced as data about politics, and the analyses of these data, are increasingly used in politics and are becoming a part of the political process itself. We live in an age in which data, especially quantitative data, are widely recognized as tools for scientific analysis and social reform but are also closely intertwined with the language of power. Thus, it is only proper that social scientists assume the responsibilities associated with the new salience of data on politics by contributing to the generation of good data and by exercising scrutiny over the ways in which data, and analyses of data, on democratic governance are put to political uses.
The construction of adequate measuring instruments remains an important challenge. In this regard, it is essential to acknowledge that currently available instruments are contributions to a fairly new and still unfolding debate about how to generate data on politics. This debate, which should address the tasks discussed in this chapter, will hopefully generate significant advances that will lead to broadly accepted instruments.

8
In the meantime, it is sensible to highlight the need for caution concerning claims about data on politics. This means, most vitally, that the basic problems with measuring instruments discussed above must be avoided. These problems could undermine the legitimacy of using data for policy purposes and solidify opposition to initiatives seeking to build bridges between science and politics. In addition, this means that currently available data sets on democratic governance, such as those included in this chapter’s appendix, must be used with care. After all, inasmuch as measuring instruments remain a matter of debate, the data generated with these instruments must be considered as quite tentative and subject to revision. The exercise of caution might run against the tendency of some advocates to play up achievements in the measurement of democratic governance. But a conservative strategy, which puts a premium on avoiding the dangers of “numerological nonsense” (Rokkan 1970, 288), is the strategy most likely to ensure the continuation and maturation of current interest in data on democratic governance.
Appendix: A Select List of Data Sets on Democratic Governance
The following list of data sets gives a sense of the resources that are currently available.18 The presentation is organized in terms of the conceptual distinction between the political regime, governance, and rule of law introduced in table 19.1, distinguishing also between indices, that is, aggregate data, and indicators, that is, disaggregate data. All these data sets take the nation-state as their unit of analysis. A final table presents some resources on subnational units.
The measurement of the concept of political regime has been a concern within academia for some time and the generation of indices in particular has been the subject of a fair amount of analysis (table 19.2). These indices have tended to be minimalist, in the sense that they do not include important components such as participation. Moreover, though they tend to correlate quite highly, there is evidence that there are significant differences among them. Nonetheless, most of these indices are firmly rooted in democratic theory and, with some important exceptions (especially the Freedom House Political Rights Index), offer disaggregate measures as well as an aggregate measure. Beyond these indices, in recent times much effort has gone into generating measures of important elements of the democratic regime (table 19.3). In comparative terms, the measurement of the democratic regime and its various elements is more advanced than the measurement of other aspects of the political process.
Table 19.2 Political Regime Indices
Name Components Scope Source
Free and fair elections for the chief executive
Freedom House’s Political Rights Index Free and fair elections for the legislature
172 countries, 1972–present
Freedom House, www.freedomhouse.org

9
Fair electoral process
Effective power of elected officials
Right to form political parties
Power of opposition parties
Freedom from domination by power groups (e.g. the military, foreign powers, religious hierarchies, economic oligarchies)
Autonomy and self-government for cultural, ethnic, religious, or other minority group
Government repression
Orderly change in government
199 countries, 1996–2002
Vested interests
Daniel Kaufmann, Aart Kraay, and Massimo Mastruzzi, www.worldbank.org/wbi/governance/govdata2002/index.html
Accountability of public officials
Human rights
Freedom of association
Civil liberties
Political liberties
Freedom of the press
Governance Research Indicators Dataset (2002): Voice and Accountability Index
Travel restrictions
Freedom of political participation
Imprisonment
Government censorship
Military role in politics
Responsiveness of the government
10
Democratic accountability
Institutional permanence
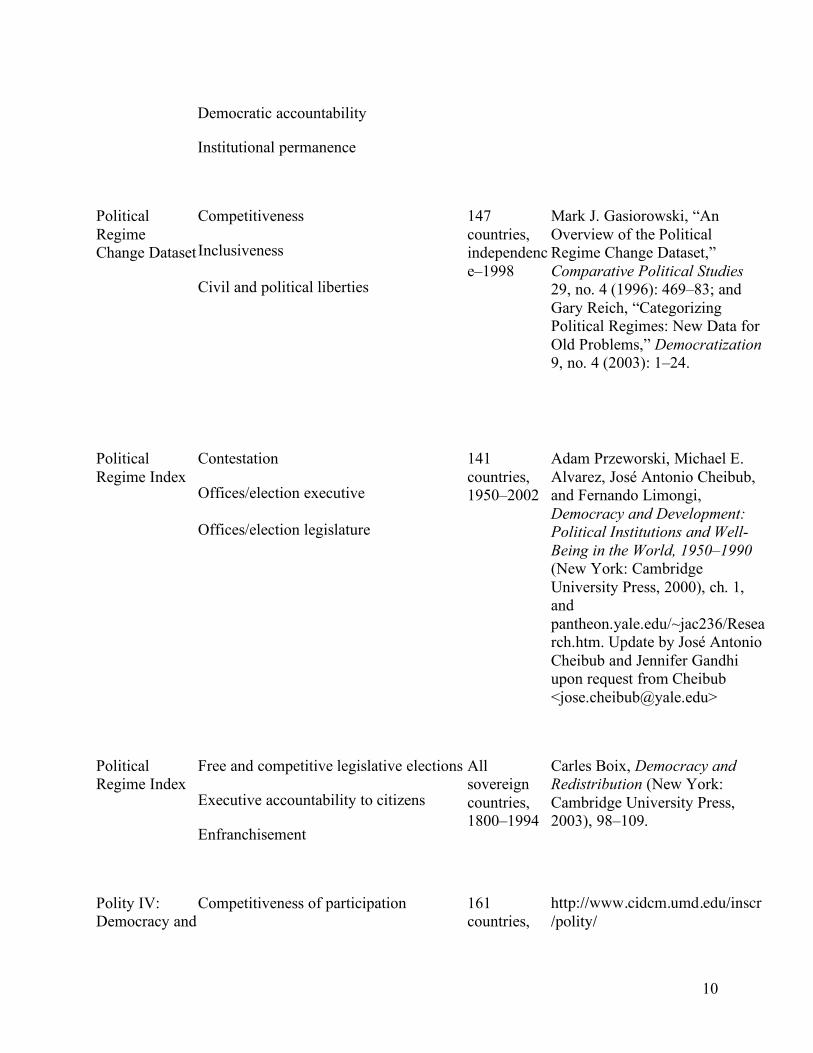
Competitiveness Political Regime Change Dataset Inclusiveness
Civil and political liberties
147 countries, independence–1998
Mark J. Gasiorowski, “An Overview of the Political Regime Change Dataset,” Comparative Political Studies 29, no. 4 (1996): 469–83; and Gary Reich, “Categorizing Political Regimes: New Data for Old Problems,” Democratization 9, no. 4 (2003): 1–24.
Contestation Political Regime Index
Offices/election executive
141 countries, 1950–2002
Offices/election legislature
Adam Przeworski, Michael E. Alvarez, José Antonio Cheibub, and Fernando Limongi, Democracy and Development: Political Institutions and Well-Being in the World, 1950–1990 (New York: Cambridge University Press, 2000), ch. 1, and pantheon.yale.edu/~jac236/Research.htm. Update by José Antonio Cheibub and Jennifer Gandhi upon request from Cheibub <[email protected]>
Free and competitive legislative elections Political Regime Index
Executive accountability to citizens
Enfranchisement
All sovereign countries, 1800–1994
Carles Boix, Democracy and Redistribution (New York: Cambridge University Press, 2003), 98–109.
Polity IV: Democracy and
Competitiveness of participation 161 countries,
http://www.cidcm.umd.edu/inscr/polity/
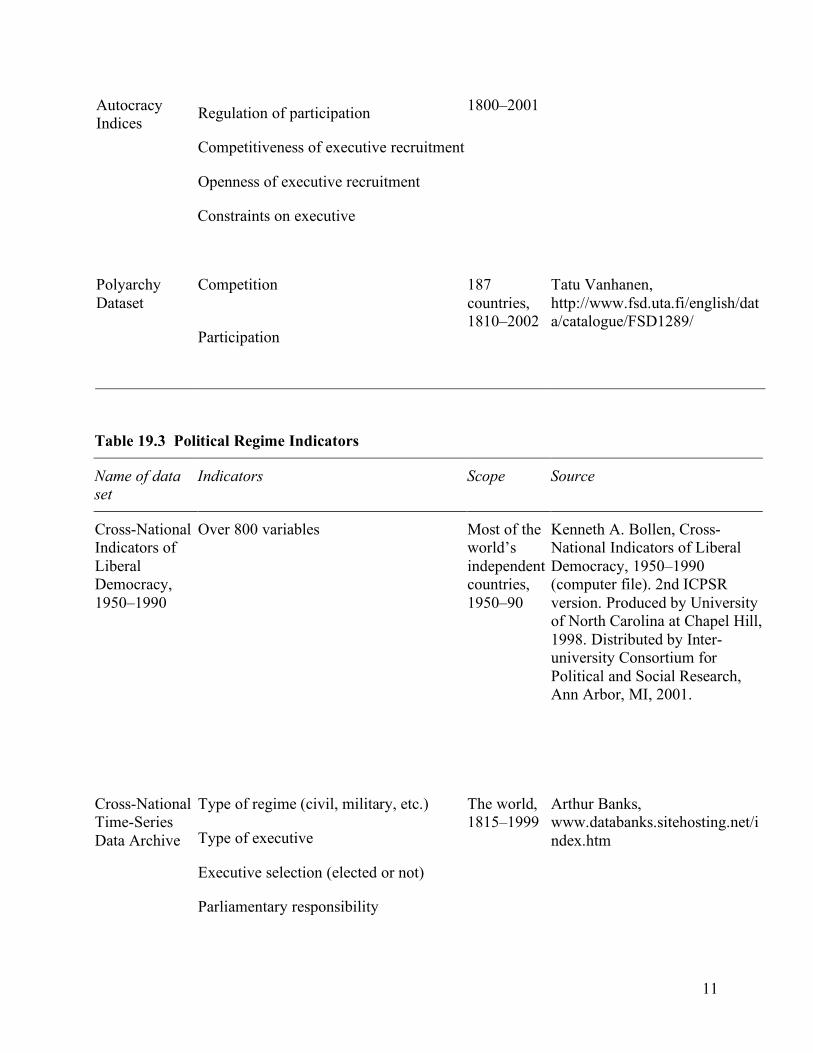
11
Regulation of participation 1800–2001
Competitiveness of executive recruitment
Autocracy Indices
Openness of executive recruitment
Constraints on executive
Polyarchy Dataset
Competition
Participation
187 countries, 1810–2002
Tatu Vanhanen, http://www.fsd.uta.fi/english/data/catalogue/FSD1289/
Table 19.3 Political Regime Indicators
Name of data set
Indicators Scope Source
Over 800 variables
Cross-National Indicators of Liberal Democracy, 1950–1990
Most of the world’s independent countries, 1950–90
Kenneth A. Bollen, Cross-National Indicators of Liberal Democracy, 1950–1990 (computer file). 2nd ICPSR version. Produced by University of North Carolina at Chapel Hill, 1998. Distributed by Inter-university Consortium for Political and Social Research, Ann Arbor, MI, 2001.
Type of regime (civil, military, etc.)
Type of executive
The world, 1815–1999
Executive selection (elected or not)
Arthur Banks, www.databanks.sitehosting.net/index.htm
Cross-National Time-Series Data Archive
Parliamentary responsibility

12
Legislative selection (elected or not)
Competitiveness of nominating process for legislature
Party legitimacy (party formation)
Direct public financing
Disclosure laws
Data on Campaign Finance
Access to free TV time
114–43 countries, c. 2001
Limits on spending on TV
Michael Pinto-Duschinsky, “Financing Politics: A Global View,” Journal of Democracy 13, no. 4 (2002): 69–86.
Elections under dictatorship and democracy
Electoral system
Database on Electoral Institutions
199 countries, 1946 (or independence)–2000
Matt Golder, http://homepages.nyu.edu/%7Emrg217/elections.html
Type of electoral system Database of Electoral Systems
Entire world, present
International IDEA, www.idea.int/esd/data.cfm
Electoral systems
Legislative framework
56 countries, present
Election Process Information Collection, www.epicproject.org/
Database of the EPIC Project
Electoral management
Boundary delimitation
Voter education
Voter registration
Voting operations
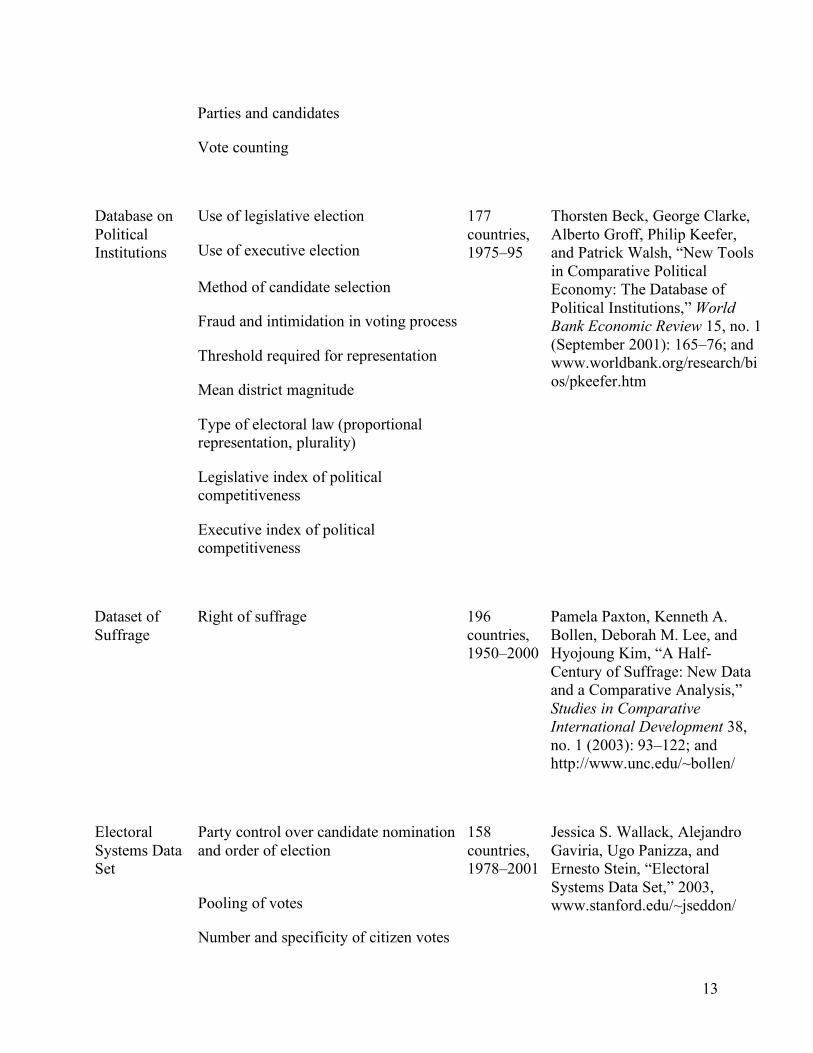
13
Parties and candidates
Vote counting
Use of legislative election
Use of executive election
177 countries, 1975–95
Database on Political Institutions
Method of candidate selection
Fraud and intimidation in voting process
Threshold required for representation
Mean district magnitude
Type of electoral law (proportional representation, plurality)
Legislative index of political competitiveness
Executive index of political competitiveness
Thorsten Beck, George Clarke, Alberto Groff, Philip Keefer, and Patrick Walsh, “New Tools in Comparative Political Economy: The Database of Political Institutions,” World Bank Economic Review 15, no. 1 (September 2001): 165–76; and www.worldbank.org/research/bios/pkeefer.htm
Dataset of Suffrage
Right of suffrage 196 countries, 1950–2000
Pamela Paxton, Kenneth A. Bollen, Deborah M. Lee, and Hyojoung Kim, “A Half-Century of Suffrage: New Data and a Comparative Analysis,” Studies in Comparative International Development 38, no. 1 (2003): 93–122; and http://www.unc.edu/~bollen/
Party control over candidate nomination and order of election
158 countries, 1978–2001
Electoral Systems Data Set
Pooling of votes
Number and specificity of citizen votes
Jessica S. Wallack, Alejandro Gaviria, Ugo Panizza, and Ernesto Stein, “Electoral Systems Data Set,” 2003, www.stanford.edu/~jseddon/
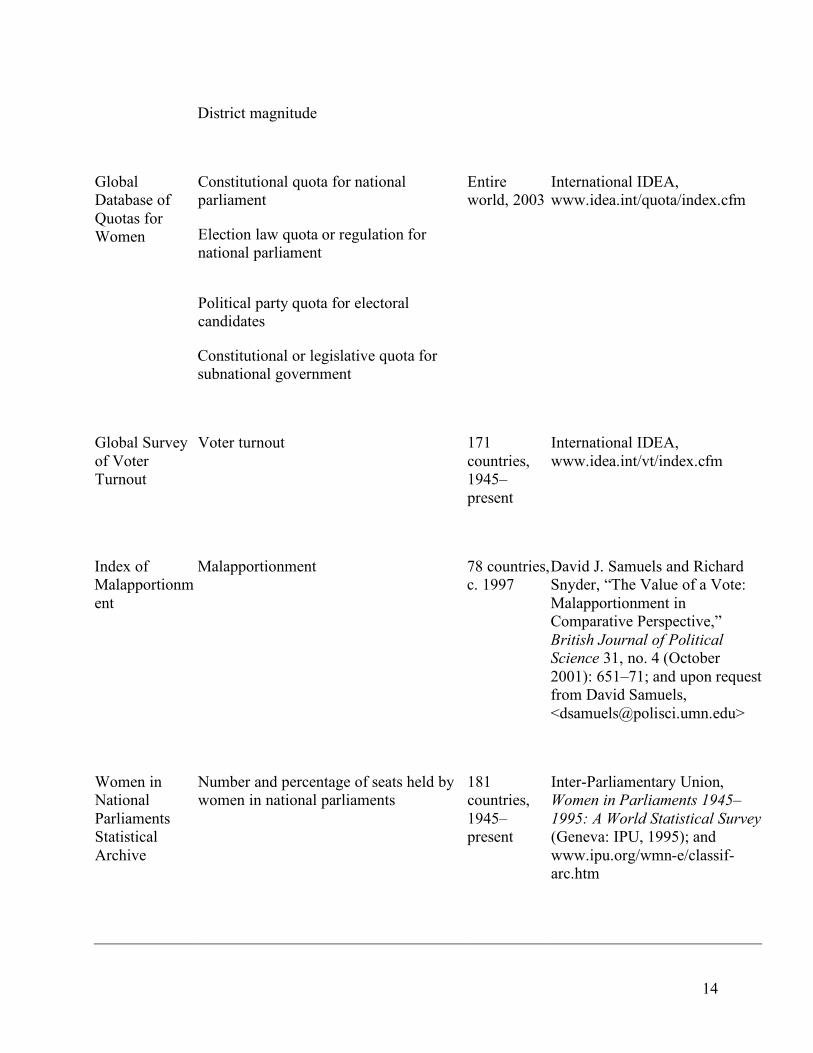
14
District magnitude
Constitutional quota for national parliament
Entire world, 2003
Election law quota or regulation for national parliament
International IDEA, www.idea.int/quota/index.cfm
Global Database of Quotas for Women
Political party quota for electoral candidates
Constitutional or legislative quota for subnational government
Voter turnout Global Survey of Voter Turnout
171 countries, 1945–present
International IDEA, www.idea.int/vt/index.cfm
Index of Malapportionment
Malapportionment 78 countries, c. 1997
David J. Samuels and Richard Snyder, “The Value of a Vote: Malapportionment in Comparative Perspective,” British Journal of Political Science 31, no. 4 (October 2001): 651–71; and upon request from David Samuels, <[email protected]>
Women in National Parliaments Statistical Archive
Number and percentage of seats held by women in national parliaments
181 countries, 1945–present
Inter-Parliamentary Union, Women in Parliaments 1945–1995: A World Statistical Survey (Geneva: IPU, 1995); and www.ipu.org/wmn-e/classif-arc.htm

15
The measurement of the concept of governance reveals some bright spots and some problems (tables 19.4 and 19.5). At the disaggregate level, important progress has been made and the Database on Political Institutions in particular is a valuable resource in this regard. However, we still lack a good index. Some indices, such as the Weberian State Scale, focus on only one element of democratic governance and their scope is quite limited. Others, such as the Political Constraint Index, do not touch upon the implementation aspect although they address the policy-making process in fairly broad terms. Finally, those indices that do address policy implementation tend to combine such a large number of indicators, which tap into a range of very diverse phenomena, that they are hard to interpret.
Table 19.4 Governance Indices
Name Components Scope Source
Decline in central authority
Political protest
199 countries, 1996–2002
Ethno-cultural and religious conflict
External military intervention
Daniel Kaufmann, Aart Kraay, and Massimo Mastruzzi, www.worldbank.org/wbi/governance/govdata2002/index.html
Military coup risk
Political assassination
Governance Research Indicators Dataset (2002): Political Stability Index
Civil war
Urban riot
Armed conflict
Violent demonstration
Social unrest
International tension
Disappearances, torture
Terrorism
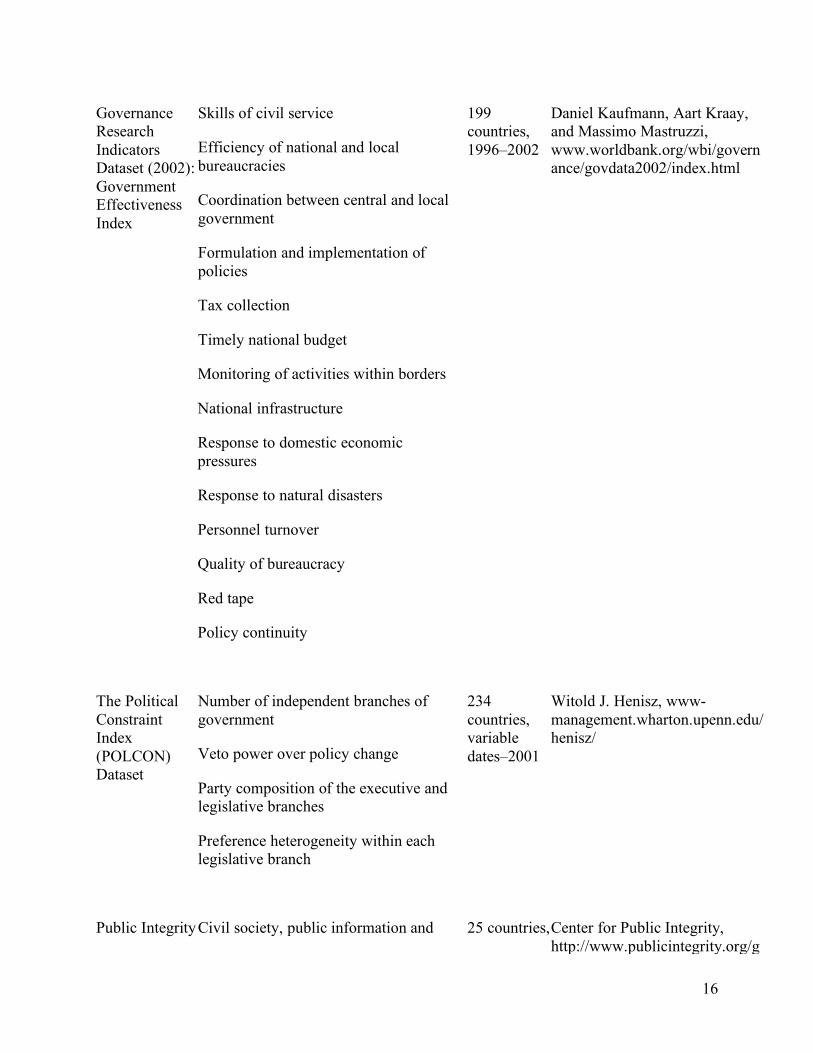
16
Skills of civil service
Efficiency of national and local bureaucracies
199 countries, 1996–2002
Coordination between central and local government
Daniel Kaufmann, Aart Kraay, and Massimo Mastruzzi, www.worldbank.org/wbi/governance/govdata2002/index.html
Formulation and implementation of policies
Tax collection
Governance Research Indicators Dataset (2002): Government Effectiveness Index
Timely national budget
Monitoring of activities within borders
National infrastructure
Response to domestic economic pressures
Response to natural disasters
Personnel turnover
Quality of bureaucracy
Red tape
Policy continuity
Number of independent branches of government
Veto power over policy change
Party composition of the executive and legislative branches
234 countries, variable dates–2001
Witold J. Henisz, www-management.wharton.upenn.edu/henisz/
The Political Constraint Index (POLCON) Dataset
Preference heterogeneity within each legislative branch
Public Integrity Civil society, public information and 25 countries, Center for Public Integrity, http://www.publicintegrity.org/g

17
media Index
Electoral and political processes
2003 a/default.aspx
Branches of government
Civil service and administration
Oversight and regulatory mechanisms
Anti-corruption and rule of law
Ethnic wars
Revolutionary wars
96 countries, 1955–2002
State Failure Problem Set
Genocides and politicides
State Failure Task Force, www.cidcm.umd.edu/inscr/stfail/sfdata.htm
Adverse regime changes
Agencies generating economic policy Weberian State Scale
Meritocratic hiring
35 countries, 1993–96
Internal promotion and career stability
Peter Evans and James Rauch, “Weberian State Comparative Data Set,” weber.ucsd.edu/~jrauch/webstate/
Salary and prestige
Table 19.5 Governance Indicators
Name of data set
Indicators Scope Source
War Country Risk Service
Social unrest
100 countries, 1997–present
Economic Intelligence Unit, www.eiu.com/
Orderly political transfers
Politically motivated violence

18
Institutional effectiveness
Bureaucracy
Legislative effectiveness vis-à-vis the executive
Number of seats in legislature held by largest party
The world, 1815–1999
Cross-National Time-Series Data Archive
Party fractionalization index
Arthur Banks, www.databanks.sitehosting.net/index.htm
System (presidential, assembly-elected president, parliamentary)
177 countries, 1975–95
Presidential control of congress
Database on Political Institutions
Herfindhal index of government and opposition
Party fractionalization
Position on right-left scale; rural, regional, nationalist, or religious basis
Index of political cohesion
Number of veto players
Change in veto players
Polarization
Thorsten Beck, George Clarke, Alberto Groff, Philip Keefer, and Patrick Walsh, “New Tools in Comparative Political Economy: The Database of Political Institutions,” World Bank Economic Review 15, no. 1 (September 2001): 165–76; and www.worldbank.org/research/bios/pkeefer.htm
Judicial independence
102 countries, 2003
World Economic Forum, http://www.weforum.org
Executive Opinion Survey of the Global Competitiveness Report
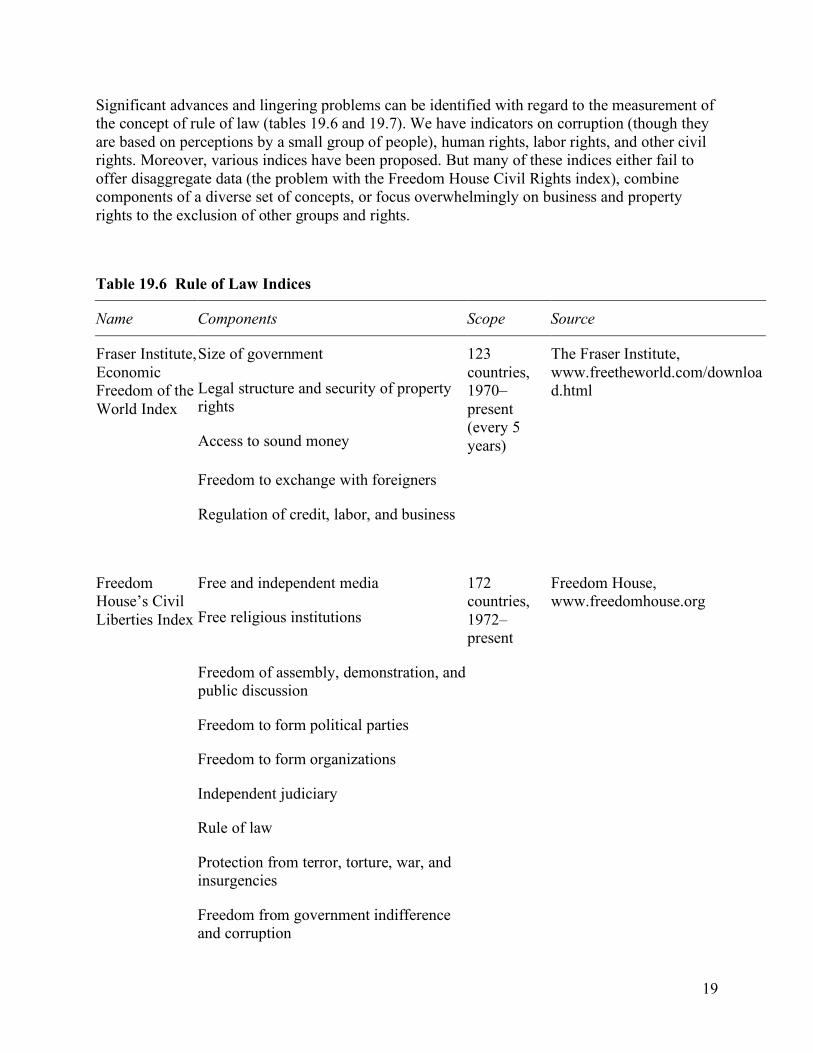
19
Significant advances and lingering problems can be identified with regard to the measurement of the concept of rule of law (tables 19.6 and 19.7). We have indicators on corruption (though they are based on perceptions by a small group of people), human rights, labor rights, and other civil rights. Moreover, various indices have been proposed. But many of these indices either fail to offer disaggregate data (the problem with the Freedom House Civil Rights index), combine components of a diverse set of concepts, or focus overwhelmingly on business and property rights to the exclusion of other groups and rights.
Table 19.6 Rule of Law Indices
Name Components Scope Source
Size of government
Legal structure and security of property rights
Access to sound money
123 countries, 1970–present (every 5 years)
The Fraser Institute, www.freetheworld.com/download.html
Freedom to exchange with foreigners
Fraser Institute, Economic Freedom of the World Index
Regulation of credit, labor, and business
Free and independent media
Free religious institutions
172 countries, 1972–present
Freedom House’s Civil Liberties Index
Freedom of assembly, demonstration, and public discussion
Freedom House, www.freedomhouse.org
Freedom to form political parties
Freedom to form organizations
Independent judiciary
Rule of law
Protection from terror, torture, war, and insurgencies
Freedom from government indifference and corruption
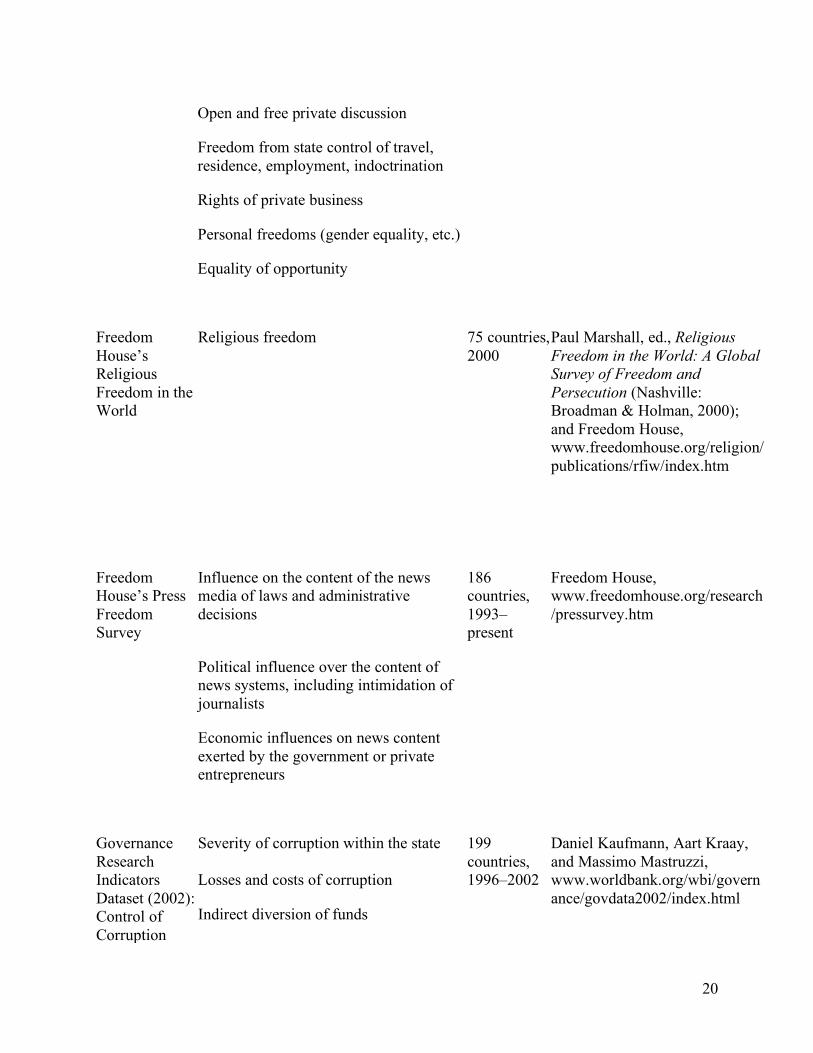
20
Open and free private discussion
Freedom from state control of travel, residence, employment, indoctrination
Rights of private business
Personal freedoms (gender equality, etc.)
Equality of opportunity
Religious freedom
75 countries, 2000
Freedom House’s Religious Freedom in the World
Paul Marshall, ed., Religious Freedom in the World: A Global Survey of Freedom and Persecution (Nashville: Broadman & Holman, 2000); and Freedom House, www.freedomhouse.org/religion/publications/rfiw/index.htm
Influence on the content of the news media of laws and administrative decisions
186 countries, 1993–present
Freedom House’s Press Freedom Survey
Political influence over the content of news systems, including intimidation of journalists
Economic influences on news content exerted by the government or private entrepreneurs
Freedom House, www.freedomhouse.org/research/pressurvey.htm
Severity of corruption within the state
Losses and costs of corruption
199 countries, 1996–2002
Governance Research Indicators Dataset (2002): Control of Corruption
Indirect diversion of funds
Daniel Kaufmann, Aart Kraay, and Massimo Mastruzzi, www.worldbank.org/wbi/governance/govdata2002/index.html
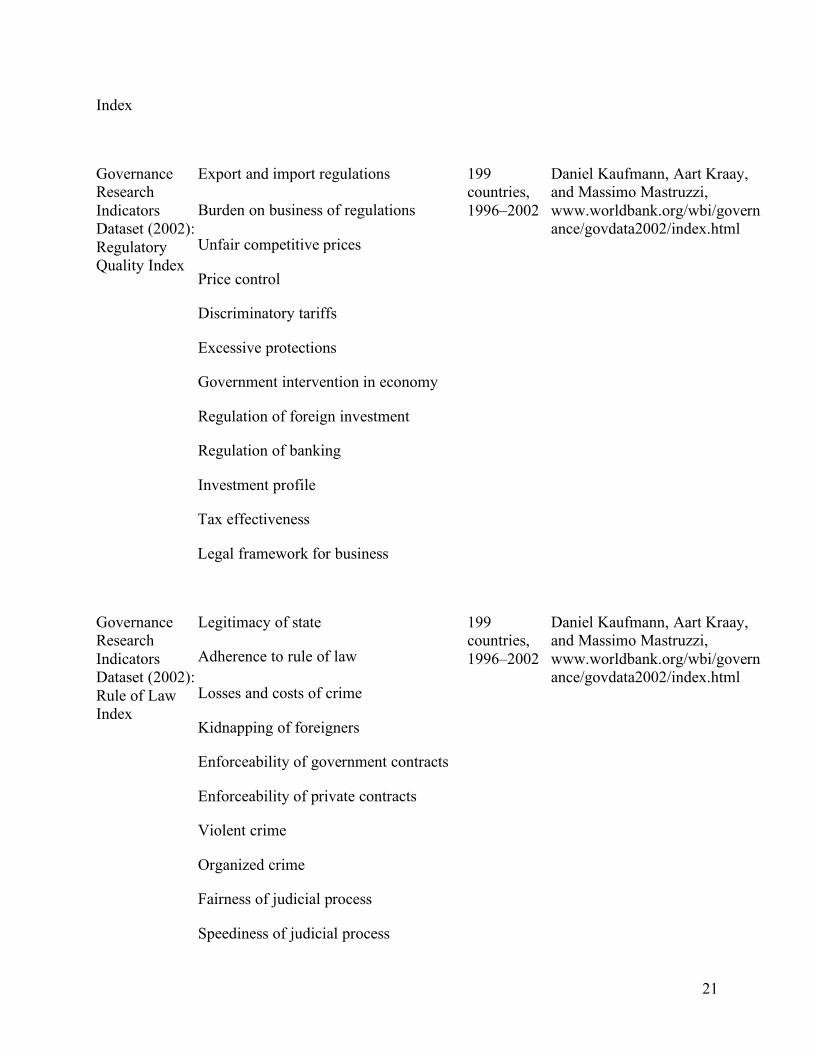
21
Index
Export and import regulations
Burden on business of regulations
199 countries, 1996–2002
Unfair competitive prices
Daniel Kaufmann, Aart Kraay, and Massimo Mastruzzi, www.worldbank.org/wbi/governance/govdata2002/index.html
Price control
Discriminatory tariffs
Excessive protections
Government intervention in economy
Regulation of foreign investment
Regulation of banking
Governance Research Indicators Dataset (2002): Regulatory Quality Index
Investment profile
Tax effectiveness
Legal framework for business
Legitimacy of state
Adherence to rule of law
199 countries, 1996–2002
Losses and costs of crime
Daniel Kaufmann, Aart Kraay, and Massimo Mastruzzi, www.worldbank.org/wbi/governance/govdata2002/index.html
Kidnapping of foreigners
Enforceability of government contracts
Enforceability of private contracts
Violent crime
Organized crime
Fairness of judicial process
Governance Research Indicators Dataset (2002): Rule of Law Index
Speediness of judicial process
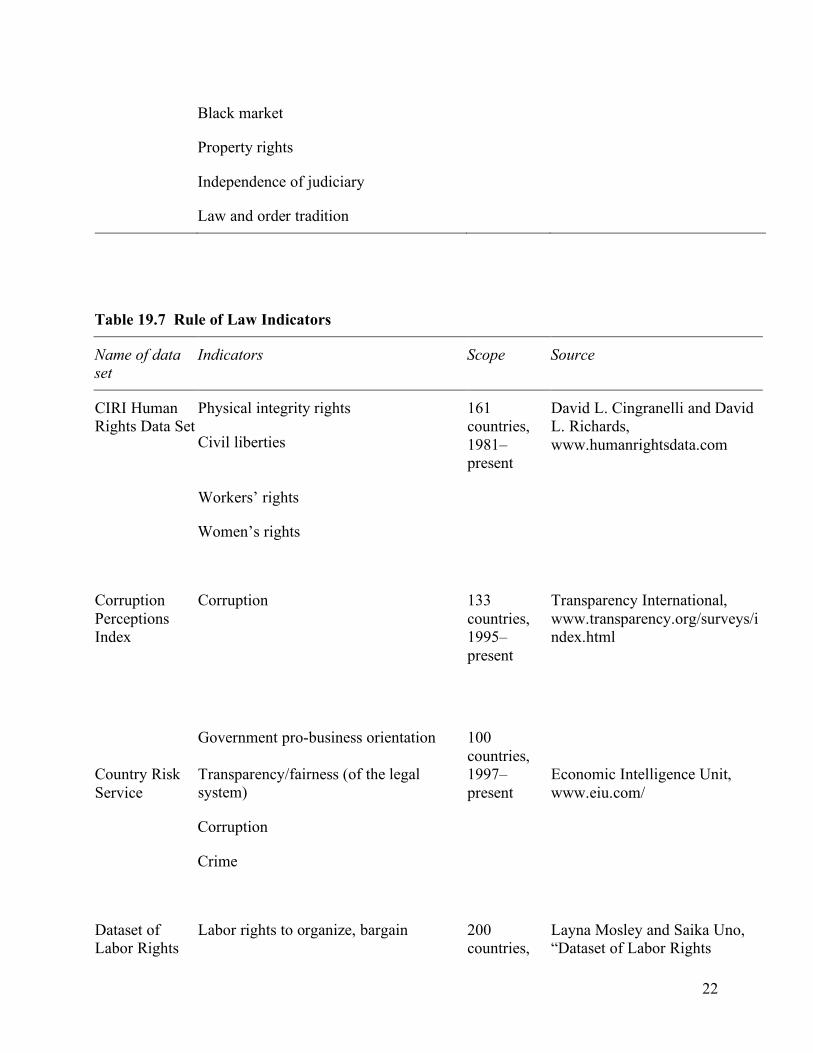
22
Black market
Property rights
Independence of judiciary
Law and order tradition
Table 19.7 Rule of Law Indicators
Name of data set
Indicators Scope Source
Physical integrity rights
Civil liberties
161 countries, 1981–present
David L. Cingranelli and David L. Richards, www.humanrightsdata.com
CIRI Human Rights Data Set
Workers’ rights
Women’s rights
Corruption
Corruption Perceptions Index
133 countries, 1995–present
Transparency International, www.transparency.org/surveys/index.html
Government pro-business orientation
Country Risk Service
Transparency/fairness (of the legal system)
100 countries, 1997–present
Economic Intelligence Unit, www.eiu.com/
Corruption
Crime
Dataset of Labor Rights
Labor rights to organize, bargain 200 countries,
Layna Mosley and Saika Uno, “Dataset of Labor Rights

23
Violations collectively, and strike 1981–2000
Violations, 1981–2000,” University of Notre Dame, Notre Dame, IN, 2002.
Corruption
102 countries, 2003
World Economic Forum, http://www.weforum.org
Executive Opinion Survey of the Global Competitiveness Report
Violence against journalists Journalists killed statistics
Entire world, 1992–present
Committee to Protect Journalists, www.cpj.org/killed/Ten_Year_Killed/Intro.html
Minorities at Risk Ethno-cultural distinctiveness
Group’s spatial concentration
Length of group’s residence in country
267 communal groups, 1945–present
Minorities at Risk Project, www.cidcm.umd.edu/inscr/mar/
Group’s presence in adjoining country
Group’s loss of autonomy
Strength of group’s cultural identity
Cultural differentials
Political differentials
Economic differentials

24
Demographic stress
Political discrimination
Economic disadvantage
Cultural discrimination
Identity cohesion
Organizational cohesion
Administrative autonomy
Mobilization
Orientation to conventional vs. militant strategies of action
Autonomy grievances
Political (non-autonomy) grievances
Economic grievances
Cultural grievances
Intra-group factional conflict
Intra-communal antagonists
Severity of intra-group conflict
Group protest activities
Anti-regime rebellion
Government repression of group
International contagion and diffusion
Transnational support for communal groups
Advantaged minorities
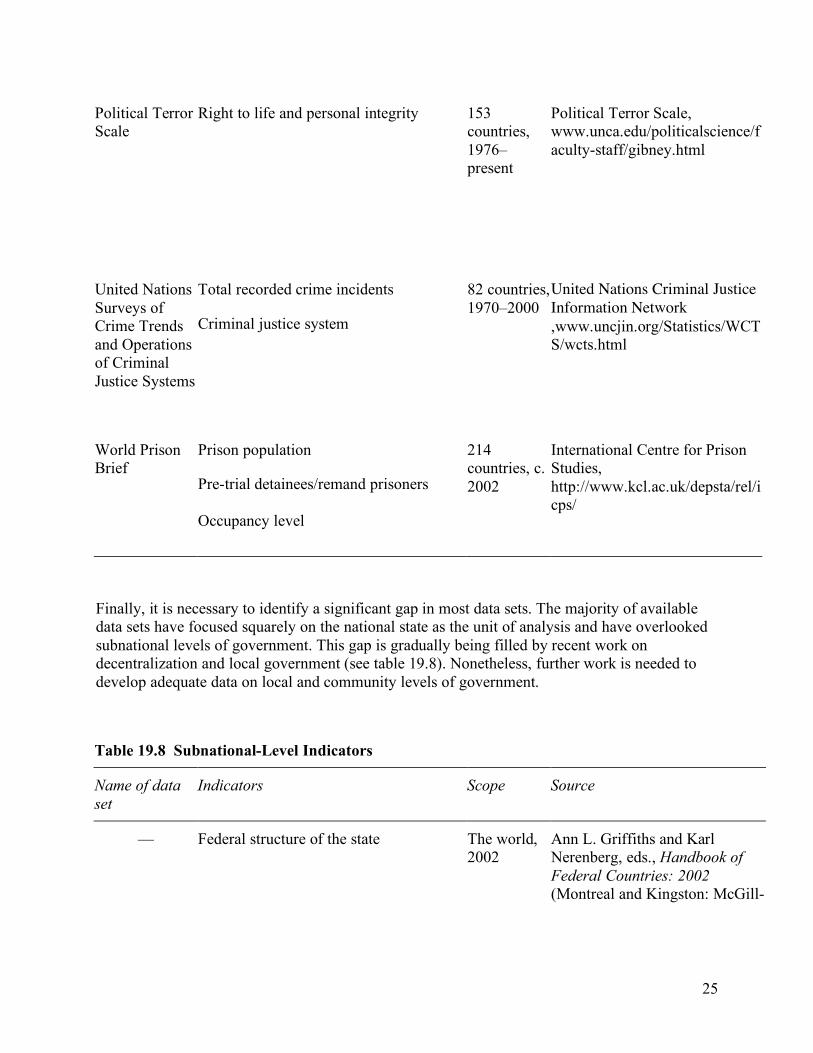
25
Political Terror Scale
Right to life and personal integrity 153 countries, 1976–present
Political Terror Scale, www.unca.edu/politicalscience/faculty-staff/gibney.html
Total recorded crime incidents
Criminal justice system
82 countries, 1970–2000
United Nations Surveys of Crime Trends and Operations of Criminal Justice Systems
United Nations Criminal Justice Information Network ,www.uncjin.org/Statistics/WCTS/wcts.html
Prison population World Prison Brief
Pre-trial detainees/remand prisoners
214 countries, c. 2002
Occupancy level
International Centre for Prison Studies, http://www.kcl.ac.uk/depsta/rel/icps/
Finally, it is necessary to identify a significant gap in most data sets. The majority of available data sets have focused squarely on the national state as the unit of analysis and have overlooked subnational levels of government. This gap is gradually being filled by recent work on decentralization and local government (see table 19.8). Nonetheless, further work is needed to develop adequate data on local and community levels of government.
Table 19.8 Subnational-Level Indicators
Name of data set
Indicators Scope Source
— Federal structure of the state
The world, 2002
Ann L. Griffiths and Karl Nerenberg, eds., Handbook of Federal Countries: 2002 (Montreal and Kingston: McGill-

26
Queen’s University Press, 2002).
Appointed or elected state/province and municipal executives
177 countries, 1975–95
Database on Political Institutions
Appointed or elected legislatures
Autonomous or self-governing regions, areas, or districts
State or provincial authority over taxing, spending, or legislating
Thorsten Beck, George Clarke, Alberto Groff, Philip Keefer, and Patrick Walsh, “New Tools in Comparative Political Economy: The Database of Political Institutions,” World Bank Economic Review 15, no. 1 (September 2001): 165–76; and www.worldbank.org/research/bios/pkeefer.htm
IMF’s Government Finance Statistics
Number of tiers or units of administration (state/province/region/department; municipality, city/town)
The world, 2001
International Monetary Fund, Government Finance Statistics Manual 2001 (Washington, DC: IMF, 2001).
Number of jurisdictions
Subnational expenditure share of national expenditures
149 countries, 1972–2000
Subnational revenue share of national revenues
World Bank Database of Fiscal Decentralization Indicators
Intergovernmental transfers as a share of subnational expenditures
World Bank, Public Sector Governance, Decentralization and Subnational Regional Economics, http://www1.worldbank.org/publicsector/decentralization/data.htm

27
References
Apodaca, Clair. 1998. “Measuring Women’s Economic and Social Rights Achievements.” Human Rights Quarterly 20 (1): 139–72.
Beetham, David, ed. 1994. Defining and Measuring Democracy. London: Sage Publications.
Beetham, David, Sarah Bracking, Iain Kearton, and Stuart Weir, eds. 2001. International IDEA Handbook on Democracy Assessment. The Hague: Kluge Academic Publishers.
Besançon, Marie. 2003. “Good Governance Rankings: The Art of Measurement.” World Peace Foundation Reports 36. Cambridge, MA: World Peace Foundation.
Berg-Schlosser, Dirk. 2003. “Indicators of Democratization and Good Governance as Measures of the Quality of Democracy: A Critical Appraisal.” Paper presented at international conference on Reassessing Democracy, Bremen, Germany, June 20–22.
Bollen, Kenneth A. 2001. “Indicator: Methodology.” In International Encyclopedia of the Social and Behavioral Sciences, ed. Neil J. Smelser and Paul B. Baltes, 7282–87. Oxford: Elsevier Science.
Bollen, Kenneth, and Richard Lennox. 1991. “Conventional Wisdom on Measurement: A Structural Equation Perspective.” Psychological Bulletin 110 (2): 305–14.
Casper, Gretchen, and Claudiu D. Tufis. 2002. “Correlation versus Interchangeability: The Limited Robustness of Empirical Findings on Democracy using Highly Correlated Datasets.” Political Analysis 11 (2): 196–203.
Cingranelli, David L., ed. 1998. Human Rights: Theory and Measurement. New York: St. Martin’s Press.
Collier, David, and Robert N. Adcock. 1999. “Democracy and Dichotomies: A Pragmatic Approach to Choices about Concepts.” Annual Review of Political Science 2: 537–65.
Collier, David, and Steven Levitsky. 1997. “Democracy with Adjectives: Conceptual Innovation in Comparative Research.” World Politics 49 (3): 430–51.
Crawford, Gordon. 2003. “Promoting Democracy from Without: Learning from Within.” Pts. 1 and 2. Democratization 10 (1): 77–98; 10 (2): 1–20.
Dahl, Robert A. 1971. Polyarchy. New Haven: Yale University Press.
———. 1989. Democracy and Its Critics. New Haven: Yale University Press.
ECLAC (Economic Commission for Latin America and the Caribbean). 1999. “Indicadores de Género para el Seguimiento y la Evaluación del Programa de Acción Regional para las
28
Mujeres de América Latina y el Caribe, 1995–2001, y la Plataforma de Acción de Beijing.” LC/L.1186. Santiago, Chile.
Foweraker, Joe, and Roman Krznaric. 2000. “Measuring Liberal Democratic Performance: An Empirical and Conceptual Critique.” Political Studies 48 (4): 759–87.
Fukuda-Parr, Sakiko, and A. K. Shiva Kumar, eds. 2002. Human Development: Concepts and Measures: Essential Readings. New York: Oxford University Press.
Green, Maria. 2001. “What We Talk About When We Talk About Indicators: Current Approaches to Human Rights Measurement.” Human Rights Quarterly 23 (4): 1062–97.
Heath, Anthony, and Jean Martin. 1997. “Why Are There So Few Formal Measuring Instruments in Social and Political Research?” In Survey Measurement and Process Quality, ed. Lars E. Lyberg, Paul Biemer, Martin Collins, Edith De Leeuw, Cathryn Dippo, Norbert Schwarz, and Dennis Trewin, 71–86. New York: Wiley.
Heidenheimer, Arnold J., and Michael Johnston, eds. 2002. Political Corruption: Concepts and Contexts. New Brunswick, NJ: Transaction Press.
Herrera, Yoshiko M., and Devesh Kapur. 2002. “Infectious Credulity: Strategic Behavior in the Manufacture and Use of Data.” Paper presented at the annual meeting of the American Political Science Association, Boston, August 29–September 1.
Inkeles, Alex, ed. 1991. On Measuring Democracy. New Brunswick, NJ: Transaction Press.
Jabine, Thomas B., and Richard P. Claude, eds. 1992. Human Rights and Statistics: Getting the Record Straight. Philadelphia: University of Pennsylvania Press.
Kapur, Devesh. 2001. “Expansive Agendas and Weak Instruments: Governance Related Conditionalities of International Financial Institutions.” Journal of Policy Reform 4 (3): 207–41.
Kapur, Devesh, and Richard Webb. 2000. “Governance-Related Conditionalities of the International Financial Institutions.” G-24 Discussion Paper Series 6, United Nations Conference on Trade and Development, New York.
Kaufmann, Daniel, Aart Kraay, and Massimo Mastruzzi. 2003. “Governance Matters III: Governance Indicators for 1996–2002.” Policy Research Working Paper 3106, World Bank, Washington, DC.
Knack, Stephen, and Nick Manning. 2000. “Towards Consensus on Governance Indicators: Selecting Public Management and Broader Governance Indicators.” World Bank, Washington, DC.
Landman, Todd. 2004. “Measuring Human Rights: Principle, Practice, and Policy.” Human Rights Quarterly 26 (4).

29
Landman, Todd, and Julia Häusermann. 2003. “Map-Making and Analysis of the Main International Initiatives on Developing Indicators on Democracy and Good Governance.” Report prepared for the Statistical Office of the Commission of the European Communities (EUROSTAT). Human Rights Centre, University of Essex, Colchester, UK.
Langlois, Anthony J. 2003. “Human Rights Without Democracy? A Critique of the Separationist Thesis.” Human Rights Quarterly 25 (4): 990–1019.
Lauth, Hans-Joachim. 2003. “Democracy: Limits and Problems of Existing Measurements and Some Annotations upon Further Research.” Paper presented at international conference on Reassessing Democracy, Bremen, Germany, June 20–22.
Lijphart, Arend. 1984. Democracies: Patterns of Majoritarian and Consensus Government in Twenty-One Countries. New Haven: Yale University Press.
———. 1999. Patterns of Democracy: Government Forms and Performance in Thirty-Six Countries. New Haven: Yale University Press.
Malik, Adeel. 2002. “State of the Art in Governance Indicators.” Human Development Report Office Occasional Paper 2002/07, United Nations Development Programme, New York.
Marshall, T. H. 1965. “Citizenship and Social Class.” In Class, Citizenship, and Social Development, 71–134. Garden City, NY: Doubleday.
Millennium Challenge Corporation. 2004. Report on the Criteria and Methodology for Determining the Eligibility of Candidate Countries for Millennium Challenge Account Assistance in FY 2004. Available at: http://www.mca.gov/countries/selection/index.shtml
Munck, Gerardo L. 1996. “Disaggregating Political Regime: Conceptual Issues in the Study of Democratization.” Working Paper 228, Helen Kellogg Institute for International Studies, University of Notre Dame, Notre Dame, IN.
———. 2001. “The Regime Question: Theory Building in Democracy Studies.” World Politics 54 (1): 119–44.
Munck, Gerardo L., and Jay Verkuilen. 2002. “Conceptualizing and Measuring Democracy: Evaluating Alternative Indices.” Comparative Political Studies 35 (1): 5–34.
———. 2003. “Bringing Measurement Back In: Methodological Foundations of the Electoral Democracy Index.” Paper presented at the annual meeting of the American Political Science Association, Philadelphia, August 28–31.
Nanda, Ved P., James R. Scarritt, and George W. Shepherd Jr., eds. 1981. Global Human Rights: Public Policies, Comparative Measures, and NGO Strategies. Boulder: Westview.
Narayan, Deepa, ed. 2002. Empowerment and Poverty Reduction: A Sourcebook. Washington, DC: World Bank.
30
NDI (National Democratic Institute for International Affairs). 1995. NDI Handbook: How Domestic Organizations Monitor Elections: An A to Z Guide. Washington, DC: National Democratic Institute for International Affairs.
NEPAD (New Partnership for Africa’s Development). 2003a. Objectives, Standards, Criteria and Indicators for the African Peer Review Mechanism (“The APRM”). Midrand, South Africa: NEPAD Secretariat.
———. 2003b. African Peer Review Mechanism: Organisation and Processes. Midrand, South Africa: NEPAD Secretariat.
O’Donnell, Guillermo. 2001. “Democracy, Law, and Comparative Politics.” Studies in Comparative International Development 36 (1): 7–36.
———. 2004. “On the Quality of Democracy and Its Links with Human Development and Human Rights.” In The Quality of Democracy: Theory and Practice, ed. Guillermo O’Donnell, Osvaldo Iazzetta, and Jorge Vargas Cullell. Notre Dame, IN: University of Notre Dame Press.
OECD/DAC (Organisation for Economic Co-operation and Development, Development Assistance Committee). 1998. DAC Source Book on Concepts and Approaches Linked to Gender Equality. Paris: OECD.
OSCE/ODIHR (Organisation for Security and Co-operation in Europe, Office for Democratic Institutions and Human Rights). 1997. The OSCE/ODIHR Election Observation Handbook. 2nd ed. Warsaw: ODIHR Election Unit.
Rokkan, Stein. 1970. Citizens, Elections, and Parties: Approaches to the Comparative Study of the Processes of Development. New York: David McKay.
Sano, Hans-Otto. 2000. “Development and Human Rights: The Necessary, but Partial Integration of Human Rights and Development.” Human Rights Quarterly 22 (3): 734–52.
Santiso, Carlos. 2001. “International Co-operation for Democracy and Good Governance: Moving Towards a Second Generation?” European Journal of Development Research 13 (1): 154–80.
———. 2002. “Education for Democratic Governance: Review of Learning Programmes.” Discussion Paper 62, United Nations Educational, Scientific, and Cultural Organization, Paris.
Sartori, Giovanni. 1976. Parties and Party Systems: A Framework for Analysis. Cambridge: Cambridge University Press.
———. 1987. The Theory of Democracy Revisited. 2 vols. Chatham, NJ: Chatham House Publishers.
Schumpeter, Joseph. 1942. Capitalism, Socialism, and Democracy. New York: Harper.
31
Sen, Amartya. 1999. Development as Freedom. New York: Random House.
Shugart, Matthew, and John M. Carey. 1992. Presidents and Assemblies: Constitutional Design and Electoral Dynamics. New York: Cambridge University Press.
Sisk, Timothy D., ed. 2001. Democracy at the Local Level: The International IDEA Handbook on Participation, Representation, Conflict Management and Governance. Stockholm: International IDEA.
Soós, Gábor. 2001. The Indicators of Local Democratic Governance Project: Concepts and Hypotheses. Budapest: Open Society Institute and Local Government and Public Service Reform Initiative.
Treisman, Daniel. 2002. “Defining and Measuring Decentralization: A Global Perspective.” Department of Political Science, University of California at Los Angeles. http://www.polisci.ucla.edu/faculty/treisman/
UN (United Nations). 2000. “International Human Rights Instruments. Twelfth Meeting of Chairpersons of the Human Rights Treaty Bodies, Geneva, 5–8 June 2000.” HRI/MC/2000/3. New York.
UNECE (United Nations Economic Commission for Europe). 2001. “Final Report. ECE/UNDP Task Force Meeting on a Regional Gender Web-site.” Statistical Division, UNECE, Geneva.
UNDP (United Nations Development Programme). 2002. Human Development Report 2002: Deepening Democracy in a Fragmented World. New York: Oxford University Press.
USAID (United States Agency for International Development). 1998. Handbook of Democracy and Governance Program Indicators. Technical Publication Series PN-ACC-390. Washington, DC: USAID Center for Democracy and Governance.
———. 1999. A Handbook on Fighting Corruption. Technical Publication Series PN-ACE-070. Washington, DC: USAID Center for Democracy and Governance.
———. 2000a. Conducting a DG Assessment: A Framework for Strategy Development. Technical Publication Series PN-ACH-305. Washington, DC: USAID Center for Democracy and Governance.
———. 2000b. Decentralization and Democratic Local Governance Programming Handbook. PN-ACH-300. Washington, DC: USAID Center for Democracy and Governance.
Verkuilen, Jay. 2002. Methodological Problems in Comparative and Cross-National Analysis: Applications of Fuzzy Set Theory. Ph.D. diss., University of Illinois at Urbana-Champaign.

32
Notes
In preparing this chapter, I have benefited from comments by Marianne Camerer, Deepa Narayan, Saika Uno, Jay Verkuilen, and two anonymous reviewers.
1 Recent efforts to survey the field of data on democratic governance include Foweraker and Krznaric (2000), Knack and Manning (2000), Malik (2002), Munck and Verkuilen (2002), Berg-Schlosser (2003), Besançon (2003), Landman and Häusermann (2003), and Lauth (2003).
2 For a discussion of governance-related conditionalities, see Kapur and Webb (2000), Kapur (2001), Santiso (2001), Crawford (2003).
3 For an expanded discussion of these and other tasks that must be addressed in developing a measuring instrument, see Munck and Verkuilen (2002).
4 Examples include Schumpeter (1942), Marshall (1965), Dahl (1971, 1989), and Sartori (1976, 1987).
5 On the problems with current uses of the terms “democracy,” “democratic consolidation,” and “democratic quality,” see Munck (2001, 123–30).
6 It may not be feasible to develop indicators that are uniquely linked with one concept or one attribute of a concept, a fact that complicates the effort at measurement. But in all instances the process of measurement should begin with clearly differentiated concepts (Bollen 2001, 7283, 7285).
7 O’Donnell (2001, 2004) has emphasized the value of this strategy. For an analysis of the concept of political regime, see Munck (1996). On the emerging consensus regarding the core aspects of a democratic regime, due in large part to the influence of Dahl, see Munck and Verkuilen (2002, 9–12).
8 On the links between democracy, human development, and human rights, see Sen (1999), Sano (2000), Fukuda-Parr and Kumar (2002), Langlois (2003), and O’Donnell (2004).
9 On democracy and democratic institutions, see Lijphart (1984, 1999), Inkeles (1991), Shugart and Carey (1992), Beetham (1994), Collier and Levitsky (1997), and Munck and Verkuilen (2002). On human rights, see Nanda, Scarritt, and Shepherd (1981), Jabine and Claude (1992), Cingranelli (1998), Green (2001), and Landman (2004).
10 Though most of the discussion has focused on the national level, there are also some noteworthy attempts to identify potential indicators at the subnational level. See USAID (2000b); Sisk (2001); Soós (2001); Treisman 2002.
11 Munck and Verkuilen (2003) present some thoughts on this issue.

33
12 For examples of different aggregation rules, see Munck and Verkuilen (2002, 10, 25–27).
13 A cause indicator is seen as influencing the concept being measured; an effect indicator is one in which the concept being measured is seen as driving or generating the indicators. Of course, a third possibility is that indicators are both a cause and an effect of the concept being measured.
14 The European Union (EU) formally stipulated its political conditions for accession in two separate texts: the “political criteria” established by the European Council in Copenhagen in 1993, and Article 49 of the Treaty on European Union of November 1993. These documents refer to the need to guarantee “democracy, the rule of law, human rights and respect for and protection of minorities,” but do not offer definitions of these broad concepts, let alone the indicators that would be used to measure these concepts and the level of fulfillment of each indicator. The political conditionality of the EU acquired substance in a series of annual reports published after 1997 evaluating the progress of countries that were candidates for accession to the EU. Yet it was done in a way that denied candidate countries a clear sense of the standards to be met and presented these countries with a moving target. On the APRM’s list of indicators and the process for evaluating countries it envisions, see NEPAD (2003a, 2003b).
15 A more complex question concerns the possibility that political actors that are being monitored may themselves take actions to alter the measures of interest. On data and strategic behavior, see Herrera and Kapur (2002).
16 One problem is that the MCA’s rule of aggregation consists of a relative rather than an absolute criterion. Specifically, countries are assessed in terms of the number of indicators on which they rank above the median in relation to a delimited universe of cases (Millennium Challenge Corporation 2004). Thus, during periods when more than half the world has authoritarian regimes—a pattern that has dominated world history until very recently—this rule would lead to the identification of authoritarian countries.
17 Even though the creators of data sets used by the MCA to identify countries that are to receive development aid have provided estimates of measurement error and emphasized their importance (Kaufmann, Kraay, and Mastruzzi 2003, 23–27), this program does not incorporate estimates of measurement error in its methodology and thus potentially misclassifies countries.
18 The list is a partial one, and includes neither regional data sets nor public opinion surveys such as the regional barometers (see www.globalbarometer.org). For a discussion of survey-based data, see Landman and Häusermann (2003). For a useful website that offers links to many of the data sets listed below and that is frequently updated, go to the World Bank Institute’s “Governance Data: Web-Interactive Inventory of Datasets and Empirical Tools,” at http://www.worldbank.org/wbi/governance/govdatasets/index.html.
The Golden Key and Rusty Padlock Awards Report - 2008 22 October 2008
Open Democracy Advice Centre Openness & Responsiveness Awards 2008
“Golden Key & Rusty Padlock Awards”
1. Introduction & Acknowledgement In 2008 the South African Human Rights Commission and the Open Democracy Advice Center delivered yet another successful round of the Golden Key Awards based on ODAC’s Access to Information Index. The Golden Key Awards have become a major event for the Access to Information community in South Africa, with a number of Deputy Information Officers (DIO) calling for the awards format for the changed in order to recognise best practice by a variety of public institutions as opposed to just one award. The idea proposed at the Deputy Information Officers Forum held in Midrand on 29 September 2008 was that there should be more awards for each type of public institution. It is not difficult to be persuaded by the argument put forward that it may appear unfair to compare implementation efforts of cash-flush metropolitan municipal councils with the efforts of small local municipal councils. Acting on its own also launched the first Rusty Padlock Awards to highlight non-compliance with the Promotion of Access to Information Act (“the Act”). The “Rusties” were a resounding media success. Four radio interviews (Kfm, Cape Talk, Radio Sonder Grense and SABC Afrikaans News) were given on the Rusty Padlock Awards and seven (7) major daily newspapers and a blog by Transparency International published articles on the Rusties. ODAC wishes to thank the Open Society Foundation (South Africa) whose grant has made it possible to conduct research needed to form basis for these awards and also to organise these awards. We also wish to thank the many deputy information officers who co-operated with the research team. Finally we wish to thank the leadership of the Open Democracy Advice Centre and the South African Human Rights Commission. This report was compiled by ODAC’s Mukelani Dimba and Juliette Fugier with research assistance by the SAHRC’s Nokwanda Molefe.
Page 1 of 27
The Golden Key and Rusty Padlock Awards Report - 2008 22 October 2008
2. Limitations in the study Administrative delays in provision of funds were a major limitation in the conduct of the study. In order to deliver the study the research partner, the Open Democracy Advice Centre, had to rely on existing human resources and find ways of optimising the usage of financial resources that were more than 60% less than what was needed to successfully deliver such a project. Instead of a research team consisting of a Project Manager, Senior Researcher and two Research Assistants, the research partner could not avail the services of a Project Manager and a Research Assistant. Secondly, the administrative delays also created a seven month gap in the rollout of the project. However, other than time pressures on the researchers, this delay did not necessarily had an averse impact on the quality of the study, in fact this delay resulted in an extra variable being added to the study as will be shown in the findings section on response times. Lastly, the administrative delays meant that there was not enough time available to convene a panel of judges to adjudicate on the winners as had been done previously. This meant that the winners would be decided purely on the numbers. Despite these limitations, the research partner is confident of the credibility of the results.
3. The Research Sample In 2008 it was decided that there would be no major amendments to the methodology and research protocol that was used to compile 2007 Access to Information Index. The only amendment made in the conduct of the study was the composition of the sample. The research project in 2007 became quite a formidable endeavour due the expansion of the sample from twenty-nine (29) units of study in 2006 to a hundred and ten (110) units of study in 2007. Due to constrains experienced as a result of administrative delays referred to in the “Limitations”, it was decided that the size of the sample had to be adjusted to meet available resources and time. Various studies the Open Democracy Advice Centre, The Public Service Commission and the South African Human Rights Commission had all shown that there were specific challenges at local government level in promoting responsiveness, openness, transparency and accountability in public service delivery and so it was decided that the sample should be heavily weighed towards local government structures so that the results of the study could be used to help this sphere of government do better in meeting the constitution’s aspiration for a open, transparent and participatory democracy.
Page 2 of 27
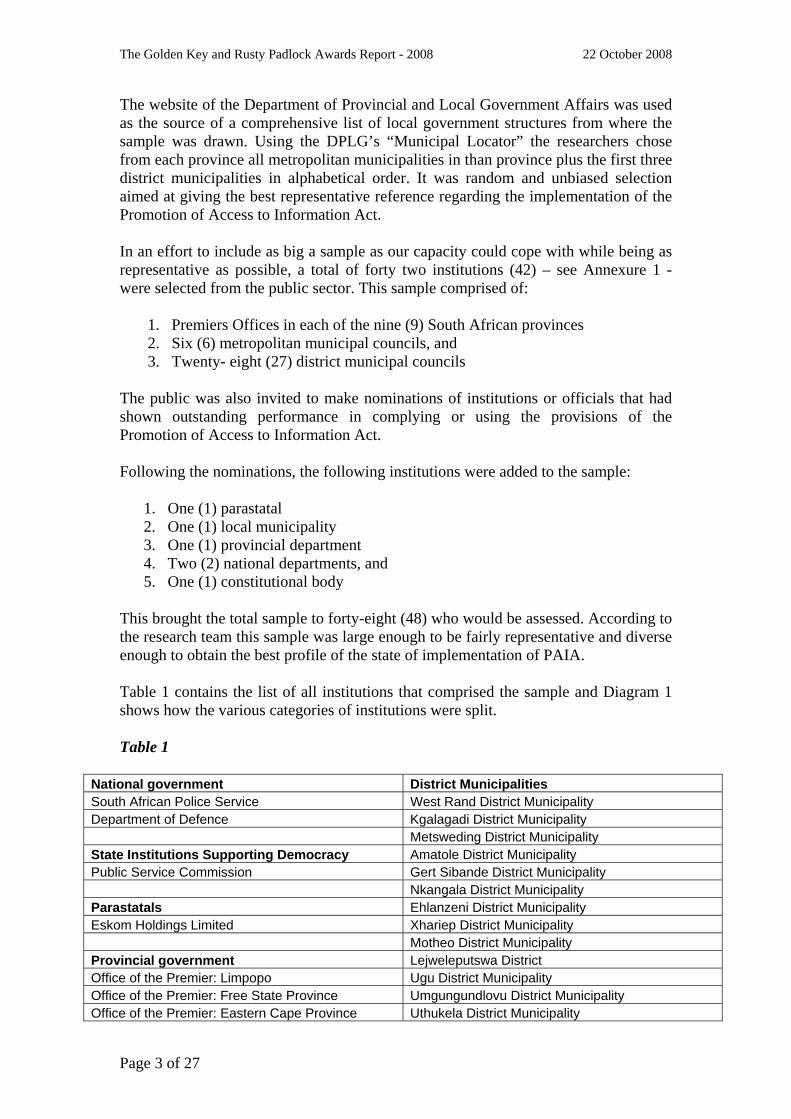
The Golden Key and Rusty Padlock Awards Report - 2008 22 October 2008
The website of the Department of Provincial and Local Government Affairs was used as the source of a comprehensive list of local government structures from where the sample was drawn. Using the DPLG’s “Municipal Locator” the researchers chose from each province all metropolitan municipalities in than province plus the first three district municipalities in alphabetical order. It was random and unbiased selection aimed at giving the best representative reference regarding the implementation of the Promotion of Access to Information Act. In an effort to include as big a sample as our capacity could cope with while being as representative as possible, a total of forty two institutions (42) – see Annexure 1 - were selected from the public sector. This sample comprised of:
1. Premiers Offices in each of the nine (9) South African provinces 2. Six (6) metropolitan municipal councils, and 3. Twenty- eight (27) district municipal councils
The public was also invited to make nominations of institutions or officials that had shown outstanding performance in complying or using the provisions of the Promotion of Access to Information Act. Following the nominations, the following institutions were added to the sample:
1. One (1) parastatal 2. One (1) local municipality 3. One (1) provincial department 4. Two (2) national departments, and 5. One (1) constitutional body
This brought the total sample to forty-eight (48) who would be assessed. According to the research team this sample was large enough to be fairly representative and diverse enough to obtain the best profile of the state of implementation of PAIA. Table 1 contains the list of all institutions that comprised the sample and Diagram 1 shows how the various categories of institutions were split. Table 1
National government District Municipalities South African Police Service West Rand District Municipality Department of Defence Kgalagadi District Municipality Metsweding District Municipality State Institutions Supporting Democracy Amatole District Municipality Public Service Commission Gert Sibande District Municipality Nkangala District Municipality Parastatals Ehlanzeni District Municipality Eskom Holdings Limited Xhariep District Municipality Motheo District Municipality Provincial government Lejweleputswa District Office of the Premier: Limpopo Ugu District Municipality Office of the Premier: Free State Province Umgungundlovu District Municipality Office of the Premier: Eastern Cape Province Uthukela District Municipality
Page 3 of 27

The Golden Key and Rusty Padlock Awards Report - 2008 22 October 2008
Office of the Premier: Gauteng Province Cacadu District Municipality Office of the Premier: KwaZulu Natal Province Chris Hani District Municipality Office of the Premier: Mpumalanga Sedibeng District Municipality Officer of the Premier: Northern Cape West Coast District Municipality Office of the Premier: North West Province Cape Winelands District Municipality Office of the Premier: WesternCape Province Overberg District Municipality Limpopo Department of Public Works Frances Baard District Municipality Namakwa District Municipality Metropolitan Municipalities Mopani District Municipality City of Johannesburg Metropolitan Municipality Vhembe District Municipality Ethekwini Metropolitan Municipality Capricorn District Municipality City of Cape Town Metropolitan Municipality Bojanala District Municipality Ekurhuleni Metropolitan Municipality Ngaka Modri-Molema District Municipality Nelson Mandela Bay Metropolitan Municipality Bophirima District Municipality City of Tshwane Metropolitan Municipality Local municipality Theewaterskloof Municipality
Diagram 1: The Sample
National Government Department
4%
Provincial Government
27%
Metros12%
District Municipalites
51%
Local Municipalities2%
Parastatals2%
Constitutional Body2%
National GovernmentDepartment
Provincial Government
Metros
District Municipalites
Local Municipalities
Parastatals
Constitutional Body
Diagram 2 shows the sample by sphere of government: Diagram 1: The Sample
National Government
Department
4%
Provincial Government
27%
Local Government
65%
Parastatals
2%
Constitutional Body
2%
National Government Department
Provincial Government
Local Government
Parastatals
Constitutional Body
Page 4 of 27
The Golden Key and Rusty Padlock Awards Report - 2008 22 October 2008
4. Award Categories As with the previous years, the Access to Information Index was used as the basis for deciding on the winners of the following Awards: a) The Openness & Responsiveness Award (Best Institution):
For a Public institution that promotes access to information and fully implemented PAIA through crafting of enabling policies and organizational procedures.
b) The Deputy Information of Officer of the Year Award: For a Deputy Information Officer that has performed well in execution of his/her duties in terms of PAIA
c) Requestor Award (Organisation/Individual) For citizen/organisation that has been a frequent user or promoter of PAIA
d) The Best Media Usage/Engagement with PAIA
For a journalist that has written the best story on the use of PAIA
5. The of Decision-making Process As indicated in the “Limitations” section of this report, administrative delays meant that there was not enough time available to the project coordinators to convene a panel of judges to adjudicate on the winners. Instead, it was decided that the winning institutions would be determined purely on the strength of their scores in terms of Access to Information Index. The scores themselves were based on the analysis of the documents received by the research team following their formal requests for information. In terms of the DIO and Requestor awards questionnaires were prepared and submitted to the nominees for completion. Upon receipt of the completed questionnaires answers given were assessed by assessors individually. Four assessors were in charge of the scoring, the responsibility being shared out equally between the South African Human Right Commission and the Open Democracy Advice Centre. The following section explains the methodology used in applying the Access to Information research tool that was used to compile the index. It describes the categories and indicators that were used to assess PAIA implementation and explains the scoring system that was applied. This is followed by a summary of the overall findings. This part of the report concludes with key issues, the challenges and lessons learned during the research experience.
Page 5 of 27
The Golden Key and Rusty Padlock Awards Report - 2008 22 October 2008
6. RESEARCH METHODOLOGY & PROTOCOL 6.1 Methodology
The first phase of the research process was making contact all selected institutions by phone in order to verify the accuracy of contact information sourced from the “Municipal Locator” and nomination forms. Once the contact details were verified formal requests for information in terms of PAIA were sent to the institutions. This was a slight change on the methodology used previously. Previously information was obtained by sending a questionnaire to the instutions. However, in 2008 the researchers felt that it was important to test how officials reacted to the key instrument of PAIA, namely; the PAIA Application Form. The form would also serve the purpose of ensuring that the request for information was officially responded to unlike in the past when officials simply chose not to respond to a questionnaire. The records requested were records that would reveal information about the status of implementation of PAIA in each government department. See Annexure 1 “Request For Access to Record” for a copy of the request wherein the following records were requested:
(STATUTORY COMPLIANCE) 1. PAIA manual according to Section 14 of PAIA 2. 2007 report submitted to the South African Human Rights Commission
according to Section 32 of PAIA (RECORDS MANAGEMENT) 3. Records Management Policy (detailing the records management and
archiving system) 4. Name of Records Manager
a) Job description and KPAs of Records Manager b) Description of Records Manager’s responsibilities in terms of
PAIA 5. Internal instruction/rules on generation of records 6. File plan according to the National Archives Act (INTERNAL MECHANISMS) 7. Internal Procedures/Guidelines/Policy Document or plan for
implementation of PAIA 8. Any document detailing the system used for recording and reporting on
both the number of requests received and how they were responded to. 9. Documentary evidence that frontline staff (e.g. receptionists and
building access personnel) been instructed or trained on how to handle requests and where to refer them
10. Any document describing internal procedures to be followed from the time a request is received up to the time a response is provided to the requestor within 30 days
Page 6 of 27
The Golden Key and Rusty Padlock Awards Report - 2008 22 October 2008
11. Any document describing provisions that have been made to assist the following disadvantaged requestors in getting access to information: a) the visually impaired, b) the illiterate, c) non-English speakers, d) people who don’t have access to IT-based communication tools,
such as the internet e) the unemployed, who therefore cannot afford to pay access fees in
terms of PAIA 12. A copy of any internal instruction/policy document that encourages
regular publication of records (RESOURCE ALLOCATION FOR IMPLEMENTATION OF PAIA) 13. Budget information for implementation of PAIA or an explanation of
how PAIA related activities are financed 14. A list of all members of staff who are tasked with handling requests for
information in terms of PAIA. (Include name, designation, responsibilities and PAIA-specific training)
15. Any document containing the following information on the PAIA unit, or equivalent structure, established to monitor and coordinate the implementation of the Act:
a) the structure, b) its membership c) how often it meets. d) Where it gets its authority from e) Reporting lines
16. A description of incentives in place to reward staff compliance with PAIA and sanctions that are applied for non-compliance? (e.g. monetary and other incentives/rewards, compulsory training, code of conduct etc.)
In early August 2008 the request forms with explanatory letters were sent to the forty eight institutions through fax and email. Using the PAIA form allowed us to check on the abilities of the institutions to respond within the legal timeframes (thirty days) and to ensure that we would receive a response. Once the forms and letters were submitted the researchers were required to phone all institutions to ensure that same had been received in order. In terms of PAIA the institutions were had to respond as soon as possible and within 30-days of receipt of the requests. During this period the researchers were required to do follow-ups fortnightly and keep a log of all communication and information received. After the 30-day data collection period, the research team analysed the data and, scored each institution, official and non governmental organisation nominated.
Page 7 of 27

The Golden Key and Rusty Padlock Awards Report - 2008 22 October 2008
6.2 Category Description and Indicators The categories and indicators contained below are part of a diagnostic tool developed by the Institute for Democracy in South Africa’s Right to Know Programme to set and measure implementation standards of access to information legislation. This was in response to the implementation challenge facing countries, like South Africa, which have legislated access to information. The four broad categories below applied uniformly to all institutions in the public sector. All public bodies were assessed on a set of 15 indicators, divided into four categories. Most indicators had sub-indicators with each sub-indicator being worth one point in the scoring process. A full list of indicators is provided in Annexure II. Category A: Roadmap
A roadmap describes the process for submitting a request for information; provides details of the office that handles requests and indicates what categories of information are held by an institution - identifying the records which can be disclosed and those which cannot be disclosed. It should include full contact details of the Information Officer and allow a requestor to submit requests by email, telephone, fax, post and in person. The roadmap should be published in the government directory and website. It should also be available at the institution’s front office. We asked for: the PAIA manual according to Section 14 of PAIA and the 2007 report submitted to the South African Human Rights Commission
according to Section 32 of PAIA
Category B: Records management
This refers to how records are generated, organised and stored. A system must be in place to ensure that all records held by the institution are well documented and organised so that records can be easily identified when a request for information is received. Guidelines on what constitutes a record and how institutional correspondence, discussions and material are documented. For example, we required the Records Management Policy the job description and KPAs of Records Manager or the description of Records Manager’s responsibilities in terms of PAIA
Category C: Internal Mechanisms
Internal mechanisms reveal how well an institution operationalises the provisions set out in PAIA to facilitate access to information. These mechanisms include procedures
Page 8 of 27

The Golden Key and Rusty Padlock Awards Report - 2008 22 October 2008
for documenting requests, processing requests on time, assisting requestors and voluntary publishing of records. In this section we asked for: the internal procedures, guidelines, policy document or plan for
implementation of PAIA any document detailing the system used for recording and reporting on both
the number of requests received and how they were responded to, any documentary evidence that frontline staff (e.g. receptionists and building
access personnel) been instructed or trained on how to handle requests and where to refer them, or
a copy of any internal instruction or policy document that encourages regular publication of records , among others
Category D: Resources This refers to the human and financial resources allocated to PAIA implementation as well as an institution’s commitment towards enabling its staff to promote the right to know. Here we asked for a budget information for implementation of PAIA or an explanation of how
PAIA related activities are financed a list of all members of staff who are tasked with handling requests for
information in terms of PAIA or any document containing the following information on the PAIA unit, or
equivalent structure, established to monitor and coordinate the implementation of the Act.
a description of incentives in place to reward staff compliance with PAIA and sanctions that are applied for non-compliance? (e.g. monetary and other incentives/rewards, compulsory training, code of conduct etc.)
6.3 Scoring Each indicator score was determined by its number of sub-indicators. Each sub-indicator was worth one point. For example, an indicator with three sub-indicators will had a maximum score of 3 and an indicator with no sub-indicator had a maximum score of 1. The distribution of points across both sectors is summarised below:
Category Points A 6 B 6 C 24 D 11 Total 47
Page 9 of 27

The Golden Key and Rusty Padlock Awards Report - 2008 22 October 2008
6.4 Data sources
The research was primarily desk-based. For the data we depended on records institutions sent us following our requests. The data was then be studied, assessed and analysed. In instances where there was lack of clarity on the documentation provided the institution(s) would be contacted for further detail.
7. RESULTS FOR PUBLIC INSTITUTIONS 7.1 Overall Results Table 2: Summary of the results of the 2008 Access to Information Index
GOLDEN KEY AWARDS 2008: Overall Scores and Rankings
Institution Road Map
Record Management
Internal Mechanisms Resources Total Percentage Rank
City of Johannesburg Metropolitan Municipality 5 5 21 9 40 85% 1Eskom Holdings Limited 5 3 17 11 36 77% 2South African Police Service 5 5 16 9 35 74% 3Limpopo Department of Public Works 4 6 15 9 34 72% 4Department of Defence 3 4 16 9 32 68% 5Theewaterskloof Municipality 4 6 17 3 30 64% 6Office of the Premier: Limpopo 5 6 12 3 26 55% 7Ethekwini Metropolitan Municipality 5 3 12 5 25 53% 8City of Cape Town Metropolitan Muncipality 3 4 10 7 24 51% 9Ekurhuleni Metropolitan Municipality 4 6 10 3 23 49% 10Office of the Premier: Free 4 3 13 3 23 49% 11
Page 10 of 27

The Golden Key and Rusty Padlock Awards Report - 2008 22 October 2008
State Province
Public Service Commission 4 4 9 4 21 45% 12West Rand District Municipality 2 5 12 1 20 43% 13Office of the Premier: Eastern Cape Province 5 4 3 7 19 40% 14Nelson Mandela Bay Metropolitan Muncipality 4 5 7 1 17 36% 15Kgalagadi District Municipality 4 6 3 0 13 28% 16Metsweding District Municipality 5 4 0 0 9 19% 17Amatole District Municipality 2 5 0 2 9 19% 18West Coast District Municipality 0 3 0 0 3 6% 19Gert Sibande District Municipality
Information not available
Information not available
Information not available
Information not available
Information not available 0% 0
Nkangala District Municipality
Information not available
Information not available
Information not available
Information not available
Information not available 0% 0
Ehlanzeni District Municiplaity
Information not available
Information not available
Information not available
Information not available
Information not available 0% 0
Xhariep District Municipality
Information not available
Information not available
Information not available
Information not available
Information not available 0% 0
Motheo District Municipality
Information not available
Information not available
Information not available
Information not available
Information not available 0% 0
Lejweleputswa District
Information not available
Information not available
Information not available
Information not available
Information not available 0% 0
Ugu District Municipality
Information not available
Information not available
Information not available
Information not available
Information not available 0% 0
Umgungundlovu District Municipality
Information not available
Information not available
Information not available
Information not available
Information not available 0% 0
Uthukela District Municipality
Information not available
Information not available
Information not available
Information not available
Information not available 0% 0
Cacadu District Municipality
Information not available
Information not available
Information not available
Information not available
Information not available 0% 0
Page 11 of 27
The Golden Key and Rusty Padlock Awards Report - 2008 22 October 2008
Chris Hani District Municipality
Information not available
Information not available
Information not available
Information not available
Information not available 0% 0
City of Tshwane Metropolitan Municipality
Information not available
Information not available
Information not available
Information not available
Information not available 0% 0
Sedibeng District Municipality
Information not available
Information not available
Information not available
Information not available
Information not available 0% 0
Cape Winelands District Municipality
Information not available
Information not available
Information not available
Information not available
Information not available 0% 0
Overberg District Municipality
Information not available
Information not available
Information not available
Information not available
Information not available 0% 0
Frances Baard District Municipality
Information not available
Information not available
Information not available
Information not available
Information not available 0% 0
Namakwa District Municipality
Information not available
Information not available
Information not available
Information not available
Information not available 0% 0
Mopani District Muncipality
Information not available
Information not available
Information not available
Information not available
Information not available 0% 0
Vhembe District Municipality
Information not available
Information not available
Information not available
Information not available
Information not available 0% 0
Capricorn District Municipality
Information not available
Information not available
Information not available
Information not available
Information not available 0% 0
Bojanala District Municipality
Information not available
Information not available
Information not available
Information not available
Information not available 0% 0
Ngaka Modri-Molema District Municipality
Information not available
Information not available
Information not available
Information not available
Information not available 0% 0
Bophirima District Municipality
Information not available
Information not available
Information not available
Information not available
Information not available 0% 0
Office of the Premier: Gauteng Province
Information not available
Information not available
Information not available
Information not available
Information not available 0% 0
Office of the Premier: KwaZulu Natal Province
Information not available
Information not available
Information not available
Information not available
Information not available 0% 0
Office of the Premier: Mpumalanga
Information not available
Information not available
Information not available
Information not available
Information not available 0% 0
Officer of the Information not available
Information not available
Information not available
Information not available
Information not 0% 0
Page 12 of 27
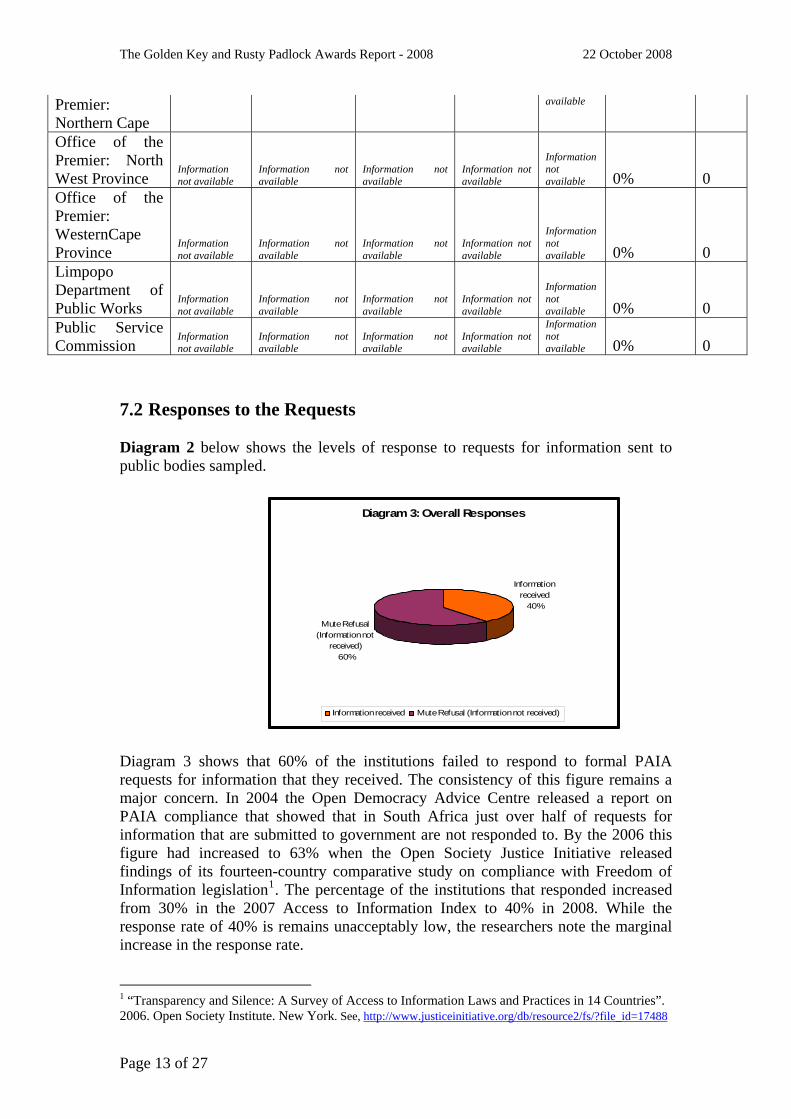
The Golden Key and Rusty Padlock Awards Report - 2008 22 October 2008
Premier: Northern Cape
available
Office of the Premier: North West Province
Information not available
Information not available
Information not available
Information not available
Information not available 0% 0
Office of the Premier: WesternCape Province
Information not available
Information not available
Information not available
Information not available
Information not available 0% 0
Limpopo Department of Public Works
Information not available
Information not available
Information not available
Information not available
Information not available 0% 0
Public Service Commission
Information not available
Information not available
Information not available
Information not available
Information not available 0% 0
7.2 Responses to the Requests Diagram 2 below shows the levels of response to requests for information sent to public bodies sampled.
Diagram 3: Overall Responses
Information received
40%
Mute Refusal (Information not
received)60%
Information received Mute Refusal (Information not received)
Diagram 3 shows that 60% of the institutions failed to respond to formal PAIA requests for information that they received. The consistency of this figure remains a major concern. In 2004 the Open Democracy Advice Centre released a report on PAIA compliance that showed that in South Africa just over half of requests for information that are submitted to government are not responded to. By the 2006 this figure had increased to 63% when the Open Society Justice Initiative released findings of its fourteen-country comparative study on compliance with Freedom of Information legislation1. The percentage of the institutions that responded increased from 30% in the 2007 Access to Information Index to 40% in 2008. While the response rate of 40% is remains unacceptably low, the researchers note the marginal increase in the response rate. 1 “Transparency and Silence: A Survey of Access to Information Laws and Practices in 14 Countries”. 2006. Open Society Institute. New York. See, http://www.justiceinitiative.org/db/resource2/fs/?file_id=17488
Page 13 of 27
The Golden Key and Rusty Padlock Awards Report - 2008 22 October 2008
While this is a slight improvement in responsiveness the response rate that is below even 50% remains a cause for worry, especially since the lack of responsiveness and access to information has been attributed as one of the causes for public service delivery protests of the last two years. Studies by various institutions including the Public Service Commission and the University of the Free State (UFS) have clearly shown that lack of access to information and proper communication between local government structures and local communities are “arguably the single most important reason for the protests”2. The UFS study continues to state that “public frustration with poor service” creates a situation where people are pushed into seeking other “responsive communication channels to vent their grievances” through protests action and alternative leadership and political structures. In a similar study by the UFS’s Centre for Developmental Support one of the respondents is reported as saying: “The unrest could have been prevented by improving communication and information dissemination between the community, ward committee, ward councillor and the council.”3 In its various State of the Public Service Reports (SOPS reports) the Public Service Commission (PSC) consistently highlights the constitutional principles4 that “public administration must be accountable” and that “transparency must be fostered by providing the public with timely, accessible and accurate information”. According to the Public Service Commission it is not enough for public institutions to account for performance but there also should be accountability for how this performance has taken place. Allowing the public to have access to information on how the public administration is functioning and delivering public services would lead to improved transparency. It would also promote public knowledge of the state of service delivery and, therefore, an improvement of service delivery. In the 2007 report on the Access to Information Index the researchers expressed concern about the lack of responsiveness and dissemination of service delivery information at local government level, especially with regards to district municipalities. Service delivery protests have occurred not only because of discontent with situation citizens found themselves in, but also because people felt powerless to influence the situation because they didn’t know what was being done by those in authority to improve their situation and some felt that participation in these processes was not always fair and open to all. This continues to be a source of major concern. This issue is also covered in the PSC’s 2008 SOPS report wherein the PSC notes that: “Recently, some citizens have found alternative ways to draw attention to the need for public participation through service delivery protests and rising activism. This development should come as a signal to government that effective communication and public participation must remain a fundamental priority”5.
2 Botes, L. Lenka, M. Marais, L. Matebesi, Z. Sigenu, K. The Cauldron of Local Protests: Reasons, Impacts and Lessons Learned. [Undated] Centre for Development Support 3 Lenka, M. Marais, L. Matebesi, Z. [Undated] THE NEW STRUGGLE: SERVICE DELIVERY-RELATED UNREST IN SOUTH AFRICA [Undated] Centre for Development Support 4 See Section 195 of the Constitution of the Republic of South Africa, Act No. 108 of 1996 5 State of the Public Service Report 2008, Public Service Commission.
Page 14 of 27

The Golden Key and Rusty Padlock Awards Report - 2008 22 October 2008
This warning by the PSC will have to be heeded by district municipalities who, in terms of the 2008 Access to Information Index, constituted three quarters (or 75%) of all institutions that failed to respond for formal requests for information. Diagram 3 shows the results of the requests that went to district municipalities.
27 District Municipalities
15%
85%
Information Received
Mute Refusa/Noresponse
As Diagram 3 shows, only 15% of the district municipalities responded to the requests for information. This rate of responsiveness is extremely low and may have adverse effects on the relationship between local government structures and the people there are meant to serve as argued above. Another area of concern is the premiers’ offices. It is widely accepted and constitutionally provided that the Premier is the source and seat and leadership in each of the nine provinces. According to findings of the Access to Information Index these institutions are not leading by example where responsiveness and promotion of access to information are concerned. In terms of the access to information index only a third of the premiers’ offices nationwide responded to the formal requests for information. Diagram 4 below shows the results of the requests for provincial departments. Diagram 4
Provincial Government
40%
60%
Information received
Mute Refusa/Noresponse
Page 15 of 27

The Golden Key and Rusty Padlock Awards Report - 2008 22 October 2008
7.3 Laggards While 60% of institutions failed to respond to requests for information, it is important to note that a quarter of these institutions have done so for two years in a row. These institutions are: Table 2: Real laggards
Institution Road Map
Record Management
Internal Mechanisms Resources Total Percentage Rank
Ehlanzeni District Municiplaity 0 0 0 0 0 0% 0 Motheo District Municipality 0 0 0 0 0 0% 0 Umgungundlovu District Municipality 0 0 0 0 0 0% 0 Cacadu District Municipality 0 0 0 0 0 0% 0 Frances Baard District Municipality 0 0 0 0 0 0% 0 Capricorn District Municipality 0 0 0 0 0 0% 0 Bophirima District Municipality 0 0 0 0 0 0% 0 Office of the Premier: Mpumalanga 0 0 0 0 0 0% 0 Officer of the Premier: Northern Cape 0 0 0 0 0 0% 0 Office of the Premier: North West Province 0 0 0 0 0 0% 0 Office of the Premier: Western Cape Province 0 0 0 0 0 0% 0
Table 2 is a list of institutions who, among many in the public and private service, continue to honour the Promotion of Access to Information Act only in breach. This shows that for these are institutions that have demonstrated determined refusal to implement the law. As a result of their unresponsiveness and chronic non-compliance with the provisions of the Act, these institutions have in fact places access to information beyond the reach of ordinary citizens, a point so emphatically raised in the report of parliament’s Ad Hoc Committee on Review of State Institutions Supporting Democracy. In their report, the Committee noted that lack of effective implementation of the law places its benefits well beyond the reach of ordinary South Africans. In a number instances the researchers experienced reception not in accordance with the key principles of Batho Pele (People First), governments blue print for service delivery and government-citizen interactions. The principle of courteous treatment of members of the public who approach officials for information or services was repeatedly violated by frontline officers such as secretaries, receptionists and Personal Assistants. The institutions listed above were all in the running for the 2008 Inaugural Rusty Padlock Award which was given to the Bophirima District Municipality following a draw of the names of all eleven.
Page 16 of 27

The Golden Key and Rusty Padlock Awards Report - 2008 22 October 2008
7.4 Best Practice Despite the evidence of continued non-compliance with PAIA as stated above it must be noted that the study for the compilation of the Access to Information Index discovered stellar examples of best practice across the entire spectrum of the public service. The tables below show the results according to category of public institution: Table 3: National Departments
Institution Road Map
Record Management
Internal Mechanisms Resources Total Percentage Rank
South African Police Service 5 5 16 9 35 74% 1 Department of Defence 3 4 16 9 32 68% 2
The results for the two national government departments are not surprising given that both the South African Police Service (SAPS) and the Department of Defense (DOD) have consistently been top performers in terms of implementation of PAIA. The DOD is a previous winner of the Best Institution award (2006) and ranked first for a South African institution in terms of the OSJI-ODAC study on Freedom of Information monitoring. The SAPS’s National Deputy Information Officer on the other hand has won the award for Deputy Information Officer of the Year award since the inception of the Golden Key Awards in 2006.
Page 17 of 27

The Golden Key and Rusty Padlock Awards Report - 2008 22 October 2008
Both these institutions have consistently set high standards for PAIA compliance and implementation, despite the fact that ordinarily these are two institutions that would have been expected to be less than keen on the Act as result of their safety and security mandate which tends at times is incorrectly seen as not being promoted by openness and transparency. Other institutions should be encouraged from learning from the SAPS and DOD, especially the SAPS’s procedural guidelines for dealing with requests and the DOD’s internal organization of structures to handle requests for information. Table 4: Provincial Departments
Institution Road Map
Record Management
Internal Mechanisms Resources Total Percentage Rank
1 Limpopo Department of Public Works 4 6 15 9 34 72% 1
2 Office of the Premier: Limpopo 5 6 12 3 26 55% 2
3 Office of the Premier: Free State Province 4 3 13 3 23 49% 3
4
Office of the Premier: Eastern Cape Province 5 4 0 7 16 34% 4
5 Office of the Premier: Gauteng Province 0 0 0 0 0 0% 0
6
Office of the Premier: KwaZulu Natal Province 0 0 0 0 0 0% 0
7 Office of the Premier: Mpumalanga 0 0 0 0 0 0% 0
8 Officer of the Premier: Northern Cape 0 0 0 0 0 0% 0
9 Office of the Premier: North West Province 0 0 0 0 0 0% 0
10
Office of the Premier: Western Cape Province 0 0 0 0 0 0% 0
The province of Limpopo continues to provide good examples of implementation of PAIA. In the 2007 Access to Information Index the Limpopo Department of Health and Social Development received special recognition for their work in PAIA implementation and compliance by a provincial department. This year (2008) the Department of Public Works in Limpopo received the same accolade. The department is only one of a few provincial or local government institutions that have followed the example of the DOD in setting up an internal task team comprising of senior departmental officials who decide on requests and appeals and monitors compliance with PAIA on behalf of the Department’s Information Officer and the Member of the Executive Council responsible for the department. The province has also distinguished itself for developing what is a de facto Provincial Deputy Information Officers’ Forum. A structure currently exists where all Deputy Information Officers in the province gather to exchange insights on and experiences of dealing and complying with the Act. This is a highly commendable development and other provinces are encouraged to consider similar activities because the exemplary performance of the provinces’ departments is testament to the efficacy of such a formation.
Page 18 of 27

The Golden Key and Rusty Padlock Awards Report - 2008 22 October 2008
Table 5: Metropolitan Municipal Councils
Institution Road Map
Record Management
Internal Mechanisms Resources Total Percentage Rank
1
City of Johannesburg Metropolitan Municipality 5 5 21 9 40 85% 1
2 Ethekwini Metropolitan Municipality 5 3 12 5 25 53% 2
3
City of Cape Town Metropolitan Muncipality 3 4 10 7 24 51% 3
4
Ekurhuleni Metropolitan Municipality 4 6 10 3 23 49% 4
5
Nelson Mandela Bay Metropolitan Muncipality 4 5 7 1 17 36% 5
6
City of Tshwane Metropolitan Municipality 0 0 0 0 0 0% 0
Metropolitan municipal councils in 2008 were by far the best performing category, with the City of Johannesburg distinguishing itself as the Best Institution with a record score of 85%! It must be noted that in terms of the 2007 Access to Information Index Joburg Metro scored a zero as a result of their non-response in that year. This shows how important it is for institutions to respond to requests for information. The sterling work done by the Joburg Metro in setting up mechanisms for receiving, processing and monitoring requests for information sets a high standard for PAIA compliance. The IT system that has been developed by the Metro shows the extent to which the Metro has invested resources in implementing PAIA.
The City of Johannesburg was the winner of the Golden Key Award for Best Institution during the 2008 Golden Key Awards held on 29 September 2008.
Table 6: Local Municipal Councils
Institution Road Map
Record Management
Internal Mechanisms Resources Total Percentage Rank
1 Theewaterskloof Municipality 4 6 17 3 30 64% 1
The Theewaterskloof Municipality made an impressive showing in its first entry into the Access to Information Index. It scored an impressive rank of sixth place overall and second place – after Joburg Metro – among local government structure. This performance is commendable considering the fact that this is a small rural local municipality falling within the Overberg District Municipality in the Western Cape. The performance of the Theewaterskloof Municipality proves that even with limited
Page 19 of 27
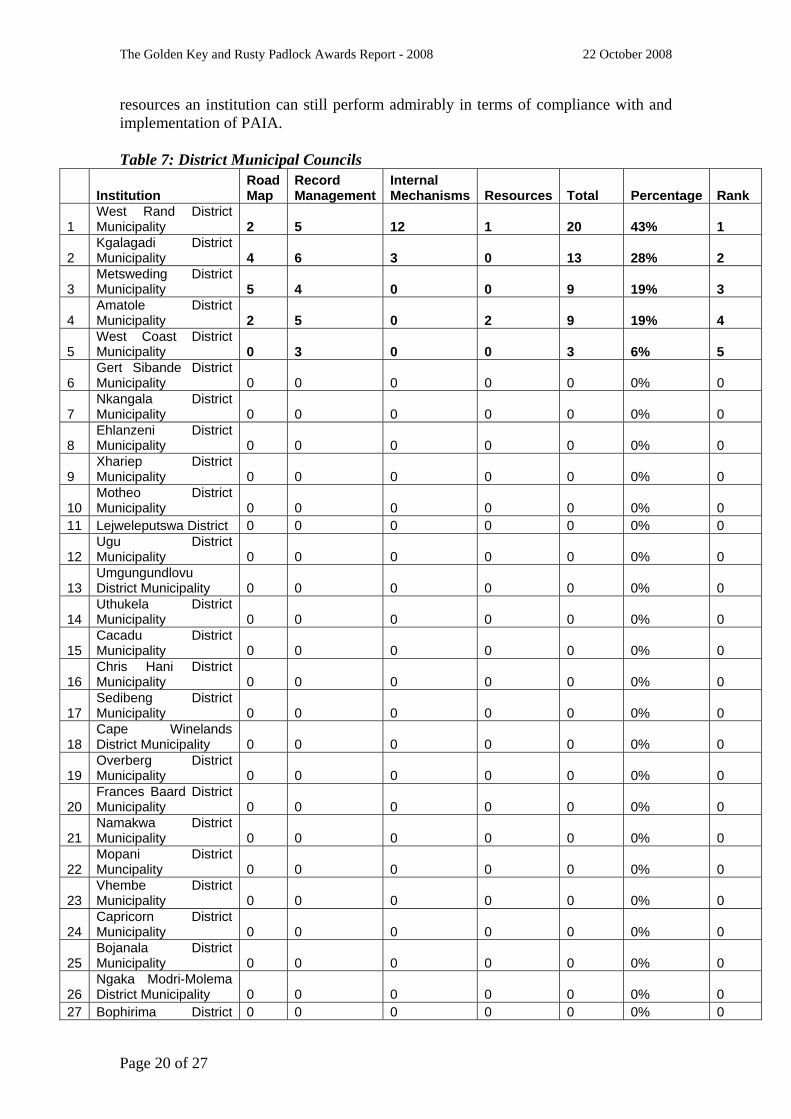
The Golden Key and Rusty Padlock Awards Report - 2008 22 October 2008
resources an institution can still perform admirably in terms of compliance with and implementation of PAIA. Table 7: District Municipal Councils
Institution Road Map
Record Management
Internal Mechanisms Resources Total Percentage Rank
1 West Rand District Municipality 2 5 12 1 20 43% 1
2 Kgalagadi District Municipality 4 6 3 0 13 28% 2
3 Metsweding District Municipality 5 4 0 0 9 19% 3
4 Amatole District Municipality 2 5 0 2 9 19% 4
5 West Coast District Municipality 0 3 0 0 3 6% 5
6 Gert Sibande District Municipality 0 0 0 0 0 0% 0
7 Nkangala District Municipality 0 0 0 0 0 0% 0
8 Ehlanzeni District Municipality 0 0 0 0 0 0% 0
9 Xhariep District Municipality 0 0 0 0 0 0% 0
10 Motheo District Municipality 0 0 0 0 0 0% 0
11 Lejweleputswa District 0 0 0 0 0 0% 0
12 Ugu District Municipality 0 0 0 0 0 0% 0
13 Umgungundlovu District Municipality 0 0 0 0 0 0% 0
14 Uthukela District Municipality 0 0 0 0 0 0% 0
15 Cacadu District Municipality 0 0 0 0 0 0% 0
16 Chris Hani District Municipality 0 0 0 0 0 0% 0
17 Sedibeng District Municipality 0 0 0 0 0 0% 0
18 Cape Winelands District Municipality 0 0 0 0 0 0% 0
19 Overberg District Municipality 0 0 0 0 0 0% 0
20 Frances Baard District Municipality 0 0 0 0 0 0% 0
21 Namakwa District Municipality 0 0 0 0 0 0% 0
22 Mopani District Muncipality 0 0 0 0 0 0% 0
23 Vhembe District Municipality 0 0 0 0 0 0% 0
24 Capricorn District Municipality 0 0 0 0 0 0% 0
25 Bojanala District Municipality 0 0 0 0 0 0% 0
26 Ngaka Modri-Molema District Municipality 0 0 0 0 0 0% 0
27 Bophirima District 0 0 0 0 0 0% 0
Page 20 of 27
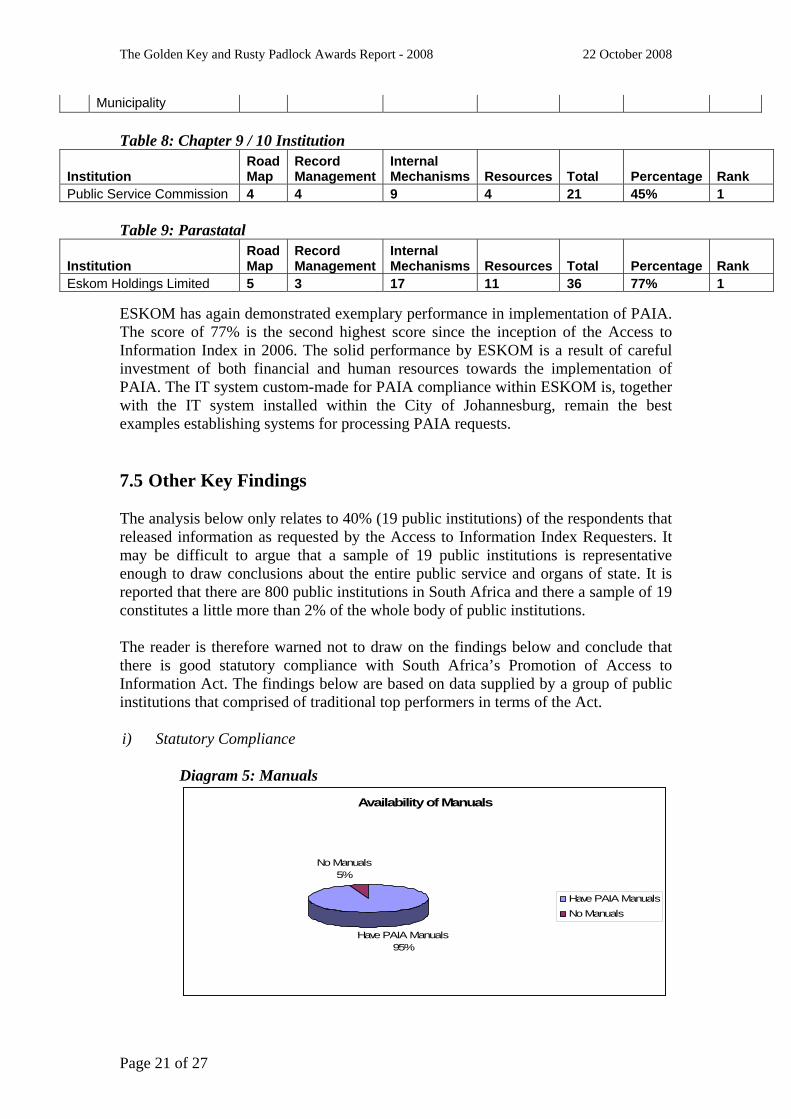
The Golden Key and Rusty Padlock Awards Report - 2008 22 October 2008
Municipality
Table 8: Chapter 9 / 10 Institution
Institution Road Map
Record Management
Internal Mechanisms Resources Total Percentage Rank
Public Service Commission 4 4 9 4 21 45% 1 Table 9: Parastatal
Institution Road Map
Record Management
Internal Mechanisms Resources Total Percentage Rank
Eskom Holdings Limited 5 3 17 11 36 77% 1
ESKOM has again demonstrated exemplary performance in implementation of PAIA. The score of 77% is the second highest score since the inception of the Access to Information Index in 2006. The solid performance by ESKOM is a result of careful investment of both financial and human resources towards the implementation of PAIA. The IT system custom-made for PAIA compliance within ESKOM is, together with the IT system installed within the City of Johannesburg, remain the best examples establishing systems for processing PAIA requests. 7.5 Other Key Findings The analysis below only relates to 40% (19 public institutions) of the respondents that released information as requested by the Access to Information Index Requesters. It may be difficult to argue that a sample of 19 public institutions is representative enough to draw conclusions about the entire public service and organs of state. It is reported that there are 800 public institutions in South Africa and there a sample of 19 constitutes a little more than 2% of the whole body of public institutions. The reader is therefore warned not to draw on the findings below and conclude that there is good statutory compliance with South Africa’s Promotion of Access to Information Act. The findings below are based on data supplied by a group of public institutions that comprised of traditional top performers in terms of the Act. i) Statutory Compliance
Diagram 5: Manuals
Availability of Manuals
Have PAIA Manuals95%
No Manuals5%
Have PAIA Manuals
No Manuals
Page 21 of 27

The Golden Key and Rusty Padlock Awards Report - 2008 22 October 2008
It is evident from the diagram above that in terms of the 2008 Access to Information Index most institutions who responded to requests for information had compiled section 14 manuals and submitted section 32 reports (see diagram 6 below). However some manuals were inaccurate, such as one of the manuals from a district municipality that states that “Requestor must identify the right they want to protect by requesting information from the municipality” and there was instance where one district municipality sent the researchers a copy of the Act in response to a request for a PAIA Manual. This denotes a need for more training at district municipality level. Indeed two of the district municipalities that failed to provide information as requested (The Vhembe District Municipality in Limpopo and the Chris Hani District Municipality in the Eastern Cape) contacted the research team to request training on PAIA.
Diagram 6: Section 32 Manuals
Submission of Section 32 Manuals
Have Submitted Section 32 Reports
79%
Have Not Submitted Section 32 Reports
21%Have Submitted Section 32Reports
Have Not Submitted Section 32Reports
ii) Disclosure or Non-Disclosure
Diagram 7: Granting or Refusal of Requests
Disclosure or Non-Disclosure
Overall: Requests Granted
98%
Overall: Requests Denied
2%
Overall: Requests Granted
Overall: Requests Denied
Page 22 of 27
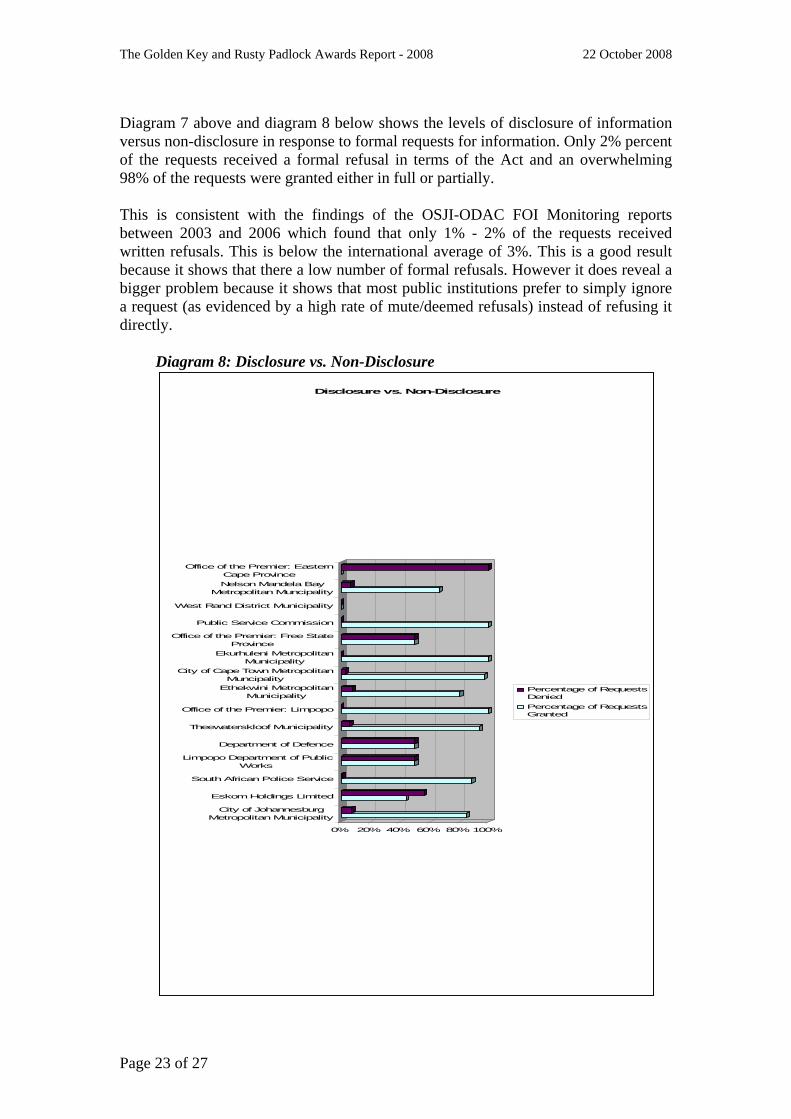
The Golden Key and Rusty Padlock Awards Report - 2008 22 October 2008
Diagram 7 above and diagram 8 below shows the levels of disclosure of information versus non-disclosure in response to formal requests for information. Only 2% percent of the requests received a formal refusal in terms of the Act and an overwhelming 98% of the requests were granted either in full or partially. This is consistent with the findings of the OSJI-ODAC FOI Monitoring reports between 2003 and 2006 which found that only 1% - 2% of the requests received written refusals. This is below the international average of 3%. This is a good result because it shows that there a low number of formal refusals. However it does reveal a bigger problem because it shows that most public institutions prefer to simply ignore a request (as evidenced by a high rate of mute/deemed refusals) instead of refusing it directly.
Diagram 8: Disclosure vs. Non-Disclosure
0% 20% 40% 60% 80% 100%
City of JohannesburgMetropolitan Municipality
Eskom Holdings Limited
South African Police Service
Limpopo Department of PublicWorks
Department of Defence
Theewaterskloof Municipality
Office of the Premier: Limpopo
Ethekwini MetropolitanMunicipality
City of Cape Town MetropolitanMuncipality
Ekurhuleni MetropolitanMunicipality
Office of the Premier: Free StateProvince
Public Service Commission
West Rand District Municipality
Nelson Mandela BayMetropolitan Muncipality
Office of the Premier: EasternCape Province
Disclosure vs. Non-Disclosure
Percentage of RequestsDenied
Percentage of RequestsGranted
Page 23 of 27

The Golden Key and Rusty Padlock Awards Report - 2008 22 October 2008
iii) Records Management
There is generally good overall compliance with archives legislation. In a number of cases, such as in the Theewaterskloof Municipality, Limpopo Department Public Works, DOD, PSC, Premiers’ Office in Limpopo, Premiers’ Office in Free State, City of Cape Town, Ekurhuleni, Amatole District Municipality PAIA responsibilities have been included in performance agreements and KPAs of Records Managers.
iv) Internal Mechanisms
Related to point (i) above it appears that public institutions that responded have done fairly well in meeting their statutory obligations of PAIA such as compiling PAIA manuals and Section 32 report. However providing the bare minimum as provided for in the law is not enough. Institutions have to develop internal soft laws, policies and procedures that will create an enabling environment for better compliance with and implementation of the Act. Of the institutions sampled for the 2008 Access to Information Index there is some evidence to show that some public institutions have sought to go beyond hat is provided for in the law. However not enough of this is happening in the broader public service. Not enough internal soft laws and voluntary disclosure mechanisms are being developed. These soft laws are important in creating a sustained internal culture that is conducive to openness. This has certainly been the case in the DOD. The City of Cape Town presents some important lessons in this regard. Though the City of Cape Town has over a period of three years been among the top performers in terms of the Access to Information Index its performance and ranking has been adversely affected by the change of administrations. The lack of formal mechanisms for PAIA compliance within the City of Cape Town has meant performance depends on each administration’s approach to dealing with requests for information. The decentralised system under the Wallace Mgoqi administration6 seems to have presented a better procedure for the requester than the centralised system adopted by the Achmat Ibrahim administration7. Formal internal mechanisms such PAIA coordinating committees and soft laws on PAIA within the City could have ensured that performance in terms of PAIA remained consistent regardless of change in administration of the City. These arguments also stand for other top performers such the Ekurhuleni Metropolitan Council and the SAPS who perform well but do not have strong internal mechanisms.
6 Dr. Wallace Mgoqi was the City Manager for the City of Cape Town between 2003 and 2006 under the African National Congress controlled City of Cape Town Metropolitan Council. 7 Mr. Achmat Ibrahim is the current City Manager for the City of Cape Town under the Democratic Alliance-controlled City of Cape Town Metropolitan Council. He succeeded Dr. Mgoqi in 2006.
Page 24 of 27

The Golden Key and Rusty Padlock Awards Report - 2008 22 October 2008
v) Resources
Overall, not enough financial resources are allocated to PAIA compliance PAIA responsibilities continue to be included within the Records Management, Legal Services or Administration budgets. Allocation of financial and human resources to PAIA implementation certainly makes the work of the Deputy Information Officer(s) much easier, it is also the clearest expression and demonstration of the leadership’s commitment and will to promoting the sprit and letter of the law and the constitutional provision for the right of access to information and transparency and openness in public administration.
7.6 Special Recognition Certificates and Trophies Certificates and trophies were given in special recognition of the following:
a) ESKOM – Best Practice by a Parastal b) Limpopo Department of Public Works – Best Practice by a Provincial
Department c) Limpopo Premier’s Office – Best Practice by a Provincial Departments d) Theewaterskloof Municipality – Best Practice by a Local Municipality
8. Other Awards 8.1 Deputy Information Officer (DIO) of the Year Award 2008 2008 saw a marked interest in this category of the Awards with more DIOs being nominated than in the two previous years. A total of six DIOs were nominated. As in the previous years, performance of the nominees was assessed according to the following areas were investigated: The interaction the DIO has with requestors The availability of internal PAIA guidelines to members of the public Transfer of requests to other departments where necessary Support provided to other DIOs within the institution Ability to engage with broader issues that influence implementation of PAIA
After reviewing all supporting documentation relating to the nominations, a panel of assessors gave the highest score to Senior Superintendent Amelda Crooks from the South African Police Service and therefore she became the winner of the DIO of the Year Award which includes a cash prize of R10 000. This award was given for outstanding performance in terms of the areas investigated above.
Page 25 of 27
The Golden Key and Rusty Padlock Awards Report - 2008 22 October 2008
8.2 Requestor Award (Organization/Individual) Three nominees were received for this Award. The nominees were for: South African History Archive (SAHA) Biowatch South Africa Fathers For Justice
The assessment panel scored both SAHA and Biowatch equally. SAHA was cited for their work in assisting individuals and communities in using the Act and Biowatch was cited for their endeavours aimed at ensuring and promoting public participation in the issue of public policy on Genetically Modified Organisms by using the Act. The following areas were considered in assessment: Efforts done by the organization to fight secrecy in the structures of
government, business and civil society. The presence of the public interest in the work of the organization. The extent to which the organization’s work has contributed to creating more
public awareness on issues of openness, accountability and transparency. The number of PAIA requests the organization has made. The efforts by the organization to raise public awareness on PAIA and its
usage. The award given to SAHA and BioWatch included a cash prize of R10 000 each. 8.3 Journalist Award This Award was established to recognize media practitioners that have engaged with PAIA either by covering the development on the Act itself and its usage, or by using it for investigative purposes. The following issues are considered in deciding for the winner for this Award: Efforts done by journalist to expose an issue that somebody in the structures of
government, business and civil society may have wanted to keep a secret. The presence of the public interest in the article/story/work of the journalist The extent to which the journalist’s work/article/story has contributed to
creating more public awareness on issues of openness, accountability and transparency.
The number of PAIA requests the journalist has made in investigating stories. The number of times the journalist had covered the usage of PAIA
There were no nominations for this Award and therefore no winner could be announced.
Page 26 of 27
The Golden Key and Rusty Padlock Awards Report - 2008 22 October 2008
Page 27 of 27
9. Conclusion The findings of the 2008 Access to Information Index show that that is some improvement in the status of PAIA implementation. There are number of factors for this but primary among those are:
a) The extensive training drive and PAIA-related seminars by the PAIA Unit of the South African Human Rights Commission (SAHRC) in the last year (2007)
b) Awareness, among the DIO community, that their conduct is being monitored by the ODAC and the SAHRC through the Access to Information Index
c) Awareness by the DIO community that their performance can be rewarded through the Golden Key Awards
d) Benchmarking of best practice through the DIO Forum the PAIA compliance issues as highlighted in the previous Golden Key Awards
A response rate of 40% is an improvement. However a lot can still be done to improve on this. To this extent all PAIA stakeholders must be encouraged to tap into the skills and experiences of this year’s top performers such as the City of Johannesburg, ESKOM, the Department of Defense, South African Police Service, Theewaterskloof Municipality and the entire Limpopo provincial administration.
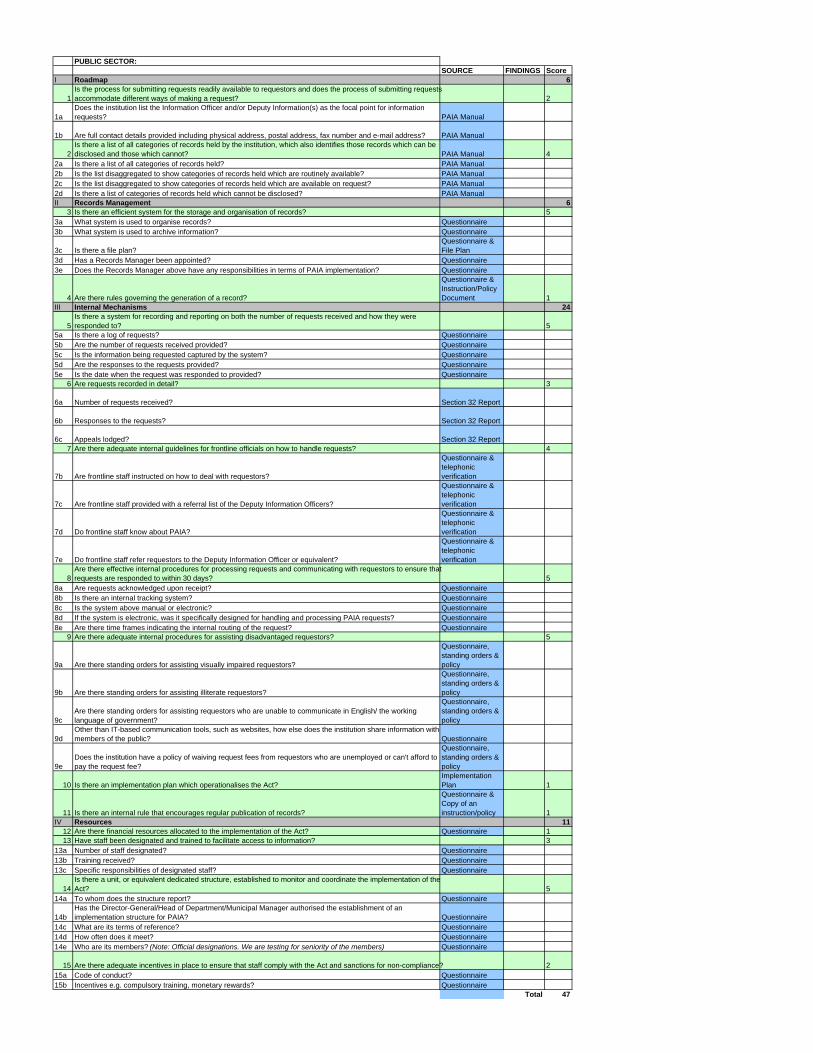
PUBLIC SECTOR:SOURCE FINDINGS Score
I Roadmap 6
1Is the process for submitting requests readily available to requestors and does the process of submitting requests accommodate different ways of making a request? 2
1aDoes the institution list the Information Officer and/or Deputy Information(s) as the focal point for information requests? PAIA Manual
1b Are full contact details provided including physical address, postal address, fax number and e-mail address? PAIA Manual
2Is there a list of all categories of records held by the institution, which also identifies those records which can be disclosed and those which cannot? PAIA Manual 4
2a Is there a list of all categories of records held? PAIA Manual2b Is the list disaggregated to show categories of records held which are routinely available? PAIA Manual2c Is the list disaggregated to show categories of records held which are available on request? PAIA Manual2d Is there a list of categories of records held which cannot be disclosed? PAIA ManualII Records Management 6
3 Is there an efficient system for the storage and organisation of records? 53a What system is used to organise records? Questionnaire3b What system is used to archive information? Questionnaire
3c Is there a file plan?Questionnaire & File Plan
3d Has a Records Manager been appointed? Questionnaire3e Does the Records Manager above have any responsibilities in terms of PAIA implementation? Questionnaire
4 Are there rules governing the generation of a record?
Questionnaire & Instruction/Policy Document 1
III Internal Mechanisms 24
5Is there a system for recording and reporting on both the number of requests received and how they were responded to? 5
5a Is there a log of requests? Questionnaire5b Are the number of requests received provided? Questionnaire5c Is the information being requested captured by the system? Questionnaire5d Are the responses to the requests provided? Questionnaire5e Is the date when the request was responded to provided? Questionnaire
6 Are requests recorded in detail? 3
6a Number of requests received? Section 32 Report
6b Responses to the requests? Section 32 Report
6c Appeals lodged? Section 32 Report7 Are there adequate internal guidelines for frontline officials on how to handle requests? 4
7b Are frontline staff instructed on how to deal with requestors?
Questionnaire & telephonic verification
7c Are frontline staff provided with a referral list of the Deputy Information Officers?
Questionnaire & telephonic verification
7d Do frontline staff know about PAIA?
Questionnaire & telephonic verification
7e Do frontline staff refer requestors to the Deputy Information Officer or equivalent?
Questionnaire & telephonic verification
8Are there effective internal procedures for processing requests and communicating with requestors to ensure that requests are responded to within 30 days? 5
8a Are requests acknowledged upon receipt? Questionnaire8b Is there an internal tracking system? Questionnaire8c Is the system above manual or electronic? Questionnaire8d If the system is electronic, was it specifically designed for handling and processing PAIA requests? Questionnaire8e Are there time frames indicating the internal routing of the request? Questionnaire
9 Are there adequate internal procedures for assisting disadvantaged requestors? 5
9a Are there standing orders for assisting visually impaired requestors?
Questionnaire, standing orders & policy
9b Are there standing orders for assisting illiterate requestors?
Questionnaire, standing orders & policy
9cAre there standing orders for assisting requestors who are unable to communicate in English/ the working language of government?
Questionnaire, standing orders & policy
9dOther than IT-based communication tools, such as websites, how else does the institution share information with members of the public? Questionnaire
9eDoes the institution have a policy of waiving request fees from requestors who are unemployed or can't afford to pay the request fee?
Questionnaire, standing orders & policy
10 Is there an implementation plan which operationalises the Act?Implementation Plan 1
11 Is there an internal rule that encourages regular publication of records?
Questionnaire & Copy of an instruction/policy 1
IV Resources 1112 Are there financial resources allocated to the implementation of the Act? Questionnaire 113 Have staff been designated and trained to facilitate access to information? 3
13a Number of staff designated? Questionnaire13b Training received? Questionnaire13c Specific responsibilities of designated staff? Questionnaire
14Is there a unit, or equivalent dedicated structure, established to monitor and coordinate the implementation of the Act? 5
14a To whom does the structure report? Questionnaire
14bHas the Director-General/Head of Department/Municipal Manager authorised the establishment of an implementation structure for PAIA? Questionnaire
14c What are its terms of reference? Questionnaire14d How often does it meet? Questionnaire14e Who are its members? (Note: Official designations. We are testing for seniority of the members) Questionnaire
15 Are there adequate incentives in place to ensure that staff comply with the Act and sanctions for non-compliance? 215a Code of conduct? Questionnaire15b Incentives e.g. compulsory training, monetary rewards? Questionnaire
Total 47
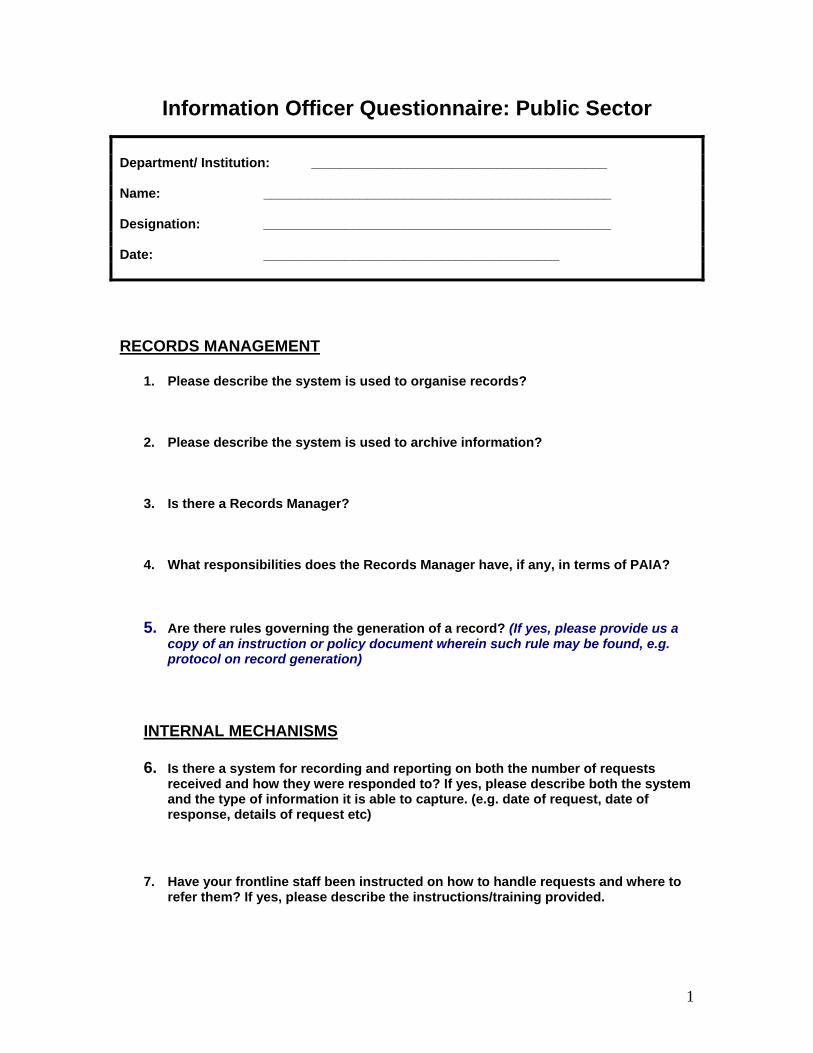
Information Officer Questionnaire: Public Sector
Department/ Institution: ________________________________________ Name: _______________________________________________ Designation: _______________________________________________ Date: ________________________________________
RECORDS MANAGEMENT
1. Please describe the system is used to organise records? 2. Please describe the system is used to archive information?
3. Is there a Records Manager?
4. What responsibilities does the Records Manager have, if any, in terms of PAIA? 5. Are there rules governing the generation of a record? (If yes, please provide us a
copy of an instruction or policy document wherein such rule may be found, e.g. protocol on record generation)
INTERNAL MECHANISMS 6. Is there a system for recording and reporting on both the number of requests
received and how they were responded to? If yes, please describe both the system and the type of information it is able to capture. (e.g. date of request, date of response, details of request etc)
7. Have your frontline staff been instructed on how to handle requests and where to refer them? If yes, please describe the instructions/training provided.
1
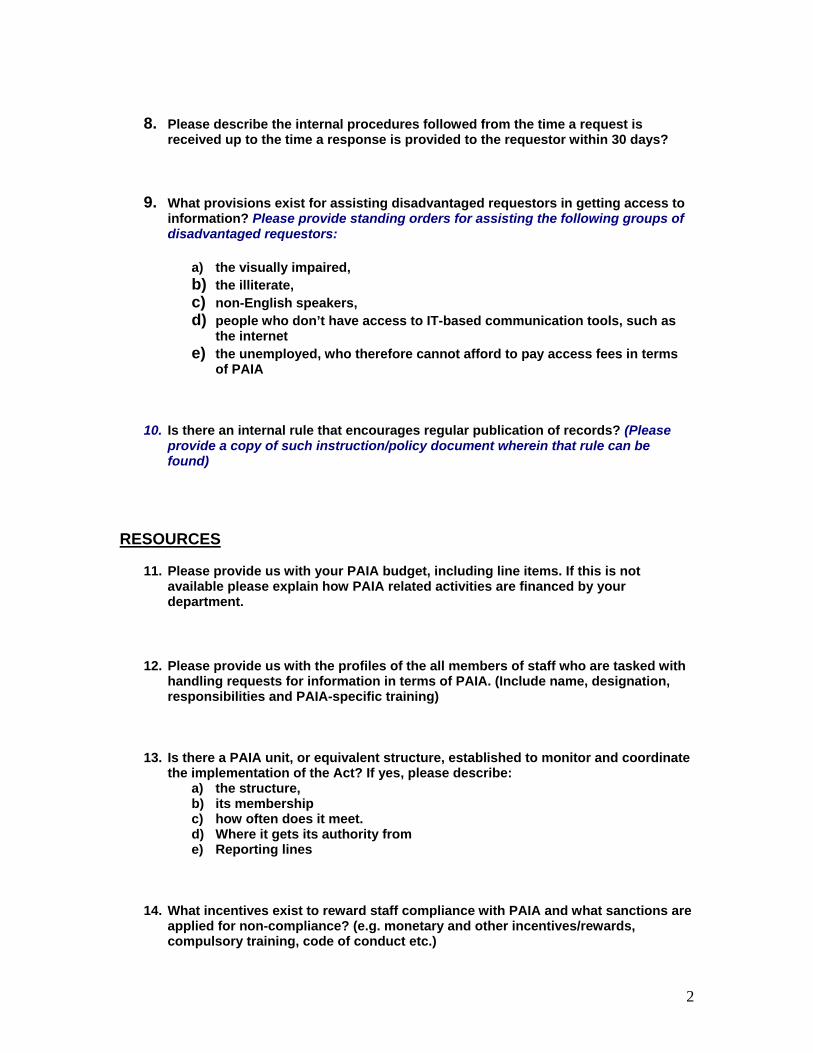
2
8. Please describe the internal procedures followed from the time a request is
received up to the time a response is provided to the requestor within 30 days? 9. What provisions exist for assisting disadvantaged requestors in getting access to
information? Please provide standing orders for assisting the following groups of disadvantaged requestors:
a) the visually impaired, b) the illiterate, c) non-English speakers, d) people who don’t have access to IT-based communication tools, such as
the internet e) the unemployed, who therefore cannot afford to pay access fees in terms
of PAIA
10. Is there an internal rule that encourages regular publication of records? (Please
provide a copy of such instruction/policy document wherein that rule can be found)
RESOURCES 11. Please provide us with your PAIA budget, including line items. If this is not
available please explain how PAIA related activities are financed by your department.
12. Please provide us with the profiles of the all members of staff who are tasked with
handling requests for information in terms of PAIA. (Include name, designation, responsibilities and PAIA-specific training)
13. Is there a PAIA unit, or equivalent structure, established to monitor and coordinate the implementation of the Act? If yes, please describe:
a) the structure, b) its membership c) how often does it meet. d) Where it gets its authority from e) Reporting lines
14. What incentives exist to reward staff compliance with PAIA and what sanctions are applied for non-compliance? (e.g. monetary and other incentives/rewards, compulsory training, code of conduct etc.)
1029 Vermont Ave NW, Suite 600, Washington DC 20005 USA
Phone: +1 202.449.4100 Fax: +1 866.681.8047 www.globalintegrity.org
The Global Integrity Report: 2008 Methodology White Paper
The Global Integrity Approach Global Integrity's Integrity Indicators provide the underpinning for our core reporting and analysis of governance and corruption. The Indicators represent one of the world's most comprehensive data sets providing quantitative data and analysis of anti-corruption mechanisms and government accountability in diverse countries around the globe. Utilizing our network of several hundred on-the-ground analysts and our unique scoring system, Global Integrity generates actionable, and action-worthy, data and qualitative analysis drawn from more than 300 indicators that assess a country's anti-corruption safeguards and potential for corruption. The Integrity Indicators are based on a simple yet powerful concept. Rather than trying to measure actual corruption, considered virtually impossible by experts (e.g., Medard 2001; Sik 2002; Arndt and Oman 2006), Global Integrity quantitatively assesses the opposite of corruption, that is, the access that citizens and businesses have to a country's government, their ability to monitor its behavior, and their ability to seek redress and advocate for improved governance. The Integrity Indicators break down that "access" into a number of categories and questions, ranging from inquiries into electoral practices and media freedom to budget transparency and conflicts of interests regulations. We unpack these concepts by looking not only at what laws or institutions are "on the books" but also by assessing their implementation and enforcement through indicators of staffing, budget support, political independence, and citizen access to the most important anti-corruption mechanisms. Combined with vivid narration prepared by our team of leading journalists in the form of accompanying Reporter's Notebooks, the extensive data provided by the Integrity Indicators informs and empowers citizens, activists, donors, businesses, and governments in each country. Global Integrity country assessments provide detailed data and reporting on the mechanisms in place to prevent abuses of power and promote public integrity. Using a blend of social science and journalism, in-country teams of independent researchers and journalists report on the de jure as well as de facto reality of corruption and governance. While the Reporter's Notebook on the culture of corruption often paints a depressing picture (how corruption looks, tastes, feels and smells to the average citizen), the Integrity Indicators identify strengths and weaknesses in the national anti-corruption architecture and serve as a road map for possible reforms. Transparency, both in terms of our methodology and findings, is what characterizes the Global Integrity approach and enhances the robustness and credibility of our findings. As we continue to improve our methodology and learn from our fieldwork experiences, we welcome and value critical feedback.

2
Research Team Members and Roles Global Integrity staff in Washington both identify and manage our teams of local, in-country reporters and researchers who are responsible for collecting the raw reporting and data that ultimately generates the Global Integrity country assessments. Headquarters staff recruit, contract, and pay in-country team members; develop and share the methodology with in-country experts; review all data and reporting for completeness and accuracy; manage the peer review process (see below for details); and produce cross-country analysis of the resultant qualitative and quantitative information. An obvious but notable point is that Global Integrity qua Global Integrity does not "assign" countries scores in any category, sub-category, or Integrity Indicator. Instead, of all our data and reporting is home-grown, bottom-up information generated and peer reviewed by in-country local experts. Global Integrity staff manage the fieldwork process and provide overarching guidance and logistical support. Fieldwork and Country Selection From June to December 2008, Global Integrity conducted field research (assessing the period June 2007 to June 2008) in the following 58 countries or territories: Albania, Angola, Argentina, Azerbaijan, Bangladesh, Belarus, Bosnia and Herzegovina, Bulgaria, Cambodia, Cameroon, Canada, Chile, China, Colombia, Democratic Republic of Congo, Ecuador, Egypt, Ethiopia, Fiji, Georgia, Ghana, Guatemala, Hungary, India, Indonesia, Iraq, Italy, Japan, Jordan, Kazakhstan, Kenya, Kuwait, Kyrgyz Republic, Lithuania, Macedonia, Moldova, Montenegro, Morocco, Nepal, Nicaragua, Nigeria, Pakistan, Philippines, Poland, Romania, Russia, Serbia, Solomon Islands, Somalia, South Africa, Tanzania, Tonga, Tunisia, Turkey, Uganda, West Bank, Yemen, and Zimbabwe. Our 2008 sample is by no means representative but provides interesting country coverage across several key variables. While our ambition remains to cover all countries and regions of the world, at least on a bi-annual rotating basis, the final set of countries for 2008 was chosen according to the following criteria: Balance: Global Integrity seeks to ensure a basic geographic balance in its annual rounds of national-level country assessments. For 2008, the breakdown was as follows: Sub-Saharan Africa: 12 (Angola, Cameroon, Democratic Republic of Congo, Ethiopia, Ghana, Kenya, Nigeria, Somalia, South Africa, Tanzania, Uganda, Zimbabwe) East and Southeast Asia: 5 (Cambodia, China, Indonesia, Japan, the Philippines) Pacific: 3 (Fiji, Solomon Islands, Tonga)
3
Europe: 15 (Albania, Bosnia and Herzegovina, Belarus, Bulgaria, Hungary, Italy, Lithuania, Macedonia, Moldova, Montenegro, Poland, Romania, Russia, Serbia, Turkey) Latin America: 6 (Argentina, Chile, Colombia,, Ecuador, Guatemala, Nicaragua) Middle East and North Africa: 8 (Egypt, Iraq, Jordan, Kuwait, Morocco, Tunisia, West Bank, Yemen) South and Central Asia: 8 (Azerbaijan, Bangladesh, Georgia, India, Kazakhstan, Kyrgyz Republic, Nepal, Pakistan) North America: 1 (Canada) Budget: The total number of countries covered in 2008, 58, was the maximum number of countries we could afford to assess thanks to the generous support of our current donors. Our goal remains to expand our coverage to true global coverage, at least on an alternating year basis. Availability of experts: Perhaps the most important criterion that affects whether a country is selected is whether Global Integrity is able to recruit a sufficiently qualified research team in the country. We cannot, and do not, carry out country assessments where we lack confidence in our team. See additional details below on how country teams are recruited and selected. Country Teams Global Integrity combines the skills of leading journalists with expert social scientists and researchers to produce its comprehensive country assessments. In each country, Global Integrity retains a team of at least five to ten experts, working independently, to compile the material for the country assessments. A Global Integrity country team typically consists of:
• A lead reporter who reports and writes the Reporter's Notebook. • A lead researcher who compiles the initial scores for the Integrity Indicators. • At least three to five country "peer reviewers" (a mix of other in-country experts
and out-of-country experts) who blindly review the raw data and reporting to provide unvarnished corrections, comments, and criticisms. Peer review comments on all data and reporting are published transparently alongside the original data and reporting, offering readers an alternative perspective and context.
The teams are coordinated from Washington via the Internet and phone. Until the public release of the country assessments, the researchers, journalists, and peer reviewers are unaware of the identities of other members of the country team. This is done to maintain the independence of the individual responses and avoid a peer-influenced consensus. All
4
work is carried out by field teams via Global Integrity's custom-built Web-based data entry platform, MAGIC (“Multi-user Access to Global Integrity Content”). To identify appropriate researchers, journalists, and peer reviewers in each country, Global Integrity actively recruits potential team members through informal partnerships with several well-placed international NGOs that work in the anti-corruption and good governance field; those partners assist in publicizing our annual "Call for Experts." We also participate in international conferences and seek referrals from colleagues with whom we already work in various countries. Global Integrity then independently verifies the expertise and independence of prospective team members. For 2008, we received around 700 CVs from individuals who expressed interest in serving on a country team in one of our three distinct capacities (journalist, lead researcher, or country peer reviewer). After a competitive internal selection process, the most qualified and available researchers, journalists, and peer reviewers in each country are identified, invited, and sent a contract with specific instructions on the scope of the work. The total number of country team members for 2008 was roughly 300 individuals. Interested readers can review the instructions sent to each team member through the following web link: http://commons.wikispaces.com/MAGIC+Help+Desk The Country Reports The country assessments that make up the Global Integrity Report contain the following elements:
• Country Facts: Prepared by Global Integrity staff, these are drawn from a variety of publicly-available sources — such as the World Bank Development Indicators, UNDP Human Development Index, and Legatum Prosperity Index — and provide basic political and economic background information on every country assessed.
• Corruption Timelines: Compiled by Global Integrity researchers in Washington,
these are unique political/historical timelines of significant corruption-related events at the national level. Designed as a quick reference resource, each timeline summarizes the main corruption-related events in the country from the early 1990s through present-day. Based largely on reliable English-language international and national media sources (e.g., the BBC, Freedom House), the Corruption Timeline pulls together in an easy-to-read, chronological fashion what exists in the public domain about corruption in a particular country.
• The Reporter's Notebooks: Prepared by the lead in-country journalist, these are
1,250-word original essays analyzing the culture of corruption and state of governance in a particular country. This hard-hitting, impressionistic essay provides a snapshot of corruption in day-to-day life as well as the recent history and context regarding the most high-profile corruption cases dominating that

5
country's media. Reporter's Notebooks are reviewed by the country's respective peer reviewers.
• The Integrity Scorecard: Scorecards are prepared and scored by the lead in-
country researcher. Each country's 300-plus Integrity Indicators are aggregated to generate a country scorecard and the cross-country Global Integrity Index (see additional details below). Integrity Scorecards are reviewed by the country's respective peer reviewers.
Details on the Integrity Scorecard The Integrity Scorecard for each country examines three things:
1. The existence of public integrity mechanisms, including laws and institutions,
which promote public accountability and limit corruption. 2. The effectiveness of those mechanisms. 3. The access that citizens have to those mechanisms.
More specifically, indicators of existence assess the laws, regulations, and agencies/entities or equivalently functioning mechanisms that are in place in a particular country. Indicators of effectiveness assess such aspects of public integrity as protection from political interference; appointments that support the independence of an agency; professional, full-time staff and funding; independently initiated investigations; and imposition of penalties. Indicators of citizen access assess the ready availability of public reports to citizens, or publicly available information, within a reasonable time period and at a reasonable cost. The Integrity Indicators are a unique instrument designed to provide a quantitative assessment of anti-corruption safeguards in a particular country. Carefully selected from a comprehensive review of the anti-corruption literature and other democratic governance sources, including Transparency International's National Integrity Systems framework, the Integrity Indicators are used to "score" the institutional framework that exists at the national level to promote public integrity and accountability and prevent abuses of power. For 2008, the Integrity Indicators were organized into six main categories and 23 sub-categories. They were: 1 Civil Society, Public Information and Media1.1 Civil Society Organizations 1.2 Media 1.3 Public Access to Information 2 Elections 2.1 Voting & Citizen Participation 2.2 Election Integrity 2.3 Political Financing

6
3 Government Accountability 3.1 Executive Accountability 3.2 Legislative Accountability 3.3 Judicial Accountability 3.4 Budget Processes 4 Administration and Civil Service4.1 Civil Service Regulations 4.2 Whistle-blowing Measures 4.3 Procurement 4.4 Privatization 5 Oversight and Regulation 5.1 National Ombudsman 5.2 Supreme Audit Institution 5.3 Taxes and Customs 5.4 State-Owned Enterprises 5.5 Business Licensing and Regulation 6 Anti-Corruption and Rule of Law6.1 Anti-Corruption Law 6.2 Anti-Corruption Agency 6.3 Rule of Law 6.4 Law Enforcement Generating an Integrity Scorecard Each Integrity Indicator is scored directly by the lead researcher and substantiated as far as possible with relevant references and additional comments. The data is relayed from the field to HQ via the internet using MAGIC. There are two general types of indicators: "in law" and "in practice." All indicators, regardless of type, are scored on the same ordinal scale of 0 to 100 with zero being the worst possible score and 100 perfect. "In law" indicators provide an objective assessment of whether certain legal codes, fundamental rights, government institutions, and regulations exist. These "de jure" indicators are scored with a simple "yes" or "no" with "yes" receiving a 100 score and "no" receiving a zero. "In practice" indicators address "de facto" issues such as implementation, effectiveness enforcement, and citizen access. As these usually require a more nuanced assessment, these "in practice" indicators are scored along an ordinal scale of zero to 100 with possible scores at 0, 25, 50, 75 and 100.
7
Lead researchers are required to provide a reference to substantiate each of their scores. This may be an interview conducted with a knowledgeable individual, a website link to a relevant report, or the name of a specific law or institution, depending on the particular indicator. Lead researchers are also offered the opportunity to include additional comments to support their score and reference for a particular indicator. These are particularly useful in capturing the nuances of a particular situation, namely the "Yes, but…" phenomenon which is often the reality in undertaking this type of research. Personality, language, and culture can all affect the interpretation of a particular indicator and the score assigned to it. To minimize this effect and maximize inter-coder reliability, Global Integrity deploys scoring criteria for scoring the 2008 Integrity Indicators. The scoring criteria anchor every single indicator and sub-indicator to a predefined set of criteria. In essence, the scoring criteria guide the lead researcher by suggesting, "If you see X on the ground, score this indicator in the following way." For binary yes/no "in law" indicators, scoring criteria are provided for both "yes (100)" and "no (0)" responses. For "in practice" indicators, scoring criteria are defined for each of the 100, 50, and 0 scores with 25 and 75 deliberately left undefined to serve as in between scoring options. Scoring criteria for each indicator can be accessed via any of our online Integrity Scorecards by "hovering" one’s mouse over a given indicator's scoring scale. In summary, a given indicator or sub-indicator has the following elements:
• Indicator question, provided by Global Integrity • Indicator scoring criteria, provided by Global Integrity • Indicator score (either yes (100)/no (0) or ordinal scale of 0 - 100 with steps at 25,
50, and 75), assigned by the lead researcher based on: o References, provided by the lead researcher o Comments (optional), provided by the lead researcher o Peer review comments (optional), as provided through a blind peer review
process (see more on the peer review process below).
Example of Sub-Indicator Scoring Criteria Public Access to Information > Sub-Indicator 13a 13: Is the right of access to information effective? 13a: In practice, citizens receive responses to access to information requests within a reasonable time period.
100 75 50 25 0
Scale 100 Criteria: Records are available on-line, or records can be obtained within two weeks. Records are uniformly available; there are no delays for politically sensitive information. Legitimate

8
exceptions are allowed for sensitive national security-related information. Scale 50 Criteria: Records take around one to two months to obtain. Some additional delays may be experienced. Politically-sensitive information may be withheld without sufficient justification. Scale 0 Criteria: Records take more than four months to acquire. In some cases, most records may be available sooner, but there may be persistent delays in obtaining politically sensitive records. National security exemptions may be abused to avoid disclosure of government information.
Sources: (required) Identify two or more of the following sources to support your score.
Media reports (identify the publication, author, date published, title, and website if available)
Academic, policy or professional studies (identify the publication, author, date published, title, and website if available)
Government studies (identify the publication, author, date published, title, and website if available) International organization studies (identify the publication, author, date published, title, and website if available)
Interviews with government officials (identify the person by name, title, organization, date of interview, and place of interview)
Interviews with academics (identify the person by name, title, organization, date of interview, and place of interview)
Interviews with civil society or NGO representatives (identify the person by name, title, organization, date of interview, and place of interview)
9
Interviews with journalists or media representatives (identify the person by name, title, organization, date of interview, and place of interview) Description of sources (required).
Comments: (optional)
Generating the Global Integrity Index: A Tool for Cross-Country Analysis While it is important to stress that the strength of the Integrity Indicators is their utility as an in-depth diagnostic tool, Global Integrity is also able to generate scores across categories and countries and classify countries into an overall Global Integrity Index according to various performance bands. These may be useful tools for those wishing to compare countries' overall performances against each another. The Global Integrity Index groups countries into five performance "tiers" according to a country's overall aggregated score:
• Very strong (90+) • Strong (80+) • Moderate (70+) • Weak (60+) • Very Weak (< 60)
For the purpose of producing the Global Integrity Index, a simple aggregation method is used that parallels the process for generating indicator, sub-category, and category scores for each country. Original indicator and sub-indicator values are assigned by the lead social scientist for the country (those scores are adjusted following the peer review process; see more below). Each indicator score is then averaged within its parent subcategory, which produces a subcategory score. The subcategory score is in turn averaged with the other subcategory scores in a parent category. Category scores are

10
averaged to produce a country score which then falls into one of the above five groupings.
Because some aspects of governance and anti-corruption mechanisms are harder to measure definitively, some categories require a more complex matrix of questions than others. Thus, the categories are equally valued, even if some categories are derived from a more lengthy series of questions than others. Similarly, the subcategories are equally valued within their parent category. In other words, each score (sub-indicators, indicator, and so on) is equally weighted with its peers addressing the same topic. However, indicators from different categories are not necessarily equally weighted. Our approach of using equally valued concepts and adding subordinate elements as needed has produced score weightings that reflect the six main conceptual categories evenly. Although we recognize the rationale for a non-equal weighting system (to give emphasis to issues of greater import), we have yet to develop a compelling defense for valuing certain categories, sub-categories, or indicators more important than others. Peer Review Process The importance of the peer review process cannot be overstated. Since Global Integrity utilizes an "expert assessment" approach to compile the Integrity Indicators and Reporter's Notebook, it is crucial that we employ quality control mechanisms to ensure that our data and reporting is as accurate and as balanced as possible. Individually contracted and carefully vetted "peer reviewers," selected for their independence and expertise in particular countries, are asked to blindly review both the raw Reporter's Notebook and the raw Integrity Indicators through MAGIC. The double-blind peer review process ensures that peer reviewers are unrestrained in their commentary, which most likely adds to frankness when commenting on the draft country report. Peer review comments are used to interpret — and in some cases adjust — scores that peer reviewers identify as containing errors, bias, or out-of-date information. Score adjustments follow certain rules and generally require repetition (i.e., similar comments from several peer reviewers) or solid referencing of a factual dispute. See further details on this below (Final Scores).
11
In reviewing the Reporter's Notebook for the country, peer reviewers are asked to consider the following:
• Is the Reporter's Notebook factually accurate? • Is the Reporter's Notebook fair? Is anything misrepresented or unclear? • Are there any significant events or developments that were not addressed?
Peer reviewer comments on the Reporter's Notebook are captured in narrative, paragraph form and are published anonymously alongside the final Reporter's Notebook. For the Integrity Indicators, peer reviewers are asked to consider the following:
• Is the particular Indicator or Sub-indicator scored by the lead researcher factually
accurate? • Are there any significant events or developments that were not addressed? • Does the Indicator or Sub-indicator offer a fair and balanced view of the
anticorruption environment? • Is the scoring consistent within the entire set or sub-set of Integrity Indicators? • Is the scoring controversial or widely accepted? Is controversial scoring
sufficiently sourced? • Are the sources used reliable and reputable?
The peer review process for the data scorecard, like for that of the Reporter's Notebook, does not assign direct attribution to peer review comments. This ensures that peer reviewers are unrestrained in their commentary. Peer review comments on the country's data scorecard are published alongside the final scorecard and play an important role in final scoring adjustments prior to publication. With regard to peer review feedback on the Integrity Scorecard data, peer reviewers were offered one of four standardized choices in responding to a given indicator or sub-indicator, using the above guidance to evaluate each data point:
1. "Yes, I agree with the score and have no comments to add." 2. "Yes, I agree with the score but wish to add a comment, clarification, or suggest
another reference." Peer reviewers then provide their comment or additional reference in a separate text box which is published alongside the original data.
3. "No, I do not agree with the score." In this third case, peer reviewers are asked to explain and defend their criticism of the score and suggest an appropriate alternative score or reference.
4. I am not qualified to respond to this indicator.
For 2008, Global Integrity retained the services of approximately 175 peer reviewers for the annual around of country assessments, with some peer reviewers reviewing multiple countries.

12
Final Scores Global Integrity takes full and final responsibility for the scores contained in the Integrity Scorecard for each country and the Global Integrity Index. These scores are generated following an elaborate and collaborative review process that includes balancing information from several (sometimes conflicting) sources while being guided by the master scoring criteria. Following the peer review process, Global Integrity staff identify specific data points where peer reviewers have flagged problematic scores. The staff then engages the entire country team in a discussion of the issue in question and ultimately decides on appropriate changes, when necessary, to the original data based on the country team's feedback. While Global Integrity makes every attempt to produce credible information, we welcome all feedback on the veracity and accuracy of our data. Please email Global Integrity with specific comments on indicator scores that you may not agree with, particularly with regard to factual accuracy. Confidence Intervals Beginning in 2007, Global Integrity began publishing margins of error for the top-level scores generated for countries as part of compiling the Global Integrity Index. We credit Dani Kaufman, Aart Kraay, and Massimo Mastruzzi of the World Bank for raising awareness within the research and practitioner community of the need to generate and acknowledge errors in any calculations of governance or corruption data. The challenge in generating margins of error for the Global Integrity Index's country-level scores was that unlike a survey with a large sample of respondents, the Global Integrity approach relies on an expert assessment approach backed up by a transparent peer review process. Thus, we did not have a large "N" (sample size) that would allow us to use the ordinary techniques of variance and standard deviation to generate margins of error by exploring the variance of the data around the mean or median. Instead, we relied on a count of the number of indicators for a country that were ultimately changed during the peer review process. We took those changes as an indication of the possibility that greater levels of error existed in the data for the country. In other words, the greater number of indicators changed because of the blind peer review feedback, the greater the likelihood that other errors existed in the country's dataset, we reasoned. However, we were careful to bear in mind that some countries would have a greater number of indicators flagged (and ultimately changed) because those scorecards were subjected to a larger than average number of peer reviewers. The number of peer

13
reviewers varies slightly from country to country each year. We did not want to automatically imply greater error for those countries that had more peer reviewers critically examining the data, a situation that, in our experience, almost always leads to an increased number of indicators flagged for review. We ultimately arrived at the following approach for generating margins of error for country-level scores: Where: Ni = number of indicators scored for the country (same for all countries) MPR = minimum number of peer reviewers for all countries APR = actual number of peer reviewers for a country Ci = number of indicators for the country changed as a result of the peer review process Margin of error = (Ci / Ni) * (MPR / APR) * 100 We then split the resultant margin around the actual country score to generate a +/- spread. Example: N = 320 MPR = 2 APR = 4 Ci = 23 Margin of error = (23/320) * (2/4) * 100 = 3.6 If the country score were 74, we would publish the country score as 74 +/- 1.8 (1.8 equaling 3.6 divided by 2). The (MPR / APR) ratio serves as a "peer review factor" whose impact on the final margin of error diminishes as the number of actual peer reviewers for the country increases.
Access to Information Monitoring Initiative
I. Context & Objectives Transparency and access to government information are seen as critical to accountability and good governance. Access to information – about Budgets, public procurement, service delivery entitlements, government policies and decision-making processes – can enable citizens and civil society to effectively monitor and oversee the functioning of the public officials, can provide a deterrent to corruption, and can ensure that public expenditures are allocated and used for public welfare. The Bank’s new Governance and Anticorruption strategy highlights the role of enhanced transparency and access to information as critical to building effective accountability and civil society participation and oversight, and a key element of an expanded strategic approach to engagement on governance and anticorruption, including in public sector management.
“Citizens and media that have broad access to information on the operation of state institutions are crucial for fostering accountability. Such access may include publication of budget and procurement data, access to state records and reports, and the state’s active dissemination of information on its operations and performance including through e-government…. In addition, greater transparency can help to enhance the credibility of decision-makers through the public disclosure of their income and assets and promote more ethical behavior by government, private sector, and civil society actors. Building on a growing track record of success in this area, the Bank will scale up its work with interested governments to strengthen transparency in public policymaking and service provision1.”
Right to Information legislation, that mandate a presumption of disclosure (rather than of discretion) as the fundamental principle of governance, is emerging as a key instrument for promoting transparency and access to information, and anecdotes from the experience of such countries as India and Mexico show that the legislation has the potential to create effective accountability of public officials. More than 60 of the Bank's client countries have either adopted, or are in the process of adopting Right to Information reforms. The state of knowledge on the effectiveness of FOI/RTI reforms in increasing access to information is relatively limited. Some initiatives have studied the impact of RTI reforms in increasing access to public information. OECD’s “Open Government” initiative is currently developing a set of indicators focused on
three broad aspects of what they define as “open government”; namely, (i) transparency of government actions, (ii) accessibility of government services and information, and (iii) responsiveness of government to new ideas, demands and needs.2 Much of that initiative aims to develop indicators specifically on RTI/FOI institutions, how they are implemented and the quality of their enforcement.
1 World Bank Group GAC Strategy 2 OECD, Directorate for Governance and Territorial Development, “Open Government: Beyond static measures – First draft” draft (June 2009). See also OECD, “Indicators of Good Government, Introducing ‘Government at a Glance’”: http://www.oecd.org/document/12/0,3343,en_2649_33735_37688524_1_1_1_1,00.html
A recent study by the Open Society Justice Institute measured response rates to information requests across a range of countries, both those with RTI and those without.3
The Global Integrity Indicators, commissioned by Global Integrity, measure some dimensions of the adoption and implementation of Right to information legislations – both in law and in practice dimensions, including rights to access government information and records, to appeal if access is denied, institutional mechanisms for requesting information, response times and costs for information requests.
In India, a network of civil society RTI advocacy groups have recently completed a study to measure the extent to which public agencies at different have become responsive to RTI requests.
The proposed Access to Information measurement instrument will build on these initiatives to create a comprehensive instrument that can be applied by both civil society and government agencies to assess the relative openness of governments measured through responsiveness to requests for information, and the existence of organizational and institutional mechanisms to enable access, dissemination, and enforcement. The instrument will enable providing a mechanism for measuring openness both across time – by subsequent applications measuring changes in openness against baseline data, where RTI laws are not yet operational (or have been recently adopted the law), as well as an ‘actionable’ instrument to enable assessing where the constraints are to responsiveness, and the relative record of various public agencies on responsiveness to information requests.
II. Scope of the Measurement Instrument The instrument will include two modules, one focusing on the legal framework (the “in law” module), and the second focusing on implementation (the “in practice” module). The “in law” module is designed to capture information on eight broad dimensions of an RTI/FOI regime:
1. Existence of legislation 2. Enforceable right to public information 3. Sufficient information coverage 4. Procedures for accessing information 5. Limited exemptions to disclosure requirements 6. Enforcement mechanism 7. Ease of access to documents and information 8. Sanctions
Table 1 provides the detailed criteria for capturing information on each of these eight broad dimensions of a country’s RTI/FOI legal framework.
3 Open Society Justice Institute, Transparency & Silence: A Survey of Access to Information Laws and Practices in 14 Countries, Justice in Action Series (Open Society Institute: New York, NY, 2006): http://www.justiceinitiative.org/db/resource2?res_id=103424
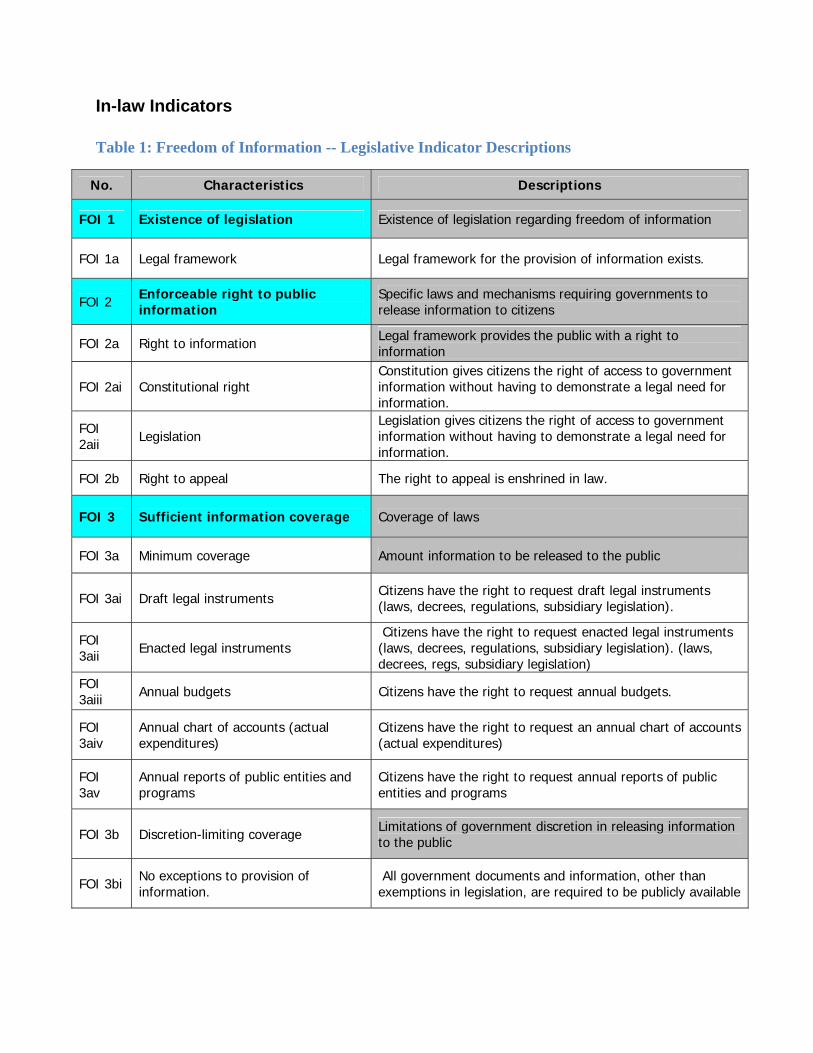
In-law Indicators Table 1: Freedom of Information -- Legislative Indicator Descriptions
No. Characteristics Descriptions
FOI 1 Existence of legislation Existence of legislation regarding freedom of information
FOI 1a Legal framework Legal framework for the provision of information exists.
FOI 2 Enforceable right to public information
Specific laws and mechanisms requiring governments to release information to citizens
FOI 2a Right to information Legal framework provides the public with a right to information
FOI 2ai Constitutional right Constitution gives citizens the right of access to government information without having to demonstrate a legal need for information.
FOI 2aii Legislation
Legislation gives citizens the right of access to government information without having to demonstrate a legal need for information.
FOI 2b Right to appeal The right to appeal is enshrined in law.
FOI 3 Sufficient information coverage Coverage of laws
FOI 3a Minimum coverage Amount information to be released to the public
FOI 3ai Draft legal instruments Citizens have the right to request draft legal instruments (laws, decrees, regulations, subsidiary legislation).
FOI 3aii Enacted legal instruments
Citizens have the right to request enacted legal instruments (laws, decrees, regulations, subsidiary legislation). (laws, decrees, regs, subsidiary legislation)
FOI 3aiii Annual budgets Citizens have the right to request annual budgets.
FOI 3aiv
Annual chart of accounts (actual expenditures)
Citizens have the right to request an annual chart of accounts (actual expenditures)
FOI 3av
Annual reports of public entities and programs
Citizens have the right to request annual reports of public entities and programs
FOI 3b Discretion-limiting coverage Limitations of government discretion in releasing information to the public
FOI 3bi No exceptions to provision of information.
All government documents and information, other than exemptions in legislation, are required to be publicly available

FOI 3bii
Discretion in release of information is allowed.
Formal status of documents or information does NOT exempt it from disclosure.
FOI 4 Procedures for accessing information Disclosure process facilitates access to information.
FOI 4a Written guidelines and standardized form
A standardized form and written guidelines for the release of information exist.
FOI 4b FOIA request options mandated Manner in which information is requested is specified in law.
FOI 4bi Written requests Written requests must be accepted.
FOI 4bii Electronic requests Electronic requests must be accepted.
FOI 4biii Oral requests Oral requests must be accepted.
FOI 5 Limited exemptions to disclosure requirements Limitations to disclosure exemptions
FOI 5a Exemptions to coverage Specific exemptions to coverage are defined in law
FOI 5b Exemptions are not automatic, Exempting a document or piece of information requires a formal authorization by some public authority, based on a limited set of explicit criteria;
FOI 5c Exemption can be overridden Disclosure can be required even for exempt information if either of the following tests is satisfied
FOI 5ci Balancing test If the public interest would be furthered by disclosure of this information, then it must be disclosed (otherwise known as the “public interest test”);
FOI 5cii Harm test If disclosure of this information would not harm any public policy objective, it must be disclosed
FOI 5d Appeals mechanism is mandated when exempt status is invoked: Formal appeals mechanism
FOI 5di Within public entities There is a formal appeals mechanism within public entities.
FOI 5dii
Independent, non-judicial appeals mechanism
There is an independent appeals mechanism outside of the courts, (e.g.,ombudsman)
FOI 5diii Judicial appeals mechanism
There is a mechanism for appeal through the court system (e.g., administrative court, High Court or any other court which deals with such requests).
FOI 6 Enforcement mechanism Mechanism for enforcement of the FOI law.
FOI 6a FOIA contact points Legislation requires public entities to designate a point of contact for FOIA requests.
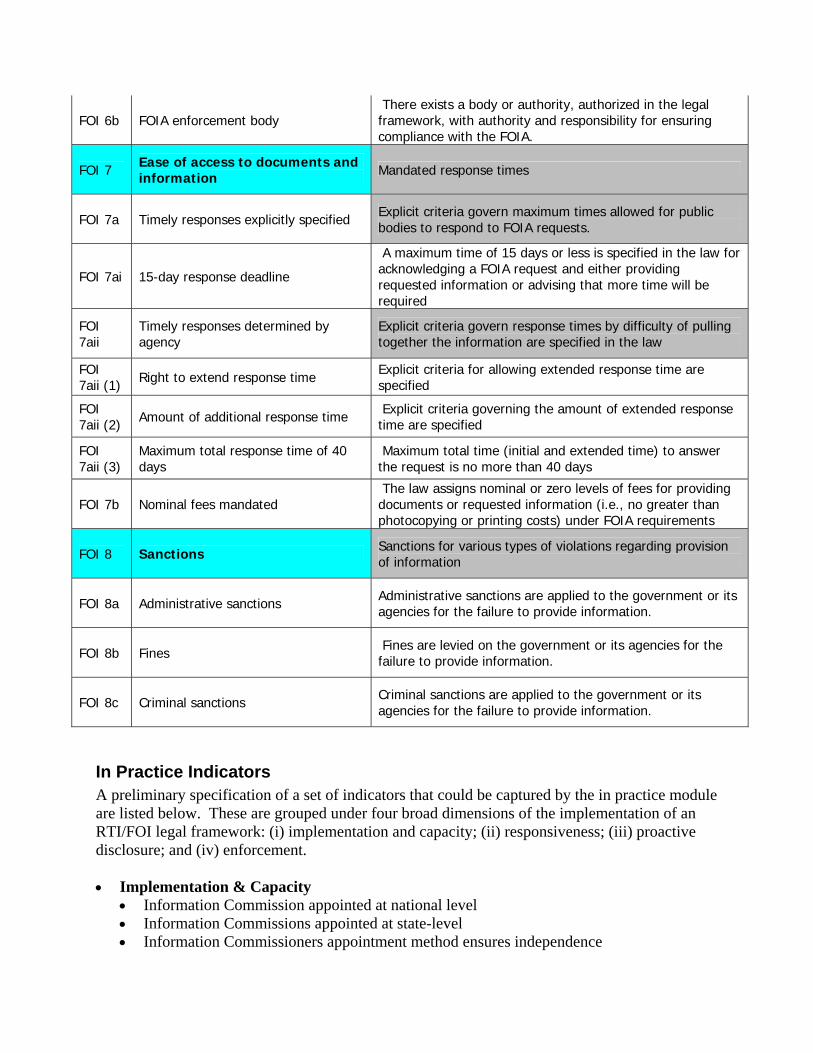
FOI 6b FOIA enforcement body There exists a body or authority, authorized in the legal framework, with authority and responsibility for ensuring compliance with the FOIA.
FOI 7 Ease of access to documents and information Mandated response times
FOI 7a Timely responses explicitly specified Explicit criteria govern maximum times allowed for public bodies to respond to FOIA requests.
FOI 7ai 15-day response deadline
A maximum time of 15 days or less is specified in the law for acknowledging a FOIA request and either providing requested information or advising that more time will be required
FOI 7aii
Timely responses determined by agency
Explicit criteria govern response times by difficulty of pulling together the information are specified in the law
FOI 7aii (1) Right to extend response time Explicit criteria for allowing extended response time are
specified
FOI 7aii (2) Amount of additional response time Explicit criteria governing the amount of extended response
time are specified
FOI 7aii (3)
Maximum total response time of 40 days
Maximum total time (initial and extended time) to answer the request is no more than 40 days
FOI 7b Nominal fees mandated The law assigns nominal or zero levels of fees for providing documents or requested information (i.e., no greater than photocopying or printing costs) under FOIA requirements
FOI 8 Sanctions Sanctions for various types of violations regarding provision of information
FOI 8a Administrative sanctions Administrative sanctions are applied to the government or its agencies for the failure to provide information.
FOI 8b Fines Fines are levied on the government or its agencies for the failure to provide information.
FOI 8c Criminal sanctions Criminal sanctions are applied to the government or its agencies for the failure to provide information.
In Practice Indicators A preliminary specification of a set of indicators that could be captured by the in practice module are listed below. These are grouped under four broad dimensions of the implementation of an RTI/FOI legal framework: (i) implementation and capacity; (ii) responsiveness; (iii) proactive disclosure; and (iv) enforcement. Implementation & Capacity
Information Commission appointed at national level Information Commissions appointed at state-level Information Commissioners appointment method ensures independence
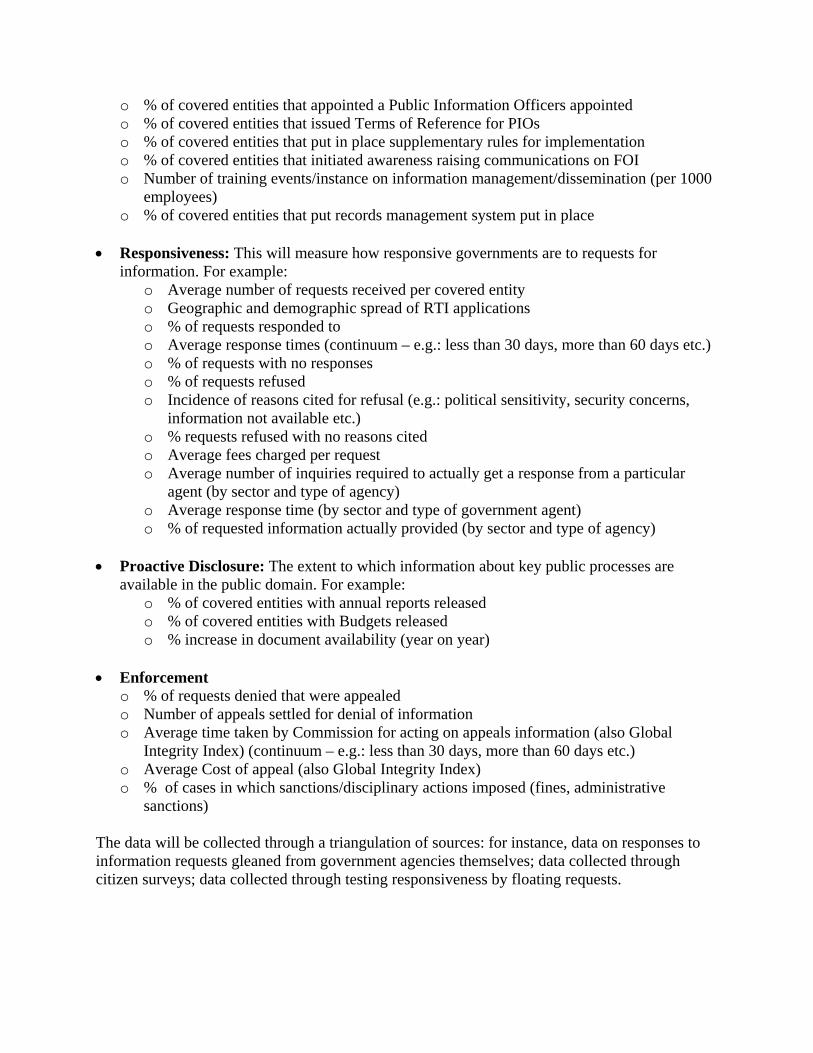
o % of covered entities that appointed a Public Information Officers appointed o % of covered entities that issued Terms of Reference for PIOs o % of covered entities that put in place supplementary rules for implementation o % of covered entities that initiated awareness raising communications on FOI o Number of training events/instance on information management/dissemination (per 1000
employees) o % of covered entities that put records management system put in place
Responsiveness: This will measure how responsive governments are to requests for
information. For example: o Average number of requests received per covered entity o Geographic and demographic spread of RTI applications o % of requests responded to o Average response times (continuum – e.g.: less than 30 days, more than 60 days etc.) o % of requests with no responses o % of requests refused o Incidence of reasons cited for refusal (e.g.: political sensitivity, security concerns,
information not available etc.) o % requests refused with no reasons cited o Average fees charged per request o Average number of inquiries required to actually get a response from a particular
agent (by sector and type of agency) o Average response time (by sector and type of government agent) o % of requested information actually provided (by sector and type of agency)
Proactive Disclosure: The extent to which information about key public processes are
available in the public domain. For example: o % of covered entities with annual reports released o % of covered entities with Budgets released o % increase in document availability (year on year)
Enforcement
o % of requests denied that were appealed o Number of appeals settled for denial of information o Average time taken by Commission for acting on appeals information (also Global
Integrity Index) (continuum – e.g.: less than 30 days, more than 60 days etc.) o Average Cost of appeal (also Global Integrity Index) o % of cases in which sanctions/disciplinary actions imposed (fines, administrative
sanctions) The data will be collected through a triangulation of sources: for instance, data on responses to information requests gleaned from government agencies themselves; data collected through citizen surveys; data collected through testing responsiveness by floating requests.

Open Government: beyond static measures
A paper produced by Involve for the OECD
Karin Gavelin, Simon Burall and Richard Wilson
July 2009

2
Executive summary
The open government agenda has gained momentum over the past decade. It is now widely acknowledged that greater openness benefits not only citizens but also government itself, by prompting better record management, making decisions and services more efficient and, at best, serving as a safeguard against misgovernment and corruption. The purpose of this paper is to introduce new indicators for measuring government openness. Existing open government indicators tend to focus either on the presence of key laws and institutions, or on citizens’ perceptions of government performance. Neither option provides a full picture of comparative openness: the former gives little insight into the scope of the laws and institutions measured and the latter does not provide a quantitative picture of actual activities. The indicators proposed in this paper are intended to fill this gap. They seek to complement, rather than replace, the existing data sets used for measuring government openness today. It is hoped that by improving the ways in which we assess open government, this project will contribute to a better understanding of what open government means in practice, which in turn will lead to improvements in the delivery of the openness agenda both in OECD member countries and worldwide. The proposed indicators will be reviewed by the OECD for possible inclusion in future editions of its ‘Government at a Glance’ publication, a biennial report providing a snapshot picture of the performance of OECD member governments on a number of policy areas, including government openness. The suggested indicators are the product of extensive discussions and correspondence between Involve, the OECD and the peer reviewers who contributed to the drafting of this paper. The drafting process took place from March to June 2009. These discussions resulted in a longlist from which the authors of this paper are recommending a shortlist of ten, each with a series of sub-indicators and follow-up questions to provide additional contextual information. They are:
Indicators relating to law on access to information and documents: o The law presumes proactive publication of information. o The implementation of the law meets citizens’ demand for information. o The law ensures equal access to information and documents for all citizens. o Complaints/appeals mechanisms available meet the needs of citizens.
Indicators relating to Ombudsman/Information Commissioner Institutions: o The Ombudsman/Information Commissioner is independent of the Executive. o The Ombudsman/Information Commissioner’s’ findings are acted upon. o The Ombudsman/Information Commissioner provides equal access to its reports and
services for all citizens.
Indicators relating to Supreme Audit Institutions: o The Supreme Audit Institution is independent of the Executive. o The Supreme Audit Institution’s findings are acted upon.
Indicators relating to consultation policies: o Public bodies are required to consult with citizens or other stakeholders in decision
making.
These headline indicators should be read in conjunction with their respective sub-indicators and follow-up questions, as set out in Table 1.
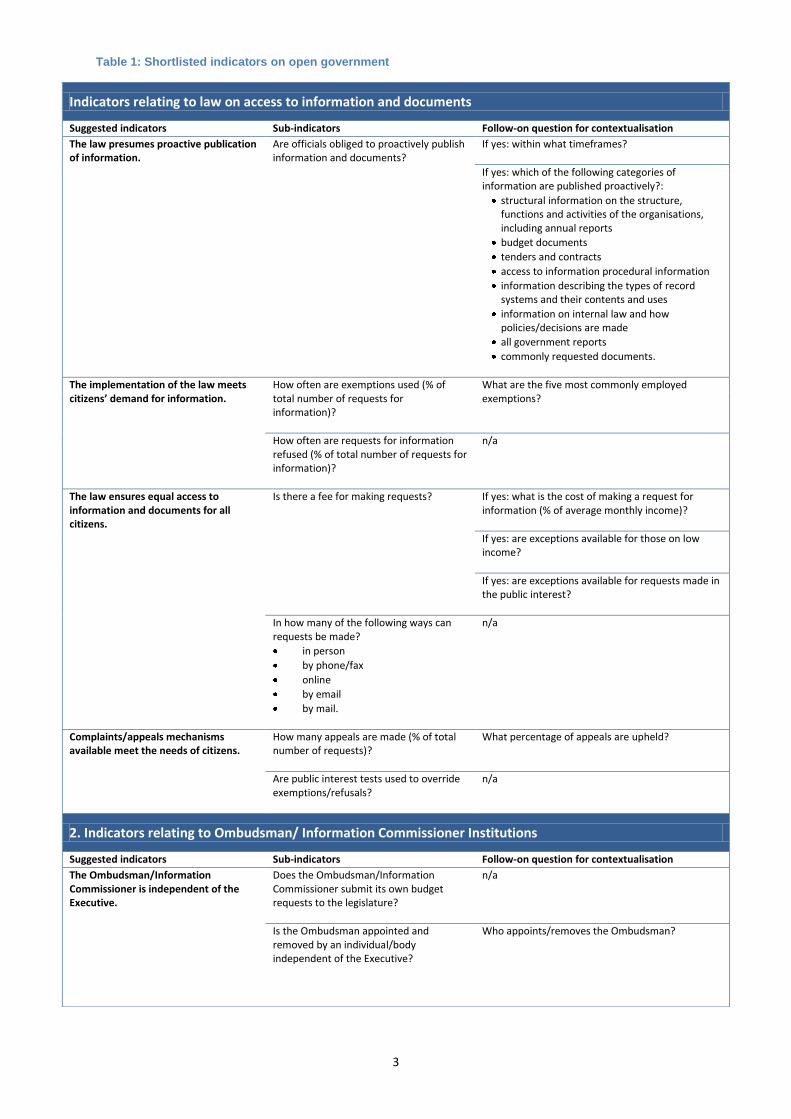
3
Table 1: Shortlisted indicators on open government
Indicators relating to law on access to information and documents
Suggested indicators Sub-indicators Follow-on question for contextualisation
The law presumes proactive publication of information.
Are officials obliged to proactively publish information and documents?
If yes: within what timeframes?
If yes: which of the following categories of information are published proactively?:
structural information on the structure, functions and activities of the organisations, including annual reports
budget documents
tenders and contracts
access to information procedural information
information describing the types of record systems and their contents and uses
information on internal law and how policies/decisions are made
all government reports
commonly requested documents.
The implementation of the law meets citizens’ demand for information.
How often are exemptions used (% of total number of requests for information)?
What are the five most commonly employed exemptions?
How often are requests for information refused (% of total number of requests for information)?
n/a
The law ensures equal access to information and documents for all citizens.
Is there a fee for making requests? If yes: what is the cost of making a request for information (% of average monthly income)?
If yes: are exceptions available for those on low income?
If yes: are exceptions available for requests made in the public interest?
In how many of the following ways can requests be made?
in person
by phone/fax
online
by email
by mail.
n/a
Complaints/appeals mechanisms available meet the needs of citizens.
How many appeals are made (% of total number of requests)?
What percentage of appeals are upheld?
Are public interest tests used to override exemptions/refusals?
n/a
2. Indicators relating to Ombudsman/ Information Commissioner Institutions
Suggested indicators Sub-indicators Follow-on question for contextualisation
The Ombudsman/Information Commissioner is independent of the Executive.
Does the Ombudsman/Information Commissioner submit its own budget requests to the legislature?
n/a
Is the Ombudsman appointed and removed by an individual/body independent of the Executive?
Who appoints/removes the Ombudsman?
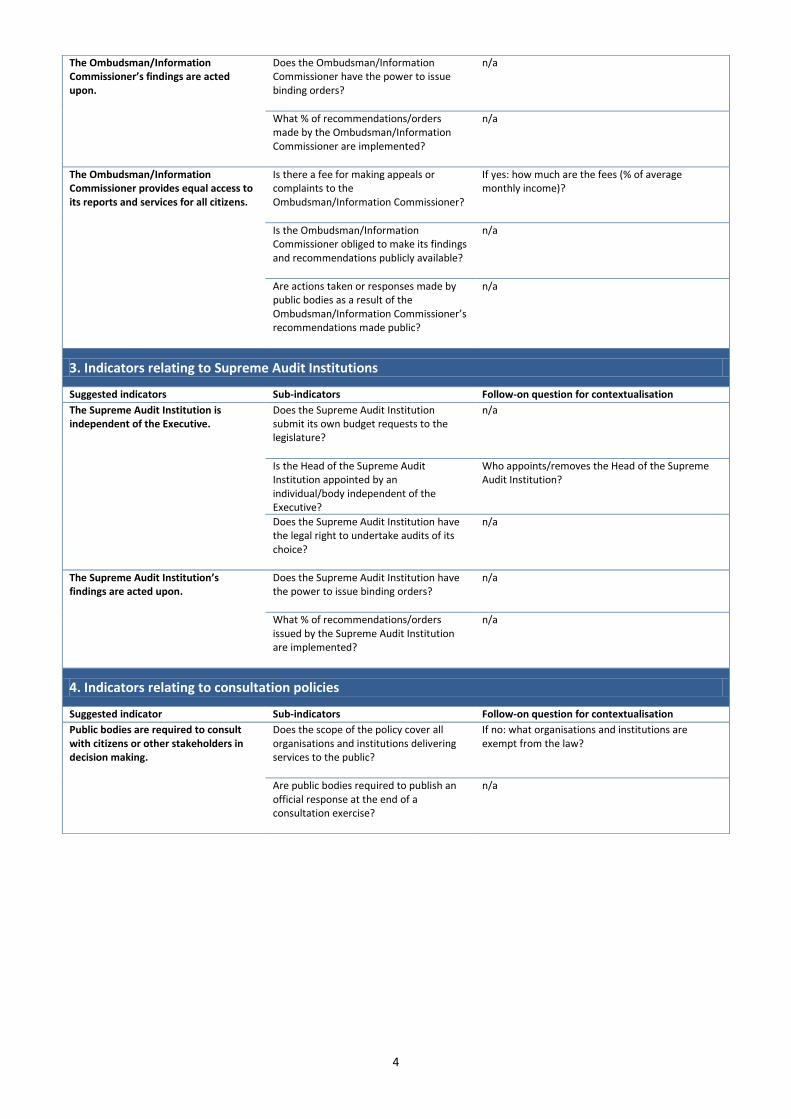
4
The Ombudsman/Information Commissioner’s findings are acted upon.
Does the Ombudsman/Information Commissioner have the power to issue binding orders?
n/a
What % of recommendations/orders made by the Ombudsman/Information Commissioner are implemented?
n/a
The Ombudsman/Information Commissioner provides equal access to its reports and services for all citizens.
Is there a fee for making appeals or complaints to the Ombudsman/Information Commissioner?
If yes: how much are the fees (% of average monthly income)?
Is the Ombudsman/Information Commissioner obliged to make its findings and recommendations publicly available?
n/a
Are actions taken or responses made by public bodies as a result of the Ombudsman/Information Commissioner’s recommendations made public?
n/a
3. Indicators relating to Supreme Audit Institutions
Suggested indicators Sub-indicators Follow-on question for contextualisation
The Supreme Audit Institution is independent of the Executive.
Does the Supreme Audit Institution submit its own budget requests to the legislature?
n/a
Is the Head of the Supreme Audit Institution appointed by an individual/body independent of the Executive?
Who appoints/removes the Head of the Supreme Audit Institution?
Does the Supreme Audit Institution have the legal right to undertake audits of its choice?
n/a
The Supreme Audit Institution’s findings are acted upon.
Does the Supreme Audit Institution have the power to issue binding orders?
n/a
What % of recommendations/orders issued by the Supreme Audit Institution are implemented?
n/a
4. Indicators relating to consultation policies
Suggested indicator Sub-indicators Follow-on question for contextualisation
Public bodies are required to consult with citizens or other stakeholders in decision making.
Does the scope of the policy cover all organisations and institutions delivering services to the public?
If no: what organisations and institutions are exempt from the law?
Are public bodies required to publish an official response at the end of a consultation exercise?
n/a

5
Contents
About Involve 6
Acknowledgements 7
1 Introduction 8
2 Scope and limitations 10
3 Open government – what it means and why it matters 12
4 Comparing openness – building a fuller picture 15
4 Suggested indicators 22
Bibliography 29
Appendix 1: Other international studies of open government 32
Appendix 2: Appendix 3: Approach 35

6
About Involve Involve specialises in public participation; it brings institutions, communities and citizens together to accelerate innovation, understanding, discussion and change. Involve makes a practical difference by delivering high quality public participation processes as well as undertaking research and policy analysis into what works in public and stakeholder involvement. It is a not for profit organisation, which receives funding from the Joseph Rowntree Charitable Trust, the Big Lottery Fund and the Esmée Fairbairn Foundation, among others. Involve has helped leading public bodies and companies – including the OECD, the Ministry of Justice, the Department for Communities and Local Government, the European Commission, the States of Jersey, the Sustainable Development Commission, the BBC, the NHS Centre for Involvement, the Cabinet Office and numerous local authorities – engage with the public. For more information visit Involve’s website www.involve.org.uk or contact [email protected]
7
Acknowledgements The authors would like to acknowledge the invaluable feedback, questions and comments from the following individuals who read and commented on drafts of this paper. Inclusion in this list does not imply formal approval by these individuals and institutions of the content of this paper.
Sari Aalto-Matturi, Oikeusministeriö, Demokratian vastuualue, Finland
Sandra Coliver, Justice Initiative, USA
Helen Darbishire, Access Info Europe, Spain
Alex Dix, Dataprotection and Access to Information Commissioner, Germany
Andrew Ecclestone, Office of the Ombudsmen, New Zealand
Jonathan Fox, University of California in Santa Cruz, USA
Maurice Frankel, Campaign for Freedom of Information, UK
Juan Pablo Guerrero, Instituto Federal de Accesso a la Informacion Publica, Mexico
Thomas Hart, The EU-China Information Project, China
Geo-Sung Kim, Transparency International-Korea (South), South Korea
Maeve McDonagh, University College Cork, Ireland
Toby Mendel, Article 19, UK
Marcos Mendiburu, World Bank Institute, USA
Laura Neuman, Carter Centre, USA
Mitchell Pearlman, University of Connecticut, USA
Natasa Pirc, Information Commissioner, Slovenia
Alasdair Roberts, Suffolk University Law School, USA
Jan Schrijver, Ministry of Internal Affairs and Kingdom Relations, Netherlands
Rick Snell, University of Tasmania Law School, Australia
Steven Van de Walle, Erasmus University Amsterdam, Netherlands
Wouter VanDooren, University of Antwerpen, Belgium
The authors are also grateful for detailed feedback from Joanne Caddy and Jordan Holt at the OECD and for research assistance from Adam Wentworth, Involve.

8
1. Introduction
There is growing consensus that openness lies at the heart of good and effective government as an essential ingredient of 21st-century democracy.1 The OECD defines open government as ‘the transparency of government actions, the accessibility of government services and information and the responsiveness of government to new ideas, demands and needs’.2 Together, these three building blocks are seen to support a number of benefits for government and societies: improving the evidence base for policy making, strengthening integrity, discouraging corruption and building public trust in government.3 The open government agenda is transforming how governments around the world conduct their business. Access to information laws, first pioneered in Sweden over 200 years ago,4 are becoming mainstream around the world, with around 70 countries having some variation of the law in place.5 A growing number of countries have independent oversight and enforcement bodies such as a Supreme Audit Institution, an Ombudsman Office, or an Information Commissioner to ensure that public authorities comply with their duties in relation to transparency and accessibility.6 Many governments are now also experimenting with ways of making public services more responsive to public needs, through consultations and other forms of citizen and stakeholder participation. As governments commit more fully to the openness agenda we are beginning to see the impact these commitments have on governance and service delivery on the ground. This impact varies greatly between countries because the notion of openness is interpreted and implemented differently.7 Yet, despite these inevitable national variations, common principles about what openness means and how it should be implemented are emerging. A number of attempts have been made in recent years to track, measure and compare the development of government openness internationally, including comparative analyses carried out by the OECD since 2002.8 These studies have tended to focus on the legal and institutional elements of open government, for example the presence (or absence) of a law on access to information, a Supreme Audit Institution or an Ombudsman office. As such, they provide useful insights into the spread and progress of these important framework elements of open government. Yet, in focusing solely on the presence or absence of the laws and institutions that facilitate openness, these studies only provide part of the picture. They tell us nothing about the scope of these mechanisms, or how scope affects outcomes. Importantly, they give no information about impact of these laws and institutions: whether they are complied with, how they make a difference, who they benefit and what efforts are made to ensure that they fulfil their purported role in ensuring more transparent, accessible and responsive government.
1.1 Purpose The objective of this project is to take the first steps towards building a more complete picture of open government, one that puts the focus not on the presence or absence of laws and institutions, but rather on their scope and efficacy. This means broadening the range of issues and activities looked at in international comparisons of open government. It also means asking a different set of questions from the data. One approach, as put forward by the peer reviewers who informed this paper, is to start asking questions about how information flows to and from government: what type of information is released (or not), what communication channels are used, who benefits from greater accessibility and transparency and who remains excluded. A good example of the value of this approach is the breakthrough in understanding transparency practices experienced by the Australian government when it moved from gathering statistics about the numbers of information requests made to public bodies (demand side) to asking questions about the type and quality of data given out, and the speed at which it was released (supply side). This type of broader, more qualitative analysis helped identify a high degree of variability in access to information performance between agencies, which helped identify departments in need of targeted support.

9
This paper puts forward a new set of indicators for measuring openness. These explicitly move beyond the existing ‘static’ measurements9 of open government mechanisms (which focus on the presence or absence of laws and policies) to focus instead on their implementation (by public sector bodies), use (by non-governmental actors such as businesses, media, civil society organisations and individuals) and enforcement (by oversight institutions). A selection of the proposed indicators will be reviewed by the OECD for possible inclusion in future editions of its ‘Government at a Glance’ publication; a biennial report providing a snapshot picture of the performance of OECD member governments on a number of institutional elements and policy areas, including open government. Over time, the publication aims to make possible a longitudinal comparative study of the development of open government practices internationally.
10
2. Scope and limitations
The challenges of international comparative analyses of government performance are well rehearsed10 and are even greater when dealing with an emerging and dynamic field such as open government. The authors are fully aware of these constraints and consider this paper to be the starting point rather than the last word in the creation of a more comprehensive set of indicators for measuring open government. We see this paper as a small but important first step towards a better understanding, and ultimately realisation, of open government. Its main purpose is to contribute to the ‘Government at a Glance’ programme’s framework for the comparative study of open government. However, it is envisaged that the indicators presented here will be of use also beyond this context, to form the beginning of an evolving framework for measuring government openness, which will be added to over time as practice develops and more robust evidence emerges. Two important criteria for choosing the new indicators are that they must be comparable and reliable. Ensuring comparability is not without its challenges: the indicators must be sufficiently broad to be applicable to a range of political and bureaucratic systems, while at the same time having the depth to provide meaningful insights about each country’s performance. Failing to take constitutional, institutional and cultural variations into account would almost inevitably lead to a set of indicators that were at best too broad to be meaningful or, at worst, unreliable, because they could be susceptible to skewed analysis and faulty conclusions. For instance, an indicator measuring the numbers of requests for information under access to information laws in different countries would present a spectrum of behaviours; some countries would have experienced high levels of requests and others very few. The reasons behind the number of requests could be many and the single number provides no indication of whether the law is serving its purpose or not. For example, in some countries, personal information held by public bodies falls under the access to information law and so the number of requests is driven up by the large numbers of people requesting personal documents,11 whereas in other countries this is not the case and there will be fewer requests. In another example, a country where the scope of the law is so narrow that there are few opportunities for citizens to use it is likely to experience fewer requests per capita than countries where the scope is wider and more practically useful. On a similar note, countries that proactively publish most government information are likely to experience a low number of requests compared with countries that only publish information on request. Hence, untangling what is driving the number of requests is not possible from a single number unless this data is supplemented with a range of background information such as:
the scope of the law
the cost (financial and other) of requesting information (high fees or the risk of government persecution may deter people from making requests)
the extent to which information is published proactively12
how long the access to information law has been in place (many countries experience higher levels of requests when the law is new).
Similar variations apply to other aspects of open government, as discussed in sections 3 and 4 of this paper. Hence, no single indicator can capture a country’s performance in relation to open government; the only way of building a complete picture is to look at information from a range of sources and categories.13 Another criterion for the new indicators, in the context of the ‘Government at a Glance’ project, is feasibility: the data the indicators measure must be readily accessible or fairly easy to collect. The data for the publication is collected by the member states themselves and so it is important that the indicators do not impose an undue burden on governments. Ensuring that the datasets use the same

11
definitions, are collected at the same level of government (national/federal/local etc.) and within similar timescales will pose additional challenges. Finally, four important limitations in the scope of this paper should be noted:
1. The OECD’s definition of open government makes reference to the ‘accessibility of services and information’. The accessibility of public services is a significant field of study, which overlaps with many other policy areas and is challenging to measure in a small number of high-level indicators. In order to maintain a tight focus on indicators that will provide accessible and comparative data on government openness, this paper excludes a discussion about the accessibility of services, with the exception of those services directly related to transparency and responsiveness.
2. The paper does not deal with privacy data protection, as this field is covered by another Directorate within the OECD.14
3. This paper does not deal with indicators relating to e-government, as the OECD is already collecting data on the scope and efficacy of e-government policies. These will be presented in the ‘Government at a Glance’ publication in a separate chapter.
4. The proposed indicators have a series of sub-indicators and follow-up questions beneath them. Further work will need to be done to develop a system for scoring and weighting these to ensure that policy makers, third sector organisations and citizens are able to draw meaningful conclusions from the data generated.
As a consequence of these constraints, the indicators proposed in this paper are, by necessity, high-level markers focused on central government policy and performance. They are not intended to produce an in-depth picture of each country’s performance on open government, but rather to provide a snapshot comparative overview, which can be complemented with further studies or perception data derived from other research. The OECD explains this high-level approach in this extract from a ‘Government at a Glance’ technical paper:
The most frequent request to the OECD is for basic benchmarking data, with senior officials seeking insights into how the structures and processes in their country compare to those in other countries. Starting from specific, in-depth studies would detract from the ability of the ‘Government at a Glance‘ to offer benchmarking in the short term. Thus the proposal is to start from the collection of a wide array of data, building up to more specific studies – rather than the reverse.15
This is not to suggest that this is a superficial approach. Although these surveys will produce no more than a surface picture of what is happening in each country, they will still provide a more comprehensive overview than exists today. The high-level indicators will serve as a vital health check on the systems in place, a way of identifying strengths, weaknesses and areas in need of attention and of prompting and promoting debate within and among OECD members. Although a more in-depth investigation will generally be required before the full story can be told and an appropriate response be prescribed, these indicators can serve as an alert mechanism that allows governments, oversight bodies and civil society organisations to focus their efforts to promote more open, accountable and responsive government.

12
Requests for information, complaints, challenges
Consultations, opinion polls, dialogue
Requests for information, challenges
Consultation responses, petitions, feedback
Responses to requests for information, public documents, websites, responses to consultation findings
Responses to requests, public documents, websites, responses to consultation findings
Consultations, dialogue
Media coverage, consultation responses, feedback, campaigns
Media coverage, synthesis of information, campaigns
3. Open government – what it means and why it matters
The term open government has become one of the catchphrases of 21st-century democracy debates. It is the ideal to which modern political leaders claim to aspire and the benchmark that journalists, citizens and civil society organisations use to challenge corrupt leaders and secretive institutions. Like so many other popular policy concepts, the term open government means different things to different people. For some, it simply means facilitating the flow of information from governments to citizens; exchanging old, closed decision-making practices for a system where citizens have a right to know what their leaders are doing. Today, however, the term is generally understood to have a broader meaning. It has become an all-embracing label for a more transparent, accessible and responsive16 governance system, where information moves freely both to and from government, through a multitude of channels. In such a system, sharing information is the norm within the public sector and significant resources, training and administrative procedures are devoted to the effective dissemination of knowledge and services.17 Decision makers are responsive to the needs, ideas and priorities of citizens and external bodies, and provide a number of effective and accessible channels for these to be voiced.18 Meanwhile, citizens, businesses and civil society organisations have easy access to services and information, the skills and means to hold decision makers to account (without fear of repercussions) and regular opportunities to feed their views into policy making. This free flow of information from government to the public and third parties such as civil society organisations and the media, and critically back from the public and third parties to government, is at the heart of well-functioning open governments. Figure 1 illustrates in a simplified manner how such an ideal information flow might look, with information requests (dashed arrows) leading to information provision (black arrows).
Figure 1: Information flows in an ideal open government system
Government: political
(politicians, parliament), administrative (departments, officials)
Intermediary bodies: media, civil
society organisations, oversight and enforcement bodies
Citizens, businesses, civil society organisations
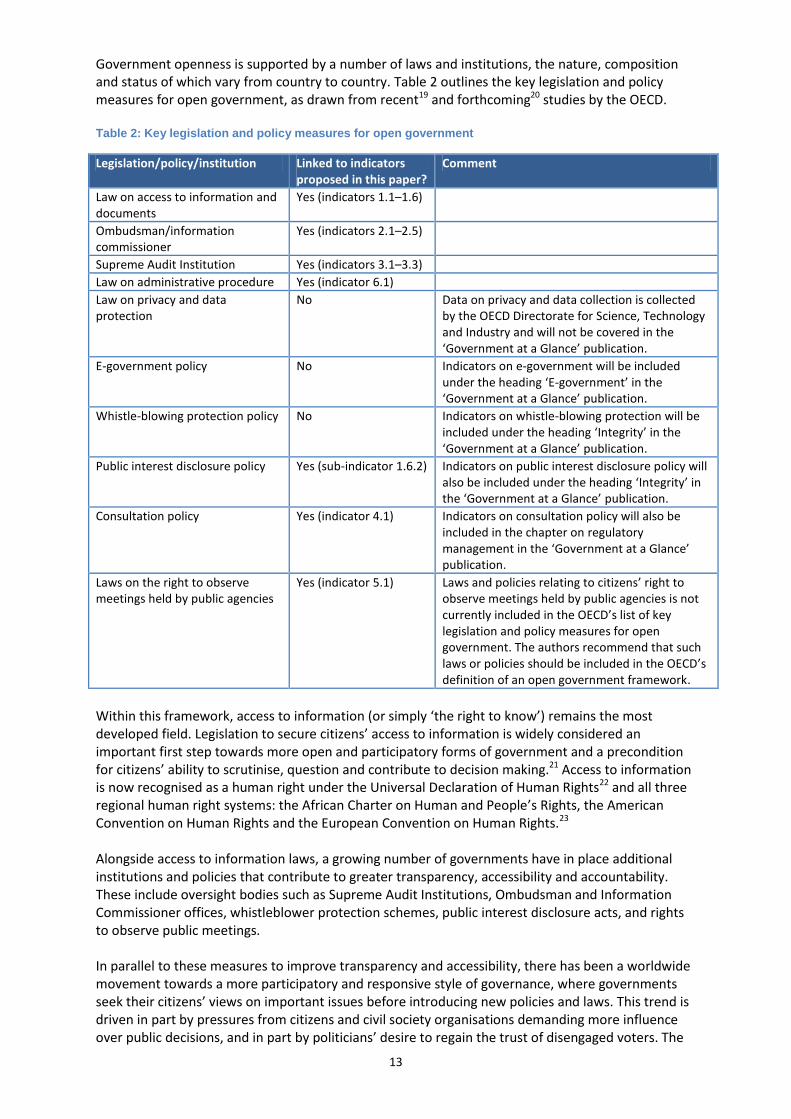
13
Government openness is supported by a number of laws and institutions, the nature, composition and status of which vary from country to country. Table 2 outlines the key legislation and policy measures for open government, as drawn from recent19 and forthcoming20 studies by the OECD. Table 2: Key legislation and policy measures for open government
Legislation/policy/institution Linked to indicators proposed in this paper?
Comment
Law on access to information and documents
Yes (indicators 1.1–1.6)
Ombudsman/information commissioner
Yes (indicators 2.1–2.5)
Supreme Audit Institution Yes (indicators 3.1–3.3)
Law on administrative procedure Yes (indicator 6.1)
Law on privacy and data protection
No Data on privacy and data collection is collected by the OECD Directorate for Science, Technology and Industry and will not be covered in the ‘Government at a Glance’ publication.
E-government policy No Indicators on e-government will be included under the heading ‘E-government’ in the ‘Government at a Glance’ publication.
Whistle-blowing protection policy No Indicators on whistle-blowing protection will be included under the heading ‘Integrity’ in the ‘Government at a Glance’ publication.
Public interest disclosure policy Yes (sub-indicator 1.6.2) Indicators on public interest disclosure policy will also be included under the heading ‘Integrity’ in the ‘Government at a Glance’ publication.
Consultation policy Yes (indicator 4.1) Indicators on consultation policy will also be included in the chapter on regulatory management in the ‘Government at a Glance’ publication.
Laws on the right to observe meetings held by public agencies
Yes (indicator 5.1) Laws and policies relating to citizens’ right to observe meetings held by public agencies is not currently included in the OECD’s list of key legislation and policy measures for open government. The authors recommend that such laws or policies should be included in the OECD’s definition of an open government framework.
Within this framework, access to information (or simply ‘the right to know’) remains the most developed field. Legislation to secure citizens’ access to information is widely considered an important first step towards more open and participatory forms of government and a precondition for citizens’ ability to scrutinise, question and contribute to decision making.21 Access to information is now recognised as a human right under the Universal Declaration of Human Rights22 and all three regional human right systems: the African Charter on Human and People’s Rights, the American Convention on Human Rights and the European Convention on Human Rights.23 Alongside access to information laws, a growing number of governments have in place additional institutions and policies that contribute to greater transparency, accessibility and accountability. These include oversight bodies such as Supreme Audit Institutions, Ombudsman and Information Commissioner offices, whistleblower protection schemes, public interest disclosure acts, and rights to observe public meetings. In parallel to these measures to improve transparency and accessibility, there has been a worldwide movement towards a more participatory and responsive style of governance, where governments seek their citizens’ views on important issues before introducing new policies and laws. This trend is driven in part by pressures from citizens and civil society organisations demanding more influence over public decisions, and in part by politicians’ desire to regain the trust of disengaged voters. The
14
movement is having a significant impact on how governments around the world conduct their business.24 The past decade has seen governments around the world launch a string of democratic innovations to bring decision makers, citizens and other stakeholders closer together. Examples include participatory budgeting which give citizens the power to make decisions about public spending, consultation exercises to inform high-level policy, online discussion forums, petitions and citizens’ panels in local government.
3.1 The value of open government There are conflicting interpretations of what drives the openness agenda and what benefits are derived from governments becoming more transparent, accessible and responsive. Arguments in favour of openness often include a strong normative element; the literature contains many references to open government as intrinsic to modern democracy and a basic human right.25 Another perspective sees open government in a purely instrumental light; as a means to an end. Precisely what that end is considered to be depends, of course, on the context and the person making the argument. The benefits attributed to open government are many and by no means universally shared. They include the claims that open government leads to more effective decision making and services, safeguards against corruption, enables public scrutiny, and promotes citizens’ trust in government.26 There is compelling evidence that properly implemented and enforced open government frameworks can support a number of benefits for governments and societies.27 A World Bank study of the impacts of transparency on governance found that greater access to information could, among other things, improve risk management, economic performance and bureaucratic efficiency in governments.28 Other studies have shown how increasing government openness can contribute to a higher rate of GDP growth,29 reduce the incidence of corruption30 and raise standards in public management and service delivery.31 Studies of the impacts of access to information legislation in New Zealand and Australia have found that the knowledge that documentation will eventually be made public can be sufficient to drive up standards of decision-making and record-keeping procedures among public officials.32 Another report, citing studies from Argentina and Mexico, describes how publicising procurement documentation can lead to savings in public spending. In one case, the publication of contract bids for medical items in a Buenos Aires hospital led to a saving of 50%.33 Many of these impacts have direct benefits for citizens, media and civil society. Simply giving citizens the information and power to influence change around them can have a profound impact on how they perceive themselves and their role in the community, with knock-on effects for the rest of society. A more informed and empowered public can contribute to more cohesive community relations, more active and trusting citizens and more effective public services.34 Accessibility and responsiveness measures can lead to better decisions and risk management, which in turn leads to more effective services and enhanced social welfare. Better access to information can also bring about a more active media, which in turn leads to better informed voters and politicians who are forced to be more accountable. A World Bank Institute report quotes studies by Besley and Burgess that found that ‘regions in India where the media are more active are also regions which are the least likely to suffer from famines during droughts’. The reason is that an active media keeps voters informed of politicians’ intentions and track record, thus enabling them to vote for those who provide the best deal for citizens.35

15
4. Comparing openness – building a fuller picture
Of course, there is no guarantee that laws and policies introduced to make governments more open will deliver their purported outcomes, or indeed that they will lead to any of the wider benefits listed above. Different oversight and enforcement systems may provide vastly different outcomes for citizens and civil society organisations. Appeals procedures that are costly and complicated, that involve lengthy court proceedings or that rely on the cooperation of agencies that are not independent may cause a number of obstacles for those seeking to appeal against a denied request.36 Oversight institutions that lack the mandate to search for missing records or the power to issue binding orders are similarly undermined in their ability to uphold citizens’ rights to information.37 Many access to information laws also fail to live up to their promise. Studies have found that requests for information by citizens, journalists and civil society organisations often continue to be denied or ignored after a law’s implementation.38 A comparative study of fourteen countries with access to information laws found that 38% of requests for information went unanswered and that identical requests submitted by different people received inconsistent responses 57% of the time.39 Responsiveness mechanisms, such as policy consultations or deliberative public participation initiatives, are also susceptible to weaknesses. Despite the growing focus on improving the quality of these types of activities, many consultation exercises remain tokenistic and ineffectual. Many are carried out on a tight budget, by inexperienced staff, and without sufficient consideration of how the findings will feed into policy making or whether the methods used are the most appropriate for the objectives.40 Yet others are let down by a failure to follow up on the activities and inform participants of what happened next, leaving those involved with a feeling that their time was wasted and their input not valued.41 The ability of open government mechanisms to deliver positive outcomes therefore depends on a number of factors, such as what motivated their introduction in the first place and the commitment and resources put into their implementation and oversight efforts. Governments choose to become more open for a number of reasons and many are reticent about their purposes.42 Some are motivated by a desire to rebuild citizens’ trust in government, others by aspirations to improve bureaucratic procedures, and yet others by pressures from external bodies to improve governance.43 A government that introduces access to information legislation solely to tick a box, perhaps to meet the criteria for loans or membership laid down by an international institution, may not send a strong message to its departments and officials that the law is important.44 The effectiveness of an open government framework can also vary over time as different political parties and leaders ascribe different importance both to the wider open government agenda and to specific elements of the agenda. Other variables can be explained by differences in administrative procedures, the level of support offered to officials and the information available to citizens and civil society organisations about their rights.
As the commitment to open government has become more widespread worldwide, so a number of initiatives have emerged that track the progress of these developments. This research happens at a national as well as international level: many countries are now collecting data on how their open government initiatives are working in practice45 and several international studies have sought to compare progress in different countries. Since 2001, the OECD has carried out comparative analysis of the legal and institutional frameworks for open government in its member states. However, as the basic institutional ingredients of

16
openness are becoming more commonplace worldwide, these types of indicator are becoming less useful as measures of comparative openness. Other international studies looking at objectives relating to openness and good governance include the World Bank Institute’s Governance Matters studies,46 the World Governance Assessment framework,47 International IDEA’s Democracy Assessments,48 Transparency International’s Global Corruption Index49 and the One World Trust’s Global Accountability Report50 examining international organisations. These studies provide useful insights into the progress made in individual countries or organisations, as seen by citizens and other key stakeholders. Some also provide comparative overviews of openness and good governance internationally. However, these studies typically use expensive and time-consuming methodologies, which can be difficult to carry out regularly. Some, like the International IDEA framework, draw on common principles, but are explicitly adapted to cultural and national contexts. This makes international comparisons difficult. Moreover, some of these studies rely heavily on perception data, and so do not provide a quantitative picture of events and activities. Perception surveys have a significant value in providing information about levels of trust in government and citizens’ or other stakeholders’ views on government performance, both important indicators of how well governments are doing in terms of openness.51 As International IDEA argues in the introduction to its Democracy Assessment Framework, no group is better placed to comment on the state of democracy in a country than its citizens.52 Yet, in light of past research, which has shown that perception data can be a poor predictor of actual government performance, 53 there is a strong case for such studies to be complemented with information on the incidence of concrete measures of actual events and activities. It is becoming clear, therefore, that there is a need to broaden the perspective of quantitative studies of open government, to look beyond static measures of legal and institutional frameworks and to start asking questions about their scope, efficacy and impact. There is a need to generate new indicators that provide a fuller picture of government performance on openness, while also being relatively easy to implement and replicate over time. This is the purpose of this paper. The proposed new indicators presented in section 4 will look beyond the infrastructure of open government (de jure) to also track what is actually happening in practice (de facto).
4.1 Openness in practice: measuring implementation, use and enforcement The new indicators will look specifically at the implementation, enforcement and use of open government frameworks. To begin with, it is useful to clarify what these terms mean and how they are related.
4.1.1 Implementation of open government frameworks Implementation of open government refers to the efforts and resources devoted by public sector bodies to the execution of a law or policy, either when it is first introduced or over time. The legal and institutional framework for open government is precisely that, a framework in which change can take place. Alone, a new law or policy has little value. Once in place, significant efforts are needed to ensure that officials are able to comply with it and its beneficiaries are aware of, and able to enjoy, their new rights.54 Precisely what implementation entails in the context of open government will differ depending on the nature of the institutional and legal framework in the country in question, as well as a range of other factors including how long the framework has been in place and what motivated the introduction of the laws or policies in the first place.55 As Neuman and Calland explain in Making the Access to Information Law Work, laws passed in response to an endogenous, inherent need or civil society demand are more likely to be followed by committed implementation and enforcement efforts than those passed to satisfy an exogenous demand, such as requirements for membership in or financial assistance from an international institution.56

17
A cornerstone of implementation is the support offered to officials to help them understand and fulfil their duties in relation to openness.57 Established working practices and institutional culture can cause significant obstacles in the establishment of open government laws and policies.58 This is not surprising; measures to increase transparency, accessibility and responsiveness ask a lot of officials, in particular during periods of transition. Public servants accustomed to operating in a culture of secrecy, sometimes with long-established working practices that would not stand up to public scrutiny, are unlikely to find the shift to a more transparent system an easy one.59 Equally challenging can be the upheaval of traditional decision-making structures in order to accommodate external perspectives through consultations and other forms of public and stakeholder participation. Not only do these laws and policies require officials to adopt new approaches to their work and position, sometimes at the expense of treasured powers and privileges, but they can also make significant new demands on these officials’ time and resources. Often little effort is made to explain the advantages of access to information for helping improve civil servants’ work. This can cause problems also for officials who are intent on complying with openness principles, but may be discouraged from doing so by department heads who would like to see their time and budgets spent differently. Hence the passing of a new law, even if endorsed by senior political leaders, may not be sufficient to ensure compliance, unless it is accompanied by significant efforts to win hearts and minds of officials at all levels. Investing in support and guidance sends a strong message to officials that government is taking the openness agenda seriously. Such support could involve training, guidance documents and networks to encourage officials to learn from others’ experiences. This support element is important not just when a new law is introduced. Ideally, training in the day-to-day implementation of transparency and accessibility should be an integrated element of civil servants’ in-service training programmes, to ensure that these skills are not lost over time. Another important element of implementation is the extent to which a government takes steps to promote its commitment to openness. Examples of promotional activities include information campaigns to make citizens, media, businesses and civil society organisations aware of their rights to information and to contribute to government decision making, or the inclusion of such issues in the national curriculum. Another form of promotion may be explicit political endorsements of openness agendas, as exemplified by President Obama’s recent promulgation of the US Open Government Directive.60 Yet another important aspect of implementation is the changes made to administrative procedure to make compliance with the new laws and policies easier. This may involve the establishment of a central body that coordinates efforts around a particular framework element, such as a body in charge of implementing the access to information law or a specific government department charged with responsibility for maintaining good consultation practice.61 It may also involve the introduction of minimum standards for record management, to ensure that requests for information are not obstructed by poor record keeping.62 Table 3 sets out a number of components of implementation in relation to the open government framework described on page 13. The lists are not exhaustive but are intended to illustrate the range of measures that may be taken by governments to support the establishment and maintenance of an open government framework.
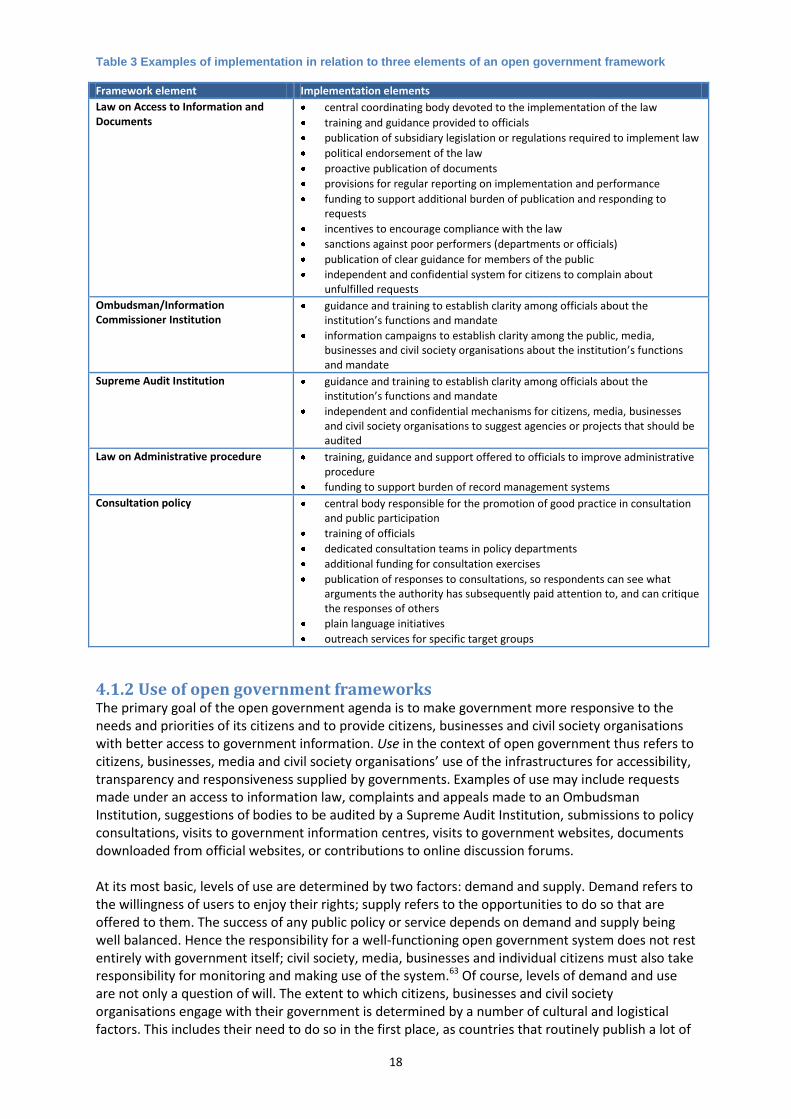
18
Table 3 Examples of implementation in relation to three elements of an open government framework
Framework element Implementation elements
Law on Access to Information and Documents
central coordinating body devoted to the implementation of the law
training and guidance provided to officials
publication of subsidiary legislation or regulations required to implement law
political endorsement of the law
proactive publication of documents
provisions for regular reporting on implementation and performance
funding to support additional burden of publication and responding to requests
incentives to encourage compliance with the law
sanctions against poor performers (departments or officials)
publication of clear guidance for members of the public
independent and confidential system for citizens to complain about unfulfilled requests
Ombudsman/Information Commissioner Institution
guidance and training to establish clarity among officials about the institution’s functions and mandate
information campaigns to establish clarity among the public, media, businesses and civil society organisations about the institution’s functions and mandate
Supreme Audit Institution guidance and training to establish clarity among officials about the institution’s functions and mandate
independent and confidential mechanisms for citizens, media, businesses and civil society organisations to suggest agencies or projects that should be audited
Law on Administrative procedure training, guidance and support offered to officials to improve administrative procedure
funding to support burden of record management systems
Consultation policy central body responsible for the promotion of good practice in consultation and public participation
training of officials
dedicated consultation teams in policy departments
additional funding for consultation exercises
publication of responses to consultations, so respondents can see what arguments the authority has subsequently paid attention to, and can critique the responses of others
plain language initiatives
outreach services for specific target groups
4.1.2 Use of open government frameworks The primary goal of the open government agenda is to make government more responsive to the needs and priorities of its citizens and to provide citizens, businesses and civil society organisations with better access to government information. Use in the context of open government thus refers to citizens, businesses, media and civil society organisations’ use of the infrastructures for accessibility, transparency and responsiveness supplied by governments. Examples of use may include requests made under an access to information law, complaints and appeals made to an Ombudsman Institution, suggestions of bodies to be audited by a Supreme Audit Institution, submissions to policy consultations, visits to government information centres, visits to government websites, documents downloaded from official websites, or contributions to online discussion forums. At its most basic, levels of use are determined by two factors: demand and supply. Demand refers to the willingness of users to enjoy their rights; supply refers to the opportunities to do so that are offered to them. The success of any public policy or service depends on demand and supply being well balanced. Hence the responsibility for a well-functioning open government system does not rest entirely with government itself; civil society, media, businesses and individual citizens must also take responsibility for monitoring and making use of the system.63 Of course, levels of demand and use are not only a question of will. The extent to which citizens, businesses and civil society organisations engage with their government is determined by a number of cultural and logistical factors. This includes their need to do so in the first place, as countries that routinely publish a lot of

19
public documents are likely to experience fewer requests for information, for example. Other factors affecting levels of use include people’s awareness of their rights, the cost of the interactions (time, money and effort), their trust in the system’s integrity and efficacy, and any risks involved, such as risk of direct or indirect government sanctions against individuals and organisations that ask uncomfortable questions. As explained in the earlier sections, comparing levels of use is not possible unless these variables are taken into consideration. Measuring use in absolute numbers, for example, would not provide reliable or comparable data. To guard against this problem, the indicators relating to use proposed in this paper are either proxy indicators intended to explore how easy it is for citizens and organisations to exercise their rights to information and influence (e.g. by measuring the accessibility of reports and decisions or the cost of requesting information or making complaints) or they look at relative rather than absolute numbers (e.g. how many appeals or complaints that are made in relation to the total number of requests for information). Table 4 illustrates different examples of use in relation to the open government framework described on page 13. Table 4: Examples of use in relation to an open government framework
Framework element Elements of use by the public, media, businesses and civil society organisations
Law on access to information and documents
requests for information or documents
complaints and appeals made about access to information processes – use of websites publishing affirmatively or proactively published information
Ombudsman/Information Commissioner Institution
complaints and appeals made about access to information issues
Supreme Audit Institution requests for and downloading of audit reports
suggestions of bodies or projects to be audited
Consultation policy submissions made to policy consultations
participation in public or stakeholder participation events
4.1.3 Oversight and enforcement of open government frameworks Implementation and use are the necessary ingredients for the effective establishment of an open government framework, although they are not sufficient. The long-term sustainability of open government relies on a robust oversight and enforcement structure.64 The primary function of oversight and enforcement is to ensure that public bodies fulfil their commitments in relation to accessibility, transparency and responsiveness and are held to account if they fail to do so. These functions are typically carried out by more than one institution. In many countries, primary responsibility for performance assessment is held by a Supreme Audit Institution, which audits government accounts, budgets and performance. The Supreme Audit Institution reports to the Executive and Legislature, often annually, and writes recommendations based on its findings. Responsibility for responding to, and investigating, complaints of improper government activity tends to lie with an Ombudsman or Information Commissioner, who issues recommendations or orders to public agencies based on their findings.65 In some countries citizens make complaints and appeals directly to the Courts or Judiciary.66 The ability of oversight and enforcement institutions to carry out their functions depends on a number of factors, including their mandate, their status in relation to the Executive, their budget, who controls how their budget is allocated and how accessible their services and reports are to citizens, media, businesses and civil society organisations. When oversight and enforcement bodies lack the power to issue binding orders or the means of tracking whether their recommendations and orders are acted upon, their ability to fulfil their mandate is likely to be curtailed.67 A study by the International Budget Partnership found that in 37 of 85 countries surveyed, the legislature did little or nothing to follow up the Supreme Audit Institution’s recommendations.68 In 64 of the 85 countries neither the Supreme Audit Institution nor the Legislature reported to the public on actions

20
taken to address the Supreme Audit Institution’s recommendations. This lack of transparency, the report suggests, makes it easier for government to ignore audit recommendations.69 In addition to the tasks of oversight and enforcement, an important additional function of these institutions is to communicate the government’s commitment to openness. As articulated by Neuman in a discussion about access to information:
If there is a widespread belief that the access to information law will not be enforced, [the] right to information becomes meaningless. Weak or ineffectual enforcement mechanisms can lead to arbitrary denials or encourage agency silence, whereby no explicit denial is made, but rather the government agencies ignore the request for information or pretend that the law does not exist.70
A country’s approach to the oversight and enforcement of open government can provide insights into the level and nature of its government’s commitment to the openness agenda. The status and powers granted to oversight institutions, their relationship to other government institutions and the political elite, and the status and expertise of the individuals who work for them are some of the factors that determine the ability of these institutions to conduct their role. The absence of an independent oversight institution or the presence of significant restraints on its powers can, as the quote above makes clear, be a sign that the government’s commitment to openness is only nominal. In such cases external actors such as media and civil society organisations may step in to provide an oversight function by highlighting weaknesses in the system or challenging a government’s failure to fulfil its commitments. However, without the mandate to issue decisions or sanctions, these actors rely on their protests causing their government sufficient discomfort or embarrassment to result in it changing its ways. Table 5 presents examples of enforcement activities in relation to the open government framework described on page 13. Table 5: Examples of oversight and enforcement activities in relation to an open government framework
Framework element Elements of oversight and enforcement:
Law on access to information and documents
different appeals procedures available to external users (e.g. courts, Ombudsman institution, Information Commissioner)
internal incentives and sanctions linked to performance
internal performance targets linked to access to information duties
Ombudsman/Information Commissioner institution
recommendations and/or binding decisions issued in response to appeals and complaints from the public and others
inspection and/or searching of government records in response to appeals against claims that documents do not exist
sanctions against departments and officials that fail to comply with their duties in relation to access to information
Supreme Audit Institution evaluations, assessments and audits of agencies and projects
recommendations and/or binding decisions issued in response to performance assessments and audits
Law on administrative procedure incentives and sanctions linked to performance in relation to administrative procedure
Consultation policy code of good practice for consultation and public participation
performance assessment targets in relation to consultation practice
sanctions for breaking codes and duties

21
4.2 Maintaining and enforcing government openness over time Implementation, use and enforcement do not belong to distinct phases in the establishment of an open government framework. In practice they overlap and their relative importance changes over time. Often, the first few years of a new openness regime are devoted to setting up and maintaining the administrative systems and support efforts needed to get the process started. These efforts then tend to tail off, in the assumption (implicit or explicit) that the oversight and enforcement mechanisms established during the implementation phase will be responsible for the long-term functioning of the system. However, this approach overlooks the need to continuously update the knowledge and skills required by public officials to ensure the ongoing effectiveness of an open government framework. It is vital, therefore, that governments do not lose sight of implementation once a law or policy has been in place for some time.71 A key element of this is regular evaluation of whether the system is achieving its objectives as laid out by the legislature, and a mechanism for feeding the results of the evaluation into the implementation, use, oversight and enforcement parts of the process. In some countries, media and civil society actors play an important role in monitoring performance and holding governments to account, for example by protesting against failures to respond to requests for information or by suggesting that projects and agencies should be audited by the Supreme Audit Institution.72
Maintaining and enforcing government openness over time: an example
Sweden In the late 1990s, studies found that public officials in Sweden were lacking the knowledge and skills to fulfil their duties in relation to the ‘Principle of Publicity’, the Swedish law which states that all documents produced or received by public institutions should be freely available to citizens and external bodies. At the same time, there were warnings from the trade unions that public sector decision making was becoming more closed. In order to address these concerns, the Swedish government ran the ‘Open Sweden’ campaign between 2000 and 2002. The campaign sought to improve the implementation of the Principle across public institutions, promote a culture of openness in the public sector and raise awareness in society of people’s right to information.
Regeringskansliet (2008) Öppna Sverige - för en öppen offentlig förvaltning.

22
5. Suggested indicators
Table 6 sets out a longlist of 17 indicators, with a series of sub-indicators and follow-up questions to provide additional contextual information. Further work will be required to develop a system for scoring and weighting these to ensure that audiences are able to compare different jurisdictions and national governance structures, and therefore to draw meaningful conclusions from the data generated. This longlist is the product of extensive discussions and correspondence between Involve, the OECD and the peer reviewers (listed on page 7) who contributed to the drafting of this paper. These exchanges generated an initial list of over 60 potential indicators and sub-indicators, which were amalgamated into a series of top-level indicators each with a series of sub-indicators. These top level indicators were then narrowed down to the 17 presented here. The longlisted indicators were selected on the basis of four criteria:
1. relevance to the purpose of this paper – that the indicator contributes to building a deeper understanding of the scope and impact of the institutions, laws and policies intended to support open government
2. comparability – that the indicator is useable across different cultural and bureaucratic contexts, is clearly defined and unambiguous
3. reliability – that the indicator measures what it purports to measure 4. feasibility – that the datasets must be readily accessible or, if not already available, must be
relatively easily pulled together by OECD member countries. Recognising that the OECD will only include a small number of these indicators in the ‘Government at a Glance’ publication’s chapter on open government, we propose the following shortlist: 1. Indicators on laws on access to information and documents: 1.2 The law presumes proactive publication of information. 1.4 The implementation of the law meets citizens’ demands for information.
1.5 The law ensures equal access to information and documents for all citizens. 1.6 Complaints/appeals mechanisms available meet the needs of citizens.
2. Indicators on Ombudsman/Information Commissioner Institutions: 2.1 The Ombudsman/Information Commissioner is independent of the Executive. 2.3 The Ombudsman’s/Information Commissioner’s findings are acted upon.
2.4 The Ombudsman/Information Commissioner provides equal access for all citizens. 3. Indicators on Supreme Audit Institutions: 3.1 The Supreme Audit Institution is independent of the Executive. 3.2 The Supreme Audit Institution’s findings are acted upon. 4. Indicators on consultation policy:
4.1 Public bodies are required to consult with citizens or other stakeholders in decision making.
These headline indicators should be read in conjunction with their respective sub-indicators and follow-up questions, as set out in Table 6.

23
It should be noted that, as a result of the feasibility criteria, Table 6 contains a higher proportion of de jure than de facto sub-indicators, simply because the former are more readily accessible to governments. The authors believe that including de facto sub-indicators in the datasets will be highly important in improving understanding of how well open government mechanisms are performing their functions. We therefore recommend that the OECD prioritises the indicators that include de facto sub-indicators when it makes its final selection to be included in the ‘Government at a Glance’ publication.73 Table 6: Longlisted indicators on open government
1. Indicators relating to law on access to information and documents
Suggested indicators Sub-indicators Follow-on question for contextualisation
1.1 The scope of the law covers all organisations and institutions delivering services to the public.
1.1.1 Are all branches and institutions of government covered by the law?
1.1.1a If no: what branches and institutions are exempt from the law?
1.1.2 Are all private and non-profit organisations delivering public services covered by the law?
1.1.2a If no: what private and non-profit organisations delivering public services are exempt from the law?
1.2 The law presumes proactive publication of information.
1.2.1 Are officials obliged to publish information and documents proactively?
1.2.1a If yes: within what timeframes?
1.2.1b If yes: which of the following categories of information are published proactively?:
structural information on the structure, functions and activities of the organisations, including annual reports
budget documents
tenders and contracts
access to information procedural information
information describing the types of records systems and their contents and uses
information on internal law and how policies/decisions are made
all government reports
commonly requested documents (based on the recommended categories of information for proactive publication as set out in OECD, Effective Open Government – Improving access to government).
1.3 Central government provides resources to support implementation of the law.
1.3.1 Is support and training available to help public officials in handling access to information requests?
1.3.1a If yes: what officials are provided training and support?
1.3.1b If yes: how many hours of training are required and within what timeframe?
1.3.2 Is there a central body responsible for the implementation of the law?
1.3.2a If yes: does it have functions in relation to training and support given to officials?
1.3.2b If yes: does it have functions in relation to coordinating requests made to multiple departments/bodies?
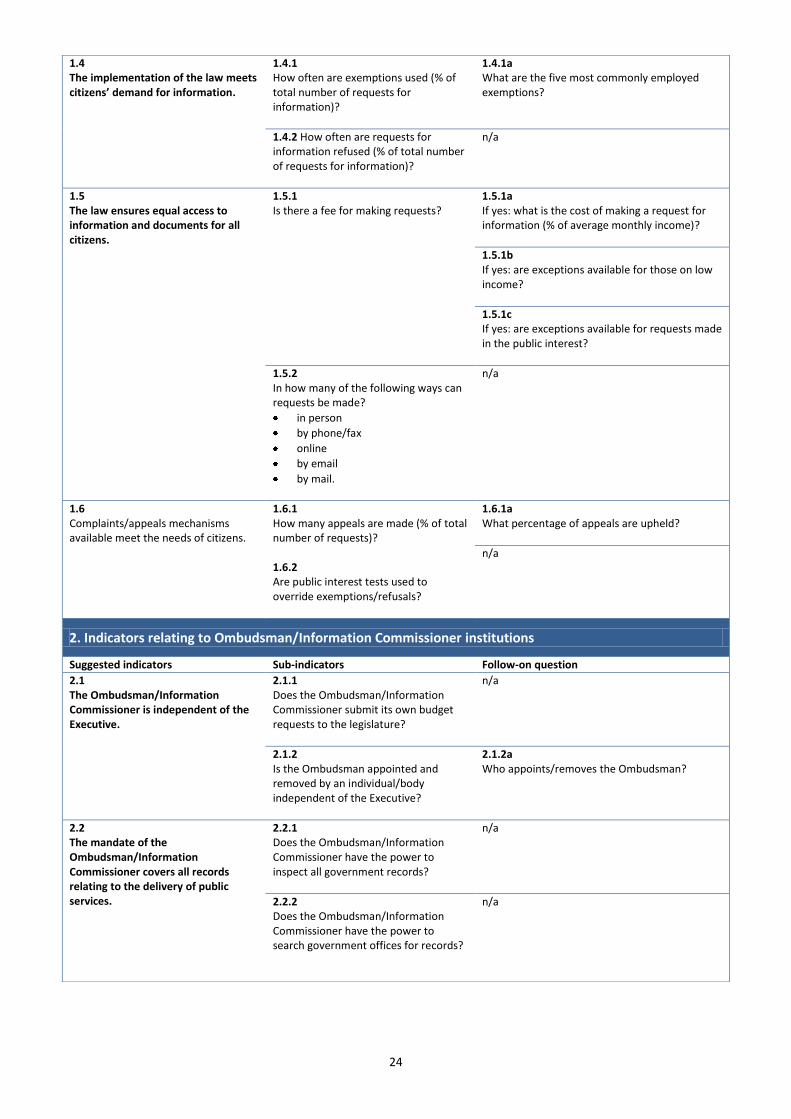
24
1.4 The implementation of the law meets citizens’ demand for information.
1.4.1 How often are exemptions used (% of total number of requests for information)?
1.4.1a What are the five most commonly employed exemptions?
1.4.2 How often are requests for information refused (% of total number of requests for information)?
n/a
1.5 The law ensures equal access to information and documents for all citizens.
1.5.1 Is there a fee for making requests?
1.5.1a If yes: what is the cost of making a request for information (% of average monthly income)?
1.5.1b If yes: are exceptions available for those on low income?
1.5.1c If yes: are exceptions available for requests made in the public interest?
1.5.2 In how many of the following ways can requests be made?
in person
by phone/fax
online
by email
by mail.
n/a
1.6 Complaints/appeals mechanisms available meet the needs of citizens.
1.6.1 How many appeals are made (% of total number of requests)? 1.6.2 Are public interest tests used to override exemptions/refusals?
1.6.1a What percentage of appeals are upheld?
n/a
2. Indicators relating to Ombudsman/Information Commissioner institutions
Suggested indicators Sub-indicators Follow-on question
2.1 The Ombudsman/Information Commissioner is independent of the Executive.
2.1.1 Does the Ombudsman/Information Commissioner submit its own budget requests to the legislature?
n/a
2.1.2 Is the Ombudsman appointed and removed by an individual/body independent of the Executive?
2.1.2a Who appoints/removes the Ombudsman?
2.2 The mandate of the Ombudsman/Information Commissioner covers all records relating to the delivery of public services.
2.2.1 Does the Ombudsman/Information Commissioner have the power to inspect all government records?
n/a
2.2.2 Does the Ombudsman/Information Commissioner have the power to search government offices for records?
n/a
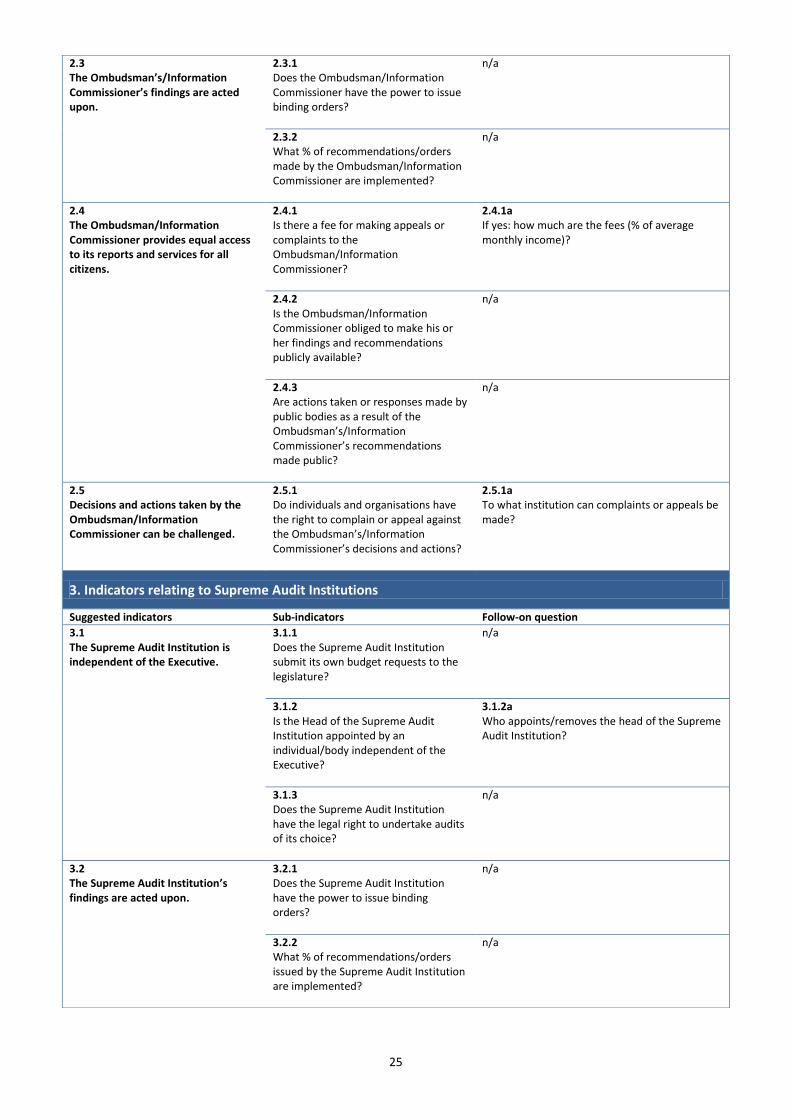
25
2.3 The Ombudsman’s/Information Commissioner’s findings are acted upon.
2.3.1 Does the Ombudsman/Information Commissioner have the power to issue binding orders?
n/a
2.3.2 What % of recommendations/orders made by the Ombudsman/Information Commissioner are implemented?
n/a
2.4 The Ombudsman/Information Commissioner provides equal access to its reports and services for all citizens.
2.4.1 Is there a fee for making appeals or complaints to the Ombudsman/Information Commissioner?
2.4.1a If yes: how much are the fees (% of average monthly income)?
2.4.2 Is the Ombudsman/Information Commissioner obliged to make his or her findings and recommendations publicly available?
n/a
2.4.3 Are actions taken or responses made by public bodies as a result of the Ombudsman’s/Information Commissioner’s recommendations made public?
n/a
2.5 Decisions and actions taken by the Ombudsman/Information Commissioner can be challenged.
2.5.1 Do individuals and organisations have the right to complain or appeal against the Ombudsman’s/Information Commissioner’s decisions and actions?
2.5.1a To what institution can complaints or appeals be made?
3. Indicators relating to Supreme Audit Institutions
Suggested indicators Sub-indicators Follow-on question
3.1 The Supreme Audit Institution is independent of the Executive.
3.1.1 Does the Supreme Audit Institution submit its own budget requests to the legislature?
n/a
3.1.2 Is the Head of the Supreme Audit Institution appointed by an individual/body independent of the Executive?
3.1.2a Who appoints/removes the head of the Supreme Audit Institution?
3.1.3 Does the Supreme Audit Institution have the legal right to undertake audits of its choice?
n/a
3.2 The Supreme Audit Institution’s findings are acted upon.
3.2.1 Does the Supreme Audit Institution have the power to issue binding orders?
n/a
3.2.2 What % of recommendations/orders issued by the Supreme Audit Institution are implemented?
n/a
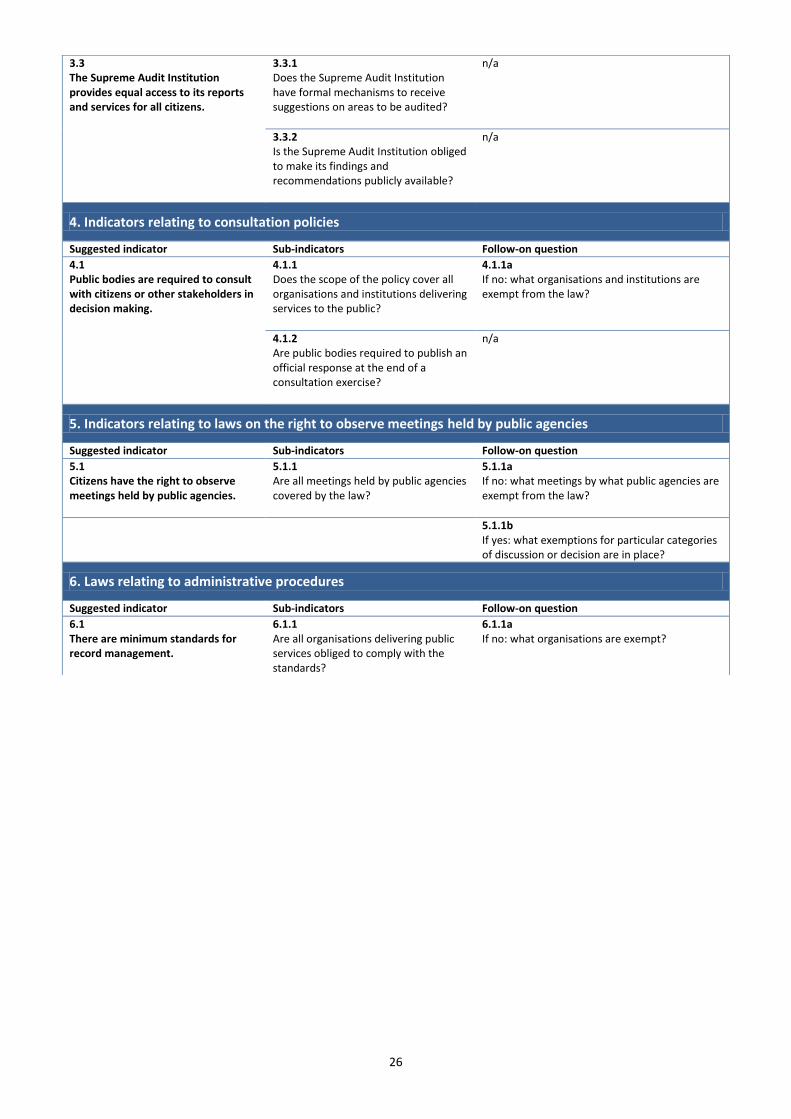
26
3.3 The Supreme Audit Institution provides equal access to its reports and services for all citizens.
3.3.1 Does the Supreme Audit Institution have formal mechanisms to receive suggestions on areas to be audited?
n/a
3.3.2 Is the Supreme Audit Institution obliged to make its findings and recommendations publicly available?
n/a
4. Indicators relating to consultation policies
Suggested indicator Sub-indicators Follow-on question
4.1 Public bodies are required to consult with citizens or other stakeholders in decision making.
4.1.1 Does the scope of the policy cover all organisations and institutions delivering services to the public?
4.1.1a If no: what organisations and institutions are exempt from the law?
4.1.2 Are public bodies required to publish an official response at the end of a consultation exercise?
n/a
5. Indicators relating to laws on the right to observe meetings held by public agencies
Suggested indicator Sub-indicators Follow-on question
5.1 Citizens have the right to observe meetings held by public agencies.
5.1.1 Are all meetings held by public agencies covered by the law?
5.1.1a If no: what meetings by what public agencies are exempt from the law?
5.1.1b If yes: what exemptions for particular categories of discussion or decision are in place?
6. Laws relating to administrative procedures
Suggested indicator Sub-indicators Follow-on question
6.1 There are minimum standards for record management.
6.1.1 Are all organisations delivering public services obliged to comply with the standards?
6.1.1a If no: what organisations are exempt?

27
1 OECD (2005) Effective Open Government: Improving public access to government information. Paris: OECD Publishing; Mayo, E. and Steinberg, T. (2007) The Power of Information: An independent review. London: Cabinet Office. 2OECD (2005) Modernising Government: The way forward. Paris: OECD Publishing. 3 Ibid.; OECD (2005) Effective Open Government: Improving public access to government information; Neuman, L. (2009) Enforcement Models: Content and Context. Washington, DC: International Bank for Reconstruction and Development and World Bank; Neuman, L. and Calland, R. (200?) Making the Access to Information Law Work: The challenges of implementation. Atlanta: Carter Centre. 4 Mendel, T. (2003) Freedom of Information: A comparative legal survey. New Delhi: UNESCO. 5 Banisar, D. (2006) Freedom of Information Around the World 2006. London: Privacy International. 6 OECD (2005) Modernising Government: the way forward. 7 Ibid. 8 Ibid. 9 Static measurements here refer to indicators that measure the presence or absence of laws, policies or institutions but do not provide information about their scope or impact. 10 See for example UNDP (2006) Governance Indicators: A user’s guide, 2nd ed. New York: UNDP, vi–13. 11 In Australia and Canada 80–90% of all requests are for access to personal files. Hazell, R. (2007) ‘Freedom of Information in Australia, Canada and New Zealand’, Public Administration, 67(2), 189–210. 12 For a list of recommended categories of information for proactive publication, see OECD (2005) Effective Open Government: Improving Public Access to Government Information, 26. 13 OECD (2006) How and Why Should Government Activity Be Measured in ‘Government at a Glance‘?, OECD GOV Technical Paper 1. Paris: OECD, 29. 14 Data on privacy and data protection is gathered by the OECD Working Party on Information Security and Privacy (WPISP) in the Directorate for Science, Technology and Industry. 15 OECD (2006) How and Why Should Government Activity Be Measured in ‘Government at a Glance‘?, 12. 16 The OECD defines open government as ‘the transparency of government actions, the accessibility of government services and information and the responsiveness of government to new ideas, demands and needs’, see OECD (2006) How and Why Should Government Activity Be Measured in ‘Government at a Glance’? 17 OECD (2005) Effective Open Government: Improving public access to government information. Paris: OECD Publishing. 18 Open Society Justice Initiative (2006) Transparency & Silence – An overview. New York: Open Society Justice Initiative; OECD (2006) How and Why Should Government Activity Be Measured in ‘Government at a Glance’? 19 OECD (2005) Modernising Government: The way forward. 20 As listed in the draft list of themes to be covered in the ‘Government at a Glance’ publication, provided by the OECD to Involve in January 2009. 21 OECD (2005) Modernising Government: The way forward. 22 www.un.org/en/documents/udhr 23 Mendel, T. (2003) Freedom of Information: A comparative legal survey. 24 Creasy, S. (2008) ‘Introduction: Participation at the core’, in Creasy, S. (ed) Participation Nation: Reconnecting citizens to the public realm. London: Involve; Fennel, E., Gavelin, K. and Wilson, R. (2008) Better Together: Improving consultation with the third sector. London: Cabinet Office, 21–2. 25 See for example: Mendel, T. (2003) Freedom of Information: A comparative legal survey; Neuman, L. (2009) Enforcement Models: Content and context; Universal Declaration of Human Rights at www.un.org/en/documents/udhr 26 Mendel, T. (2003) Freedom of Information: A comparative legal survey; Neuman, L. (2009) Enforcement Models: Content and context; OECD (2005) Effective Open Government: Improving public access to government information. 27 OECD (2005) Effective Open Government: Improving Public Access to Government Information; Islam, R. (2003) Do More Transparent Governments Govern Better? Policy Research Working Paper. Washington, DC: World Bank Institute; Neuman, L. (2009) Enforcement Models: Content and context; Neuman, L. and Calland, R. (200?) Making the Access to Information Law Work: The challenges of implementation. 28 Islam, R. (2003) Do More Transparent Governments Govern Better? 29 OECD (2005) Modernising Government: The way forward. 30 Neuman, L. (2009) Enforcement Models: Content and context; Neuman, L. and Calland, R. (200?) Making the Access to Information Law Work: The challenges of implementation; OECD (2005) Modernising Government: The way forward. 31 OECD (2005) Modernising Government: The way forward. 32 Cited in OECD (2005) Effective Open Government: Improving public access to government information. 33 Neuman, L. and Calland, R. (200?) Making the Access to Information Law Work: The challenges of implementation. 34 See for example Communities and Local Government (2008) Predictors of Community Cohesion – Multi-level modelling of the 2005 Citizenship Survey. Wetherby: CLG; Creasy, S., Gavelin, K. and Potter, D. (2008) Everybody Needs Good Neighbours? A study of the link between public participation and community cohesion. London: Involve; Ipsos Mori (2007) What Works in Community Cohesion? London: Ipsos Mori; Ray, K. et al. (2008) Public Officials and Community Involvement in Local Services. York: Joseph Rowntree Foundation; Richardson, L. (2008) DIY Community Action: Neighbourhood problems and community self-help. Bristol: Policy Press; Skidmore, P. et al. (2007) Community Participation: Who benefits? York: Joseph Rowntree Foundation. 35 Islam, R. (2003) Do More Transparent Governments Govern Better?; OECD (2005) Modernising Government: The way forward. 36 Neuman, L. (2009) Enforcement Models: Content and Context; OECD (2005) Modernising Government: The way forward. 37 International Budget Partnership (2009) Open Budgets Transform Lives: The Open Budget Survey 2008. Washington, DC: International Budget Partnership; Neuman, L. (2009) Enforcement Models: Content and context; OECD (2005) Effective Open Government: Improving public access to government information; OECD (2005) Modernising Government: The way forward. 38 Bookman, Z. and Guerrero Amparan, J.-P. (2009) ‘Two Steps Forward, One Step Back: Assessing the implementation of Mexico’s Freedom of Information Act’, Mexican Law Review, Vol 1, No 2, January–June; Neuman, L. and Calland, R. (200?) Making the Access to Information Law Work: The challenges of implementation; Transparency & Silence: A survey of access to information laws and practices in fourteen countries. 39 The countries were Argentina, Armenia, Bulgaria, Chile, France, Ghana, Kenya, Macedonia, Mexico, Nigeria, Peru, Romania, South Africa and Spain. See Transparency & Silence: A survey of access to information laws and practices in fourteen countries.
28
40 Gavelin, K., Wilson, R. and Doubleday, R. (2007) Democratic Technologies? London: Involve; Creasy, S., Gavelin, K. and Potter, D. (2008) Everybody Needs Good Neighbours? A study of the link between public participation and community cohesion. 41 Warburton, D., Wilson, R. and Rainbow, E. (2007) Making a Difference: Evaluating public participation. London: Department for Constitutional Affairs. 42 In the UK, the Campaign for Freedom of Information lobbied for a stated purpose to be included in the Freedom of Information Act to provide a shared reference point for officials and users. The campaign failed and no such purpose was included in the UK legislation but it has been elsewhere, for example in the New Zealand Official Information Act 1982. See: www.justice.govt.nz/pubs/other/pamphlets/2001/info_act.html 43 OECD (2005) Modernising Government: The way forward. 44 Neuman, L. and Calland, R. (200?) Making the Access to Information Law Work: The challenges of implementation. 45 For example Mexico and the UK. 46 http://info.worldbank.org/governance/wgi/index.asp 47 www.odi.org.uk/projects/00-07-world-governance-assessment/Index.html 48 www.idea.int/resources 49 www.transparency.org/policy_research/surveys_indices/cpi 50 www.oneworldtrust.org/index.php?option=com_content&view=article&id=73&Itemid=60 51 Ivanyna, M. and Shah, A. (2009) ‘Citizen-centric Governance Indicators: Measuring and monitoring governance by listening to the people and not the interest groups‘, Economics, 2009-27, 2 June. 52 International IDEA (2008) Assessing the Quality of Democracy: An overview of the International IDEA Framework. Stockholm: International IDEA. 53 See for example a UK study from 2004, which found a ‘perception gap‘ over public services – a divergence between the personal experience people report (often positive) and their views of the trend in the quality of services generally (disproportionally negative). Duffy, B. and Cole, H. (2005) ‘Before and After’, Prospect Magazine, April, www.ipsos-mori.com/researchpublications/researcharchive/poll.aspx?oItemId=750; see also Tailor, M. (2008) ‘Why Life is Good’, New Statesman, January, www.newstatesman.com/philosophy/2008/01/social-society-world-public. 54 Mendel, T. (2003) Freedom of Information: A comparative legal survey; OECD (2005) Effective Open Government: Improving public access to government information. 55 Neuman, L. and Calland, R. (200?) Making the Access to Information Law Work: The challenges of implementation. 56 Ibid. 57 Mendel, T. (2003) Freedom of Information: A comparative legal survey; OECD (2005) Effective Open Government: Improving public access to government information; Neuman, L. and Calland, R. (200?) Making the Access to Information Law Work: The challenges of implementation. 58 Ibid. 59 Mendel, T. (2003) Freedom of Information: A comparative legal survey. 60 Obama, B. (2009) ‘Transparency and Open Government’. 61 OECD (2005) Effective Open Government: Improving public access to government information. 62 Mendel, T. (2003) Freedom of Information: A comparative legal survey; OECD (2005) Effective Open Government: Improving public access to government information; Neuman, L. and Calland, R. (200?) Making the Access to Information Law Work: The challenges of implementation. 63 Neuman, L. and Calland, R. (200?) Making the Access to Information Law Work: The challenges of implementation. 64 Neuman, L. (2009) Enforcement Models: Content and context. 65 Not all Ombudsman/Information Commissioner institutions have the power to issue binding orders. Some that do include the Information Commissioners in Mexico, Scotland and Slovenia. 66 E.g. South Africa, Bulgaria and the USA at Federal Level. For a discussion about the benefits and disadvantages of each model, see Neuman, L. (2009) Enforcement Models: Content and context; OECD (2005) Effective Open Government: Improving public access to government information. 67 International Budget Partnership (2009) Open Budgets Transform Lives: The Open Budget Survey 2008, 4, 5, 27; International Organisation of Supreme Audit Institutions (INTOSupreme Audit Institution) (1977) Lima Declaration of Guidelines on Auditing Precept. Lima: INTOSupreme Audit Institution; Neuman, L. (2009) Enforcement Models: Content and context. 68 International Budget Partnership (2009) Open Budgets Transform Lives: The Open Budget Survey 2008, 32. 69 Ibid., 33. 70 Neuman, L. (2009) Enforcement Models: Content and context. 71 Islam, R. (2003) Do More Transparent Governments Govern Better?; Neuman, L. and Calland, R. (200?) Making the Access to Information Law Work: The challenges of implementation; Regeringskansliet (2008) Öppna Sverige – För en öppen offentlig förvaltning. Stockholm: Regeringskansliet (Government Offices of Sweden). 72 International Budget Partnership (2009) Open Budgets Transform Lives: The Open Budget Survey 2008; Neuman, L. and Calland, R. (200?) Making the Access to Information Law Work: The challenges of implementation; Transparency & Silence: A survey of access to information laws and practices in fourteen countries. 73 Those are indicators 1.4, 1.6, 2.3 and 3.2.
29
Bibliography
Article 19 (2009) The Camden Principles on Freedom of Expression and Equality. London: Article 19.
Banisar, D. (2006) Freedom of Information Around the World 2006. London: Privacy International.
Beetham, D., Bracking, S., Kearton, I. and Weir, S. (2001) International IDEA Handbook on Democracy Assessment. The Hague: Kluwer Law International.
Bookman, Z. and Guerrero Amparan, J.-P. (2009) ‘Two Steps Forward, One Step Back: Assessing the implementation of Mexico’s Freedom of Information Act’, Mexican Law Review, Vol 1, No 2 January–June.
Bourgon, J. (2008) ‘New Directions in Public Administration: Serving beyond the predictable’, keynote address at PAC Conference.
Brown, G. (2007) House of Commons Debate, Hansard, 3 July, Column 815.
Caddy, J. (2005) Open Government Indicators – IID/GOV Discussion note 16 December 2005.
Caddy, J. (2009, in press) XIII. Open Government – draft chapter for ‘Government at a Glance’ publication.
Centre for Democracy and Governance (1998) Handbook of Democracy and Governance Program Indicator. Washington, DC: US Agency for International Development.
Communities and Local Government (2008) Predictors of Community Cohesion – Multi-level modelling of the 2005 Citizenship Survey. Wetherby: CLG.
Creasy, S. (2008) ‘Introduction: Participation at the core’, in Creasy, S. (ed.) Participation Nation: Reconnecting Citizens to the Public Realm. London: Involve.
Creasy, S., Gavelin, K. and Potter, D. (2008) Everybody Needs Good Neighbours? A study of the link between public participation and community cohesion. London: Involve.
Duffy, B. and Cole, H. (2005) ‘Before and After’, Prospect Magazine, April, www.ipsos-mori.com/researchpublications/researcharchive/poll.aspx?oItemId=750
Fennell, E. and Gavelin, K. (2009) Participatory Budgeting and the Arts: Research for Arts Council England. London: Involve.
Fennel, E., Gavelin, K. and Wilson, R. (2008) Better Together: Improving consultation with the third sector. London: Cabinet Office.
Gavelin, K., Wilson, R. and Doubleday, R. (2007) Democratic Technologies? London: Involve.
Hazell, R. (2007) ‘Freedom of Information in Australia, Canada and New Zealand’, Public Administration, 67(2), 189–210.
Hyden, G., Court, J. and Mease, K. (2004) Making Sense of Governance: Empirical evidence from 16 developing countries. London: Lynne Rienner Publishers.
International Budget Partnership (2009) Open Budgets Transform Lives: The Open Budget Survey 2008. Washington, DC: The International Budget Partnership.

30
International IDEA (2001) Democracy Assessment: The basics of the international IDEA Assessment Framework. Stockholm: International IDEA.
International IDEA (2008) Assessing the Quality of Democracy: An overview of the international IDEA Framework. Stockholm: International IDEA.
International Organisation of Supreme Audit Institutions (INTOSupreme Audit Institution) (1977) Lima Declaration of Guidelines on Auditing Precept. Lima: INTOSupreme Audit Institution.
Ipsos Mori (2007) What Works in Community Cohesion? London: Ipsos Mori.
Islam, R. (2003) Do More Transparent Governments Govern Better? Policy Research Working Paper. Washington, DC: World Bank Institute.
Ivanyna, M. and Shah, A. (2009) ‘Citizen-centric Governance Indicators: Measuring and monitoring governance by listening to the people and not the interest groups’, Economics, 2009-27, 2 June.
Lonti, Z. and M. Woods (2008), ‘Towards Government at a Glance: Identification of core data and issues related to public sector efficiency’, OECD Working Papers on Public Governance 7. Paris: OECD Publishing.
Mayo, E. and Steinberg, T. (2007) The Power of Information: An independent review. London: Cabinet Office.
Mendel, T. (2003) Freedom of Information: A comparative legal survey. New Delhi: UNESCO.
Network for Affirmation of NGO Sector (MANS) (no date) Draft Indicators – Freedom of information legislation and enforcement.
Neuman, L. (2009) Enforcement Models: Content and context. Washington, DC: International Bank for Reconstruction and Development and World Bank.
Neuman, L. and Calland, R. (200?) Making the Access to Information Law Work: The challenges of implementation. Atlanta: The Carter Centre.
Obama, B. (2009) ‘Transparency and Open Government’, Presidential Memorandum, Federal Register, 74(15), 26 January.
OECD (2001) Citizens as Partners: Information, consultation and public participation in policy-making. Paris: OECD Publishing.
OECD (2003) The E-government Imperative: Main findings. Paris: OECD Publishing.
OECD (2003) Open Government: Fostering Dialogue with Civil Society. Paris: OECD Publishing.
OECD (2005) Effective Open Government: Improving public access to government information. Paris: OECD Publishing.
OECD (2005) Evaluating Public Participation in Policy Making. Paris: OECD Publishing. OECD (2005) Management in Government: Feasibility report on the development of comparative data. Paris: OECD Publishing. OECD (2005) Modernising Government: The way forward. Paris: OECD Publishing.
OECD (2005) Policy Brief: Modernising Government: The way forward. Paris: OECD Publishing.

31
OECD (2006) How and Why Should Government Activity Be Measured in ‘Government at a Glance’? OECD GOV Technical Paper 1. Paris: OECD Publishing.
OECD (2007), ‘Towards Better Measurement of Government’, OECD Working Papers on Public Governance, 2007/1. Paris: OECD Publishing.
OECD (2009) ‘Integrity in Government: Towards output and outcome measurement’, paper presented to the Expert Group on Conflict of Interest, OECD Conference Centre, 5 May.
One World Trust (2005) Pathways to Accountability: The GAP Framework. London: One World Trust.
Open Society Justice Initiative (2006) Transparency & Silence: A survey of access to information laws and practices in fourteen countries. New York: Open Society Justice Initiative.
Open Society Justice Initiative (2006) Transparency & Silence: An overview. New York: Open Society Justice Initiative.
Pope, J. (2003) ‘Access to Information: Who’s right and whose information?’, Global Corruption Report 2003.
Ray, K. et al. (2008) Public Officials and Community Involvement in Local Services. York: Joseph Rowntree Foundation.
Regeringskansliet (2008) Öppna Sverige – För en öppen offentlig förvaltning. Stockholm: Regeringskansliet (Government Offices of Sweden).
Richardson, L. (2008) DIY Community Action: Neighbourhood problems and community self-help. Bristol: Policy Press.
Santiso, C. (2008) ‘Eyes Wide Shut? Reforming and defusing checks and balance in Argentina’, Public Administration and Development, 28, 67–84.
Save the Children UK (2005) Beyond the Rhetoric: Measuring revenue transparency. London: Save the Children UK.
Skidmore, P. et al. (2007) Community Participation: Who benefits? York: Joseph Rowntree Foundation.
Tailor, M. (2008) ‘Why Life is Good’, New Statesman, January, www.newstatesman.com/philosophy/2008/01/social-society-world-public.
UNDP (2003) Sources for Democratic Governance Indicators. New York: United Nations Development Programme.
UNDP (2006) Governance Indicators: A user’s guide, 2nd ed. New York: United Nations Development Programme.
Warburton, D., Wilson, R. and Rainbow, E. (2007) Making a Difference: Evaluating public participation. London: Department for Constitutional Affairs.
Welsh Assembly Government (2008) Report on the Implementation of Open Government Legislation and Policies during 2007. Cardiff: Welsh Assembly Government.
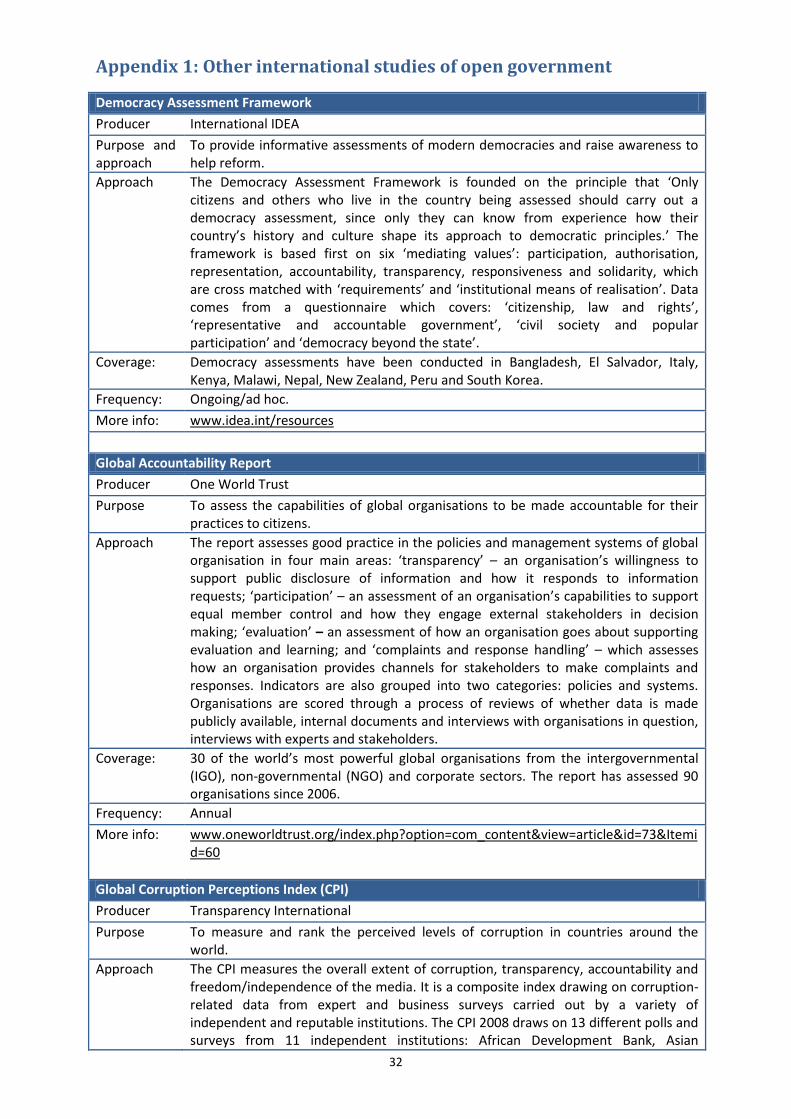
32
Appendix 1: Other international studies of open government
Democracy Assessment Framework
Producer International IDEA
Purpose and approach
To provide informative assessments of modern democracies and raise awareness to help reform.
Approach The Democracy Assessment Framework is founded on the principle that ‘Only citizens and others who live in the country being assessed should carry out a democracy assessment, since only they can know from experience how their country’s history and culture shape its approach to democratic principles.’ The framework is based first on six ‘mediating values’: participation, authorisation, representation, accountability, transparency, responsiveness and solidarity, which are cross matched with ‘requirements’ and ‘institutional means of realisation’. Data comes from a questionnaire which covers: ‘citizenship, law and rights’, ‘representative and accountable government’, ‘civil society and popular participation’ and ‘democracy beyond the state’.
Coverage: Democracy assessments have been conducted in Bangladesh, El Salvador, Italy, Kenya, Malawi, Nepal, New Zealand, Peru and South Korea.
Frequency: Ongoing/ad hoc.
More info: www.idea.int/resources
Global Accountability Report
Producer One World Trust
Purpose To assess the capabilities of global organisations to be made accountable for their practices to citizens.
Approach The report assesses good practice in the policies and management systems of global organisation in four main areas: ‘transparency’ – an organisation’s willingness to support public disclosure of information and how it responds to information requests; ‘participation’ – an assessment of an organisation’s capabilities to support equal member control and how they engage external stakeholders in decision making; ‘evaluation’ – an assessment of how an organisation goes about supporting evaluation and learning; and ‘complaints and response handling’ – which assesses how an organisation provides channels for stakeholders to make complaints and responses. Indicators are also grouped into two categories: policies and systems. Organisations are scored through a process of reviews of whether data is made publicly available, internal documents and interviews with organisations in question, interviews with experts and stakeholders.
Coverage: 30 of the world’s most powerful global organisations from the intergovernmental (IGO), non-governmental (NGO) and corporate sectors. The report has assessed 90 organisations since 2006.
Frequency: Annual
More info: www.oneworldtrust.org/index.php?option=com_content&view=article&id=73&Itemid=60
Global Corruption Perceptions Index (CPI)
Producer Transparency International
Purpose To measure and rank the perceived levels of corruption in countries around the world.
Approach The CPI measures the overall extent of corruption, transparency, accountability and freedom/independence of the media. It is a composite index drawing on corruption-related data from expert and business surveys carried out by a variety of independent and reputable institutions. The CPI 2008 draws on 13 different polls and surveys from 11 independent institutions: African Development Bank, Asian

33
Development Bank, Bertelsmann Economist Intelligence Unit, Freedom House Nations, Global Insight, International Institute for Management Development, Merchant International Group, Political and Economic Risk Consultancy, Transformation Index, World Bank and World Economic Forum.
Coverage: The CPI 2008 ranks 180 countries around the world.
Frequency: Annual
More info: www.transparency.org/policy_research/surveys_indices/cpi
Global Integrity Index
Producer Global Integrity
Purpose The Global Integrity Index exists to measure the level and effectiveness of anti-corruption mechanisms on a national scale per country.
Approach The Global Integrity Index does not measure corruption itself but focuses on the mechanisms intended to prevent it: accountability, transparency and citizen oversight. It looks at what access citizens have to their government, the ability to monitor its behaviour, and how to improve and change governance. The data for the Global Integrity Index is compiled through Global Integrity’s ‘integrity indicators’ from a researcher inside each country. An individual scorecard examines the existence of ‘public integrity mechanisms’, such as laws and institutions, the effectiveness of mechanisms and the access to which citizens have to them. For the 2008 report the integrity indicators were divided into seven categories (with 23 sub-categories): civil society, public information and media, elections, government accountability, administration and civil service, oversight and regulation, and anti-corruption and rule of law.
Coverage: 58 countries were assessed in the 2008 report. The highest concentration was in Europe (15) and Sub-Saharan Africa (12).
Frequency: Annual
More info: http://report.globalintegrity.org/globalIndex.cfm
National Integrity System Assessment Tool
Producer Transparency International
Purpose To analyse the extent and causes of corruption in a given country and the effectiveness of national anti-corruption efforts.
Approach Analysis is carried out using a consultative approach, involving the key anti-corruption agents in government, civil society, the business community and other relevant sectors with a view to building momentum, political will and civic pressure for relevant reform initiatives.
Coverage: More than 70 country assessments have been carried out since 2001.
Frequency: Ongoing/ad hoc
More info: www.transparency.org/policy_research/nis
The Open Budget Survey
Producer The Open Budget Initiative
Purpose To analyse and evaluate the extent to which governments give citizens access to budget information and opportunities to participate in the budget process.
Approach The survey identifies and evaluates accountability in budgeting practices as well as providing comparative data on the public availability of budget information. The data comes from a questionnaire that contains 123 questions. The questionnaire contains both multiple-choice and open-ended questions on how budget documents are made available. The questions were split into three different sections, about: the availability of budgetary information, the annual budget proposal and relevant information, and the budget process. Each country was assigned a score based on
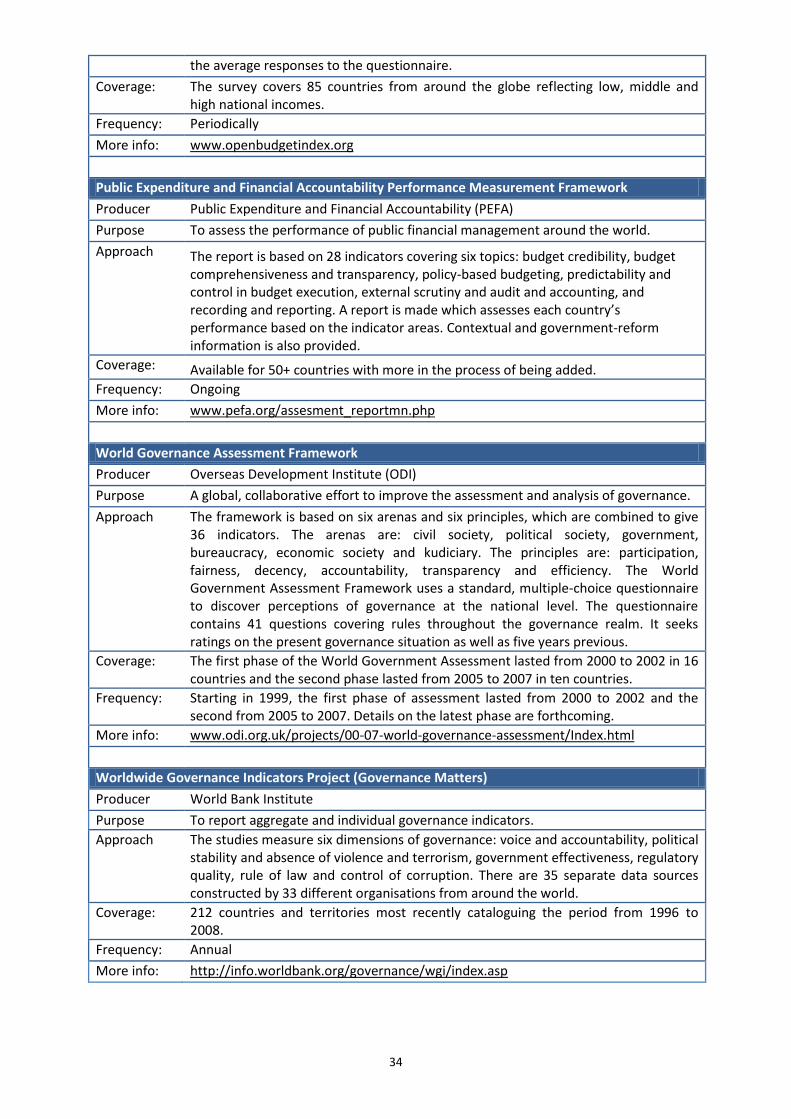
34
the average responses to the questionnaire.
Coverage: The survey covers 85 countries from around the globe reflecting low, middle and high national incomes.
Frequency: Periodically
More info: www.openbudgetindex.org
Public Expenditure and Financial Accountability Performance Measurement Framework
Producer Public Expenditure and Financial Accountability (PEFA)
Purpose To assess the performance of public financial management around the world.
Approach The report is based on 28 indicators covering six topics: budget credibility, budget comprehensiveness and transparency, policy-based budgeting, predictability and control in budget execution, external scrutiny and audit and accounting, and recording and reporting. A report is made which assesses each country’s performance based on the indicator areas. Contextual and government-reform information is also provided.
Coverage: Available for 50+ countries with more in the process of being added.
Frequency: Ongoing
More info: www.pefa.org/assesment_reportmn.php
World Governance Assessment Framework
Producer Overseas Development Institute (ODI)
Purpose A global, collaborative effort to improve the assessment and analysis of governance.
Approach The framework is based on six arenas and six principles, which are combined to give 36 indicators. The arenas are: civil society, political society, government, bureaucracy, economic society and kudiciary. The principles are: participation, fairness, decency, accountability, transparency and efficiency. The World Government Assessment Framework uses a standard, multiple-choice questionnaire to discover perceptions of governance at the national level. The questionnaire contains 41 questions covering rules throughout the governance realm. It seeks ratings on the present governance situation as well as five years previous.
Coverage: The first phase of the World Government Assessment lasted from 2000 to 2002 in 16 countries and the second phase lasted from 2005 to 2007 in ten countries.
Frequency: Starting in 1999, the first phase of assessment lasted from 2000 to 2002 and the second from 2005 to 2007. Details on the latest phase are forthcoming.
More info: www.odi.org.uk/projects/00-07-world-governance-assessment/Index.html
Worldwide Governance Indicators Project (Governance Matters)
Producer World Bank Institute
Purpose To report aggregate and individual governance indicators.
Approach The studies measure six dimensions of governance: voice and accountability, political stability and absence of violence and terrorism, government effectiveness, regulatory quality, rule of law and control of corruption. There are 35 separate data sources constructed by 33 different organisations from around the world.
Coverage: 212 countries and territories most recently cataloguing the period from 1996 to 2008.
Frequency: Annual
More info: http://info.worldbank.org/governance/wgi/index.asp
35
Appendix 2: Approach
This document was produced by Involve for the OECD. The drafting of the paper was informed by the following activities:
a review of the existing academic and policy literature on open government, with particular focus on existing indicators and sources of comparative data on open government
correspondence with a group of 22 peer reviewers (listed on page 7) who were given the opportunity to read and respond to drafts of this paper via email and online
five telephone interviews with members of the peer review group. These activities, which took place between February-June 2009 generated an initial list of over 60 potential indicators and sub-indicators, which were amalgamated into a series of top-level indicators each with a series of sub-indicators. These top level indicators were then narrowed down to the 17 presented in section 5 of this paper. The longlisted indicators were selected on the basis of four criteria:
relevance to the purpose of this paper – that the indicator contributes to building a deeper understanding of the scope and impact of the institutions, laws and policies intended to support open government
comparability – that the indicator is useable across different cultural and bureaucratic contexts, is clearly defined and unambiguous
reliability – that the indicator measures what it purports to measure
feasibility – that the datasets must be readily accessible or, if not already available, must be relatively easily pulled together by OECD member countries.

SAFEGUARDING THE RIGHT TO INFORMATION
Report of the People’s RTI Assessment 2008
EXECUTIVE SUMMARY
RTI Assessment & Analysis Group (RaaG) and
National Campaign for People’s Right to Information (NCPRI)
July 2009

2
COLLABORATING INSTITUTIONS
ASHA, Varanasi Association for Democratic Reforms, Bangalore Centre of Action Research and Documentation (CARD), Bhubaneshwar Centre for the Study of Developing Societies (CSDS), Delhi JANPATH, Ahmedabad Meghalaya RTI Movement, Shillong Nehru Memorial Mueseum and Library, New Delhi North Eastern Network, Guwahati School for Democracy, Jaipur Tata Institute of Social Sciences (TISS), Mumbai United Forum for RTI Campaign, Hyderabad
STATE CO-ORDINATORS
Andhra Pradesh: Sowmya Kidambi, Rakesh Reddy Dubbudu, B. Ramakrishna Raju Assam: Partha Ganguli, Monisha Behl, Samhita Barhooah, Luke Rongphar Delhi: Anjali Bhardawaj Gujarat: Pankti Jog, Sadhna Pandya Karnataka: Anil Bairwal, N. Vikram Simha, Sandeep Shastri, Sridhar Pabisetty, Aradhana Janga Maharashtra: Priyanka Varma, Vandana Bhatia Meghalaya: Angela Rangad, S.Shanlang Kharbuli Orissa: Manju Prava Dhal, Jimuta Prasad Mishra Rajasthan: Nikhil Dey, Kamal Tank Uttar Pradesh: Jayshankar Pandey, Vallabhacharya Pandey, Naveen Tiwari West Bengal: Kallol Chakrabarty
TEAM LEADERS
Ankita Anand – Case Studies Bincy Thomas – Filing and Tracking of RTIs Chandini Luthra – Case Studies Malika Malhotra – Filing and Tracking RTIs, Information Commissions Misha Singh- Competent Authorities Prashant Sharma- Urban Survey Premila Nazareth – Media, International Organisations, Section 4 Ruby Singh- Filing and Tracking RTIs, Information Commissions Raman Mehta – Data Management Salim Ahmed - Administration Soham Sen – Information Commissions, Database Suchi Pande – Competent Authorities Vishaish Uppal – Rural Survey Yamini Aiyar – Urban Survey, International Experience, Data Management
STUDY CO-ORDINATORS
Premila Nazareth, Shekhar Singh, Vishaish Uppal, Yamini Aiyar
3
TABLE OF CONTENTS METHODOLOGY AND COVERAGE ......................................................................................... 4
Primary data collection ................................................................................................................ 4
Scope and Coverage .................................................................................................................... 4
SUMMARY OF FINDINGS .......................................................................................................... 7
RTI and the Public ....................................................................................................................... 7
Information Commissions ......................................................................................................... 14
Government and the RTI ........................................................................................................... 20
Media and the RTI ..................................................................................................................... 23
NGOs and the RTI ..................................................................................................................... 25
Perceptions and Suggestions about the RTI Regime ................................................................ 26
This assessment was financially supported to a great extent by a grant made by Google.org to Shekhar Singh

4
METHODOLOGY AND COVERAGE
The goal of this assessment is to ascertain how India’s nascent right to information regime might be further strengthened.
PRIMARY DATA COLLECTION • Over 17,000 persons were individually interviewed across ten states and the National
Capital Region of Delhi, including over 1000 PIOs and heads of offices/departments.
• 630 focus group discussions organised. Of these
o 487 in 240 sample villages in 30 districts of the ten sample states.
o 143 focus group discussions in four municipal wards in each of the 30 district
headquarters
o Nearly 19,000 people participated in these focal group discussions (FGDs).
In total, over 35,000 people were interviewed, in villages, towns and cities across ten states
and Delhi.
• 1027 public authorities’ offices were inspected both in the rural and urban areas.
Over 800 RTI applications were filed in various public authorities across the country.
• Data regarding over 25,000 RTI applications analysed.
• Over 60 papers and magazines, in English, Hindi and six regional languages analysed for
content and coverage.
• Over 5000 case studies extracted, depicting successes, failures and peculiarities of the
RTI regime.
SCOPE AND COVERAGE • Sample comprised 10 states and Delhi, with 3 districts in each state and 8 villages in each
district selected randomly.
1. Assam – Dibrugarh, Karbi Anglong, Nalbari
2. Andhra Pradesh – Ananthapur, Nalgonda, Visakhapatnam
3. Gujarat – Kutch, Narmada, Mahesaha
4. Karnataka – Bijapur, Dakshin Kannada, Haveri
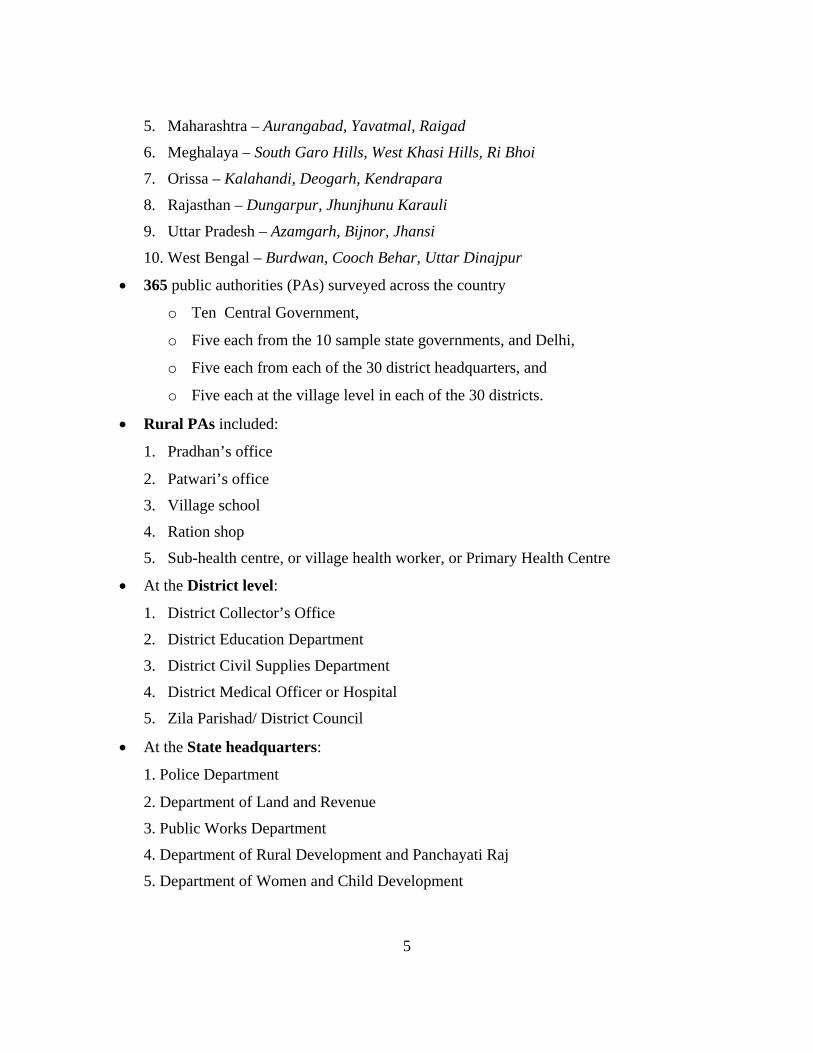
5
5. Maharashtra – Aurangabad, Yavatmal, Raigad
6. Meghalaya – South Garo Hills, West Khasi Hills, Ri Bhoi
7. Orissa – Kalahandi, Deogarh, Kendrapara
8. Rajasthan – Dungarpur, Jhunjhunu Karauli
9. Uttar Pradesh – Azamgarh, Bijnor, Jhansi
10. West Bengal – Burdwan, Cooch Behar, Uttar Dinajpur
• 365 public authorities (PAs) surveyed across the country
o Ten Central Government,
o Five each from the 10 sample state governments, and Delhi,
o Five each from each of the 30 district headquarters, and
o Five each at the village level in each of the 30 districts.
• Rural PAs included:
1. Pradhan’s office
2. Patwari’s office
3. Village school
4. Ration shop
5. Sub-health centre, or village health worker, or Primary Health Centre
• At the District level:
1. District Collector’s Office
2. District Education Department
3. District Civil Supplies Department
4. District Medical Officer or Hospital
5. Zila Parishad/ District Council
• At the State headquarters:
1. Police Department
2. Department of Land and Revenue
3. Public Works Department
4. Department of Rural Development and Panchayati Raj
5. Department of Women and Child Development

6
• Ten Central Government public authorities were:
1. Ministry of Home Affairs
2. Directorate-General of Foreign Trade
3. Ministry of External Affairs
4. Ministry of Environment and Forests
5. Ministry of Culture
6. Department of Disinvestment
7. Ministry of Agriculture
8. Ministry of Railways
9. National Commission on Backward Classes
10. Department of Personnel and Training

7
SUMMARY OF FINDINGS
RTI AND THE PUBLIC Awareness
• Nearly 65% of the randomly selected inhabitants of ten state headquarters, and Delhi,
stated that access to information, especially government information, would significantly
help them solve many of their basic problems.
• In rural areas and district headquarters the overall percentage was similar, with nearly
65% of the FGDs concluding that access to information was helpful.
The justification and rationale for the RTI Act is not the demand for the act (as many might not
have yet heard of it, or know how to use it), but the demand for information, especially as a means
of empowerment to address some of the basic problems facing the people.
• 45% of our randomly selected urban respondents (from state capitals and the national
capital) claimed that they knew about the RTI Act. In nearly 40% of the over 140 FGDs
in district headquarters, at least one or more person knew about the RTI Act. However,
in only 20% of the over 400 FGDs organized in villages was there even a single person
who knew about the RTI Act.
• In the rural areas, most people got to know about the RTI Act through news papers
(35%), followed by television and radio, and friends and relatives (10% each), and NGOs
(5%).
• Among urban applicants, nearly 30% learnt about the Act from newspapers, 20% from
NGOs and a similar number from the TV, and almost 10% learnt about the RTI Act from
friends and relatives.
• Unfortunately the government was not a major force in raising public awareness about
the RTI Act.
Number of RTI Applications Filed
• An estimated 400,000 applicants from the villages of India filed RTI applications in the
first two and a half years of the RTI Act.

H
• A
y
• D
m
Profile of
• A
ec
ra
• A
ec
ra
• Ngo
Agriculture
Business
Labourer
unemployed
Government
Pvt. sector
Student
Prefessional
House Maker
Domestic
Retired
An estimated
ears of the R
Disturbingly,
males.
of the RTI Ap
Among the ru
conomic we
ation card. N
Among the ur
conomic we
ation card. N
Note: There aovernment s
3
2
3
2
10
4
2
10
10
10
6
7
5
5
2
2
2
0 5
O
d 1.6 million
RTI Act.
over 90% o
pplicants
ural particip
aker class of
Nearly 65% h
rban applica
aker class of
Nearly 85% h
are very fewservants are
20
15
15
15
10
Occupat
applications
of the rural ap
pants, about
f society, ha
had above-po
ants, nearly 1
f society, ha
had above-po
w governmene using the R
8
30
15
tion of A
s were filed i
pplicants an
30% of the s
aving a below
overty-line (
15% of the s
aving a below
overty-line (
nt employeesRTI Act. Sur
20
Applicant
in urban are
nd 85% of the
sample appli
w-poverty-lin
(APL) cards
ample applic
w-poverty-lin
(APL) cards
s, discountinrprisingly, th
25 3
ts as a %
as in the firs
e urban appl
icants belong
ne (BPL) or
.
cants belong
ne (BPL) or
.
ng the myth here were ve
30 35
%
st two and a
licants were
ged to the
Antyodaya
ged to the
Antyodaya
that mainlyery few stude
Rural
Urban
half
y ents.

0%
10%
20%
30%
40%
50%
60%
Bel
9%
%
%
%
%
%
%
%
Trib
0%
Illiterate
ow primary
Primary
Middle
Matric
Inter
Graduate
Post-Grad
Higher
15%
bals Sc
S
2%
2%
2%
3%
7
2%
6%
6%
1%
% 5%
Edu
22%
8%
heduled Castes
Social Pro
1
1
7%
%
8%
%
10%
10%
10% 15%
ucational
9
24% 2
s Other Backw
file of App
15%
15%
20% 2
Level of A
23%
ward Castes
plicants
25%
25%
30
25% 30%
Applicants
45%
54%
Others
35%%
35% 40%
s
Rural
Urban
%
rural
Urban

10
0%
1%
25%
30%
25%
20%
1%
10%
20%
35%
20%
10%
0% 5% 10% 15% 20% 25% 30% 35% 40%
0 to 14
15 to 24
25 to 34
35 to 44
45‐54
Over 55
AG
E I
N Y
EA
RS
Age of Applicants
Rural
Urban
Constraints in Filing RTI Applications
• Over 40% of the rural respondents stated that the most important constraint they faced in
exercising their right to information was harassment and threats from officials.
• Nearly 15% of urban respondents cited harassment from officials and uncooperative
officials as the most important constraint.
• In many of the villages across the country there was a threat perception among the
villagers and they were hesitant to file RTI applications even when requested to by the
research team.
• Nearly 30% of the villagers filing RTI applications for us reported that they were
discouraged by the PIO from filing the application.
• Very difficult to get addresses of PIOs, especially for district and sub-district levels.
• There are 88 different sets of RTI rules in India and no one place where they are all
available. Differing rules mean differing amounts of fee to be paid, different modes of
payment and even of filing applications.
• Some states insist on sending even letters in the state’s language, making it impossible
for people from other states to access information (despite section 4(4) of the RTI Act).
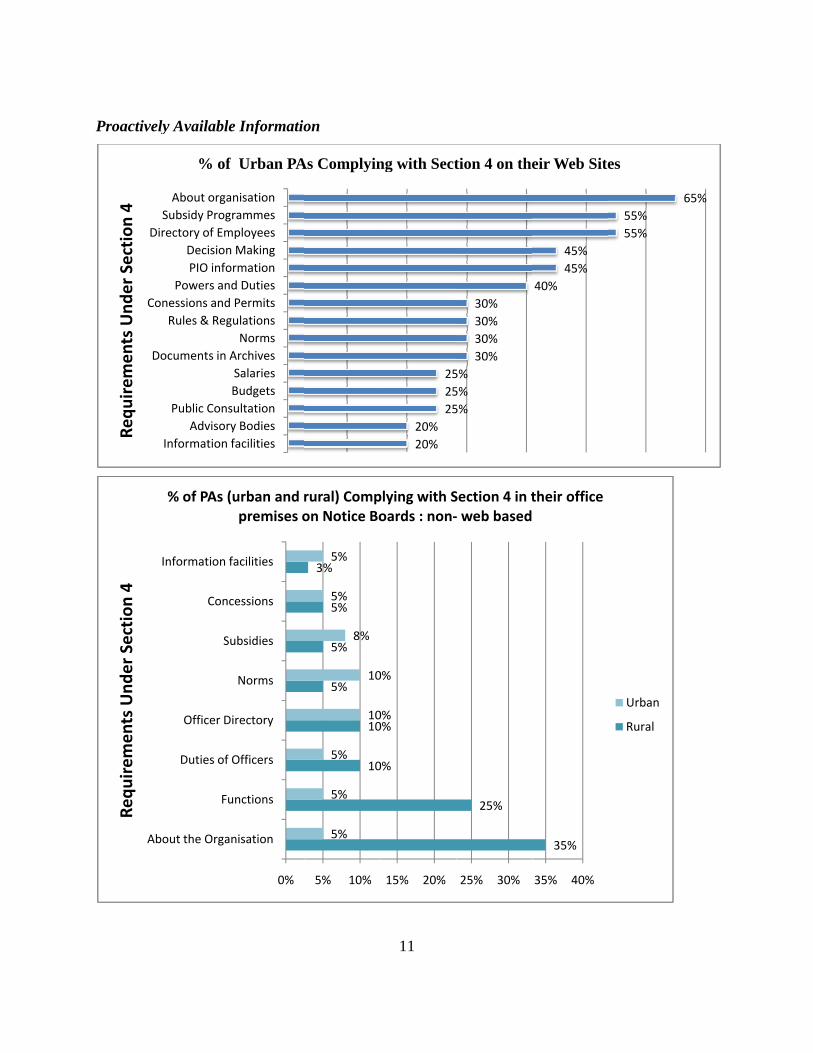
Proactive
C
D
Requ
irem
ents Und
er Section
4
A
Requ
irem
ents Und
er Section
4ely Availabl
Information Advisor
Public Con
Documents in
Rules & RegConessions and
Powers anPIO infoDecision
Directory of EmSubsidy ProgAbout orga
% of
About the Orga
F
Duties of
Officer D
S
Con
Information
% of PAs (
le Informatio
facilitiesry BodiessultationBudgetsSalariesArchivesNorms
gulationsd Permitsnd Dutiesormationn Makingmployeesgrammesanisation
f Urban PA
0%
anisation
unctions
f Officers
Directory
Norms
Subsidies
cessions
facilities
(urban and premises o
on
As Complyin
10
10
5%
5%
5%
3%
5%
5%
5%
10
10
8%
5%
5%
5% 10%
rural) Compon Notice Bo
11
20%20%
252525
ng with Sect
0%
0%0%
0%
15% 20%
plying with Soards : non‐
5%5%5%
30%30%30%30%
tion 4 on the
25%
25% 30%
Section 4 in t‐ web based
40%45%45%
eir Web Site
35%
35% 40%
their office
55%55%
6
es
Urban
Rural
65%

Type of I
Success R
• D
pr
• T
• O
5
Rural ap
Urban ap
0%10%20%30%40%50%60%70%80%90%
Information
Rates
Data supplied
roviding com
The actual ap
Our own expe
5/100. There
pplicants
pplicants
82% 81%
%%%%%%%%%%
Succ
n Sought
d by the gove
mplete inform
pplicants who
erience with
e was, of cou
State, 1.5%
other issues
Inform
%
60% 58%
cess Rate of
ernment ind
mation and h
o were interv
h the RTI app
urse, variatio
State, 15
s, 3.5%
o
mation Sou
12
56% 53%
States/CentrExperienc
icates a succ
half a mark f
viewed repo
plications we
on between s
5%
other issues, 20
ught Rela
49%40% 4
ral Governmce
cess rate of 7
for part info
orted a succe
e filed indica
states (see ta
Personal, 30%
town/village,
town/v
0%
ted to
40%30% 29
ent: Our
70/100, with
rmation.
ss rate of aro
ated a succe
able below).
%
30%
village, 35%
%23%
h a full mark
ound 60/100
ss rate of
for
0.
Personal, 65
5%

• G
• A
re
• O
Impact of
• C
R
il
0%
20%
40%
60%
80%
100%
Government c
Applicants’ d
eceived in tim
Our experienc
of the RTI A
Case studies a
RTI applicati
llustrate can
Full
Som
Not
To What
Did Gett
claimed that
data suggeste
me.
ce suggested
ct
are another s
on has and t
be classified
ly met, 15%
mewhat, 30%
t at all, 55%
Rural
t Extent DidM
Fully Met, 4
Somewhat, 2
Not at all, 4
Rural
ting the Info
t 90% of the
ed that 50%
d 40%.
source of inf
the use that i
d into at leas
d Just the Feet the Inte
40%
20%
0%
ormation AskObj
13
time inform
of the time t
formation re
information
st ten types:
Filing of thnded Objec
ked For Meective
mation was p
that informa
egarding the
can be put to
Fully met
Somewhat
Not at all
Urba
he RTI Apctive
Fully M
Somewh
Not at a
Urb
eet With the
rovided in ti
tion was rec
impact that
o. The types
t, 20%
t, 35%
, 45%
an
pplication
Met, 60%
hat, 20%
all, 20%
ban
e Intended
ime.
ceived, it was
the filing of
s of impacts t
s
f an
they

14
o Ensuring open information is actually open. o Preventing corruption. o Exposing corruption. o Curtailing wasteful public expenditure. o Exposing misuse of power and influence o Accessing justice. o Accessing entitlements. o Redressing grievances. o Supporting good officials. o Empowerment of the Public.
• Over 20% of the rural and 45% of the urban PIOs claimed that changes had been made in
the functioning of their offices because of RTI. Over 60% of these changes pertained to
improving record maintenance, but interestingly in 10% of the rural PAs and 25% of the
urban PAs what had resulted were changes in procedures of functioning and decision
making.
First Appeal
• Our experience was that for over 80% of the 213 first appeals we filed, there was no
response from the first appellate and we either had to go for second appeal or abandon the
case. Another 11% were rejected, and only 9% were allowed partly or wholly.
INFORMATION COMMISSIONS Composition
• Of the one central and 27 state Chief Information Commissioners initially appointed, 23
were retired IAS officers, 3 were retired judges (UP, Bihar and Jharkand), one a retired
IPS officer (Assam), and one a former Member of Parliament (Arunachal Pradesh).
• The first four states to operationalise their information commissions were Karnataka
(July 2005), Madhya Pradesh (August 2005), and Punjab and Maharashtra (October
2005), even before the RTI Act came into full effect. Uttarakhand and the CIC followed
soon after, in October 2005 itself. The last state to set up an information commission was
Arunachal Pradesh, a year after the RTI Act came into effect, in October 2006.

15
Second Appeal/Complaint
• The most important issue regarding many Information Commissions is the delay in
disposing of complaints and appeals. Given below are the data collected on this
aspect of the functioning of the ICs.
3.23.0
2.4 2.32.0
1.5 1.41.2 1.1
0.6 0.6 0.6 0.5 0.4 0.30.1 0.1 0.1 0.1
0
0.5
1
1.5
2
2.5
3
3.5
Appeals/ complaints per 10,000 population

16
Note: zero means less than one.
48140
134696497 6165 3850 3647 3433 2860 2308 2200 1974 394 354 309 289 115 100 89 68 13 6
0
10000
20000
30000
40000
50000
60000
Total Apppeals/Complaints Disposed up to 31.3.08
35747
15718
75453902 3415 1933 1128 779 621 346 122 68 56 40 27 22 17 5 3 0 0
0
5000
10000
15000
20000
25000
30000
35000
40000
Cases (Appeals and Complaints) Pending as of 31.3.08
243
207 198174 172
135117
5539 32 23 12 10 9 6 5 3 1 0 0
0
50
100
150
200
250
300
CIC CHH UTT RAJ GUJ MAH KAR HAR PUN AP WB Goa HP ASS MAN TRI MEG ARU MIZ NAG
Monthly rate of disposal per IC (calculated on the highest rate)
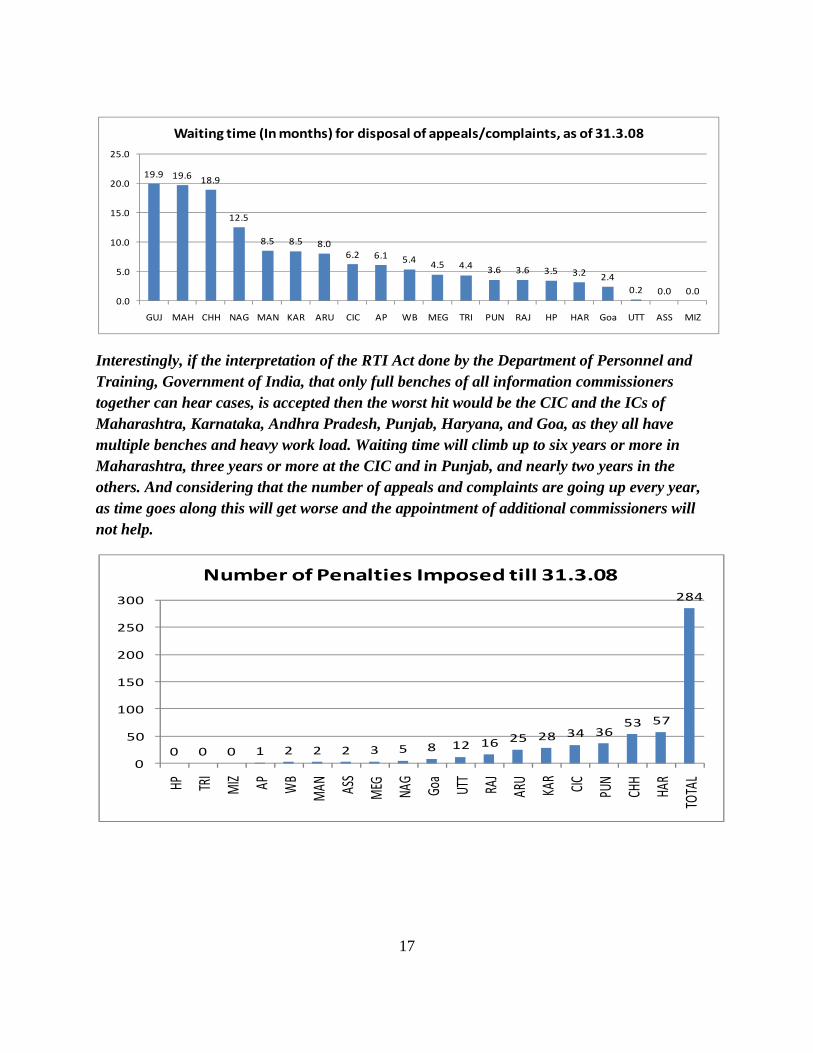
17
Interestingly, if the interpretation of the RTI Act done by the Department of Personnel and Training, Government of India, that only full benches of all information commissioners together can hear cases, is accepted then the worst hit would be the CIC and the ICs of Maharashtra, Karnataka, Andhra Pradesh, Punjab, Haryana, and Goa, as they all have multiple benches and heavy work load. Waiting time will climb up to six years or more in Maharashtra, three years or more at the CIC and in Punjab, and nearly two years in the others. And considering that the number of appeals and complaints are going up every year, as time goes along this will get worse and the appointment of additional commissioners will not help.
19.9 19.6 18.9
12.5
8.5 8.5 8.06.2 6.1 5.4 4.5 4.4 3.6 3.6 3.5 3.2 2.4
0.2 0.0 0.00.0
5.0
10.0
15.0
20.0
25.0
GUJ MAH CHH NAG MAN KAR ARU CIC AP WB MEG TRI PUN RAJ HP HAR Goa UTT ASS MIZ
Waiting time (In months) for disposal of appeals/complaints, as of 31.3.08
0 0 0 1 2 2 2 3 5 8 12 16 25 28 34 3653 57
284
0
50
100
150
200
250
300
HP TRI
MIZ AP WB
MAN ASS
MEG NAG
Goa
UTT
RAJ
ARU
KAR
CIC PUN
CHH
HAR
TOTA
L
Number of Penalties Imposed till 31.3.08
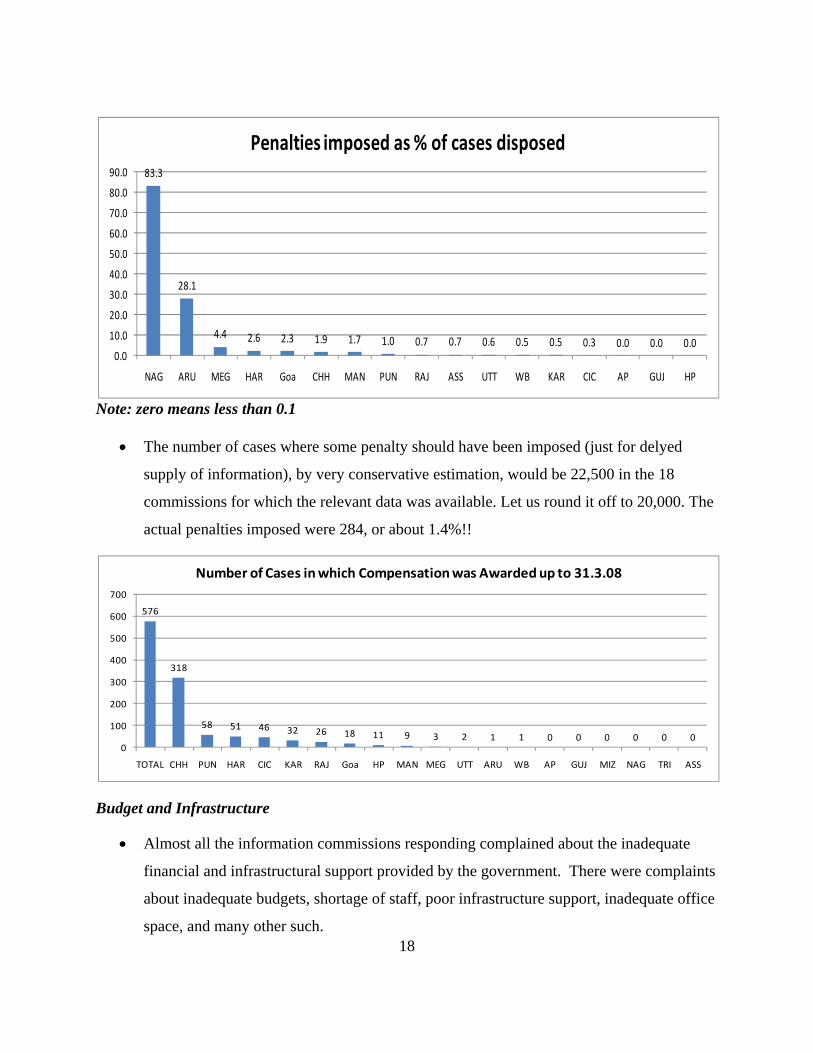
18
Note: zero means less than 0.1
• The number of cases where some penalty should have been imposed (just for delyed
supply of information), by very conservative estimation, would be 22,500 in the 18
commissions for which the relevant data was available. Let us round it off to 20,000. The
actual penalties imposed were 284, or about 1.4%!!
Budget and Infrastructure
• Almost all the information commissions responding complained about the inadequate
financial and infrastructural support provided by the government. There were complaints
about inadequate budgets, shortage of staff, poor infrastructure support, inadequate office
space, and many other such.
83.3
28.1
4.4 2.6 2.3 1.9 1.7 1.0 0.7 0.7 0.6 0.5 0.5 0.3 0.0 0.0 0.00.0
10.0
20.0
30.0
40.0
50.0
60.0
70.0
80.0
90.0
NAG ARU MEG HAR Goa CHH MAN PUN RAJ ASS UTT WB KAR CIC AP GUJ HP
Penalties imposed as % of cases disposed
576
318
58 51 46 32 26 18 11 9 3 2 1 1 0 0 0 0 0 00
100
200
300
400
500
600
700
TOTAL CHH PUN HAR CIC KAR RAJ Goa HP MAN MEG UTT ARU WB AP GUJ MIZ NAG TRI ASS
Number of Cases in which Compensation was Awarded up to 31.3.08

19
Budgets of some Information Commissions State 2005-2006
Budget in Lakhs of Rs.
2006-2007 Budget in Lakhs of Rs
2007-2008 Budget in Lakhs of Rs
Average annual Budget in Lakhs of Rs
Average expenditure per case (Rs.)
Assam 38.51 47.02 38.51 41.35 42,920
Bihar NA 37.64 164.35 100.99 NA
Haryana 26.79 126.00 135.05 95.95 11,306
Karnataka 50.00 100.00 100.00 83.33 3,087
Kerala 100.65 278.74 NA 189.68 NA
Tripura 84.43 127.95 129.46 113.95 280,197
Uttrakhand 100.00 301.79 156.81 186.20 27,736
West Bengal NA 5.28 31.73 18.51 7,172
• Half of the information commissions responding stated that the budgets allocated to them
were not adequate.
• 85% of them thought that the staff sanctioned to them was not adequate.
• A back of the envelope calculation shows the great variance in the staffing patterns of
information commissions.
• Nearly 60% of the commissions did not have what they considered to be adequate
infrastructure.
ICSanctioned Posts No. of cases No. of Ics
No. of cases per post
No. of posts per IC
Assam 31 289 2 9.3 15.5Bihar 67
Haryana 80 2546 2 31.8 40Karnataka 34 8098 3 238.2 11.3
Kerala 48Manipur 0 132 1
Meghalaya 11 71 1 6.5 11Tripura 7 122 1 17.4 7
Uttrakhand 18 2014 1 111.9 18
West Bengal 15516 1 34.4 15
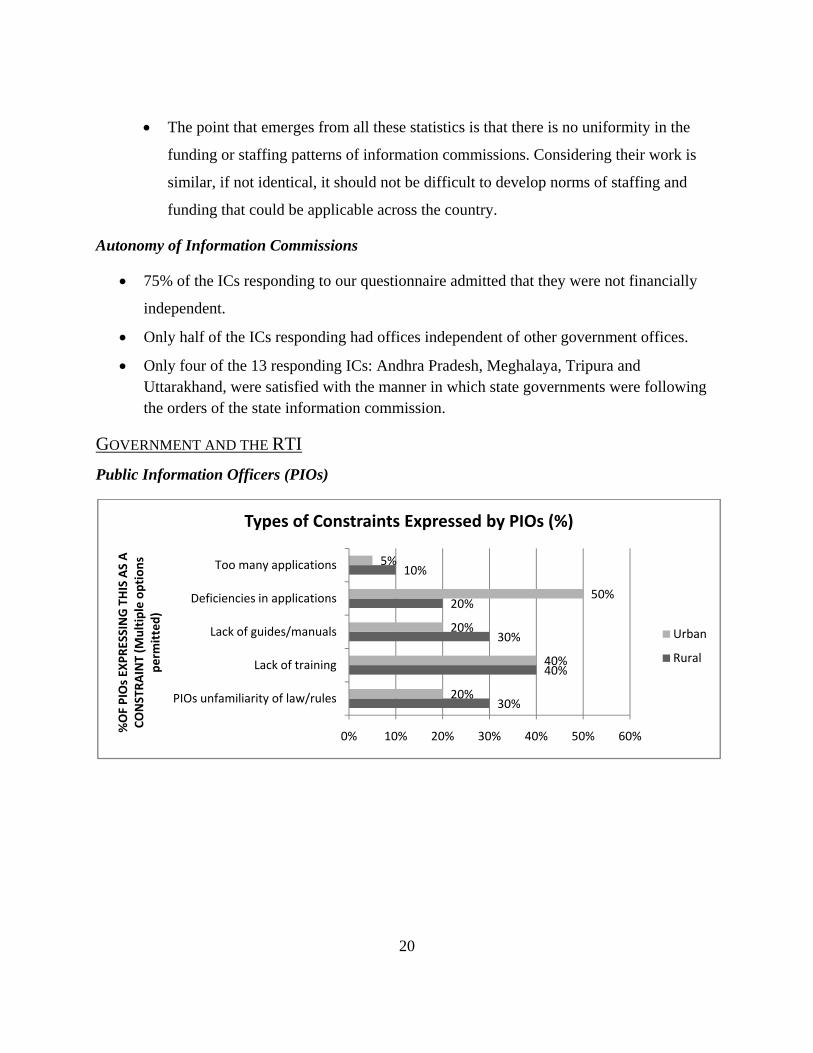
20
• The point that emerges from all these statistics is that there is no uniformity in the
funding or staffing patterns of information commissions. Considering their work is
similar, if not identical, it should not be difficult to develop norms of staffing and
funding that could be applicable across the country.
Autonomy of Information Commissions
• 75% of the ICs responding to our questionnaire admitted that they were not financially
independent.
• Only half of the ICs responding had offices independent of other government offices.
• Only four of the 13 responding ICs: Andhra Pradesh, Meghalaya, Tripura and Uttarakhand, were satisfied with the manner in which state governments were following the orders of the state information commission.
GOVERNMENT AND THE RTI
Public Information Officers (PIOs)
30%
40%
30%
20%
10%
20%
40%
20%
50%
5%
0% 10% 20% 30% 40% 50% 60%
PIOs unfamiliarity of law/rules
Lack of training
Lack of guides/manuals
Deficiencies in applications
Too many applications
%OF PIOs EX
PRESSING THIS AS A
CONSTRA
INT (M
ultiple op
tion
s pe
rmitted)
Types of Constraints Expressed by PIOs (%)
Urban
Rural
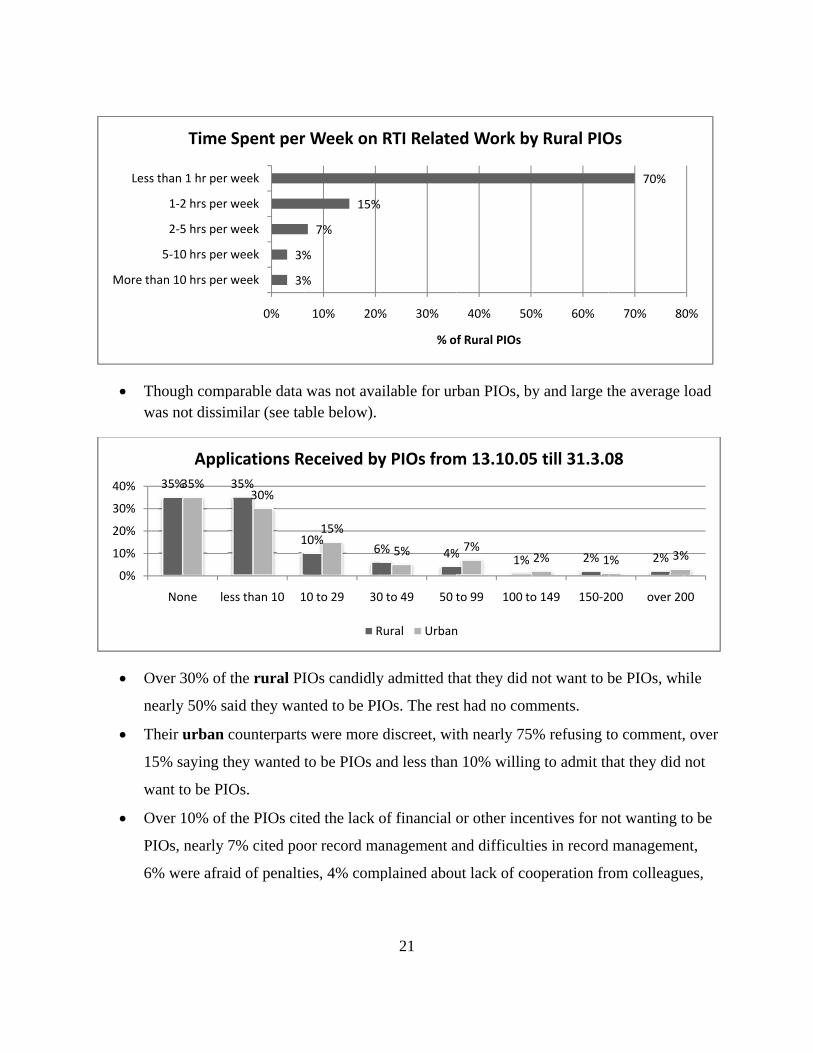
• Tw
• O
n
• T
1
w
• O
P
6
More th
Less
0%
10%
20%
30%
40%
Though compwas not dissim
Over 30% of
early 50% sa
Their urban
5% saying th
want to be PI
Over 10% of
IOs, nearly 7
% were afra
han 10 hrs per
5‐10 hrs per
2‐5 hrs per
1‐2 hrs per
s than 1 hr per
Time
35%35%
None le
Appl
parable data milar (see ta
the rural PI
aid they wan
counterparts
hey wanted
Os.
the PIOs cit
7% cited poo
aid of penalti
3%
3%
0%
week
week
week
week
week
Spent per
35%
1
30%
ess than 10 1
lications R
was not avaable below).
IOs candidly
nted to be PI
s were more
to be PIOs a
ted the lack o
or record ma
ies, 4% comp
%
%
7%
15%
10% 20%
r Week on
10%6
15%
10 to 29 30
Received by
R
21
ailable for ur
y admitted th
IOs. The rest
discreet, wit
and less than
of financial o
anagement a
plained abou
% 30%
% o
RTI Relate
% 4%5%
0 to 49 50 t
y PIOs from
Rural Urban
rban PIOs, by
hat they did n
t had no com
th nearly 75
n 10% willin
or other ince
and difficulti
ut lack of co
40% 50
f Rural PIOs
ed Work by
% 1%7%
to 99 100 to
m 13.10.05
n
y and large t
not want to b
mments.
% refusing t
g to admit th
entives for n
ies in record
ooperation fr
0% 60%
y Rural PIO
2%2% 1
o 149 150‐2
5 till 31.3.0
the average l
be PIOs, wh
to comment,
hat they did
not wanting t
d managemen
om colleagu
70%
70% 80
Os
2%1% 3%
200 over 20
08
load
hile
, over
not
to be
nt,
ues,
0%
%
00
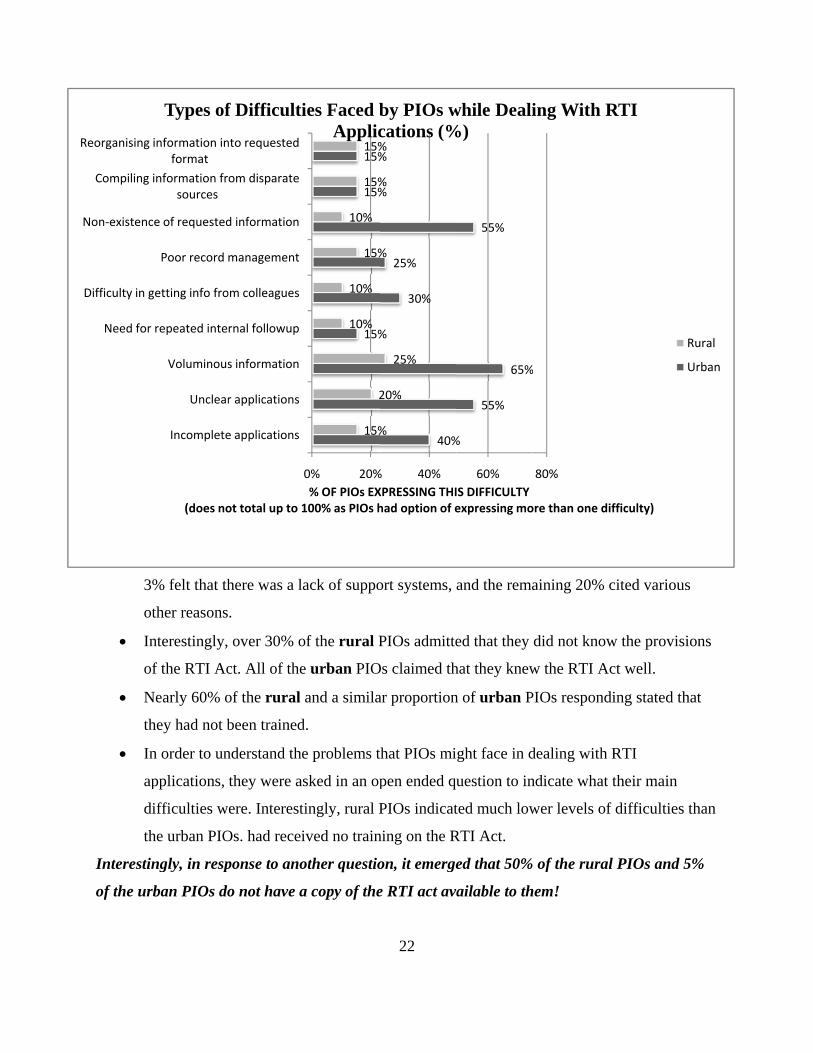
Need for
Difficulty in g
Non‐existenc
Compiling
Reorganising
3
ot
• In
o
• N
th
• In
ap
d
th
Interestin
of the ur
Incomplete
Unclear
Voluminous
repeated inte
getting info fro
Poor record
ce of requested
information frsources
information informat
(does no
Types of
% felt that th
ther reasons
nterestingly,
f the RTI Ac
Nearly 60% o
hey had not b
n order to un
pplications,
ifficulties w
he urban PIO
ngly, in resp
rban PIOs do
0
e applications
r applications
s information
rnal followup
om colleagues
management
d information
om disparate
nto requested
ot total up to 1
f Difficulti
here was a la
.
over 30% o
ct. All of the
of the rural
been trained
nderstand the
they were as
ere. Interesti
Os. had recei
ponse to ano
o not have a
15%
15%
15%
15%
2
10%
10%
15%
10%
15%
15%
0% 20%% OF PIOs EX
100% as PIOs h
ies Faced bApplic
ack of suppo
of the rural P
e urban PIO
and a simila
d.
e problems t
sked in an op
ingly, rural P
ived no train
other questio
a copy of the
22
40%
%
30%
25%
%
%
%
20%
25%
%
%
%
% 40%XPRESSING THIhad option of e
by PIOs wcations (%
ort systems,
PIOs admitte
Os claimed th
ar proportion
that PIOs mi
pen ended qu
PIOs indicat
ning on the R
on, it emerge
e RTI act av
%
55%
65%
55%
60%IS DIFFICULTY expressing mo
while Deali%)
and the rema
ed that they
hat they knew
n of urban P
ght face in d
uestion to in
ted much low
RTI Act.
ed that 50%
ailable to th
%
80%
ore than one d
ing With R
aining 20%
did not know
w the RTI A
PIOs respond
dealing with
ndicate what
wer levels of
% of the rura
hem!
ifficulty)
RTI
cited variou
w the provis
Act well.
ding stated th
RTI
their main
f difficulties
l PIOs and 5
Rural
Urban
s
ions
hat
than
5%

020406080
100120140160180200
MEDIA A
Coverage
• A
an
th
K
• E
ar
0
50
100
150
200
250
300
10
ORI
Averag
AND THE Re
As a national
n average of
he national a
Karnataka, U
English publi
rticles as the
240
1159
UP
142
UTT KA
ge Number of
RTI
average, the
f 1.25 items p
average, whi
Uttarakhand a
ications seem
eir Hindi and
147
89112
RAJ T
Number of A
2436
AR GUJ
f Articles on R
ere were 65
per week. U
le national p
and Orissa w
med to have
d regional lan
976
533
TN NATIO
Articles in EnLa
23
51
NATIONAL
RTI per Public
items on the
Uttar Pradesh
publications
were below th
printed an av
nguage coun
5133 22
ONAL GUJ
nglish as Opanguages, Sta
617
TN MA
cation per Ye
e RTI per pu
h, Rajasthan
and publicat
he national a
verage of tw
nterparts.
52
2 11
KAR
posed to Hinatewise
77
122
AH RAJ
ear, Statewis
ublication per
and Mahara
tions from G
average.
wo times as m
10 15
UTT
ndi and Regio
186
UP
se
r year, makin
shtra were a
Gujarat,
many RTI
12 10
ORI
onal
ENGLISH
OTHERS
ng it
above
H

24
• RTI coverage in the national periodicals within the sample was very limited both in
English and Hindi. Although Tehelka and Outlook Saptahik were the top performers, they
only had 9 and 7 RTI stories for the entire 3 year period.
• English magazines appeared to contain more items on RTI than the Hindi ones. This is
especially true of niche magazines such as Tehelka or Down to Earth.
• While most magazine articles were news stories, they were longer and more analytical
than those in the newspapers, elaborating on the impact of RTI on corruption, on
fundamental changes to government institutions, and the like.
• At the state level, mainstream magazines had far less RTI coverage than niche
magazines. When niche magazines that promote civil society empowerment took up the
cause of the RTI, there was a manifold increase in RTI articles. Thus, magazines, such as
Diamond India and Vividha Features in Rajasthan, published 121 and 64 articles,
respectively. Often, these magazines worked in association with NGOs to push for better
functioning of RTI rules, such as the lowering of RTI application fees or the creation of
more venues for the payment of these fees.
• Other magazines with higher-than-average RTI coverage at the state level are Frontline
and Kudimakkal Murasu in Tamil Nadu, and Pavat Piyush in Uttarakhand.
Raising Awareness
• Separate from news items about RTI, for awareness raising what was required were
special features on the RTI Act explaining its features, its relevance to the common
citizen, and how to make the best use of it.
• In this sense, the Gujarat and the Karnataka media appeared to be promoting the RTI
most extensively, with the ratio of special features to news items far in excess of others.
Thus, while the media in these states might not be covering the RTI as intensively as the
media in Uttar Pradesh and Rajasthan, they appear to be investing far greater energy in
promoting it.

25
Tone and Perspective
• The coverage of both success and failure stories relating to citizen’s attempts to access
information was far greater in the state, than at the national level. This suggested that
state level media was more focused on people’s use of the RTI while national media
tended to focus more on RTI issues and developments.
• Interestingly, among at least at the national level, the English media seemed to highlight
successes far more than the Hindi media, which appeared to dwell more on the failures.
Using the RTI Act for Investigative Journalism
• Judging by the small number of RTI-based investigative stories we found, it appears that
the Indian media is not yet using the RTI Act much for unearthing stories and
investigating issues.
• Surprisingly, even magazines, which are generally in the business of longer, more in-
depth exclusives, have not used RTI Act very often to gather material for stories.
• Only three RTI based stories were found in the national sample, one each in the Indian
Express, the India Today (English), and the Times of India.
• The state sample offered more investigative stories using the RTI Act, although numbers
were still small. Orissa and Gujarat appeared to have the highest, followed by Goa. Tamil
Nadu’s best-known story based on an RTI application was relating to Priyanka Gandhi’s
visit to the Vellore prison.
• In Karnataka, the New Indian Express had two stories emanating from RTI applications,
but in Rajasthan and Uttarakhand, no examples of investigative stories could be found
amongst the sample of dailies and periodicals.
NGOS AND THE RTI
• For those NGOs who received substantive funding from governments and therefore were
public authorities, their web sites were checked to see how closely they met with the
requirements of section 4.
• A list of 38 NGOs was culled from the website of the Council for Advancement of
People’s Action and Rural Technology (CAPART), which is an autonomous organization
26
under the Ministry of Rural Development, Government of India. These were all those
who had received substantial funding from CAPART.
• The names of another 16 NGOs were taken from the website of the Ministry of
Environment and Forests, as being those that had received funds as environment
information (ENVIS) centres.
• Of the 38 NGOs culled out from the CAPART list, only 21 had websites. No judgement
is being made regarding the others as they might well have been disseminating the
required information by some other means.
• Of those 21 who had web sites, only one (PRAVA) had an RTI link on its website. The
others gave no information, not even the basic information regarding the name and
address of the PIO.
• Similarly, of the 16 NGOs culled from the Ministry of Environment and Forests, all of
whom had received substantial funds from the Ministry, 14 had websites but only one
(Environment Protection Training and Research Institute) had an RTI link in its website.
PERCEPTIONS AND SUGGESTIONS ABOUT THE RTI REGIME
People’s Perceptions and Suggestions
• The most common suggestion for improvement from the rural areas was that people’s
awareness should be enhanced (30%). This was followed by the demand that punitive
powers under the Act should be enhanced (20%), that the 30 days period for providing
information should be shortened (10%) and that there should be more training (5%).
• Other suggestions from rural applicants included the setting up of a citizen forum to
ensure compliance with the law, improvement in record keeping, the complaint
mechanism should have public oversight, organizational infrastructure should be
enhanced, and there should be proper signage.
• From the urban areas, the most popular demand was for raising awareness (35%),
followed by enhancement of penalties (20%) and shorten time limit for providing
information (15%).

27
• Some of the other suggestions from the urban applicants included better use of
technology, decentralization of information commissioners, improving communications
between applicants and PIO, improving information delivery mechanisms, improving
signage, increasing staff, giving information in local languages, information
commissioners should play a pro-active role, suo moto disclosures should be
strengthened, PIOs should not be a part of the public authority, training should be
strengthened, and the law should be strengthened.
Media’s Perceptions
• Interviews with editors and journalists across the country yielded two primary messages.
o The press sees the RTI primarily as a boon for citizens, rather than itself.
o Newspapers and magazines do not see the spirit and the letter of the RTI Act as
being relevant to them, in terms of their internal transparency and accountability.
Information Commission’s Suggestions
• Improve and strengthen the infrastructure in the commissions.
• Give commissions the power to enforce their decisions.
• Enhance the budgets of the commissions.
• Give greater financial and administrative autonomy to commissions.
• Give commissions the ability to monitor compliance by public authorities.
• Increase training for the staff of public authorities.
• Improve record management at public authorities.
• Make much greater efforts to raise awareness about the RTI Act.
PIOs Suggestions
• A large majority of the PIOs stressed on enhanced training and the raising of awareness.
• Other suggestions included: substantially increase the fee, punish those seeking malafide/
malicious information, restrict timeframe of information that can be sought, provide
additional staff, increase the time allowed for processing application, stop misuse of the
Act, restrict scope of RTI applications, provide additional finances, create separate RTI
28
cells, rovide financial incentive for PIOs, promote e-processing, remove fee exemption
for those below the poverty line.
Heads-of-Departments’ Perceptions and Suggestions
• The district and sub-district heads of departments/offices (HoD/Os) were asked to list
the difficulties that their departments or offices were facing in implementing the RTI Act.
An encouraging 60% said that they were having no problems.
• Another 10% identified the lack of training as the main problem, followed by paucity of
staff (6%), request for old records and information (4%), paucity of funds (3%), and
demand for voluminous information (2%).
• The HoD/Os were also asked to “… suggest any improvements in how the ‘right to
information’ is currently serviced”. Nearly 25% had no suggestions, another 30%
thought that there must be more training, and 10% wanted awareness to be raised. There
was a demand for a separate RTI cell from 5% of the respondents, and for increase in
staff and in the time frame for supplying information from 4%.
• There was a clear consensus amongst HoDs at the Central and State Governments that
transparency was crucial to effective governance.
• There was also a recognition of the fact that the government’s architecture for responding
to the RTI was inadequate. Amongst the key issues cited were:
o Poor record management
o Inadequate budgets
o Wrong mind set of civil servants
o Lack of human resources
o Lack of Training and knowledge about the provisions of the Act
• The Positive Aspects of RTI included
o Citizen empowerment
o Faster decision making
o A boon for honest officers
o Some Improvement in record management
• The negative aspects of RTI included

29
o Misuse
o Use mainly by the elite
o Little impact on the decision making process
o Undermined the authority of the executive
• Opinion was divided as to whether the RTI Act has had an impact on politicians.
• Has greater transparency resulted in greater accountability of the government? On
balance, HoDs felt that the jury was still out as the Act was young and its full potential
had not yet been realized.
Our Perceptions
• In the final analysis, what seems to emerge from the discussions is that the RTI Act has
had mixed results. While the awareness of the importance of transparency has indeed
increased manifold, infrastructure needs to be built around it to allow it to work better. At
the same time, the key to increasing accountability of public authorities lies in bringing
about attitudinal changes – which is something that takes time. The RTI Act, being all of
three years ‘young’, is generally welcomed as a step in the right direction. However,
there was concern regarding the negative spinoffs of the RTI Act.
• The HoDs seem susceptible to some of the rumours about the RTI Act being used mainly
by the educated and the privileged. Our findings do not support this conclusion.
• HoDs also seem to think that a major use of the RTI is by “…aggrieved government
employees who used the RTI Act to redress their grievances, particularly with regard to
promotions, postings and disciplinary action.” Again, our findings do not support this
belief.
• There is the concern that the RTI Act, especially access to file notings, would inhibit civil
servants from expressing their views honestly. In our survey there was almost no
complaint about access to file notings, except from a few HoDs.
• Besides, officers are pressured to record notings contrary to their convictions or opinions,
or contrary to public interest or the law, NOT by the public but by their bureaucratic and
political bosses (who already have access to file notings independent of the RTI Act).

30
• The possibility that such file notings will become public would actually put a counter
pressure on officials to give advice that is in public interest and in accordance with law. It
would also inhibit the bosses from irrationally or self-servingly overruling such advice. It
would allow honest and upright officers to put counter pressure on their bosses by
reminding them that their decisions and the basis of their decisions would all be up for
public scrutiny.
• The spectre of harassment, and vexatious and frivolous applications, is also often raised.
Admittedly, frequent requests for the supply of telephone bills, or travel claims, or other
expense details, could be tedious. But this problem is easily solved by putting all such
items (that could possibly interest the public) on the web and making them proactively
available in other appropriate ways. This would remove the potential of harassment.
• An understandable fear is that people will not understand or appreciate the conditions
under which certain decisions were taken, especially when there was insufficient
information. Consequently, “hind sight” analysis would show the concerned officials in
bad light and might even question their motivation or competence.
• Another danger is that of the bureaucracy becoming totally “rule bound”, as discretionary
action is difficult to explain objectively. Are we then salvaging governments from
arbitrary functioning just to plunge them into rigidity and rule-boundedness?
• If the basis on which (and the circumstances under which) decisions are made or
discretion exercised, is regularly shared with the people, they will educate themselves.
They will understand and appreciate the conditions under which government functions,
and begin to recognize the efforts that honest and sincere government servants are putting
in, even if they sometimes falter, or make mistakes.
• Our findings suggest that the government is at present in no danger of getting swamped
by RTI applications. However, this could become a problem in the future, especially if
current trends continue unabated. But as governments begin to understand what types of
information the people mainly wanted, they could start putting these out proactively. This
would significantly reduce their work load.

31
• Additionally, if governments analysed what grievances were behind most of the RTI
requests (delays, seemingly unfair decisions, inaction, corruption, lack of response) and
started tackling these, the number of RTI applications would go down further.

The assessment indicator system for FOI work in ShanghaiMeasurement Score Score
achievedResponsible agency
for assessmentMethod
1
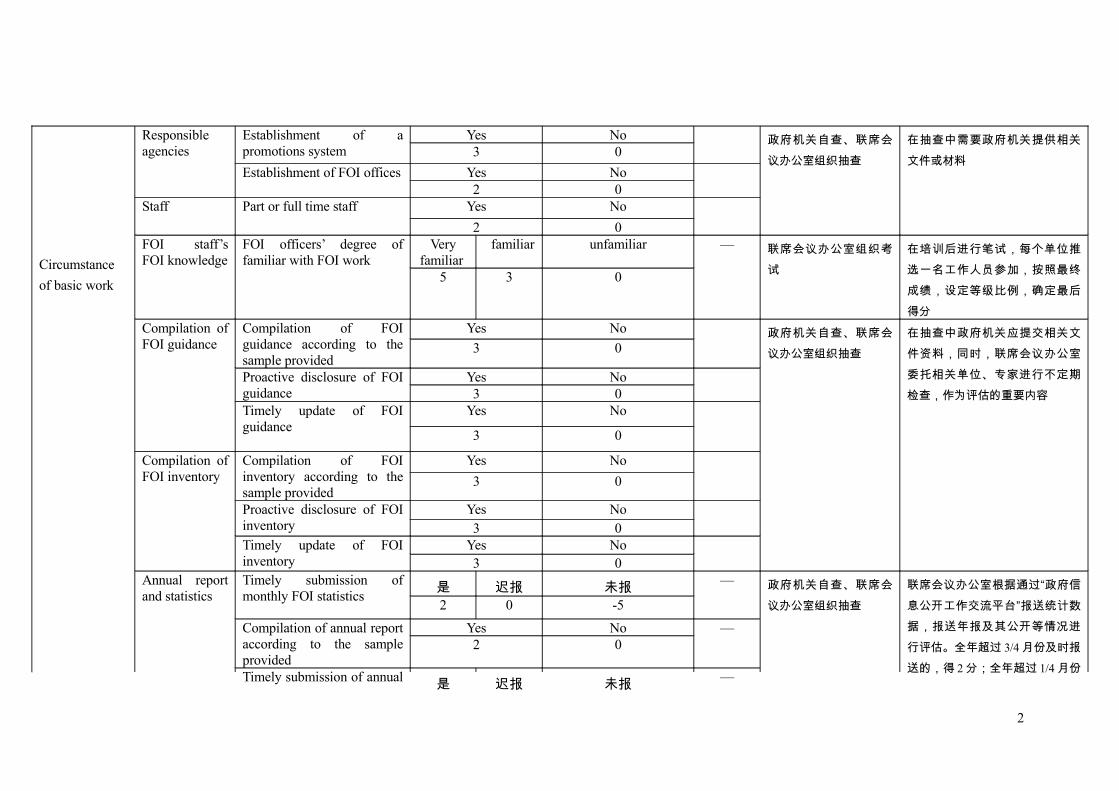
Circumstance
of basic work
Responsible agencies
Establishment of a promotions system
Yes No3 0
Establishment of FOI offices Yes No2 0
Staff Part or full time staff Yes No
2 0
政府机关自查、联席会
议办公室组织抽查
在抽查中需要政府机关提供相关
文件或材料
FOI staff’s FOI knowledge
FOI officers’ degree of familiar with FOI work
Very familiar
familiar unfamiliar
5 3 0
— 联席会议办公室组织考
试
在培训后进行笔试,每个单位推
选一名工作人员参加,按照最终
成绩,设定等级比例,确定最后
得分Compilation of FOI guidance
Compilation of FOI guidance according to the sample provided
Yes No
3 0
Proactive disclosure of FOI guidance
Yes No3 0
Timely update of FOI guidance
Yes No
3 0
Compilation of FOI inventory
Compilation of FOI inventory according to the sample provided
Yes No
3 0
Proactive disclosure of FOI inventory
Yes No3 0
Timely update of FOI inventory
Yes No3 0
政府机关自查、联席会
议办公室组织抽查
在抽查中政府机关应提交相关文
件资料,同时,联席会议办公室
委托相关单位、专家进行不定期
检查,作为评估的重要内容
Annual report and statistics
Timely submission of monthly FOI statistics
是 迟报 未报2 0 -5
—
Compilation of annual report according to the sample provided
Yes No2 0
—
Timely submission of annual 是 迟报 未报 —
政府机关自查、联席会
议办公室组织抽查
联席会议办公室根据通过“政府信
息公开工作交流平台”报送统计数
据,报送年报及其公开等情况进
行评估。全年超过 3/4月份及时报
送的,得 2分;全年超过 1/4月份
2
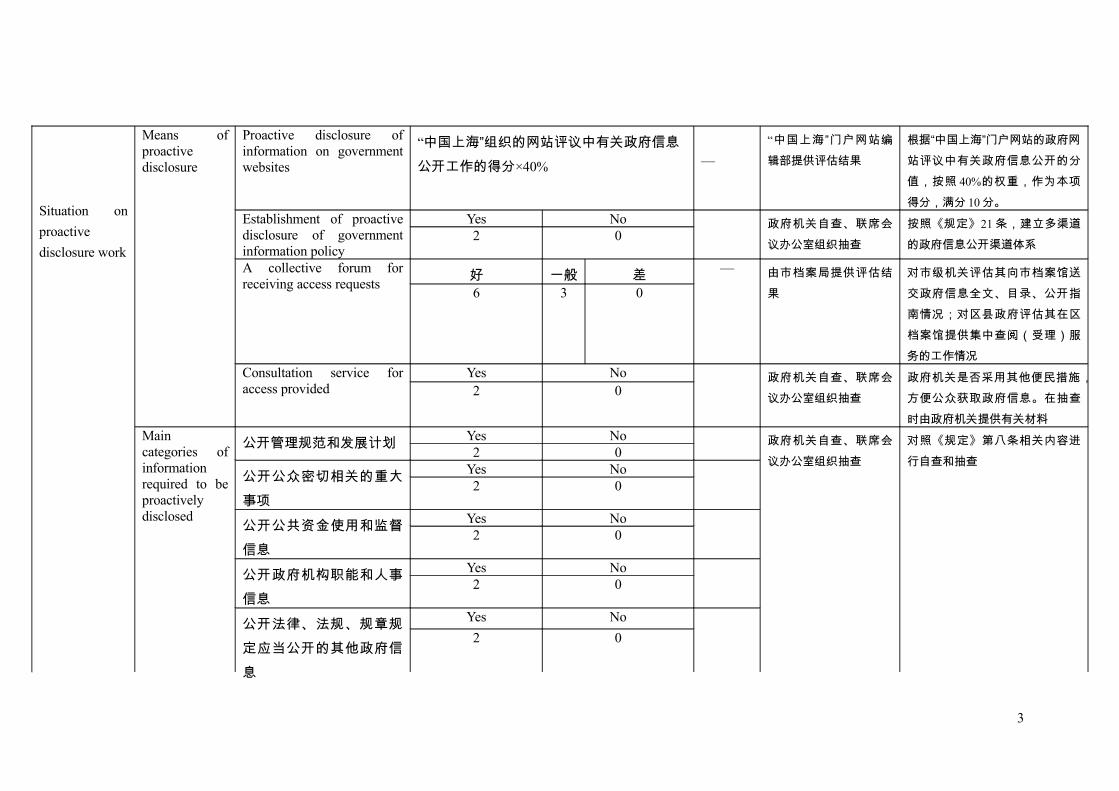
Situation on
proactive
disclosure work
Means of proactive disclosure
Proactive disclosure of information on government websites
“中国上海”组织的网站评议中有关政府信息
公开工作的得分×40% —
“中国上海”门户网站编
辑部提供评估结果
根据“中国上海”门户网站的政府网
站评议中有关政府信息公开的分
值,按照 40%的权重,作为本项
得分,满分 10分。Establishment of proactive disclosure of government information policy
Yes No2 0
政府机关自查、联席会
议办公室组织抽查
按照《规定》21条,建立多渠道
的政府信息公开渠道体系
A collective forum for receiving access requests
好 一般 差6 3 0
— 由市档案局提供评估结
果
对市级机关评估其向市档案馆送
交政府信息全文、目录、公开指
南情况;对区县政府评估其在区
档案馆提供集中查阅(受理)服
务的工作情况Consultation service for access provided
Yes No2 0
政府机关自查、联席会
议办公室组织抽查
政府机关是否采用其他便民措施,
方便公众获取政府信息。在抽查
时由政府机关提供有关材料Main categories of information required to be proactively disclosed
公开管理规范和发展计划 Yes No2 0
公开公众密切相关的重大
事项
Yes No2 0
公开公共资金使用和监督
信息
Yes No2 0
公开政府机构职能和人事
信息
Yes No2 0
公开法律、法规、规章规
定应当公开的其他政府信
息
Yes No
2 0
政府机关自查、联席会
议办公室组织抽查
对照《规定》第八条相关内容进
行自查和抽查
3

Situation on
process of
access requests
Services
provided
A system of managing access requests
Established No
3 0
Response time 平均 5
个工作
日内
平均 10
个工作
日内
《规定》规定的最长
期限内
4+3 4+2 4Establishment of a third party consolation mechanism
Yes No
2 0
Yes No2 -5
Provided the formats of information required by requesters
Yes No
2 0
政府机关自查、联席会
议办公室组织抽查
原则上按照《政府信息公开申请
处理文书格式文本》对政府机关
申请处理文书的完整性进行评估
评估政府机关是否征询第三方意
见。建立该制度,或者在申请处
理过程中已征求过第三方意见,
或者尚未收到过此类申请的得分。
Administrative lawsuits, administrative reconsideration and complaints
Situation on processing administrative reconsideration
确认违法和瑕疵率
高
确认违
法和瑕
疵率低
无违法和
瑕疵情形、
或无案件-3 -1 0
政府机关自查,市、区
法制部门提供核实情况
被确认违法或者有瑕疵的复议超
过已处理完毕的行政复议总数的
30%的,扣 3分;有确认违法和瑕
疵的情况,但其占以处理完毕行
政复议总数的比例低于 30%的,
扣 1分。Situation on processing administrative lawsuits
确认违法和瑕疵率
高
确认违
法和瑕
疵率低
无违法和
瑕疵情形、
或无案件-3 -1 0
政府机关自查,联席会
议办公室获取、提供核
实情况
被确认违法或者有瑕疵的诉讼超
过已处理完毕的行政诉讼总数的
30%的,扣 3分;有确认违法和瑕
疵的情况,但其占已处理完毕行
政复议总数的比例低于 30%的,
扣 1分。Implementation of decisions 不执行处理结果 主动撤 无案件或 政府机关自查,联席会 确认一项不执行处理结果的案例,
4
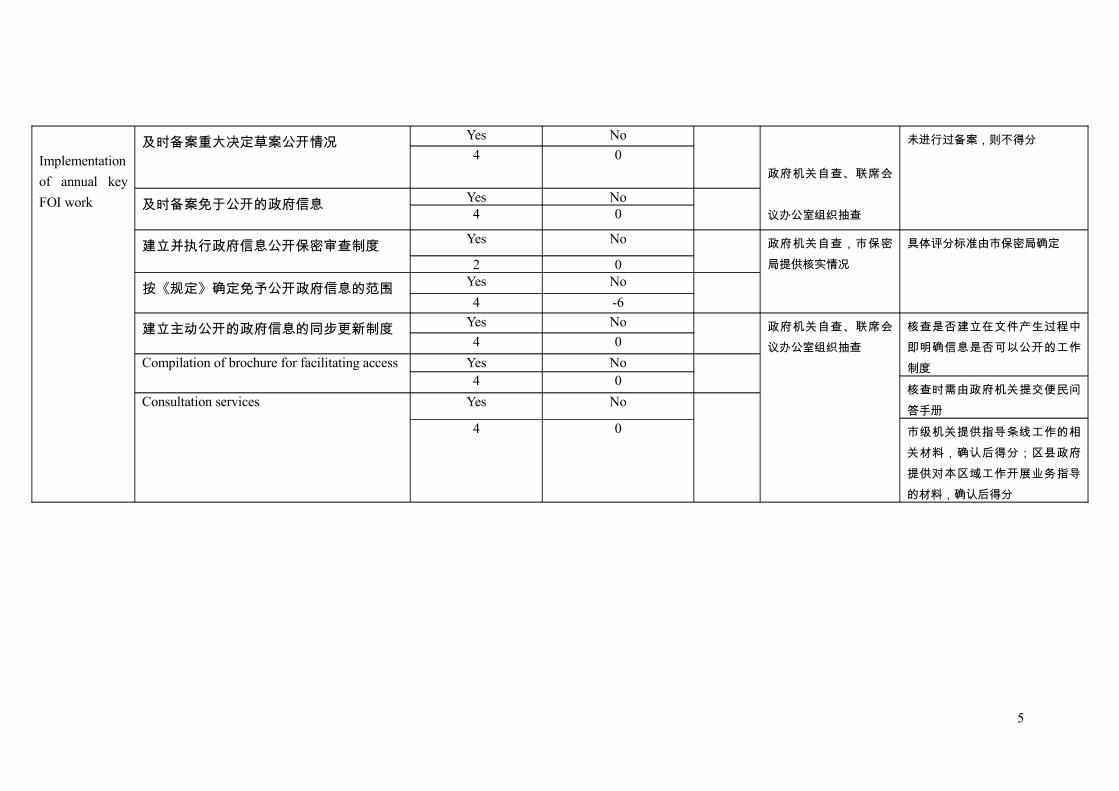
Implementation
of annual key
FOI work
及时备案重大决定草案公开情况 Yes No
4 0
及时备案免于公开的政府信息 Yes No4 0
政府机关自查、联席会
议办公室组织抽查
未进行过备案,则不得分
建立并执行政府信息公开保密审查制度 Yes No
2 0
按《规定》确定免予公开政府信息的范围 Yes No
4 -6
政府机关自查,市保密
局提供核实情况
具体评分标准由市保密局确定
建立主动公开的政府信息的同步更新制度 Yes No
4 0
Compilation of brochure for facilitating access Yes No4 0
Consultation services Yes No
4 0
政府机关自查、联席会
议办公室组织抽查
核查是否建立在文件产生过程中
即明确信息是否可以公开的工作
制度
核查时需由政府机关提交便民问
答手册
市级机关提供指导条线工作的相
关材料,确认后得分;区县政府
提供对本区域工作开展业务指导
的材料,确认后得分
5

Others
Performance of self assessment
Yes No0 每项扣 2分
— 由联席会议办公室组织
抽查
Degree of public satisfaction Very satisfied
Satisfied Ok Dissatisfied
5 3 2 0
— 由市信息委和“中国上海”
门户网站编辑部组织调
查Creative measures for FOI work Very
creative Creative Ok No
5 3 2 0
政府机关自查,联席会
议办公室组织抽查
需由政府机关提供具体创新性做
法的文件资料
6
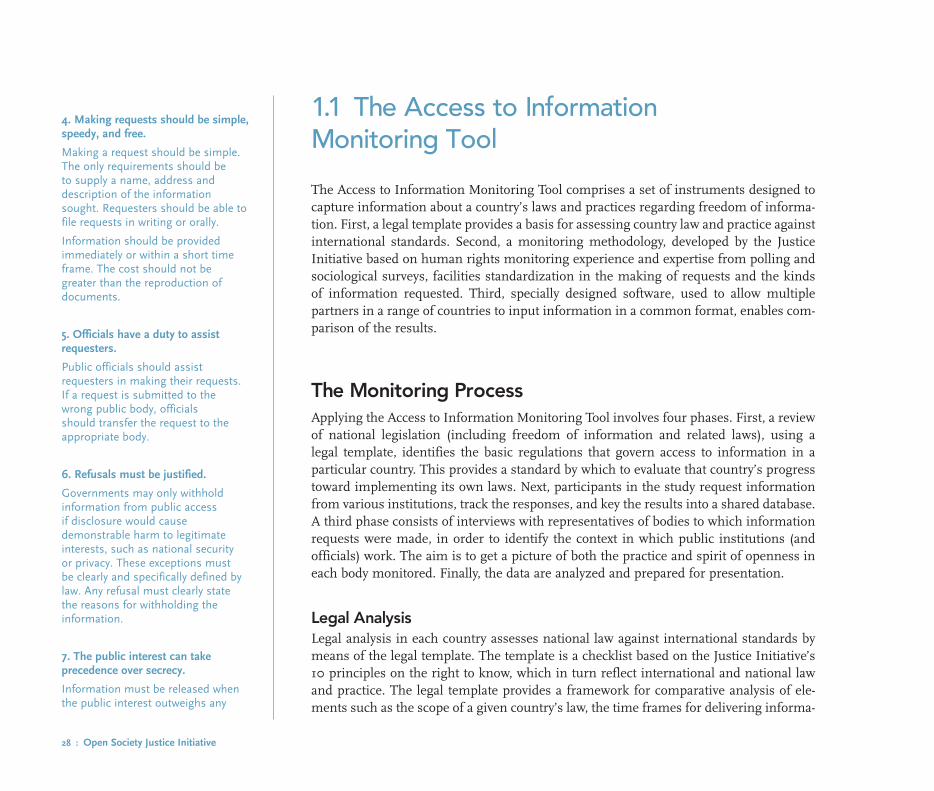
28 : Open Society Justice Initiative
1.1 The Access to Information Monitoring Tool
The Access to Information Monitoring Tool comprises a set of instruments designed to capture information about a country’s laws and practices regarding freedom of informa-tion. First, a legal template provides a basis for assessing country law and practice against international standards. Second, a monitoring methodology, developed by the Justice Initiative based on human rights monitoring experience and expertise from polling and sociological surveys, facilities standardization in the making of requests and the kinds of information requested. Third, specially designed software, used to allow multiple partners in a range of countries to input information in a common format, enables com-parison of the results.
The Monitoring ProcessApplying the Access to Information Monitoring Tool involves four phases. First, a review of national legislation (including freedom of information and related laws), using a legal template, identifies the basic regulations that govern access to information in a particular country. This provides a standard by which to evaluate that country’s progress toward implementing its own laws. Next, participants in the study request information from various institutions, track the responses, and key the results into a shared database. A third phase consists of interviews with representatives of bodies to which information requests were made, in order to identify the context in which public institutions (and officials) work. The aim is to get a picture of both the practice and spirit of openness in each body monitored. Finally, the data are analyzed and prepared for presentation.
Legal AnalysisLegal analysis in each country assesses national law against international standards by means of the legal template. The template is a checklist based on the Justice Initiative’s 10 principles on the right to know, which in turn reflect international and national law and practice. The legal template provides a framework for comparative analysis of ele-ments such as the scope of a given country’s law, the time frames for delivering informa-
4. Making requests should be simple, speedy, and free.
Making a request should be simple. The only requirements should be to supply a name, address and description of the information sought. Requesters should be able to file requests in writing or orally.
Information should be provided immediately or within a short time frame. The cost should not be greater than the reproduction of documents.
5. Officials have a duty to assist requesters.
Public officials should assist requesters in making their requests. If a request is submitted to the wrong public body, officials should transfer the request to the appropriate body.
6. Refusals must be justified.
Governments may only withhold information from public access if disclosure would cause demonstrable harm to legitimate interests, such as national security or privacy. These exceptions must be clearly and specifically defined by law. Any refusal must clearly state the reasons for withholding the information.
7. The public interest can take precedence over secrecy.
Information must be released when the public interest outweighs any

Transparency & Silence : 29
tion, exemptions, costs, and appeals procedures. In countries with access to information legislation, the template allows for the identification of country specific variations for consideration when assessing the compliance of outcomes in those countries. For coun-tries without any relevant legal provisions, the template provides a basic structure for assessment of their compliance with minimum international standards on the right of access to information.
In two areas of the application of access to information laws and standards tested in this study, our methodology permitted variations. First, we held agencies to the time frames set forth in their domestic legislation and, in the absence of such legislation, held them to time frames that reflect international common standards. Second, when a requester submitted a request to an agency that did not hold the information, we considered the response compliant if the agency referred the requester to the right agency, except where national law required the agency to itself transfer the request to the proper agency.
Several of the access to information laws examined in this study fall short of at least some of the principles set forth above. For example, in Bulgaria and France, private or semi-private utilities companies are outside the scope of the access to information laws. In Mexico and South Africa, written applications are the only means of access for all except the illiterate or disabled. Responses to requests that did not meet the 10 prin-ciples were deemed noncompliant, even where permitted in national law.
Requests The monitoring process began with the submission of requests for information. The type and number of requests filed were determined so as to test a number of variables across countries, allowing for measurement and comparison of the treatment of requests and information received. Requesters in each country were chosen to reflect different groups that may wish to access information, and a broadly similar range of national institutions were targeted for information. Likewise, requests were submitted both orally and in writing in each country.
In 2004, a total of 140 requests per country were filed. The 140 requests comprised 70 questions, each of which was filed twice by different requesters at time intervals longer than the response time provided for by law: thus, requests were sub-mitted in two “waves” in each country. The requests were submitted to 18 different institutions in each country, by a total of seven individuals. Institutions included those of the executive (ministries), the judiciary, local administrative bodies, and parastatal
harm in releasing it. There is a strong presumption that information about threats to the environment, health, or human rights, and information revealing corruption, should be released, given the high public interest in such information.
8. Everyone has the right to appeal an adverse decision.
All requesters have the right to a prompt and effective judicial review of a public body’s refusal or failure to disclose information.
9. Public bodies should proactively publish core information.
Every public body should make readily available information about its functions and responsibilities and an index of the information it holds, without need for a request. This information should be current, clear, and in plain language.
10. The right to information should be guaranteed by an independent body.
An independent agency, such as an ombudsperson or commissioner, should be established to review refusals, promote awareness, and advance the right to access information.

30 : Open Society Justice Initiative
companies. Requesters included NGOs, journalists (in each country, two journalists were selected—one broadly “pro-government;” the other “oppositional”), business per-sons, non-affiliated persons, and members of excluded groups, such as illiterate or disa-bled persons or those from vulnerable minorities. Requests were made in both oral and written form,2 with written requests delivered by hand or sent by post, and on occasion submitted by fax or email, depending on the system most widely used in the country in question.
The study was designed to limit requests to the kinds of information that public bodies do, or should, hold. As far as possible, no information was requested that might ordinarily be expected to be exempted under standard access to information legislation. The study did not, therefore, test the application of exemptions in individual countries, but aimed instead to produce a comparative view of the actual information that ought normally to be available in response to requests from the public in each country. The total number of requests recorded and tracked in the course of the study was 1,926 (140 request in 14 countries, less 34 requests filed in Ghana and Mexico that could not be included in the overall figures, due to problems with implementation of the monitoring methodology).3
In order to facilitate comparisons between countries, a number of requests were standardized. In each region (Africa, Europe, Latin America), 16 requests for similar information were submitted to analogous bodies. These questions were decided upon in consultation with the partners from all the countries involved in the pilot project. In addition, specific requests of particular importance to each country were selected. Wherever possible, the selection process involved consultation with the actual requesters themselves so that the requests would have relevance to the requesters and meet their real information needs—for example local NGOs and journalists were consulted so that requests filed would be for information of use to their work.
The methodology also set standards for the behaviour of requesters: in train-ing sessions requesters were instructed to make up to three attempts at submission, an optional telephone call or visit to verify receipt of request, and a later follow up call or visit once the time frame for delivery neared expiry.
Following submission of the 140 requests in each country, one further request was filed with each institution asking about its internal mechanisms for promoting transparency and how it complies with any relevant legal provisions proactively to pub-lish information. The institution was asked whether it had appointed an information officer or a similar person designated with responsibility for providing information to the public.
Transparency & Silence : 31
These “promotion requests” also asked whether the institution’s annual report and budget are available to the public, in addition to information about data held and guidelines on filing a request. The responses to these requests contributed to the assess-ment of the responses received from individual institutions.
Interviews with Public BodiesIn a third phase, interviews were held with each body monitored, to gain a deeper understanding of their systems for implementation of access to information or other applicable laws. The interviews give officials an opportunity to explain how they handle requests for information in general, and to respond to the project findings, particularly in problematic cases, such as low response rates from certain institutions, or a preponder-ance of refusals to provide information.
Interviews were carried out by the lead NGO in each country and aimed to identify needs, such as for additional training or internal guides for personnel on imple-menting freedom of information laws. Interviewers sought a frank discussion with the responsible staff, to listen to their concerns and understand the logistical challenges they face. The recommendations made throughout this report are intended to be as construc-tive as possible, to assist the authorities in the promotion of greater transparency.
Not all institutions, however, granted interviews, which in some cases made it difficult to evaluate the reasons that information requests were handled poorly. In many (though not all) cases, institutions with low access to information compliance scores were also those that, explicitly or tacitly, refused requests for interviews.
Data Collection, Verification, and AnalysisThe Justice Initiative Access to Information Monitoring Software includes a user friendly interface and a relational database that allow for tracking the key stages of a public infor-mation request, from filing to receipt of information, through refusals and appeals.4 Project partners were able to input information into the database online throughout the project period, allowing for results to be analyzed centrally. The software generates statis-tics on the monitoring outcomes and facilitates comparison of data within and between countries.
This online tool was originally developed for the 2003 pilot project. Following a review of the pilot, the software was redesigned and reprogrammed in 2004.
32 : Open Society Justice Initiative
Once data entry was complete, the data were reviewed and final outcomes assigned to all requests. Data verification sheets in Excel were generated using the software and sent to partners for review and correction. Partners went through at least two rounds of review to ensure that the basic details were accurate, followed by review of the substantive comments to verify the final outcomes assigned to each request. This was followed by a period of conference calls and discussions of the results on a request by request basis. Every single request was reviewed, the comments and results read, and the outcomes evaluated and agreed upon by at least three persons for each request.
The final step in the verification process was an analysis of the outcomes for identical requests. As noted above, each project request was submitted twice to the same institution by different requesters. The results of each pair of requests provide an addi-tional test of whether or not institutions comply with requests for information.
Throughout the study, a “benefit of the doubt” rule was applied. Where institu-tions responded that they did not hold requested information or provided written refus-als stating permissible reasons, the good faith of these responses was assumed, and they were evaluated as compliant with access to information standards. An analysis of the outcomes from pairs of identical requests provided a partial test of institutions’ good faith in practice. In cases where the same requests produced different results—such as delivery of information in response to one request and a written refusal or an “informa-tion not held” outcome for the second, paired request—the good faith of the second outcome could not be accepted and the request was reclassified as noncompliant. It is important to note that this study did not deem an agency noncompliant for its failure to collect information. Arguably, governments have the duty to collect certain information, for example, information necessary to protect the health of their populations, but any such duty to collect information falls outside the scope of this study.
Caveats and DisclaimersA study of this kind involves unavoidable human factors—public employees may respond differently to different requesters regardless of the agency’s own policies and regardless of training efforts. The behavior and persistence of requesters in turn will be affected by this treatment. Many freedom of information laws include a “duty to assist” requesters—in this monitoring study, Armenia, Mexico, and South Africa have such provisions and Peru has a provision sanctioning obstruction of requests by information officers.5 And yet, although training of public officials can help to ensure basic stand-
Transparency & Silence : 33
ards of service, the application of this provision tends to vary among institutions and individual government employees. In the course of this study, some officials were kind and encouraging to requesters, others were rude and obstructive. Given the substantial number of actors involved in the project and the legal and cultural differences among countries, a certain amount of inconsistency was unavoidable. The results should not be regarded as perfectly comparable, even though every effort was made to ensure consist-ent application of the methodology.
1.2 The Classification of Outcomes Used in the Monitoring Study
Ten main categories of outcome were used, listed below. The outcomes are grouped into two broad categories: compliance and noncompliance with access to information principles.
Broadly Compliant Outcomes Information Received: The requested information is provided, in written or oral form. The information answers the question and is relatively complete.
Partial Access: Documents are delivered with sections blacked out or “severed,” or the information is otherwise incomplete on grounds provided for by law. As long as the authority clearly states the grounds for withholding some information, partial access was considered a compliant response.
Written Refusal: Refusals to provide requested information ought to be written down, and should state the grounds for withholding information. Written refusals provide a basis for appealing decisions, and so are useful even where noncompliant (for example, when the grounds for refusal are inadequate or unstated). For this study, we generally assumed written refusals to be compliant, except in cases where they clearly were not—such as, for example, when the paired request was treated differently.6

34 : Open Society Justice Initiative
Transferred/Referred: The institution either: (a) provides a written or oral response refer-ring the requester to another institution: or (b) transfers the request to another insti-tution. This is a compliant response, unless the institution that received the original request is clearly the correct location for the information.
Information Not Held: Where the approached authority is the correct location for the requested information, but does not have it, the compliant response is to tell the request-er that the “information is not held.” The admission by government bodies of failures or inadequacies in information compilation is beneficial for the overall transparency of government in that in enables a dialogue with the public about data collection priorities. In the present study, this response was recorded as compliant unless there was good reason to believe that the information was in fact held by the institution in question.
Noncompliant OutcomesInadequate Answer: Information is provided that is largely incomplete, irrelevant, or in some other way unsatisfactory, demonstrating a disregard for the right of access to infor-mation. For example, “inadequate answer” was recorded if a large pile of documents was provided that did not contain the answer to a very specific request, or if a requester was directed to a website which did not contain the requested information.
Mute Refusal: This category indicates no response at all from the authorities, or at best, vague answers to follow up calls. There is no formal refusal, but no information is provid-ed. This outcome was recorded after the time frames for answering requests expired.
Oral Refusal: An official refuses to provide the requested information, whether or not grounds are given, without putting the refusal in writing. This category includes snap responses to oral or hand delivered requests, such as “that information is not public.” Oral refusals can also be received by telephone, either when a requester calls to verify if a written request has been received, or when a call is made at the initiative of the authority.
Unable to Submit: A request is marked “unable to submit” when a requester could not file a request. For example, some requesters could not enter relevant institutions because guards denied them admittance. Or, once inside, requesters could not speak to the rel-evant person, because they were, for instance, absent, always “at lunch,” or “coming in tomorrow.”
Transparency & Silence : 35
Refusal to Accept: Refusal to accept was recorded whenever a government body refused to process in any way an information request, whether oral or written. Typical responses include “We cannot accept oral requests” without any assistance offered to write up the request, or “We do not accept information requests.” Refusal to accept outcomes differ from unable to submit outcomes in that the public body actively declines to process the request. They differ from oral refusals in that the specific content of the information request is never at issue.
Late Answers: Responses made after the time frames established in domestic law or, in the absence of domestic law, by this study were counted as mute refusals. A record was kept, however, of responses that came after the legal time frame but within a predeter-mined “late” period. An analysis of these late answers is to be found in Chapter Four of this report. It is recognized that late responses may be due to several factors other than lack of political will, such as high demand, inadequate resources, or inadequate systems of recordkeeping. Nonetheless, we decided to classify late responses as noncompliant because: (a) timely response is an important element of the right to receive information; and (b) we wanted to ensure consistency in recording results. In any event, very few late responses were received in this monitoring study.
Assessing ComplianceOne way to assess compliance was by comparing results for paired requests. For example in Armenia, one requester asked the Yerevan Kanaker-Zeitun District Administration how much money had been allocated for renovation of the roads in that district in 2004. In an oral response provided by the Head of Statistics Department, the requester was told that the department did not have that information and the result was recorded as “information not held.” However, the second requester, a journalist, received a written answer that 28.5 million AMD (c. $62,000) had been allocated for road renovation. The “information not held” outcome was therefore reclassified as noncompliant, because it was clearly incorrect that the body did not hold the information.
It is not always easy to tell whether a response is compliant or not. For example, a pair of requests filed with the Ministry of Defense in Romania for the number of army recruits in 2001, 2002, and 2003 resulted in different outcomes. The NGO requester received a written refusal stating that the information was “classified,” but without offer-ing the specific grounds.7 The journalist requester, on the other hand, received part

36 : Open Society Justice Initiative
of the requested information (the number of army recruits in 2003 was 31,500). This information was provided to the journalist by the ministry’s press office, who sourced it to the annual report of the National Institute of Statistics. During a follow up interview, the ministry’s appointed information officer, an army major, claimed that the refusal resulted from a terminological confusion concerning the difference between recruits and draftees. According to the major, the number of draftees is classified information. Given that this distinction appeared to pose no obstacle in the case of the journalist, the written refusal was clearly not compliant with the law. Nevertheless, had both requesters received a written refusal, that reply would have been recorded as compliant according to the benefit of the doubt principle applied in this monitoring study.
Country StudiesIn the course of the present study, a great volume of information was collected on each of the monitored countries and on the overall trends for all countries. This report is limited to comparative information relevant to all countries in order to provide some insight into freedom of information trends across the world. It includes a representative sample of the statistical data compiled throughout the study, as well as country specific examples to illustrate the trends identified. The examples were selected as illustrative of typical problems and good practices.
Top Related