


Languages
Pages
Legal


Brexit: Opportunity or threat?Deloitte Alternative Lender Deal Tracker Q1 2016For future copies of this publication, please sign-up via our link at www.deloitte.co.uk/dealtracker

© Deloitte Alternative Capital Solutions
This issue covers data for the first quarter of 2016 and includes 63 alternative lender deals, representing an increase of 8% in deal flow on a LTM basis in comparison with the previous year.

© Deloitte Alternative Capital Solutions
Alternative Lender Deal Tracker Q1 2016 | Introduction
3
Deloitte Alternative Lender Deal Tracker 4
Leverage loan mid-market trends for direct lenders 6
Alternative lending in action: Direct Lenders support the growth of Verastar 8
Alternative Lender Deal Tracker Q1 2016 10
Direct Lending attracts growing LP base 16
Insights into Alternative Lending Market 25
Deloitte’s European CFO Survey 39
Deloitte Debt and Capital Advisory 43
Introduction
From being a hypothetical possibility; Brexit has now become a reality that created an earthquake in the financial markets immediately after the UK referendum result on 24 June 2016. For companies in the mid-market Brexit will likely mean in the short term a flight to quality from bank lenders and more restrictive financing conditions until there is more visibility on what the ramifications will be for the UK and potential contagion in market confidence globally. For direct lenders who have locked in capital this will create opportunities as banks will likely become more risk averse, therefore accelerating growth of non-bank alternative lending market.
In line with other markets, the Swiss financial market witnessed a considerable increase in volatility following the events on 24 June 2016 with a marked pick-up in demand for quality on the one hand and a pronounced demand for the Swiss Franc as a safe haven. The developments will likely increase the awareness and demand for more diversified
funding options for borrowers especially in the case of mid-market companies.
As the Direct Lending market is evolving and rapidly becoming an asset class in its own right with currently in excess of 300 direct lending professionals active in Europe, this edition includes a summary of those professionals by country and seniority and an overview of some of the most recent moves.
We also focus upon direct lending fund raising activity in Europe which after two record years has paused for breath at the start of 2016. As such, we are pleased to include interviews with seasoned participants in the direct lending market including limited partner investors, direct lending managers, and advisors.
© Deloitte Alternative Capital Solutions
Alternative Lender Deal Tracker Q1 2016 | Deloitte Alternative Lender Deal Tracker
Welcome to the eleventh issue of the Deloitte Alternative Lender Deal Tracker which now covers 46 leading alternative lenders, with whom Deloitte is tracking primary mid-market deals across Europe. The number of deals reported on has increased to 713 transactions over the past 14 quarters. This issue covers data for the first quarter of 2016 and includes 63 alternative lender deals, representing an increase of 8% in deal flow on a LTM basis in comparison with the previous year.
Deloitte Alternative Lender Deal Tracker
Floris HovinghDirector – Head of Alternative Capital SolutionsTel: +44 (0) 20 7007 4754 E-mail: [email protected]
John FeiglDirector – Head of Debt & Rating Advisory SwitzerlandTel: +41 58 279 66 33E-mail: [email protected]
4

Q1 headline figures (last 12 months)
Q1 2016 deals completed
Q12015(LTM)
Q12016(LTM)
UK deal Count
Rest of Europe deal Count
UK deal Count
Rest of Europe deal Count
96 101
161147
8%
63
increase in deal flow year-on-year
deals completed
20
22
3
2
16
UK Germany Switzerland
Other European
France
Alternative Lender Deal Tracker Q1 2016 | Deloitte Alternative Lender Deal Tracker
© Deloitte Alternative Capital Solutions 5
© Deloitte Alternative Capital Solutions
Alternative Lender Deal Tracker Q1 2016 | Leverage loan mid-market trends for direct lenders
6
Leverage loan mid-market trends for direct lenders
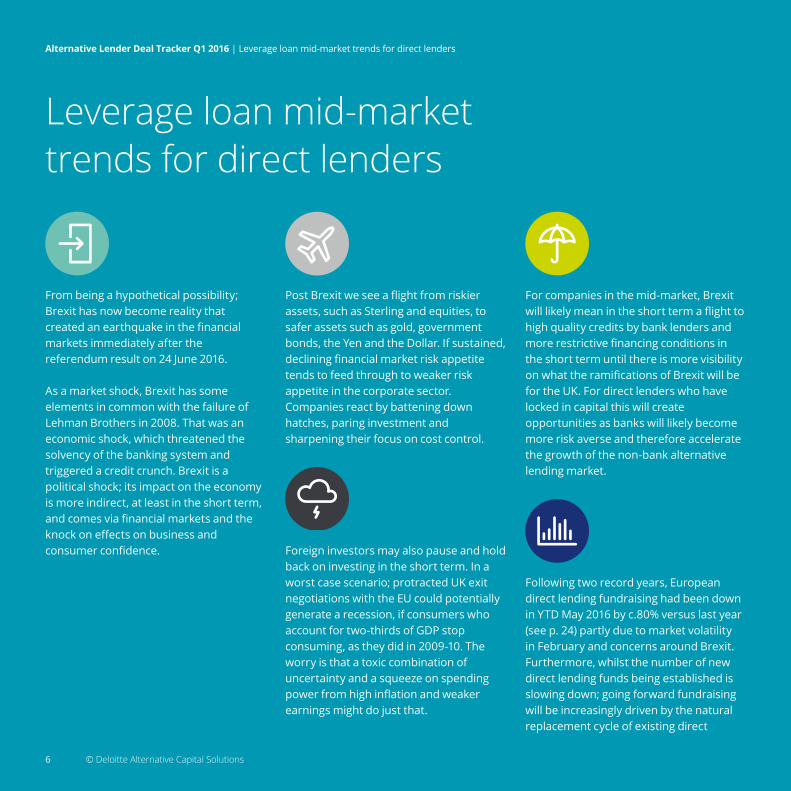
From being a hypothetical possibility; Brexit has now become reality that created an earthquake in the financial markets immediately after the referendum result on 24 June 2016.
As a market shock, Brexit has some elements in common with the failure of Lehman Brothers in 2008. That was an economic shock, which threatened the solvency of the banking system and triggered a credit crunch. Brexit is a political shock; its impact on the economy is more indirect, at least in the short term, and comes via financial markets and the knock on effects on business and consumer confidence.
Post Brexit we see a flight from riskier assets, such as Sterling and equities, to safer assets such as gold, government bonds, the Yen and the Dollar. If sustained, declining financial market risk appetite tends to feed through to weaker risk appetite in the corporate sector. Companies react by battening down hatches, paring investment and sharpening their focus on cost control.
Foreign investors may also pause and hold back on investing in the short term. In a worst case scenario; protracted UK exit negotiations with the EU could potentially generate a recession, if consumers who account for two-thirds of GDP stop consuming, as they did in 2009-10. The worry is that a toxic combination of uncertainty and a squeeze on spending power from high inflation and weaker earnings might do just that.
For companies in the mid-market, Brexit will likely mean in the short term a flight to high quality credits by bank lenders and more restrictive financing conditions in the short term until there is more visibility on what the ramifications of Brexit will be for the UK. For direct lenders who have locked in capital this will create opportunities as banks will likely become more risk averse and therefore accelerate the growth of the non-bank alternative lending market.
Following two record years, European direct lending fundraising had been down in YTD May 2016 by c.80% versus last year (see p. 24) partly due to market volatility in February and concerns around Brexit. Furthermore, whilst the number of new direct lending funds being established is slowing down; going forward fundraising will be increasingly driven by the natural replacement cycle of existing direct
© Deloitte Alternative Capital Solutions

© Deloitte Alternative Capital Solutions
Alternative Lender Deal Tracker Q1 2016 | Leverage loan mid-market trends for direct lenders
7
lending funds and overall fund size increases for the second or even tertiary funds. Currently, there are at least 100 lenders seeking aggregate commitments in excess of US$40 billion in the market as of June 2016.
As the direct lending market continues to evolve and mature with now in excess of 300 professionals engaged in the sector in Europe there has been a significant increase in newly launched direct lending funds targeting smaller mid market companies for bilateral loans (below <€15m of debt).
In the main mid-market (€30m-€250m of debt) most funds are still focussed on sponsor backed deal flow with targeted IRR’s of 7-9%. However, more interesting opportunities exist for more risk tolerant funds who can fill the current gap between
direct lenders and special situations funds and are looking for unlevered IRR’s of 10-12% for more complex situations in Europe which do not fit the investment criteria of banks nor mainstream direct lenders.
More broadly looking at other alternative credit strategies; US distressed managers are raising record funds to take advantage of an expected turn in the cycle in the US. In our view, direct lending funds with a more flexible mandate in terms of investment in the secondary market will increasingly take advantage of potential future market dislocations to boost their return profiles.
Overall the direct lending asset class has performed well to date. So far the number of defaults have been relatively small, albeit 2016 has seen a number of covenant reset processes in the mid market which were few and far between in 2015.
In short; Deloitte is expecting increased volatility in the capital markets in the second half of 2016, combined with continued subdued levels of M&A and risk adversity until there is more clarity on the implications of Brexit. Whilst this represents a threat in the near term, it also reflects an opportunity for alternative lenders with flexible lending mandates who are better placed to ride market volatility and can take advantage of dislocated markets.
Opportunities exist for more risk tolerant funds in financing more complex situations in Europe.
© Deloitte Alternative Capital Solutions

© Deloitte Alternative Capital Solutions
Alternative Lender Deal Tracker Q1 2016 | Alternative lending in action: Direct Lenders support the growth of Verastar
8
Verastar, formerly known as Universal Utilities, started life as an electricity broker in the late 1990s. The company grew steadily over the next twenty years to become a business with a customer base of approximately 120,000 and broadened its portfolio of services to include fixed line telecommunications and mobile phone services for the micro SME market (companies with up to 10 employees). In 2011, the company was bought by Vitruvian, a European focused private equity firm.
Alternative lending in action: Direct Lenders support the growth of Verastar
Prior to the acquisition by Vitruvian, the company was not levered. When Paul Doherty, CFO of Verastar joined the company shortly after the LBO by Vitruvian, there was a financing structure in place that included Senior Debt, Mezzanine and loan notes (PIK). As Paul puts it: “It was expensive, but we had no wider view on the options at that time as we had no direct relationships with lenders”.
Paul then went on to establish relationships with predominantly bank institutions. Bringing Lloyds Banking Group into the structure streamlined the company’s debt facilities, enabling the mezzanine tranches to be replaced by a hybrid debt structure of revolving and Unitranche facilities. Although this new structure was considered a significant step forward, and the relationship with a high street lender added credibility to Verastar’s position, Paul was concerned about the lack of flexibility the arrangement afforded which restricted the Company in its growth aspirations.
Fast forward to January 2015 and by this point Verastar was on track to be a £100m revenue business. It had successfully diversified its product base and broken into new markets. Paul says, “our profit and cash generation were great; we were rapidly paying down debt, but inefficiencies remained on the balance sheet”. Verastar then engaged Deloitte to provide an analysis of what the debt markets could offer.

© Deloitte Alternative Capital Solutions
Alternative Lender Deal Tracker Q1 2016 | Alternative lending in action: Direct Lenders support the growth of Verastar
9
Following this exercise, Verastar decided to enter into a relationship with Ares Management, in a deal which enabled the repayment of shareholder and vendor loan notes and the existing debt funding. Paul explains, “we met our primary objective of securing a structure that gave us the flexibility we desired. We quickly formed a strong relationship with Ares, who were extremely supportive throughout the deal process.”
Lloyds Banking Group reacted extremely positively to what was proposed, so what was eventually agreed was a pioneering structure with Lloyds as the term debt lender in front of a unitranche. Paul characterises his relationship with the two lenders as “seamless: we have a small number of partners for a significant quantum of debt, so the conversations are fewer all round. We have a straightforward, understanding relationship which really works for me”. He finds the new structure, also known as a bifurcated Unitranche, to be “a great enabler, with the previous restrictions gone.”
For those companies potentially considering the debt markets as a means of funding, Paul has the following advice to give: “Look at your plan for the next five years, and if you’re planning on staying in private debt markets, you should definitely be aware of this kind of debt structure: it can provide you with an ease of dealing and a flexibility that could be additive to your business.”
“…we have a small number of partners for a significant quantum of debt, so the conversations are fewer all round. We have a straightforward, understanding relationship which really works for me.”
The Next Generation Service ProviderSince 1998, Verastar has been providing small businesses with the essential business services they need.
Verastar has a strong portfolio of brands and employs over 640 people in 14 offices throughout the UK. The company has a large, diverse customer base, encouraged by competitive pricing. Their unique and dynamic approach to customer service has resulted in the company growing total customer contracts year-on-year since 2005.
Verastar offers a range of essential business services across telecommunications, water and energy. No other provider offers this mix. As these markets open to increased competition, people are switching away from the incumbents. Thanks to this change, Verastar is achieving double-digit growth rates. The spectrum of products and services its brands offer is not just restricted to utilities and their offer is constantly expanding to meet the needs of its customers.
Paul DohertyCFO – Verastar

Alternative Lender Deal Tracker Q1 2016 | Alternative Lender Deal Tracker Q1 2016
10
Alternative Lender Deal Tracker Q1 2016
© Deloitte Alternative Capital Solutions

11
Alternative Lender Deal Tracker Q1 2016 | Alternative Lender Deal Tracker Q1 2016
© Deloitte Alternative Capital Solutions
Alternative lenders continue to increase their deal flow…Alternative Lender Deal TrackerCurrently covers 46 leading alternative lenders. Only primary mid-market UK and European deals are included in the survey.
0
24 2034 35
54 296UK deals
completed
417Euro dealscompleted
713Total dealscompleted
41 43
8164
55
62 69 68 63
Deals
Q4/12 Q1/13 Q2/13 Q3/13 Q4/13 Q1/14 Q2/14 Q3/14 Q4/14 Q1/15 Q2/15 Q3/15 Q4/15 Q1/16
20
40
60
80
100
UK
France
Germany
Other European
Data in the Alternative Deal Tracker is retrospectively updated for anynew participants
Deals done by each survey participant (Last 12 months) Number of lenders pertransaction (Last 12 months)85% of the transactions in the last 12 months were bilateral deals between borrower and Direct Lender (excluding RCFs provided by banks)
Deals
Participant0
10
20
30
UK Rest of Europe
1
2
3
4
5 or more
survey participants completed 10 or more deals in the last 12 months
10
85%
11%
3%1%
of survey participants completed 5 or more deals in the last 12 months
59%

© Deloitte Alternative Capital Solutions
17%
13%
16%
12%
UK41%
France26%
Germany11%
Other European22%
7%
4%
4%1%
14%
12%
17%
6%
11%
12%
12%
6%
7%
10%
3%
16%
Technology, Media & Telecommunications
Healthcare & Life Sciences
Other
UK France Germany Other European
Business, Infrastructure & Professional Services
Leisure
Manufacturing
Financial Services
Retail
Consumer Goods
Human Capital
Total dealsacross EuropeIn the last 14 quarters 713 (296 UK and 417 other European) mid-market deals are recorded in Europe
Total deals across industries(Last 12 months)Within the UK the TMT industry has been the prevalent user of alternative lending with 17% followed by Business, Infrastructure & Professional Services and Leisure with both 12%
In the rest of Europe there are 5 main industries: TMT, Consumer Goods, Healthcare, Business, Infrastructure & Professional Services and Manufacturing.
1
296
4
6
32
9
14
5
11
121
183 4
20
1
1
1
2
77
12
7
5
UK
Rest of Europe
TotalDeals
…across Europe and across industries…
Alternative Lender Deal Tracker Q1 2016 | Alternative Lender Deal Tracker Q1 2016
12

© Deloitte Alternative Capital Solutions
Alternative Lender Deal Tracker Q1 2016 | Alternative Lender Deal Tracker Q1 2016
13© Deloitte Alternative Capital Solutions
…providing bespoke structures for mainly “event financing” situations
LBO
Bolt on M&A
Dividend recap
Refinancing
Growth capital
Senior
Unitranche
Second lien
Mezz
Other
17% 7%
27%
13%
36%16
13
10
6
6
4
Rest of Europe
18%
13%
30%
12%
UK
50%
32%
47%
5%
10%6%
77%first lien
UK
39%
36%
5%
10%
10%
Rest of Europe
*For the purpose of the deal tracker, we classify senior only deals with pricing L + 650bps or above as Unitranche.Pricing below this hurdle is classified as senior debt.
Deal purpose (Last 12 months)The majority of the deals are LBO related, with 45% of UK transactions and 53% of Euro deals being used to fund a buy out. Of the 262 deals in the last 12 months, 77 deals did not involve a private equity sponsor..
Structures (Last 12 months)“Unitranche” is the dominant structure, with (47% of UK and 36% of other European) of the transactions classified as a Unitranche structure. Subordinate structures represent only 23% of the transactions.
Alternative lenders are mainly competing with banks, as 77% of the transactions are
structured as a first lien structure(Senior /Unitranche).
of transactionsinvolved in M&A
27%

14
Alternative Lender Deal Tracker Q1 2016 | Alternative Lender Deal Tracker Q1 2016
Direct Lending Professionals – Key statistics and recent moves
Direct Lending ProfessionalsThe Direct Lending market is evolving and rapidly becoming an asset class in its own right, with over 300 Direct Lending professionals now active in the European market, of which 75% are based in the UK. France follows with 14%.
The great migration of managers into Direct Lending that we have seen over the last 3 years will slow down as most large asset managers have now established their own Direct Lending Teams. However, moves from and to Direct Lenders will continue on a more stable basis.
Our aim in this section is to track the total headcount size of the European Direct Lending market, and provide insights in the demographics in terms of level of seniority, geographical spread and gender diversification. Data shows that the sector is very much senior driven with over 55% being in a level of Director/Principal or Partner/MD.
Also provided is a summary of recent moves and new recruits of Direct Lenders. Not included are those moves which we are aware are happening but are not yet public.
Paragon Search PartnersBruce Lock is the founder and Managing Director of Paragon Search Partners, a London based search firm focused on the global leveraged and acquisition finance markets, investment banking and private equity.
To contact Bruce Lock at Paragon by email, use [email protected]. Or to contact Bruce by phone the direct number is +44 (0) 20 7717 5001.
Bruce LockManaging Director of Paragon Search Partners
UK
Other European
France
Germany
Spain
Benelux
Sweden
230
78
308Professionals
Partner / MD
Director / Principal
AD / VP
Associate
Analyst / Exec
44
7
19
5
3
OtherEuropean
106
72
39
55
36
Direct Lending Professionals in EuropeIn total there are currently over 300 Direct Lending professionals active in the European market of which 75% is based in the UK followed by France with 14%.
Direct Lending Professionals per job levelOf the total of c. 300 Direct Lending Professionals c. 14% is female.
*Please note: For the purposes of this analysis we have included the total investment team headcounts at combined Mezzanine / Direct Lending funds (such as Park Square, Crescent Capital).We have excluded the Mezzanine/Minority Equity teams at ICG, on the basis that much of their investment now is in minority or majority equity. We have also excluded teams whose main activity is in the corporate private placement market.
© Deloitte Alternative Capital Solutions

© Deloitte Alternative Capital Solutions
Alternative Lender Deal Tracker Q1 2016 | Alternative Lender Deal Tracker Q1 2016
15
AIG Mark Rowe joins as a Director from Lloyds Kreos CapitalMatteo Giulivi and Krishnan Patel join as analysts
– graduate joiner and Barclays Bank respectively
Ares ManagementArnaud Gayet joins the Paris team as a Vice
President, from GE Paris
Legal & General
Investment
Management
Nicholas Bamber joins as Head of Private Debt
from Royal Bank of Scotland
Beechbrook
Capital
Peter Kirtley joins the SME fund as a Director,
from Lloyds
LFPI Asset
Management
Paris
Hugo Campagnoli joins as a graduate analyst
BlackRock Theo Weber joins to head the German direct
lending group, from SMBC / GEMuzinich & Co
Bernard Galea joins the UK team as an Associate,
from Lincoln International
Five Arrows Credit
Solutions
Jerome Berthiau joins the Paris team as an
associate from Societe GeneralePartners Group
Krish Vaswani joins from RBS and Amit Chachlani
from Lazard, both as Investment Analysts
GICRobin Jarratt has been made Head of the
Private Debt group
Pemberton Asset
Management
Nils Weber joins the German based team as an
Associate Director from Societe Generale
Goldman SachsFelix Kirk joins the ESSG Private Debt group
from Ares as an AssociateSL Capital
Gianluca Lorenzon joins as a Director from
Bank of Ireland
HIG WhitehorseHerman Vocking joins in Amsterdam from NIBC
to head Benelux lending
TPG Special
Situations
Anne-Sophie Moinade joins as an associate from
JP Morgan
KKRMark Craig joins as a Managing Director from
Evercore’s debt advisory team
Direct Lending Moves in Q1 2016

© Deloitte Alternative Capital Solutions
Alternative Lender Deal Tracker Q1 2016 | Alternative Lender Deal Tracker Q1 2016
16
Direct lending attracts growing LP base
Times of upheaval create winners and losers and the financial crisis of the late 2000s is no exception. While banks have been forced to take a more cautious view of their investments and lending strategies in the light of Basel III capital requirements imposed on them, alternative lenders have stepped into the breach, providing companies and sponsors with debt offerings that range from private placements and more traditional senior debt through to unitranche, growth capital and structured equity. The growth of the market is evidenced by the global fundraising total seen in 2015, at US$36.0bn, up from just US$22.4bn in 2013 (see p. 23).
The US already had a well-developed non-bank lending market pre-crisis, but it’s in Europe where growth has really taken hold for private debt funds over recent times. Indeed, in 2015, fundraising for Europe-focused Direct Lending vehicles surpassed that for North America-focused funds, with just nearly $19bn raised for the former over the year and US$14.9bn garnered by the latter, according to the latest figures (see p. 24).
Much of this growth was accounted for by some particularly large fundraisings in Europe, with three of the largest five funds of 2015 specifically Europe-focused and the other two with significant allocations to Europe.
An established part of the portfolioWhile the figures so far suggest that 2016 may not be such a stellar year for Direct Lending fundraising globally and particularly in Europe – in part because fundraising totals are often lumpy in relatively nascent markets – the fact is that many limited partners now view Direct Lending as an important part of their investment strategy.
What may have started as a means to generate yield in a low interest environment for many investors has now become an established means of generating returns and for some a way of diversifying their portfolios. Since 2013, the fairway has broadened considerably in terms of both number and type of LPs that are interested in private debt funds.
“Most LPs have now heard the private debt story – in contrast to just a few years ago – and in some ways fundraising is like knocking on an open door,” says Marc Ciancimino, Head of European Private Credit at KKR. “Many LPs are very keen on the concept because they are looking for yield but with the added attraction of holding a senior position in the capital structure.” Indeed, KKR has recently reached a final close on its latest Europe-focused Direct Lending fund at US$850m, with total resources of US$1.3bn including leverage.
After several years of strong growth, the Direct Lending fundraising picture looks a little more mixed for 2016. However, the continued healthy appetite among limited partners and the development of their private debt programmes suggest that the longer term picture is still positive.
Mark CianciminoHead of European Private Credit at KKR

© Deloitte Alternative Capital Solutions
Alternative Lender Deal Tracker Q1 2016 | Alternative Lender Deal Tracker Q1 2016
17
The range of funds now apparent in the market means that Direct Lending is an attractive area of investment for most types of investor, given the differing risk profiles and investment horizons of different strategies.
Wouter Mak at Credit Suisse Private Fund Group explains: “Direct Lending funds provide LPs with a strong yield component and relatively robust downside protection. This is attractive to those with lower risk appetite and defined cash flow obligations, especially public pension plans, insurance companies and certain endowments.” Yet family offices, which traditionally have a higher risk appetite and are not seeking to meet future liabilities, are also looking to Direct Lending.
“For them, Direct Lending is seen as a good diversifier in their portfolios, balancing the risk-reward profile and providing a reliable source of cash flow,” adds Mak.
“Direct Lending funds provide LPs with a strong yield component and relatively robust downside protection. This is attractive to those with lower risk appetite and defined cash flow obligations, especially public pension plans, insurance companies and certain endowments.”
Wouter MakDirector – Credit Suisse Private Fund Group

© Deloitte Alternative Capital Solutions
Alternative Lender Deal Tracker Q1 2016 | Alternative Lender Deal Tracker Q1 2016
18
More sovereign wealth funds are also entering the market and the increase in their appetite shows the direction of travel for many LP types: recent Preqin figures suggest that 35% of SWFs now invest in private debt, versus 24% in 2015.
And there is still plenty of scope for growth, with many still in the early stages of building out portfolios and exposure to the market. “Even though allocations to private debt have increased, many LPs remain underweight in our view, particularly if comparing against the size of private debt markets globally,” says Gregg Disdale, Global Head of Illiquid Credit at Willis Towers Watson. “There is a lot of room for the asset class to grow substantially.” Urs von Büren at Swiss Capital Alternative Investments agrees. “We expect clients’ allocations to private debt to continue to increase,” he says. “Many still have relatively small allocations, yet in order for private debt to have an impact on the overall portfolio, an allocation of 5% to 10% is recommended.”
Gregg DisdaleGlobal Head of Illiquid Credit at Willis Towers Watson
“Even though allocations to private debt have increased, many LPs remain underweight in our view.”
Urs von BürenSwiss Capital Alternative Investments
“We expect clients’ allocations to private debt to continue to increase … Many still have relatively small allocations, yet in order for private debt to have an impact on the overall portfolio, an allocation of 5% to 10% is recommended.”

© Deloitte Alternative Capital Solutions
Turning cyclesNevertheless, while LPs continue to be attracted to the Direct Lending space, there are signs that many are becoming more cautious in their outlook and/or are shifting their allocation strategies as we move through the credit cycle – global corporate default rates were at their highest since the crisis, according to S&P figures, with 57 issuers in 2016 to early May, reflecting the volatile oil & gas markets as well as a slowdown in economic growth in the US and China.
“For the early movers in this space, we’ve definitely seen yields come down and we are watching carefully as to where we are in the credit cycle in the US and Europe,” says Sanjay Mistry, Director of Private Debt at Mercer. “There may well be increased distressed opportunities on the horizon, although we wouldn’t automatically consider these for our various private debt funds and client portfolios as their risk characteristics place them firmly in the private equity, rather than private debt, bucket.”
“We are minded to be cautious in the current environment,” agrees Disdale. “That means we are more likely to favour senior or whole loan/unitranche investments over mezzanine now, given where asset values currently are. Defaults are likely to pick up over the coming period, albeit from very low levels and we may see more investor capital gravitating towards distressed debt than we’ve seen over recent years.”
The other issue many LPs and their consultants are currently watching closely is competition. The rapid growth in the number of funds in Europe is leading some to be cautious about some pockets of the market. Many of the fundraisings seen in Europe last year – such as those completed by BlueBay, ICG and Ardian were second or third funds in the Direct Lending space, but there were also many new entrants to the market (see p. 33). “We believe we are in the last third of the credit cycle. Therefore, we are mindful of increasingly borrower friendly structures and terms, particularly for M&A transactions,” says von Büren.
“In Europe, the significant increase in the number of managers and committed capital at this late stage of the cycle is a concern. This means that the importance of manager selection in the right segment of the private debt spectrum is intensifying.” For Swiss Capital Alternative Investments, he adds, its focus on investing via separate accounts helps mitigate this as it enables the firm to set investment guidelines on behalf of clients as well as exclude certain transactions and industries.
Alternative Lender Deal Tracker Q1 2016 | Alternative Lender Deal Tracker Q1 2016
19
Sanjay MistryDirector of Private Debt at Mercer
“For the early movers in this space, we’ve definitely seen yields come down and we are watching carefully as to where we are in the credit cycle in the US and Europe.”

© Deloitte Alternative Capital Solutions
Alternative Lender Deal Tracker Q1 2016 | Alternative Lender Deal Tracker Q1 2016
20
Focus on manager selectionThese factors, as von Büren suggests, mean that investors are sharpening their manager selection criteria. “We’ve seen noticeably different behaviour among LPs when it comes to manager selection over recent times,” says Max Mitchell, Head of Direct Lending at ICG. “Two years ago, they were looking at a much broader church; now we’re seeing a flight to quality as investors are seeking out managers with a more established track record as they look to invest in a less risky way – that’s to the clear benefit of blue chip names.”
LPs are also digging deeper as the prospect of more players chasing the same deals starts looming in Europe. While the usual factors of experience, risk profile of the fund’s strategy and organisational culture all come in to play, the difficulty assessing track records in a space where few funds can point to longevity means that LPs are honing in on particular areas in their due diligence efforts. “Our clients have largely been investing in debt funds with predictable cash flows, so mainly in the Direct Lending and commercial real estate space, where they are seeking returns of between 7% and 10%,” says Carolyn Schuster-Woldan, Partner at Lane Clark & Peacock.
Max MitchellHead of Direct Lending at ICG
“…now we’re seeing a flight to quality as investors are seeking out managers with a more established track record as they look to invest in a less risky way – that’s to the clear benefit of blue chip names.”

© Deloitte Alternative Capital Solutions
Alternative Lender Deal Tracker Q1 2016 | Alternative Lender Deal Tracker Q1 2016
21
The portfolio allocation conundrumThe fact that Direct Lending funds cover a wide variety of strategies, have different risk-return profiles and are illiquid yet usually provide regular cash flows has presented something of a conundrum for many LPs: where does it sit within their portfolio?
“Private debt can fit within various parts of an investor’s portfolio because it’s such a varied offering,” explains Gregg Disdale, Global Head of Illiquid Credit at Willis Towers Watson. “We tend to encourage our clients to think in terms of their risk budget when assessing private debt investment opportunities, to look at whether they are being appropriately paid for the illiquidity of credit funds. There are clearly some private debt opportunities that are more equity-like and that therefore fit in alternative allocations, but the majority tend to fit within credit/fixed income portfolios.”
Sanjay Mistry, Director of Private Debt at Mercer adds: “Most LPs we work with put their private debt exposure into fixed income, although it does move around according to the debt fund’s risk profile. So, for plain vanilla senior-oriented strategies, fixed income is more appropriate, while for higher risk strategies, such as subordinated debt or higher octane senior debt, alternatives is often a better fit.”
Yet as the market develops, investors become more accustomed to the different features of Direct Lending and as their allocations increase, it is likely that many will follow the lead taken by some of the more experienced LPs in the asset class by creating a separate private debt bucket. “Some investors allocate across the whole private debt space,” says Mistry.
“And here, it doesn’t really fit in either alternatives or fixed income and so they usually have a stand-alone part of the portfolio dedicated to it, although these do tend to be investors that have been in the market for a while.”
It’s a view shared by Henry Watson of Credit Suisse Private Fund Group. “As LPs continue to build out their programmes, many who currently focus exclusively on buyouts are likely to develop an illiquid credit programme,” he says. “This would track the development of many LPs that are prominent in the space today.”
“We tend to encourage our clients to think in terms of their risk budget when assessing private debt investment opportunities, to look at whether they are being appropriately paid for the illiquidity of credit funds.”

© Deloitte Alternative Capital Solutions
Alternative Lender Deal Tracker Q1 2016 | Alternative Lender Deal Tracker Q1 2016
22
“Direct Lending is here to stay…It will become much more mainstream for investors. So far, it has provided some attractive returns and it’s clear there is demand from SMEs that can’t get financing from the more traditional sources. For investors, the opportunity is tangible.”
Carolyn Schuster-WoldanPartner at Lane Clark & Peacock
“Yet we do need to be cautious because if managers are taking more risk then that level of return becomes less attractive. We consider the quantum of leverage being used and at the quality and quantity of covenants.”
She adds: “We spend a lot of time assessing funds’ sourcing networks and we want to see that managers can deploy capital in a disciplined way over a one to two-year period. We also assess managers’ credit due diligence and look into their experience of work-outs from the previous cycle. This last point is particularly important if we are going into a period of increased defaults,
but it can be hard to do because many of the funds are relatively new and haven’t been through a more difficult economic environment.”
Fees and other terms also play an important role in helping LPs decide whether to commit to a fund, particularly as many are more accustomed to more traditional market fee levels. LPs and their consultants broadly welcome the shift away from private equity-style management fees on committed capital towards a model of fees on invested capital that has been seen across the Direct Lending space, although many would like to see further movement on hurdle rates and a closer alignment with fixed income-style levies.
Yet there is a caveat, says Mak. “The market has become very competitive and there are some corners in Europe that are getting crowded,” he says. “The trend towards fees based on invested capital can create perverse incentives to put money to work, so mandates need to be sufficiently broad if terms are set this way.”
Future developmentLooking ahead, many predict that there will be some kind of shake-out or consolidation among funds following a period of rapid growth. With LPs and their consultants focusing heavily in the due diligence on ability to source deals, it seems likely that those funds with proprietary deal flow that can avoid auction-style processes will be most successful in fundraising.
However, the longer term picture is brighter. Despite these concerns, the overall view among LPs and their consultants is that the Direct Lending space will remain an attractive – and permanent – area of investment. “Just as we have seen a shift in many institutional investors of part of their public equities exposure towards more private equity investments, so we expect to see more fixed income shift towards private debt,” says Mak.
And it seems that Europe in particular offers good prospects for LPs as it shifts from a bank-led financing economy to one characterised by a variety of alternative debt sources. “Direct Lending is here to stay,” adds Schuster-Woldan. “It will become much more mainstream for investors. So far, it has provided some attractive returns and it’s clear there is demand from SMEs that can’t get financing from the more traditional sources. For investors, the opportunity is tangible.”

23
Alternative Lender Deal Tracker Q1 2016 | Alternative Lender Deal Tracker Q1 2016
Direct Lending Fund raising Direct Lending Fund raising Funds with final closings in Q1 2016 1
• Babson Global Private Loan Fund $2,000m (Global)
• SJC Onshore Direct Lending Fund III $1,738m (North America)
• White Oak Summit Fund $1,330m (North America)
• KKR Direct Lending Europe $850m (Europe)
• Twin Brook Capital Partners Direct Lending Fund $596m (North America)
Largest funds with final closing in 2015 1
• ICG Senior Debt Partners II €3,000m (Europe)
• Ares European Loan Programme €3,000m (Europe)
• Park Square Capital Credit Opportunities €2,100m (North America, Europe)
• AXA Private Debt III €2,000m (North America, Europe, Asia)
• BlueBay Direct Lending Fund II €2,000m (Europe)
1 Preqin, Credit Suisse Private Fund Group market knowledge. Currency amounts are in millions.
© Deloitte Alternative Capital Solutions
Q1 Q3 Q4Q2
Rest of the World
North America
Europe
Global direct lending fundraising by quarter 1
Direct lending fundrais-ing by region (2013-16) 1
0
10
20
30
40
50
60
Number of funds
2013 2014 2015 YTD May’16
$41.0bn41.8% $53.6bn
54.6%
$3.6bn3.7%
22.4
32.5
7.4
36.0
48 5052
14

Alternative Lender Deal Tracker Q1 2016 | Alternative Lender Deal Tracker Q1 2016
24
Key takeaways 1
• Fundraising for Direct Lending strategies slowed down significantly in H1 2016, raising only $7.4 billion, less than half of the capital raised in either H1 or H2 2015. – This slowdown was seen across all geographies but was most pronounced in Europe
– Volatility in the capital markets in H1 2016 and the Brexit referendum have impacted fundraising activity
• A structural shift has however not been observed. Investors still have a strong and growing demand for Direct Lending products.
• The largest Direct Lending fund to be raised in H1 2016, is smaller than the five largest Direct Lending funds raised in 2015
• All five of the largest Direct Lending funds raised in H1 2016 were USD-denominated, while all five of the largest funds raised in 2015 were EUR-denominated – Points to a particular softening of the fundraising market for European Direct Lending in H1 2016 compared with the previous year
• Over 100 Direct Lending funds seeking aggregate commitments in excess of $40 billion remain in the market as of June 2016 – European and North American funds together represent c 90% (each representing c. 45%) of the funds in the market by target size, with a larger number of smaller funds in the North American market
1 Preqin, Credit Suisse Private Fund Group analysis, Credit Suisse Private Fund Group market knowledge.
Q1 Q3 Q4Q2
Europe direct lending fundraising by quarter 1
Number of funds
0
5
15
25
35
2013 2014 2015 YTD May’16
US direct lending fundraising by quarter 1
0
5
15
25
35
2013 2014 2015 YTD May’16
.
6.0
14.9
19.0
13.7
8.0
12.8
18.7
1.5
15 1615
5
3132
27
8
© Deloitte Alternative Capital Solutions

Alternative Lender Deal Tracker Q1 2016 | Insights into the Alternative Lending market
25
Insights into the Alternative Lending market
© Deloitte Alternative Capital Solutions

© Deloitte Alternative Capital Solutions
Alternative Lender Deal Tracker Q1 2016 | Insights into the Alternative Lending market
26
Alternative lender ‘101’ guide
Who are the alternative lenders and why are they becoming more relevant?
Alternative lenders consist of a wide range of non-bank institutions with different strategies including private debt, mezzanine, opportunity and distressed debt.
These institutions range from larger asset managers diversifying into alternative debt to smaller funds newly set up by ex-investment professionals. Most of the funds have structures comparable to those seen in the private equity industry with a 3-5 year investment period and a 10 year life with extensions options. The limited partners in the debt funds are typically insurance, pension, private wealth, banks or sovereign wealth funds.
Over the last three years a significant number of new funds have been raised in Europe. Increased supply of alternative lender capital has helped to increase the flexibility and optionality for borrowers.
Key differences to bank lenders?
• Access to non amortising, bullet structures
• Ability to provide more structural flexibility (covenants, headroom, cash sweep, dividends, portability, etc.).
• Access to debt across the capital structure via senior, second lien, unitranche, mezzanine and quasi equity.
• Increased speed of execution, short credit processes and access to decision makers.
• Potentially larger hold sizes for leveraged loans (€30m up to €200m).
• Deal teams of funds will continue to monitor the asset over the life of the loan.
However,
• Funds are not able to provide clearing facilities and ancillaries.
• Funds will target a higher yield for the increased flexibility provided.

27
Alternative Lender Deal Tracker Q1 2016 | Insights into the Alternative Lending market
Key benefits of Alternative Lenders
One-stop solution
Scale
Greater structural flexibility Speed of execution
Cost-effective simplicity
© Deloitte Alternative Capital Solutions

© Deloitte Alternative Capital Solutions
Alternative Lender Deal Tracker Q1 2016 | Insights into the Alternative Lending market
28
Euro Private Placement ‘101’ guide
Euro PP for mid-cap corporates at a glance
Since its inception in July 2012, the Euro Private Placement (Euro PP) volumes picked up significantly. After the amendment in the insurance legislation in July 2013, the majority of Euro PPs are currently unlisted. The introduction in early 2015 of a standardised documentation template by the Loan Market Association (LMA) is supportive to a Pan-European role-out of this alternative source of financing.
Key characteristics of the credit investor base
• Mainly French insurers, pension funds and asset managers
• Buy and Hold strategy
• Target lending: European mid-cap size, international business exposure, good credit profile (net leverage max. 3.5x), usually sponsor-less
Main features of Euro PP
• Loan or bond (listed or non-listed) – If listed: technical listing/no trading/ no bond liquidity
• Usually Senior, Unsecured (possibility to include guarantees if banks are secured)
• No rating
• Minimum issue amount: €10m
• Pari passu with other banking facilities
• Fixed coupon on average between 3% and 4.5% - No upfront fees
• Maturity > 7 years/Bullet repayment profile
• Limited number of lenders for each transaction and confidentiality (no financial disclosure)
• Local jurisdiction/local language
• Euro PPs take on average 8 weeks to issue
Pros and Cons of Euro PP
Long maturity
Bullet repayment (free-up cash flow)
Diversification of sources of funding (bank disintermediation)
Very limited number of lenders for each transaction
Confidentiality (no public financial disclosure)
Covenant flexibility and adapted to the business
General corporate purpose
Make-whole clause in case of early repayment
Minimum amount €10m
Minimum credit profile/leverage < 3.5x

29
Alternative Lender Deal Tracker Q1 2016 | Insights into the Alternative Lending market
Key characteristics of Euro PP
Euro PP (< €150m) deals in 2015 – coupon vs. amount
Insurers
Asset managers
0-5yr
5-7yr
>7yr
Undisclosed
20%
80% 60%
23%
11%
6%
Source: Bloomberg, Agefi, Deloitteanalysis
6%
5%
4%
3%
2%
1%
0 20 40 60 80 100 120 140
Coup
on
Amount in €m
Lender type Maturity
© Deloitte Alternative Capital Solutions

Public Instrument
Cash flowdebt productsThe overview above focuses on the debt products available for Investment Grade and Sub-Investment Grade companies.
€10m
€0mAAA AA AA BBB
Credit Risk
BB B CCC
€20m
€30m
€40m
€50m
€100m
€200m
€300m
€400m
€500mInvestment Grade Bonds High Yield Bonds
Private Instrument
Senior Bank Loans, Bilateral & Syndicated
Private Placement
Peer-to-Peer
5 5
1
2
4
high Yield Bonds / Investment Grade Bonds5Peer-to-Peer1
Senior Bank Loans, Bilateral & Syndicated2 Private Placement4
3 Direct Lenders
3Direct Lenders
Debt size
30
Alternative Lender Deal Tracker Q1 2016 | Insights into the Alternative Lending market
How do Direct Lenders compare to other cash flow debt products?
© Deloitte Alternative Capital Solutions

© Deloitte Alternative Capital Solutions
Alternative Lender Deal Tracker Q1 2016 | Insights into the Alternative Lending market
31
How do alternative lenders compete with bank lenders?
0
5%
6%
10%
15%
Bank clubdeals
Unitranche ‘Story Credit’1Unitranche
or Junior debt
Growth capitalor junir debt
AlternativeLenders
Banks
6%Hurdle
Rate
Risk profile
Margin
Leveraged loan banks operate in the 350bps to 600bps margin range providing senior debt structures to mainly companies owned by private equity.
Majority of the direct lenders have hurdle rates which are above L+600bps margin and are mostly involved in the most popular strategy of ‘plain vanilla’ Unitranche, which is the deepest part of the private debt market.
Other direct lending funds focus on higher yielding private debt strategies, including: ‘Story’ Unitranche and Subordinated Debt or Growth Capital.
Similar to any other asset class the risk return curve has come down over the last 3 years as a result of improvements in the economy and excess liquidity in the system.

© Deloitte Alternative Capital Solutions
2%
0%
4%
6%
8%
10%
12%
14%
16%
18%
20%
€50m €200m€100m €250m €300m
Margin
€0m
Scarcity of Financial Solutions
Debt sizeNote: Distressed strategies are excluded from this overview
Growth capital
StructuredEquity
Holdco PIK
Mezzanie
‘Story credit’ Unitranche
Unitranche
Traditional senior debt
Mid-cap Private Placements
Alternative Lender Deal Tracker Q1 2016 | Insights into the Alternative Lending market
32
What are the private debt strategies?We have identified seven distinctive private debt strategies in the mid-market direct lending landscape:
Mid-cap Private Placements
Traditional senior debt
Unitranche
‘Story credit’ Unitranche
Subordinated (Mezzanine/PIK)
Growth capital
Structured equity
There is a limited number of alternative lenders operating in the L+450bps to L+600bps pricing territory.
A number of large funds are now actively raising capital to target this part of the market.
Direct lenders approach the mid-market with either a niche strategy (mainly new entrants) or a broad suite of direct lending products to cater for a range of financing needs. The latter is mostly the approach of large asset managers
1
2
3
4
5
6
7
2
3
4
6
7
1
5

© Deloitte Alternative Capital Solutions
Alternative Lender Deal Tracker Q1 2016 | Insights into the Alternative Lending market
33
How much funds have been raised by which Direct Lending managers?
2013
1
2
3
2014 2015 2016
Avenue Ardian
Bluebay*
Hayfin
ICG
EQT
European Capital GSO**
Proventus Rothschild
KKR Pemberton Permira
Bain Capital***
Tikehau
Crescent CVC Credit Partners
HPS InvestmentPartners*****
Ares****
Avenue
Hayfin
Rothschild
CrescentKKR
Pemberton
Tikehau
EQT
GSO**
EuropeanCapital
Permira
CVCCredit
Partners
ArdianProventus
HPS Investment
Partners*****
Bain Capital***
Bain Capital***BlueBay*
ICG
ICG
Ares****
Ares****
Fund raise1st wave 2nd wave
= fund size(€500m)
BlueBay*
*Excluding€700m of managed accounts/overflow vehicles
**Excluding €2.5bn of leverage, totalfund capacity of€5bn
***Global investment focus with significant allocation to the European market
****Excluding credit facilities and European Direct Lending separately managed accounts
*****Global Senior Direct Lending fund with significant focus on the European market, including managed
accounts and leverage this strategy has $9.1bn of AUM
EuropeanCapital

© Deloitte Alternative Capital Solutions
Alternative Lender Deal Tracker Q1 2016 | Insights into the Alternative Lending market
34
Who are the Direct Lenders?
Alternative lender deal tracker Q3 2015 | Insights into the Alternative Lending market
36
Who are the direct lenders?
Note: offices included with at least one dedicated direct lendingprofessional. The overview does not necessarily provides an overviewof the geographical coverage.
Germany
Spain
France Especially focused on Euro PP
BeneluxItalyNordics
PortugalIreland
United Kingdom
Switzerland
Poland
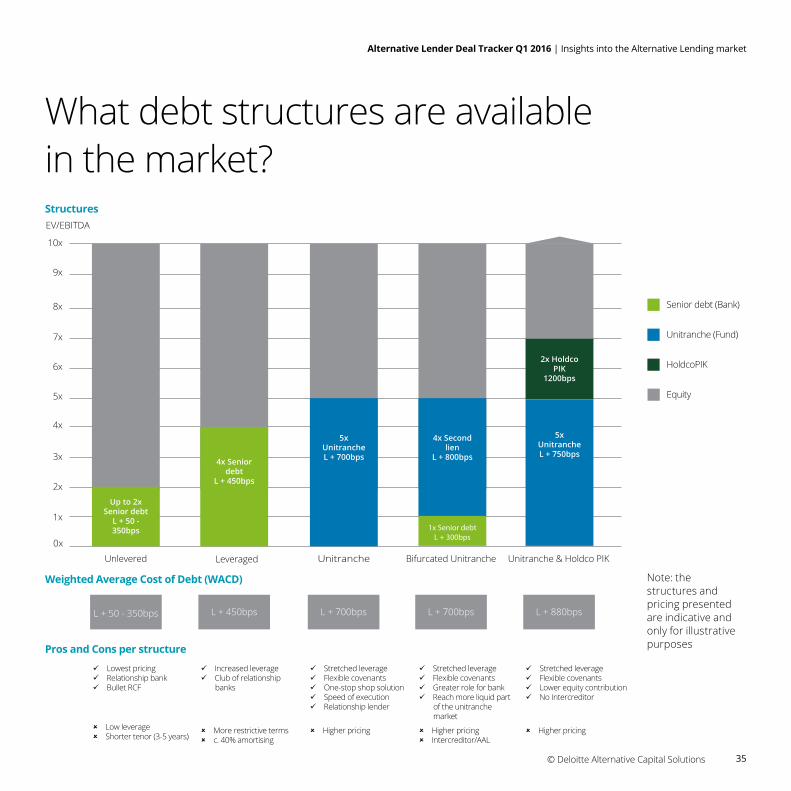
Structures
Weighted Average Cost of Debt (WACD)
Pros and Cons per structure
EV/EBITDA
Lowest pricing Relationship bank Bullet RCF
Low leverage Shorter tenor (3-5 years)
Increased leverage Club of relationship banks
More restrictive terms c. 40% amortising
Stretched leverage Flexible covenants One-stop shop solution Speed of execution Relationship lender
Higher pricing
Stretched leverage Flexible covenants Lower equity contribution No Intercreditor
Higher pricing
Stretched leverage Flexible covenants Greater role for bank Reach more liquid part of the unitranche market
Higher pricing Intercreditor/AAL
L + 50 - 350bps L + 450bps L + 700bps L + 700bps L + 880bps
0x
Unlevered Leveraged Unitranche & Holdco PIK
Senior debt (Bank)
HoldcoPIK
Unitranche (Fund)
Equity
1x
2x
3x
4x
5x
6x
7x
8x
9x
10x
Unitranche
Up to 2x Senior debt
L + 50 - 350bps
4x Senior debt
L + 450bps
5x UnitrancheL + 700bps
Bifurcated Unitranche
4x Second lien
L + 800bps
1x Senior debtL + 300bps
5x UnitrancheL + 750bps
2x Holdco PIK
1200bps
35
Alternative Lender Deal Tracker Q1 2016 | Insights into the Alternative Lending market
What debt structures are available in the market?
© Deloitte Alternative Capital Solutions
Note: the structures and pricing presented are indicative and only for illustrative purposes

© Deloitte Alternative Capital Solutions
Borrower Country Unitranche in €m Lenders Sponsor Date
Marle France Capzinine May-16
Polynt and Reichhold Italy GSO May-16
OpenBet UK Ares - Apr-16
Petainer UK KKR Apr-16
Citation UK Alcentra Apr-16
Delsey France Avenue, Pemberton, Permira Nov-15
Verastar UK Ares Nov-15
Fintrax Ireland Ares Nov-15
Oberscharrer Germany BlueBay Nov-15
ESE Netherlands Avenue, BlueBay Nov-15
Bibliotheca Switzerland BlueBay Oct-15
Gala Bingo UK ICG Oct-15
Chiltern / Theorem UK/USA Hayfin, ICG, HPS Investment Partners, Bain Capital - Sep-15
Currencies Direct UK Alcentra, CVC, HPS Investment Partners Sep-15
Tracscare Group UK BlueBay Jul-15
Ezentis Spain HPS Investment Partners - Jun-16
MH Group Denmark Alcentra Jun-15
Shimtech Industries UK Ares May-15
Ainscough Crane Hire UK GSO Mar-15
Big Bus Tours UK Ares Feb-15
CRH Ireland GSO Dec-14
IMV Technologies France Ardian Dec-14
Groupe Salins France Tikehau, Macquarie, Hayfin - Dec-14
Farrow & Ball UK Crescent, KKR, Bain Capital Dec-14
XLN Business Services UK GSO Oct-14
Hillarys UK Ares, GE, Permira Aug-14
Itas TIM Group France Tikehau, Macquarie - Jul-14
Parkdean UK Ares, GE Apr-14
DORC Holding Netherlands Ares, GE Mar-14
Trust Inns UK Macquarie - Feb-14
NoteMachine UK Ares, GE Feb-14
Alternative Lender Deal Tracker Q1 2016 | Insights into the Alternative Lending market
36
Which landmark unitranche deals have been completed?Selected Landmark Unitranche Deals (>€90m)
0 100 300200 400 500 600
Source: LCD, an offering of S&P Global Market Intelligence, Deloitte research and other publicly available sources
© Deloitte Alternative Capital Solutions
Alternative Lender Deal Tracker Q1 2016 | Insights into the Alternative Lending market
37
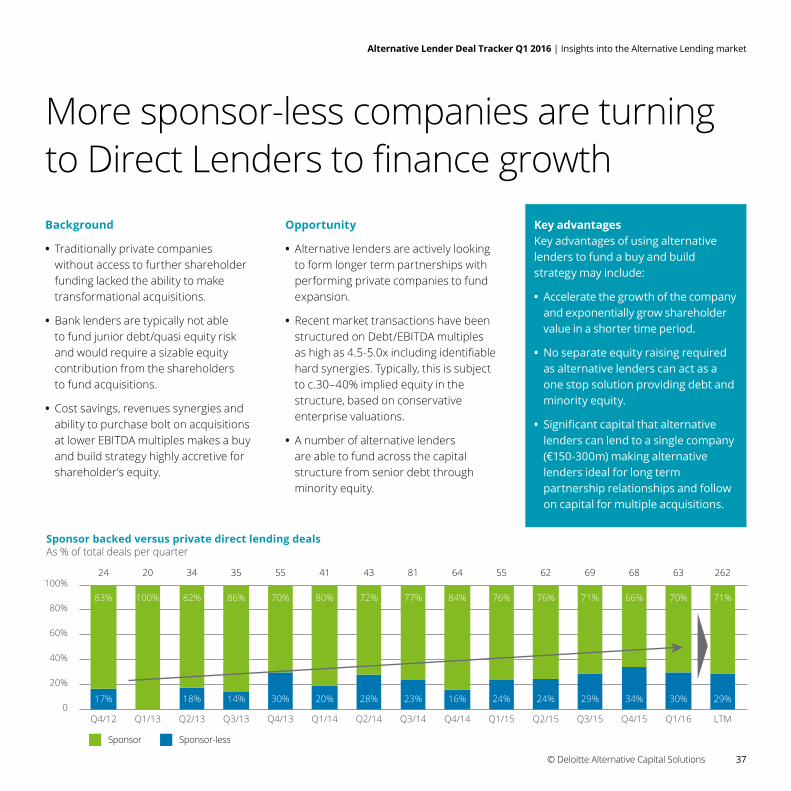
More sponsor-less companies are turning to Direct Lenders to finance growthBackground
• Traditionally private companies without access to further shareholder funding lacked the ability to make transformational acquisitions.
• Bank lenders are typically not able to fund junior debt/quasi equity risk and would require a sizable equity contribution from the shareholders to fund acquisitions.
• Cost savings, revenues synergies and ability to purchase bolt on acquisitions at lower EBITDA multiples makes a buy and build strategy highly accretive for shareholder’s equity.
Opportunity
• Alternative lenders are actively looking to form longer term partnerships with performing private companies to fund expansion.
• Recent market transactions have been structured on Debt/EBITDA multiples as high as 4.5-5.0x including identifiable hard synergies. Typically, this is subject to c.30–40% implied equity in the structure, based on conservative enterprise valuations.
• A number of alternative lenders are able to fund across the capital structure from senior debt through minority equity.
Key advantagesKey advantages of using alternative lenders to fund a buy and build strategy may include:
• Accelerate the growth of the company and exponentially grow shareholder value in a shorter time period.
• No separate equity raising required as alternative lenders can act as a one stop solution providing debt and minority equity.
• Significant capital that alternative lenders can lend to a single company (€150-300m) making alternative lenders ideal for long term partnership relationships and follow on capital for multiple acquisitions.
20%
0
60%
40%
80%
100%
Q1/13Q4/12 Q3/13Q2/13 Q4/13 Q1/14 Q2/14 Q3/14 Q4/14 Q1/15 Q2/15 Q3/15 Q1/16 LTMQ4/15
17% 18% 14% 30% 20% 28% 23% 16% 24% 24% 29% 34% 30% 29%
83%
24
100%
20
82%
34
86%
35
70%
55
80%
41
72%
43
77%
81
84%
64
76%
55
76%
62
71%
69
66%
68
70%
63
71%
262
Sponsor backed versus private direct lending dealsAs % of total deals per quarter
Sponsor Sponsor-less

Alternative Lender Deal Tracker Q1 2016 | Insights into the Alternative Lending market
38
Unlocking transformational acquisitions for privately owned companiesIndicative calculations
• The calculations on this page illustrate the effect of value creation through acquisitions financed using alternative lenders.
• In this example the equity value is growing from £100m to £252m in 4 years time. Without the acquisition, the equity value would have been only £177m, using the same assumptions and disregarding any value creation as a result of multiple arbitrage.
© Deloitte Alternative Capital Solutions
Assumptions
• Both business generate £10m EBITDA with £2m potential Synergies
• 10x EV/EBITDA multiple assumed (no multiple arbitrage assumed)
• No debt currently in the business
• Cost of debt is 8% with 5% penny warrants on top
• 10% EBITDA growth pa; 75% Cash conversion; 20% Corporate tax rate
• No transaction costs0
50
100
150
200
250
300
350
EV (£
Mill
ion)
Target EV Unitranche Equity Warrants Synergies
* EV is c.£147m and with c.£30m cash on balance sheet brings the equity value to c.£177m
Value creation through M&AIndicative calculations
£10m
+ =
Step 1 – Acquisition Step 3 – Value After 4 Years ResultStep 2 –Funding
£10m £22m
Buyer Combined PostDeal CapStructure
Valuecreationdue to
synergies
£22m
EquityValue
Growth
£32m £15m
Cap StructureAfter 4 YearsWith Acq
Cap StructureAfter 4 YearsWithout Acq
£75m of additional value creationfor equity holders as a result of the acquisition
100Equity
Funding100
200
13
2020
252
Outstanding debt (£55m) & warrants (£13m) after 4 years
177*
Target
100
DebtFunding
100
55

© Deloitte Alternative Capital Solutions
Alternative Lender Deal Tracker Q1 2016 | Deloitte’s European CFO Survey
39
Deloitte’s European CFO Survey
© Deloitte Alternative Capital Solutions

© Deloitte Alternative Capital Solutions
Alternative Lender Deal Tracker Q1 2016 | Deloitte’s European CFO Survey
40
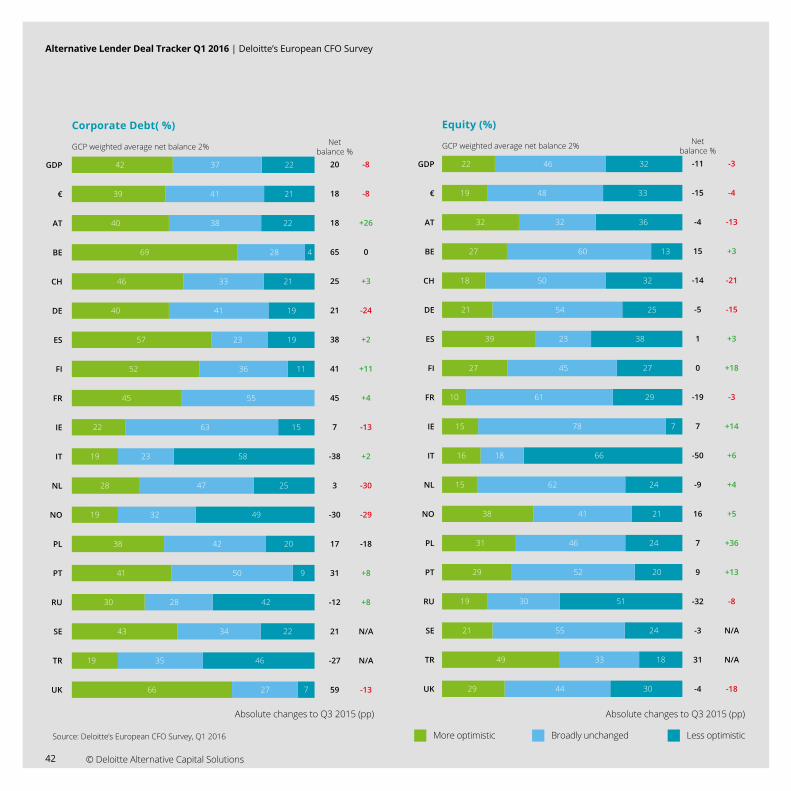
Results from Deloitte’s European CFO Survey, Q1 2016Key FindingsOptimism on the up…
• Of the nearly 1,500 participating CFOs across 17 countries, a small majority of CFOs say they have a more positive view about growth in their businesses than they did six months ago. CFOs in Eurozone countries are once again more optimistic about the financial prospects for their companies than their non-Eurozone peers
• The outlook on employment, has been a particular source of optimism in the Eurozone despite the overall fall across Europe, with the outlook for hiring particularly strong in Italy and Ireland – two countries that saw among the sharpest rise in unemployment following the financial crisis of 2008-09
• Monetary policy has also continued to spur growth, with central banks incentivising bank lending to stimulate activity; the outlook for bank borrowing has improved again from six months ago, and remains positive.
But politics could puncture growth…
• Europe entered 2016 facing a number of political and geopolitical challenges, which seem to be weighing heavily on sentiment in a number of countries. Geopolitical or political factors rank as the top two business risks for two-fifths of CFOs
• A large portion of CFOs report levels of external uncertainty to be higher than normal, and rising perceptions of this uncertainty have been accompanied by risk appetite falling sharply and CFOs reporting increased pressures on operating margins
• The Transatlantic Trade and Investment Partnership (TTIP), the proposed trade agreement between the US and the EU, is being met with limited enthusiasm, with 73% of the cohort reporting that there would be no discernible impact to their businesses from the deal, reinforcing the notion that political and geopolitical uncertainties are currently more prominent issues for CFOs
Given all these issues, it is unsurprising that CFOs are no more than cautiously optimistic.
The European CFO Survey is part of a global cohort of surveys benchmarking the current and future intentions and opinions of European Chief Financial Officers. The findings discussed in this report are representative of the options of 1,490 CFOs based in 17 European countries: Austria, Belgium, Finland, France, Germany, Ireland, Italy, the Netherlands, Norway, Poland, Portugal, Russia, Spain, Sweden, Switzerland, Turkey and the United Kingdom. CFOs were all contacted between January and March 2016.
Of the nearly 1,500 participating CFOs across 17 countries, a small majority of CFOs say they have a more positive view about growth in their businesses than they did six months ago.

Absolute changes to Q3 2015 (pp)Absolute changes to Q3 2015 (pp)
Source: Deloitte’s European CFO Survey, Q1 2016
GCP weighted average net balance 2%
GDP
€
AT
BE
CH
DE
ES
FI
FR
IE
IT
NL
NO
PL
PT
RU
SE
TR
UK
Netbalance %
54
56
63
79
54
65
76
36
68
7
21
65
59
54
42
-10
72
2
83
+3
+5
+4
-3
-4
-1
+11
-2
+15
-6
+2
+21
-5
-28
+3
+4
N/A
N/A
+4
67 21 12
66 24 10
72 20 9
79 21
69 15 16
70 25 5
86 4 10
57 23 20
71 26 3
27 53 20
48 25 27
71 24 6
69 20 10
61 33 7
56 30 14
35 19 45
78 15 7
38 27 35
87 8 4
Bank Borrowing (%)
GCP weighted average net balance 2%
GDP
€
AT
BE
CH
DE
ES
FI
FR
IE
IT
NL
NO
PL
PT
RU
SE
TR
UK
Netbalance %
2
4
-6
8
10
0
33
24
-19
39
20
6
-26
21
-1
-4
50
10
-15
0
-1
-14
-1
+13
+11
-15
+24
-10
+2
-3
+14
+13
-7
-45
-8
-19
N/A
-5
25 53 22
23 57 19
19
19
19
56
33 42
27 16
61
47 39 14
36 53 11
10 61
45 48 6
28 64
22 61 17
18 38 44
42 37 21
30 39
26 44 30
62 27 12
34 43 24
17 51 32
Compared to three/six months ago, how do you feel about the financial prospects for your company?
More optimistic Less optimisticBroadly unchanged
25
25
57
19
8
31
41
Alternative Lender Deal Tracker Q1 2016 | Deloitte’s European CFO Survey
© Deloitte Alternative Capital Solutions
Netbalance %GCP weighted average net balance 2%
-11
-15
-4
15
-14
-5
1
0
-19
7
-50
-9
16
7
9
-32
-3
31
-4
-3
-4
-13
+3
-21
-15
+3
+18
-3
+14
+6
+4
+5
+36
+13
-8
N/A
N/A
-18
GDP
€
AT
BE
CH
DE
ES
FI
FR
IE
IT
NL
NO
PL
PT
RU
SE
TR
UK
22 46 32
19 48 33
32 32 36
27 60 13
18 50 32
21 54 25
39 23 38
27 45 27
10 61 29
15 78 7
16 18 66
15 62 24
38 41 21
31 46 24
29 52 20
19 30 51
21 55 24
49 33 18
29 44 30
Equity (%)
GCP weighted average net balance 2% Netbalance %
20
18
18
65
25
21
38
41
45
7
-38
3
-30
17
31
-12
21
-27
59
-8
-8
+26
0
+3
-24
+2
+11
+4
-13
+2
-30
-29
-18
+8
+8
N/A
N/A
-13
GDP
€
AT
BE
CH
DE
ES
FI
FR
IE
IT
NL
NO
PL
PT
RU
SE
TR
UK
42 37 22
39 41 21
40 38 22
69 28 4
46 33 21
40 41 19
57 23 19
52 36 11
45 55
22 63 15
19 23 58
28 47 25
19 32 49
38 42 20
41 50 9
30 28 42
43 34 22
19 35 46
66 27 7
Corporate Debt( %)
Absolute changes to Q3 2015 (pp)Absolute changes to Q3 2015 (pp)
More optimistic Less optimisticBroadly unchangedSource: Deloitte’s European CFO Survey, Q1 2016
42
Alternative Lender Deal Tracker Q1 2016 | Deloitte’s European CFO Survey
© Deloitte Alternative Capital Solutions

Alternative Lender Deal Tracker Q1 2016 | Deloitte Debt and Capital Advisory
43© Deloitte Alternative Capital Solutions
Deloitte Debt and Capital Advisory

© Deloitte Alternative Capital Solutions
Depth and breadth of expertise in a variety of situations
Alternative Lender Deal Tracker Q1 2016 | Deloitte Debt and Capital Advisory
44
What do we do for our clients?Debt and Capital Advisory
Independent advice
• We provide independent advice to borrowers across the full spectrum of debt markets through our global network
• Completely independent from providers of finance - our objectives are fully aligned with those of our clients
Global resources & execution expertise
• A leading team of 140 debt professionals based in 30 countries including Europe, North America, Africa and Asia, giving true global reach
• Our expertise ranges from the provision of strategic advice on the optimum capital structure and available sources of finance through to the execution of raising debt
Market leading team
• Widely recognised as a Global leader with one of the largest Debt Advisory teams
• We pride ourselves on our innovative approach to challenging transactions and the quality of client outcomes we achieve, using our hands on approach
Demonstrable track record
• In the last 12 months, we have advised on over 100 transactions with combined debt facilities in excess of €10bn
• Our target market is debt transactions ranging from €25m up to €750m
Refinancing
• Maturing debt facilities
• Rapid growth and expansion
• Accessing new debt markets
• Recapitalisations facilitating payments to shareholders
• Asset based finance to release value from balance sheet
• Off balance sheet finance
• Assessing multiple proposals from lenders
Acquisitions, disposals, mergers
• Strategic acquisitions, involving new lenders and greater complexity
• Staple debt packages to maximise sale proceeds
• Additional finance required as a result of a change in strategic objectives
• FX impacts that need to be reflected in the covenant definitions
• Foreign currency denominated debt or operations in multiple currencies
Restructuring or negotiating
• New money requirement
• Real or potential breach of covenants
• Short term liquidity pressure
• Credit rating downgrade
• Existing lenders transfer debt to an alternative lender group
• Derivatives in place and/or banks hedging requirements to be met
Treasury
• Operations in multiple jurisdictions and currencies creating FX exposures
• Develop FX, interest rate and commodity risk management strategies
• Cash in multiple companies, accounts, countries and currencies
• Hedging implementation or banks hedging requirements to be met
Debt and Capital Services provided
© Deloitte Alternative Capital Solutions
© Deloitte Alternative Capital Solutions
Alternative Lender Deal Tracker Q1 2016 | Deloitte Debt and Capital Advisory
45
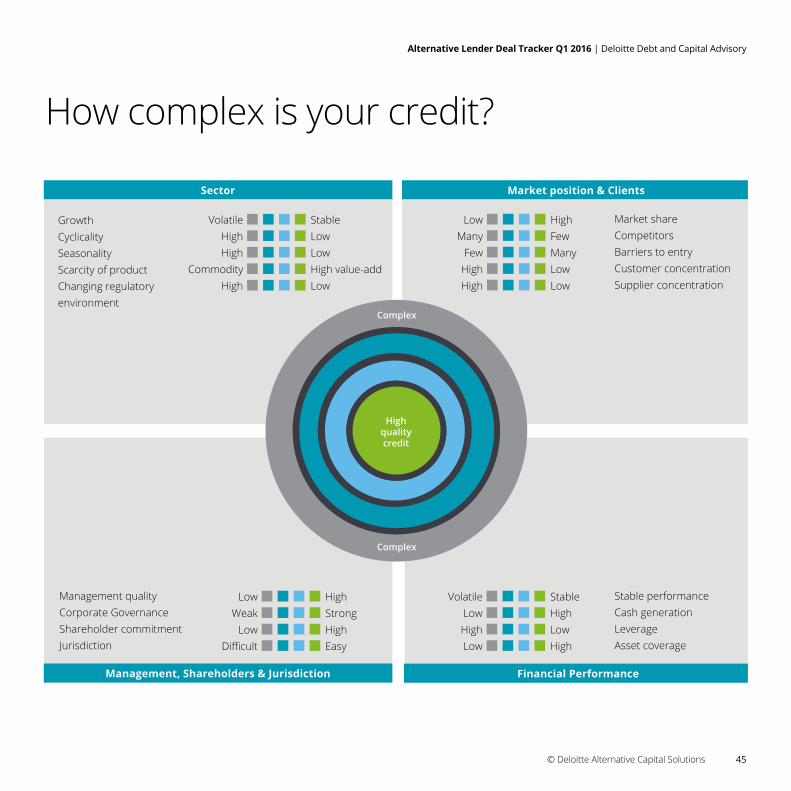
Sector
Growth CyclicalitySeasonalityScarcity of product Changing regulatoryenvironment
StableLowLowHigh value-addLow
Volatile High High
Commodity High
Market position & Clients
Market share CompetitorsBarriers to entry Customer concentrationSupplier concentration
High Few ManyLowLow
LowMany
Few High
High
Stable performance Cash generationLeverage Asset coverage
Stable HighLowHigh
VolatileLow High
Low
Financial Performance
Management quality Corporate GovernanceShareholder commitment Jurisdiction
High StrongHighEasy
LowWeak
Low Difficult
Management, Shareholders & Jurisdiction
Complex
Complex
Highqualitycredit
How complex is your credit?

Alternative Lender Deal Tracker Q1 2016 | Deloitte Debt and Capital Advisory
46 © Deloitte Alternative Capital Solutions
Partners Debt Advisory UK
Fenton BurginPartner+44 (0) 20 7303 [email protected]
Chris Skinner Partner+44 (0) 20 7303 [email protected]
John Gregson Partner+44 (0) 20 7007 [email protected]
Nigel Birkett Partner+44 (0) 161 455 [email protected]
Karlien PorrePartner+44 (0) 20 7303 [email protected]
Nick SoperPartner +44 (0) 20 7007 [email protected]
UK Team
James Blastland Director+44 (0) 20 7303 [email protected]
Robert ConnoldDirector+44 (0) 20 7007 [email protected]
Anil Gupta Director+44 (0) 113 292 [email protected]
Alan HamiltonDirector+44 (0) 131 535 [email protected]
Floris Hovingh Director+44 (0) 20 7007 [email protected]
Roger LamontDirector+44 (0) 20 7007 [email protected]
Adam Worraker Director +44 (0) 20 7303 [email protected]
Andrew CruickshankAssistant Director+44 (0) 20 7007 [email protected]
Alex DugayAssistant Director+44 (0) 20 7007 [email protected]
David FlemingAssistant Director+44 (0) 20 7007 [email protected]
Henry PearsonAssistant Director+44 (0) 20 7303 [email protected]
Jon Petty Assistant Director+44 (0) 161 455 6186 [email protected]
Adam SookiaAssistant Director+44 (0) 113 292 [email protected]
Alex BakerManager+44 (0) 161 455 5770 [email protected]
Tom BirkettManager+44 (0) 20 7007 [email protected]
Holly FletcherManager+44 (0) 161 455 [email protected]
Dave GrassbyManager+44 (0) 161 455 [email protected]
Lili JonesManager+44 (0) 20 7007 [email protected]
Sabina KerrManager+44 (0) 20 7303 [email protected]
Phil McManusManager+44 (0) 20 7303 [email protected]
James MerryManager+44 (0) 20 7303 [email protected]
Tom NijstenManager+44 (0) 20 7007 1039 [email protected]
Alex PenneyManager+44 (0) 20 7303 [email protected]
Stephanie RichardsManager+44 (0) 20 7303 [email protected]
Alex SkeapingManager+44 (0) 20 7007 [email protected]
Lucy FallAssistant Manager+44 (0) 20 7007 [email protected]
Michael Keetley Assistant Manager+44 (0) 131 535 0 [email protected]
Sam White Assistant Manager+44 (0) 20 7007 1224 [email protected]
UK Deloitte Debt and Capital Advisory One of the most successful Debt and Capital Advisory teams
Alternative Lender Deal Tracker Q1 2016 | Deloitte Debt and Capital Advisory
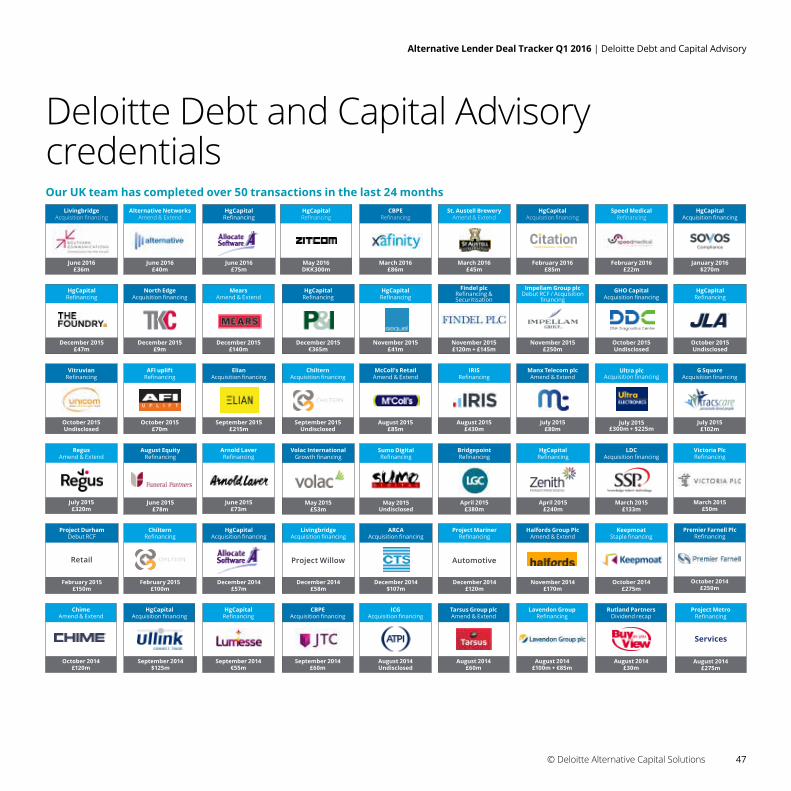
47© Deloitte Alternative Capital Solutions
Deloitte Debt and Capital Advisory credentialsOur UK team has completed over 50 transactions in the last 24 months
ChimeAmend & Extend
October 2014£120m
Project DurhamDebut RCF
February 2015£150m
Retail
VitruvianRefinancing
October 2015Undisclosed
RegusAmend & Extend
July 2015£320m
HgCapital Refinancing
December 2015£47m
LivingbridgeAcquisition financing
June 2016£36m
Rutland PartnersDividend recap
August 2014£30m
LDCAcquisition financing
March 2015£133m
KeepmoatStaple financing
October 2014£275m
Ultra plcAcquisition financing
July 2015£300m + $225m
Speed MedicalRefinancing
February 2016£22m
GHO CapitalAcquisition financing
October 2015Undisclosed
HgCapitalAcquisition financing
February 2016£85m
Halfords Group PlcAmend & Extend
November 2014£170m
Lavendon GroupRefinancing
August 2014£100m + €85m
HgCapitalRefinancing
April 2015£240m
Impellam Group plcDebut RCF / Acquisition
financing
November 2015£250m
Manx Telecom plcAmend & Extend
July 2015£80m
St. Austell BreweryAmend & Extend
March 2016£45m
Tarsus Group plcAmend & Extend
August 2014£60m
Project MarinerRefinancing
December 2014£120m
Automotive
IRISRefinancing
August 2015£430m
BridgepointRefinancing
April 2015£380m
Findel plcRefinancing & Securitisation
November 2015£120m + £145m
HgCapitalRefinancing
November 2015£41m
CBPERefinancing
March 2016£86m
ICGAcquisition financing
August 2014Undisclosed
Sumo DigitalRefinancing
May 2015Undisclosed
ARCAAcquisition financing
December 2014$107m
McColl’s RetailAmend & Extend
August 2015£85m
ChilternAcquisition financing
September 2015Undisclosed
HgCapitalRefinancing
December 2015€365m
HgCapitalRefinancing
May 2016DKK300m
LivingbridgeAcquisition financing
December 2014£58m
Project Willow
CBPEAcquisition financing
September 2014£60m
Volac InternationalGrowth financing
May 2015£53m
ChilternRefinancing
February 2015£100m
August EquityRefinancing
June 2015£78m
North EdgeAcquisition financing
December 2015£9m
AFI upliftRefinancing
October 2015£70m
June 2016£40m
Alternative NetworksAmend & Extend
HgCapitalAcquisition financing
September 2014$125m
Arnold Laver Refinancing
June 2015£73m
ElianAcquisition financing
September 2015£215m
MearsAmend & Extend
December 2015£140m
HgCapitalRefinancing
June 2016£75m
HgCapitalRefinancing
September 2014€55m
HgCapitalAcquisition financing
December 2014£57m
Premier Farnell PlcRefinancing
October 2014£250m
G SquareAcquisition financing
July 2015£102m
Victoria PlcRefinancing
March 2015£50m
HgCapitalRefinancing
October 2015Undisclosed
HgCapitalAcquisition financing
January 2016$270m
Project MetroRefinancing
August 2014£275m
Services

48 © Deloitte Alternative Capital Solutions
Alternative lender deal tracker Q3 2015 | Deloitte Debt and Capital Advisory credentials
Global Deloitte Debt and Capital Advisory One of the most successful Debt and Capital Advisory teamsCo-heads Global senior team
EMEA Australia Austria Belgium Brazil Canada Chile China
Fenton Burgin+44 (0) 20 7303 [email protected]
Katherine Howard+61 293 223 [email protected]
Ben Trask +4 315 3700 [email protected]
Koen Callens + 32 2 749 58 [email protected]
Carlos Rebelatto+5 5813 464 [email protected]
Robert Olsen+1 41 6601 [email protected]
Jaime Retamal+5 622 729 [email protected]
Patrick Fung+852 2238 [email protected]
Americas Czech Republic Denmark France Germany Hungary India Ireland
Andrew Luetchford +1 41 6601 [email protected]
Radek Vignat+420 246 042 [email protected]
Thomas Bertelsen+45 30 93 53 69 [email protected]
Olivier Magnin+33 1 4088 [email protected]
Axel Rink+49 (69) 75695 [email protected]
Bela Seres+36 428 [email protected]
Gordon Smith+9 122 618 [email protected]
Michael Flynn+353 1417 [email protected]
Asia Pacific Israel Italy Japan Mexico Netherlands Norway Poland
Richmond Ang+65 6216 3303 [email protected]
Joseph Bismuth+972 3 608 [email protected]
Mario Casartelli+39 0 2833 [email protected]
Haruhiko Yoshie+81 80 443 51 [email protected]
Jorge Schaar+5 255 5080 [email protected]
Alexander Olgers+31 8 8288 [email protected]
Andreas Enger+4 723 279 [email protected]
Michal Lubieniecki+48 22 5110 [email protected]
Portugal Romania Singapore South Africa South Korea Spain Sweden
Jose Gabriel Chimeno+35 121 042 [email protected]
Hein van Dam+40 21 2075 [email protected]
Richmond Ang+65 6216 3303 [email protected]
Fredre Meiring+27 1 1209 [email protected]
Kenneth Kang+82 2 6676 [email protected]
Jordi Llido+ 34 9 3280 41 [email protected]
Michael Maccallum +46 752 462 [email protected]
Switzerland UAE UK USA
John Feigl+41 582 796 [email protected]
Aziz Ul-Haq+9 714 376 [email protected]
Fenton Burgin+44 (0) 20 7303 [email protected]
John Deering+1 70 4333 [email protected]

Alternative lender deal tracker Q3 2015 | Deloitte Debt and Capital Advisory credentials
49© Deloitte Alternative Capital Solutions
Deloitte Debt and Capital Advisory credentialsSelected Global transactions
Groupe CBVAcquisition and
Refinancing
September 2015€24m
France
Husejernes Forsikring Assurnace Agentur
Growth financing
March 2016£6m
Denmark
Nordian Acquisition financing
April 2016Undisclosed
Netherlands
Russell Court HotelRefinancing
October 2014€9m
Ireland
Clyde Real EstateDebt Raising
February 2015€12mIreland
EzentisRefinancing
June 2015€126m
Spain
GHO CapitalAcquisition financing
October 2015Undisclosed
UK / USA
Infare Solutions A/SAcquisition financing
January 2016£6m
Denmark
Panaria GroupGrowth financing
April 2016€10m
Italy
Ausnutria HyprocaRefinancing
July 2015Undisclosed
Netherlands
Inver Energy Ltd.Debt raising
November 2014€120m
Ireland
LED GroupRefinancing
March 2015€15m
Ireland
CasambaGrowth financing
February 2016 Undisclosed
Cara PharmacyRefinancing
May 2016€15m
Ireland
Student HousingGrowth financing
December 2015Undisclosed
Student Housing
NetherlandsUSA
Inekon Group a.s.Refinancing
August 2015€35m
Czech Republic
Royal Burger GroepRefinancing
June 2015Undisclosed
Netherlands
CoeclericiAmend & Extend
December 2014€150m
Italy
SOPUGrowth financing
December 2015Undisclosed
Denmark
HgCapital Refinancing
May 2016DKK300m
UK / Denmark
E-VisionGrowth financing
January 2016Undisclosed
Netherlands
Walls ConstructionManagement Buy Out
April 2015Undisclosed
Ireland
Grupo AltexUS Private Placement
August 2015$107m
Mexico / Chile / USA
ARCAAcquisition financing
December 2014$107mUK / USA
HgCapital Acquisition financing
January 2016$270m
UK / USA
SureID IncDebt raising
November 2015Undisclosed
USA
Trident Hotel Kinsale Refinancing
April 2016€12m
Ireland
Inekon Group a.s.Refinancing
April 2015Undisclosed
Czech Republic
AcomeRefinancing
July 2015€60m
France
Associations, Inc.Refinancing
December 2014Undisclosed
USA
The Vincent Hotel GroupStapled finance
October 2015Undisclosed
Netherlands
HPD Group ApSAcquisition financing
January 2016£35m
Denmark
MediGain, LLCRefinancing
October 2014Undisclosed
USA
Planon(EIB) growth financing
June 2015Undisclosed
Netherlands
Crystalite BohemiaRefinancing
March 2015€3m
Czech Republic
Actons Hotel Kinsale Refinancing
April 2016€12m
Ireland
Scanenergi solutions Growth financing
January 2016£10m
Denmark
LindersRefinancing
April 2016€79m
Ireland
Dalata Hotel GroupAcquisition and
Refinancing
January 2015€350mIreland
Frontline Performance Group
Refinancing
June 2015Undisclosed
USA
ATMDebt Advisory
October 2014€472m
Spain
Ace PartnersAcquisition financing
September 2015Undisclosed
Netherlands
DeceuninckDebt Advisory
October 2014€157m
Horse Racing IrelandDebt raising
September 2014€15m
IrelandBelgium
STRABAGAcquisition Refinancing
September 2014Undisclosed
Austria
Group of ButchersAcquisition financing
October 2014Undisclosed
Netherlands
HgCapitalAcquisition financing
September 2014$125m
France
Arese Shopping CentreDebt Raising
September 2014€194m
Italy
TEA S.p.A.
HemminkAcquisition financing
September 2015Undisclosed
Netherlands
HgCapitalRefinancing
December 2015€365m
UK / Germany
Valle Nevado S.A.Private placement
December 2014$45mChile
Kuiken N.V.Acquisition financing
June 2015Undisclosed
Netherlands
Primetime Property Holdings Limited
Medium notes issue
June 2016BWP105m
Botswana / South Africa
Grupo Industrial IGSARefinancing
March 2016$80m
Mexico / Chile

Alternative lender deal tracker Q3 2015 | Notes
50 © Deloitte Alternative Capital Solutions
Notes

DisclaimerThis material has been prepared by the Private Fund Group of the International Wealth Management division of Credit Suisse (“Credit Suisse”). It is not investment research or a research recommendation for regulatory purposes as it does not constitute substantive research or analysis. This material is provided for informational and illustrative purposes and is intended for your use only. It does not constitute an invitation or offer to the public to subscribe for or purchase any of the products or services mentioned. The information contained in this document has been provided as a general market commentary only and does not constitute any form of regulated financial advice, legal, tax or other regulated financial service. It is intended only to provide observations and views of the said individual Credit Suisse personnel (to the exclusion of any other Credit Suisse personnel or the proprietary positions of Credit Suisse) as of the date of writing without regard to the date on which the reader may receive or access the information. Information and opinions presented in this material have been obtained or derived from external sources believed by Credit Suisse to be reliable, but Credit Suisse makes no representation as to their accuracy or completeness. Credit Suisse accepts no liability for loss arising from the use of this material. It should be noted that historical returns and financial market scenarios are no guarantee of future performance. Credit Suisse provides no guarantee with regard to the content and completeness of the information and does not accept any liability for losses that might arise from making use of the information.
This material is not directed at, or intended for distribution to or use by, any person or entity who is a citizen or resident of or located in any jurisdiction where such distribution, publication, availability or use would be contrary to applicable law or regulation or which would subject Credit Suisse and/or its subsidiaries or affiliates to any registration or licensing requirement within such jurisdiction. Materials have been furnished to the recipient solely for inclusion in the Deloitte Alternative Lender Deal Tracker by the Private Fund Group of the International Wealth Management division of Credit Suisse.
Important Notice in relation to page 23-24

Deloitte refers to one or more of Deloitte Touche Tohmatsu Limited (“DTTL”), a UK private company limited by guarantee, and its network of member firms, each of which is a legally separate and independent entity. Please see www.deloitte.co.uk/about for a detailed description of the legal structure of DTTL and its member firms.
Deloitte LLP is the United Kingdom member firm of DTTL.This publication has been written in general terms and therefore cannot be relied on to cover specific situations; application of the principles set out will depend upon the particular circumstances involved and we recommend that you obtain professional advice before acting or refraining from acting on any of the contents of this publication. Deloitte LLP would be pleased to advise readers on how to apply the principles set out in this publication to their specific circumstances. Deloitte LLP accepts no duty of care or liability for any loss occasioned to any person acting or refraining from action as a result of any material in this publication.
© 2016 Deloitte LLP. All rights reserved.
Deloitte LLP is a limited liability partnership registered in England and Wales with registered number OC303675 and its registered office at 2 New Street Square, London EC4A 3BZ, United Kingdom. Tel: +44 (0) 20 7936 3000 Fax: +44 (0) 20 7583 1198.
Designed and produced by The Creative Studio at Deloitte, London. J6988
Top Related