


Languages
Pages
Legal


BIS Working PapersNo 538
Sovereign yields and the risk-taking channel of currency appreciation by Boris Hofmann, Ilhyock Shim and Hyun Song Shin
Monetary and Economic Department
January 2016
JEL classification: G12, G15, G23
Keywords: bond spread, capital flow, credit risk, emerging market, exchange rate.

BIS Working Papers are written by members of the Monetary and Economic Department of the Bank for International Settlements, and from time to time by other economists, and are published by the Bank. The papers are on subjects of topical interest and are technical in character. The views expressed in them are those of their authors and not necessarily the views of the BIS.
This publication is available on the BIS website (www.bis.org).
© Bank for International Settlements 2016. All rights reserved. Brief excerpts may be reproduced or translated provided the source is stated.
ISSN 1020-0959 (print) ISSN 1682-7678 (online)

Sovereign yields and the risk-taking channelof currency appreciation�
Boris HofmannBank for International Settlements
Ilhyock ShimBank for International Settlements
Hyun Song ShinBank for International Settlements
January 18, 2016
Abstract
Currency appreciation against the US dollar is associated with the compression ofemerging market economy (EME) sovereign yields. We �nd that this yield compressionis due to reduced risk premiums rather than expectations of interest rates alreadypriced into forward rates. We explore a model which ties together dollar credit toEME corporates, sovereign tail risks and global investor portfolio adjustments drivenby economic capital constraints. Consistent with our model, we �nd no empiricalassociation between currency appreciation and sovereign spreads when we use the trade-weighted e¤ective exchange rate that is unrelated to the US dollar.
JEL codes. G12, G15, G23
Keywords: bond spread, capital �ow, credit risk, emerging market, exchange rate.
�We thank Enrique Alberola, Yavuz Arslan, Fernando Avalos, Ryan Banerjee, Claudio Borio, ValentinaBruno, Stjin Claessens, Jon Clark, Andrew Filardo, Ben Friedman, Zhiguo He, Peter Hoerdahl, SebnemKalemli-Ozcan, Jonathan Kearns, Enisse Kharroubi, Emanuel Kohlscheen, Aytek Malkhozov, Aaron Mehro-tra, Madhusudan Mohanty, Robert McCauley, Patrick McGuire, Jonathan Ostry, Luiz Pereira da Silva,Lucrezia Reichlin, Phurichai Rungcharoenkitkul, Andreas Schrimpf, Chang Shu, Suresh Sundaresan, Vla-dyslav Sushko, Lars Svensson, Bruno Tissot, Philip Turner, Christian Upper, James Yetman and Feng Zhufor comments, and Jimmy Shek and Agne Subelyte for their excellent research assistance. We thank partici-pants at presentations at the Bank of Japan and the Bank for International Settlements, and at the FederalReserve Board conference on �Monetary policy implementation and transmission in the post-crisis period�.The views presented here are solely those of the authors and do not necessarily represent those of the Bankfor International Settlements.
1

1 Introduction
What is the macroeconomic impact of currency appreciation? Is it expansionary or con-
tractionary? The answer from traditional arguments in the spirit of the Mundell-Fleming
model (Mundell (1963), Fleming (1962)) is that currency appreciation is contractionary. An
appreciation is associated with a decline in net exports and a contraction in output, other
things being equal.
The other side of the argument appeals to the empirical regularity that currency appre-
ciation often goes hand in hand with rapid credit growth on the back of more permissive
�nancial conditions (Kaminsky and Reinhart (1999), Borio and Lowe (2002), Reinhart and
Reinhart (2009)). The boom may be accompanied by the build-up of �nancial vulnerabilities.
The combination of a rapid increase in leverage and a sharp appreciation of the currency
commonly emerges as the most reliable indicator of �nancial vulnerability and of subsequent
crises (see, for instance, Gourinchas and Obstfeld (2012)).
Our paper contributes to this debate by exploring the connection between exchange rates
and sovereign bond yields for emerging market economies (EMEs). Given the tight links
between sovereign yields and domestic lending rates to corporates and households, our ex-
ploration sheds light on the relationship between exchange rates and domestic �nancial con-
ditions more broadly.
We make two contributions in our paper.
The �rst is empirical. We lay out the evidence on the relationship between currency
appreciation and EME sovereign yield indicators, including the spreads of local currency
and foreign currency sovereign yields over the corresponding US Treasury yield, and the
sovereign credit default swap (CDS) spread. Currency appreciation, de�ned as appreciation
of an EME currency against the US dollar, is associated with the compression of the EME�s
sovereign spreads and is accompanied by portfolio in�ows into sovereign bond funds.
Delving deeper, we �nd that these �uctuations in spreads are due to shifts in the risk
premium, rather than in any deviations in interest rates already priced into forward rates.
We examine the local currency risk spread measure due to Du and Schreger (2015), de�ned
as the spread of the yield on EME local currency government bonds achievable by a dollar-
based investor over the equivalent US Treasury security. The de�nition takes account of
hedging of currency risk through cross-currency swaps. We �nd strong evidence that cur-
rency appreciation against the US dollar is associated with a compression of the Du-Schreger
spread. In contrast, the expectations of interest rates already priced into forward rates are
not signi�cantly a¤ected. These results suggest that the local currency sovereign spread is
driven primarily by shifts in the risk premium and point to the importance of risk taking
1
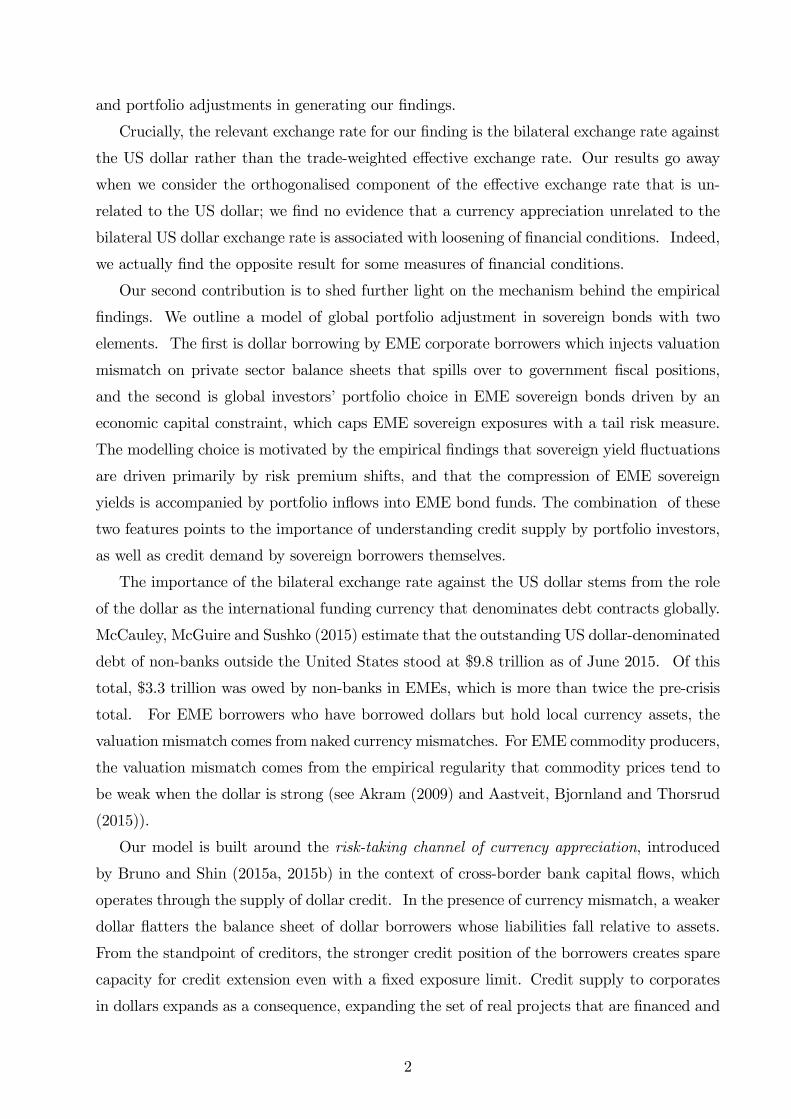
and portfolio adjustments in generating our �ndings.
Crucially, the relevant exchange rate for our �nding is the bilateral exchange rate against
the US dollar rather than the trade-weighted e¤ective exchange rate. Our results go away
when we consider the orthogonalised component of the e¤ective exchange rate that is un-
related to the US dollar; we �nd no evidence that a currency appreciation unrelated to the
bilateral US dollar exchange rate is associated with loosening of �nancial conditions. Indeed,
we actually �nd the opposite result for some measures of �nancial conditions.
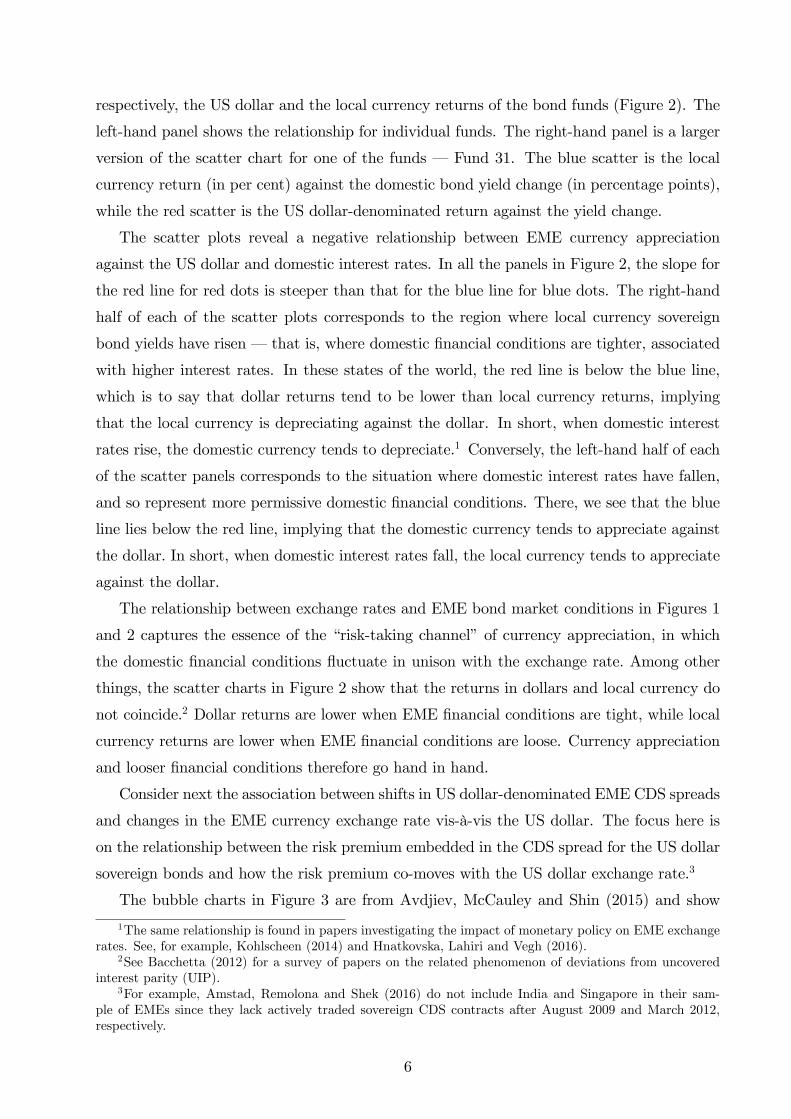
Our second contribution is to shed further light on the mechanism behind the empirical
�ndings. We outline a model of global portfolio adjustment in sovereign bonds with two
elements. The �rst is dollar borrowing by EME corporate borrowers which injects valuation
mismatch on private sector balance sheets that spills over to government �scal positions,
and the second is global investors�portfolio choice in EME sovereign bonds driven by an
economic capital constraint, which caps EME sovereign exposures with a tail risk measure.
The modelling choice is motivated by the empirical �ndings that sovereign yield �uctuations
are driven primarily by risk premium shifts, and that the compression of EME sovereign
yields is accompanied by portfolio in�ows into EME bond funds. The combination of these
two features points to the importance of understanding credit supply by portfolio investors,
as well as credit demand by sovereign borrowers themselves.
The importance of the bilateral exchange rate against the US dollar stems from the role
of the dollar as the international funding currency that denominates debt contracts globally.
McCauley, McGuire and Sushko (2015) estimate that the outstanding US dollar-denominated
debt of non-banks outside the United States stood at $9.8 trillion as of June 2015. Of this
total, $3.3 trillion was owed by non-banks in EMEs, which is more than twice the pre-crisis
total. For EME borrowers who have borrowed dollars but hold local currency assets, the
valuation mismatch comes from naked currency mismatches. For EME commodity producers,
the valuation mismatch comes from the empirical regularity that commodity prices tend to
be weak when the dollar is strong (see Akram (2009) and Aastveit, Bjornland and Thorsrud
(2015)).
Our model is built around the risk-taking channel of currency appreciation, introduced
by Bruno and Shin (2015a, 2015b) in the context of cross-border bank capital �ows, which
operates through the supply of dollar credit. In the presence of currency mismatch, a weaker
dollar �atters the balance sheet of dollar borrowers whose liabilities fall relative to assets.
From the standpoint of creditors, the stronger credit position of the borrowers creates spare
capacity for credit extension even with a �xed exposure limit. Credit supply to corporates
in dollars expands as a consequence, expanding the set of real projects that are �nanced and
2

raising economic activity, thereby improving the �scal position of the government. If the
corporate borrowing in dollars happens through state-owned enterprises in the oil and gas
sector as is the case in many EMEs, then the �scal impact may include the direct impact
through the dividends that are paid to government co¤ers.
In a period when the US dollar is weak, the risk-taking channel operates across the set of
EMEs, and a diversi�ed investor in EME sovereign bonds sees reductions in tail risks, allowing
greater portfolio positions for any given exposure limit stemming from an economic capital
constraint. As a consequence, a weaker dollar goes hand in hand with reduced sovereign tail
risks and increased portfolio �ows into EME sovereign bonds. Note that this mechanism holds
whether the sovereign bonds are denominated in domestic currency or in foreign currency.
However, when the dollar strengthens, these same relationships go into reverse and con-
spire to tighten �nancial conditions. Borrowers�balance sheets look weaker. Their cred-
itworthiness declines. Creditors�capacity to extend credit declines for any exposure limit,
and credit supply tightens, serving to dampen economic activity and the government �scal
position. The deteriorating �scal position increases tail risks for a diversi�ed investor in sov-
ereign bonds, which is then met by reductions in overall portfolio positions in EME sovereign
bonds. In this way, a stronger dollar coincides with portfolio out�ows from EME sovereign
bonds.
Our model sheds light on why it is the bilateral exchange rate against the US dollar that
drives our result on sovereign yields. This is because the risk-taking channel has to do with
leverage and risk taking, in contrast to the net exports channel which revolves around trade
and the e¤ective exchange rate. The wedge between the bilateral US dollar exchange rate
and the trade-weighted e¤ective exchange rate provides a window for a reconciliation of the
risk-taking channel with the net exports channel, and permits an empirical investigation that
disentangles the two channels.
Related literature
On the macroeconomic impact of currency depreciation, Krugman (2014) appeals to the net
exports channel in the Mundell-Fleming model to argue that a �sudden stop�is expansion-
ary under �oating exchange rates. In contrast, Blanchard et al. (2015) acknowledge that
the empirical evidence points to the contrary, and modify the Mundell-Fleming model by
introducing two classes of assets. In their extended model, currency appreciation may be
expansionary.
Our paper is related to the literature on monetary spillovers. Rey (2013, 2014) argues that
monetary policy shocks from advanced economies (AEs) spill over into �nancial conditions
3

elsewhere even in a regime of �oating exchange rates. Plantin and Shin (2016) examine a
global game with �oating exchange rates where the unique equilibrium exhibits two regimes
in monetary conditions. In one, currency appreciation goes hand in hand with lower domestic
interest rates, capital in�ows and higher credit growth. However, when the economy crosses
the equilibrium threshold, currency depreciation goes hand in hand with higher domestic
interest rates, capital out�ows and a contraction in credit.
The feedback e¤ect of currency appreciation is strengthened if domestic monetary policy
responds to the appreciation pressure by lowering domestic short-term rates to track global
short-term interest rates. Hofmann and Takáts (2015) �nd evidence of such co-movement of
short-term rates. The term �risk-taking channel�was coined by Borio and Zhu (2012) in
the broader context of the transmission of monetary policy, and the lessons from our paper
bear on this larger issue.
Earlier papers on the risk-taking channel focused on banking sector �ows, as in Bruno
and Shin (2015a, 2015b) and Cerutti, Claessens and Ratnovski (2014). Recent studies have
extended the �ndings to bond markets (see Sobrun and Turner (2015) and Feyen et al.
(2015)). The aggregate cross-country evidence on credit supply is complemented by micro-
empirical studies based on �rm- and issuance-level data which suggest that credit supply
�uctuations are key to understanding �nancial conditions (Morais, Peydró and Ruiz (2015)).
Based on evidence from loan-level data in Turkey, Baskaya et al. (2015) show that domestic
loan growth and the cost of borrowing, are strongly in�uenced by global �nancing conditions
proxied by the VIX and banking in�ows. Mian, Su� and Verner (2015) provide additional
cross-country evidence, and Agénor, Alper and Pereira da Silva (2014) examine broader
implications for �nancial stability.
Currency mismatch on EME corporate balance sheets has been a recurring theme. Krug-
man (1999) and Céspedes, Chang and Velasco (2004) examine models with corporate cur-
rency mismatch where currency appreciation increases the value of collateral and hence
relaxes borrowing constraints on EME corporates. In contrast, our focus is on credit supply
�uctuations arising from constraints on the investors�portfolio due to shifts in tail risks. The
resulting portfolio shifts can be large, even if the probability of default undergoes only small
changes. In this respect, our approach di¤ers from Du and Schreger (2014), who tie spread
changes to shifts in default probability.
Della Corte et al. (2015) present evidence suggesting that a decrease in sovereign risk,
captured by the CDS spread, is associated with an appreciation of the bilateral exchange
rate against the US dollar across EMEs and AEs. The authors interpret their �nding as
showing how an exogenous increase in sovereign default probability leads to a depreciation
4

of the exchange rate. In contrast, our narrative goes in the opposite direction. For us, there
is an economic impact of exchange rate changes on the real economy, which in turn leads
to portfolio shifts. Nevertheless, the two narratives are complementary, and the interaction
of the two e¤ects could potentially lead to ampli�cation e¤ects that elicit sizeable moves
in exchange rates and sovereign spreads. In the empirical exercise, our focus will be on
disentangling these two narratives.
The outline of our paper is as follows. In section 2, we begin by documenting some
stylised facts that motivate our empirical analysis. Section 3 outlines our model of the
risk-taking channel. In section 4 we conduct a more systematic empirical investigation of
the determinants of �nancial conditions and portfolio �ows. We conclude in section 5 by
recapping the �ndings and by posing additional questions that are thrown up by our analysis.
2 A �rst look at the evidence
By way of motivation, we begin by outlining a number of stylised facts on the link between the
bilateral exchange rate against the US dollar and �nancial conditions in EMEs. Speci�cally,
we will document some unconditional correlations between the bilateral US dollar exchange
rate and EME �nancial conditions. We will conduct a systematic empirical investigation in
section 4 where the preliminary evidence reported in this section is revisited.
Consider �rst the association between the bilateral US dollar exchange rate and bond
fund �ows and bond prices in EME local currency bond markets. We use data from EME
local currency bond funds available from the EPFR database and for which data on their
respective benchmarks are available from JP Morgan Chase every month from January 2011
to July 2015. In total, we use data on 36 funds consisting of 33 global EME local currency
bond funds and three regional EME local currency bond funds. Appendix 1 provides the list
of 36 funds and their respective benchmarks. These data develop the data on EME bond
�ows in Shek, Shim and Shin (2015). Here, we focus on (i) the relationship between the FX
return of a speci�c bond fund and investor �ows into the bond fund, and (ii) the relationship
between the FX return on a bond fund and the local currency-denominated return on bond
holdings by the bond fund. We estimate the FX return by using benchmark weights as a
proxy for actual asset allocation weights of each fund.
Figure 1 shows scatter plots of fund �ows relative to net asset value (NAV) against the
FX return for each of the 36 funds. We �nd that the slope is positive for 31 funds. This
means that investor �ows in EME local currency bond markets increase when EME currencies
appreciate against the US dollar.
Next, we consider the relationship between the change in EME local currency yields and,
5
respectively, the US dollar and the local currency returns of the bond funds (Figure 2). The
left-hand panel shows the relationship for individual funds. The right-hand panel is a larger
version of the scatter chart for one of the funds � Fund 31. The blue scatter is the local
currency return (in per cent) against the domestic bond yield change (in percentage points),
while the red scatter is the US dollar-denominated return against the yield change.
The scatter plots reveal a negative relationship between EME currency appreciation
against the US dollar and domestic interest rates. In all the panels in Figure 2, the slope for
the red line for red dots is steeper than that for the blue line for blue dots. The right-hand
half of each of the scatter plots corresponds to the region where local currency sovereign
bond yields have risen � that is, where domestic �nancial conditions are tighter, associated
with higher interest rates. In these states of the world, the red line is below the blue line,
which is to say that dollar returns tend to be lower than local currency returns, implying
that the local currency is depreciating against the dollar. In short, when domestic interest
rates rise, the domestic currency tends to depreciate.1 Conversely, the left-hand half of each
of the scatter panels corresponds to the situation where domestic interest rates have fallen,
and so represent more permissive domestic �nancial conditions. There, we see that the blue
line lies below the red line, implying that the domestic currency tends to appreciate against
the dollar. In short, when domestic interest rates fall, the local currency tends to appreciate
against the dollar.
The relationship between exchange rates and EME bond market conditions in Figures 1
and 2 captures the essence of the �risk-taking channel�of currency appreciation, in which
the domestic �nancial conditions �uctuate in unison with the exchange rate. Among other
things, the scatter charts in Figure 2 show that the returns in dollars and local currency do
not coincide.2 Dollar returns are lower when EME �nancial conditions are tight, while local
currency returns are lower when EME �nancial conditions are loose. Currency appreciation
and looser �nancial conditions therefore go hand in hand.
Consider next the association between shifts in US dollar-denominated EME CDS spreads
and changes in the EME currency exchange rate vis-à-vis the US dollar. The focus here is
on the relationship between the risk premium embedded in the CDS spread for the US dollar
sovereign bonds and how the risk premium co-moves with the US dollar exchange rate.3
The bubble charts in Figure 3 are from Avdjiev, McCauley and Shin (2015) and show
1The same relationship is found in papers investigating the impact of monetary policy on EME exchangerates. See, for example, Kohlscheen (2014) and Hnatkovska, Lahiri and Vegh (2016).
2See Bacchetta (2012) for a survey of papers on the related phenomenon of deviations from uncoveredinterest parity (UIP).
3For example, Amstad, Remolona and Shek (2016) do not include India and Singapore in their sam-ple of EMEs since they lack actively traded sovereign CDS contracts after August 2009 and March 2012,respectively.
6
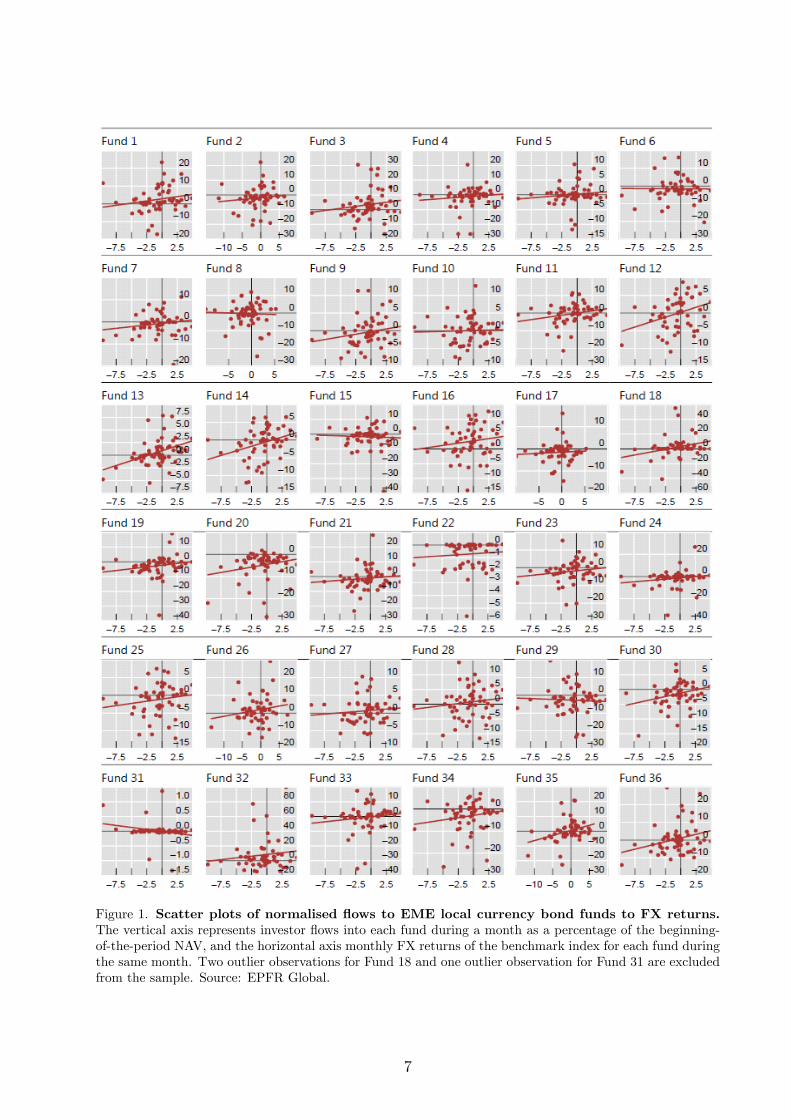
Figure 1. Scatter plots of normalised �ows to EME local currency bond funds to FX returns.The vertical axis represents investor �ows into each fund during a month as a percentage of the beginning-of-the-period NAV, and the horizontal axis monthly FX returns of the benchmark index for each fund duringthe same month. Two outlier observations for Fund 18 and one outlier observation for Fund 31 are excludedfrom the sample. Source: EPFR Global.
7

Figure 2. Dollar and local currency returns on EME local currency sovereign bond funds. Theleft-hand panel shows monthly returns on 20 EME local currency sovereign bond funds over the period ofJanuary 2011 to July 2015. Blue scatter is local currency return (in per cent) against the domestic bondyield change (in percentage points). Red scatter is US dollar return against the yield change. The right-handpanel magni�es the scatter chart for Fund 31. Source: EPFR Global.
how the sovereign CDS spreads have moved with shifts in the bilateral exchange rate against
the US dollar between the end of 2012 and September 2015, a period characterised by a
large depreciation of many EME currencies against the US dollar, including the US Federal
Reserve announcement of a tapering of its asset purchases. The horizontal axis in each panel
is the percentage change in the bilateral exchange rate of the EME against the US dollar from
the end of 2012. The vertical axis gives the change in the local currency 5-year sovereign CDS
spread minus the US Treasury CDS spread over the same period. The size of the bubbles
indicates the total dollar-denominated debt owed by nonbanks in the country.
We see from Figure 3 that there is both a time series and cross-section relationship
between the CDS spread and the bilateral dollar exchange rate. In the cross-section, the
bubbles line up along a downward-sloping line, indicating that those countries that have
depreciated more against the US dollar tend to have CDS spreads that are higher. Over
time, as the US dollar appreciates, the bubbles move in the north-west direction. In other
words, as the domestic currency weakens against the US dollar, EME sovereign CDS spreads
rise.
The bubble chart for September 2015 (lowest-right panel) shows that EME borrowers
are still facing challenges due to the stronger dollar. In particular, between end-2012 and
September 2015, Brazil and Russia saw their currencies depreciate by more than 50% against
the US dollar and their sovereign CDS spreads rise by more than 250 basis points, even though
the domestic interest rates in Brazil and Russia increased signi�cantly during the period. Less
8

Figure 3. Co-movement of the bilateral US dollar exchange rate and the �ve-year sovereign CDSspread in EMEs. The horizontal axis in each panel is the percentage change in the bilateral exchange rateof the EME against the US dollar from the end of 2012. The vertical axis gives the change in the US dollar-denominated 5-year sovereign CDS spread minus the US Treasury CDS spread over the same period. Thesize of the bubbles indicates the total dollar-denominated debt owed by nonbanks in the country.
9

Table 1. Preliminary panel regressions. This table reports monthly panel regressions with country �xede¤ects for various EME sovereign bond market indicators. �BER is the log change in the bilateral US dollarexchange rate; positive �BER is an appreciation of the EME currency. Dependent variables are: (i) thechange in the spread of the 5-year local currency bond yield over the corresponding US Treasury yield (LCspread); (ii) the change in di¤erence between the 5-year CDS spread and the corresponding US CDS spread(CDS spread); (iii) the change in the spread of the JP Morgan EMBI yield over the 5-year US Treasury yield(FC spread); (iv) the change in the Du-Schreger local currency sovereign risk spread de�ned as the spread ofthe 5-year local currency bond yield over a synthetic risk-free rate calculated as the 5-year US Treasury yieldadjusted for the forward currency premium constructed from cross-currency and interest rate swap rates;and (v) aggregate investor �ows to EME local currency sovereign bond funds as a percentage of net assetvalue (Bond �ows). t-statistics reported in brackets are calculated based on cluster-robust standard errors.*, ** and *** denote, respectively, signi�cance at the 10 percent, 5 percent and 1 percent level.
Dependent variableLC spread CDS spread FC spread DS spread Bond �ows
�BERt �0.047*** �0.053*** �0.057*** �0.024*** 0.346***[�3.88] [�11.97] [�9.95] [�2.86] [10.35]
N 20 20 13 14 20N�T 2483 2430 1617 1608 2400Within R2 0.100 0.276 0.256 0.050 0.155
sizeable changes are evident for the other EMEs (Indonesia, Malaysia, Mexico, South Africa
and Turkey). But even for these countries, there have been currency depreciations of between
20% and 50% against the dollar, associated with CDS spread increases of between 70 and
180 basis points.
The association between di¤erent measures of EME �nancial conditions and the US dol-
lar exchange rate suggested by Figures 1, 2 and 3 also holds up in preliminary diagnostic
regressions. Using monthly data for up to 20 EMEs over the period January 2005 to August
2015, we regress di¤erent measures of EME bond spreads and EME credit risk spreads as
well as bond fund �ows to EMEs on the change in the bilateral exchange rate against the
US dollar, controlling only for country-�xed e¤ects (see Appendix 1 and section 4 for more
details on the data).
The results shown in Table 1 con�rm that an appreciation of the bilateral exchange
against the US dollar is associated with signi�cantly lower EME bond spreads, signi�cantly
lower EME sovereign credit risk spreads and signi�cantly higher in�ows into EME sovereign
bond markets.
Of course, these unconditional correlations raise more questions than they answer. In
particular, the associations suggested by Figures 1, 2 and 3 and the regression analysis in
Table 1 are contemporaneous associations and may re�ect common factors driving both
variables, or reverse causality as lower risk spreads and higher bond in�ows may lead to
appreciation of the currency. The �rst question is whether there are theoretical reasons
suggesting that exchange rate appreciation might lead to lower sovereign bond spreads and
10

higher bond portfolio in�ows. This question is addressed in the following section 3. The
second question is whether there is evidence that the unconditional association between
exchange rate appreciation and easier �nancial conditions re�ects at least in part a conditional
causal e¤ect running from the exchange rate to �nancial conditions, rather than conversely.
This question will be addressed in section 4.
3 Model
In this section, we develop a model of global portfolio adjustment in sovereign bonds with
two elements. The �rst is dollar borrowing by EME corporate borrowers which introduces
currency mismatch on private sector balance sheets that spills over to government �scal
positions. The second is global investors�portfolio choice in EME sovereign bonds driven
by an economic capital constraint, which caps EME sovereign exposures with a tail risk
measure. The modelling choice is motivated by the empirical �ndings that sovereign yield
�uctuations are driven by risk premium shifts, and that yield compression is driven by the
supply of credit through portfolio �ows.
3.1 Credit demand in dollars
There is a continuum of potential borrowers. Borrowers are penniless risk-neutral entrepre-
neurs with access to a project that needs 1 dollar of �xed investment and one unit of labour
input. Denote by r the interest rate on the loan, so that the borrowers must repay 1 + r.
The disutility of the labour input is distributed in the population according to cumulative
distribution functionH (�) with support on [0;1). Credit is granted at date 0 and the projectrealisation and repayment is due at date 1.
The entrepreneurs bear currency risk. The dollar value of the project depends on the
bilateral exchange rate vis-à-vis the US dollar. Figure 4 depicts the outcome density of the
borrowers�project. Denote by Vt the local currency value of the project at date t and by
�t the value of the local currency with respect to the US dollar, so that an increase in �t
denotes the appreciation of local currency. The dollar value of the borrowers�project at date
1 follows the Merton (1974) model of credit risk, and is the random variable:
�1V1 = �0V0 exp
��� s2
2+ sWj
�; (1)
where Wj is a standard normal, and � and s > 0 are constants. Since the borrowers are
risk-neutral and have limited liability, borrower j with e¤ort cost ej undertakes the project
if
E (max f0; �1V1 � (1 + r)g)� ej � 0: (2)
11

t10
r+11
default probability
Projectvalue
0
Density of 11Vθ
Asset cost(= loan amount)
00Vθ
ε
Figure 4. The borrower defaults when �1V1 falls short of the notional debt 1 + r.
Denote by e� (r) the threshold cost level where (2) holds with equality when the interest rate
is r. Credit demand is the mass of entrepreneurs with e¤ort cost below e� (r). Denoting by
Cd (r) the credit demand at interest rate r, we have
Cd (r) = H (e� (r)) : (3)
Since H (�) has full support on [0;1), Cd (r) > 0 for all r > 0 and is strictly decreasing in r.
3.2 Corporate credit risk
The lender is a bank who can diversify across many borrowers and so can diversify away idio-
syncratic risk. Credit risk follows the Vasicek (2002) model, a many borrower generalisation
of Merton (1974). The standard normal Wj in (1) is given by the linear combination:
Wj =p�Y +
p1� �Xj; (4)
where Y and Xj are mutually independent standard normals. Y is the common risk factor
while each Xj is the idiosyncratic risk facing borrower j. The parameter � 2 (0; 1) determinesthe weight given to the common factor Y .
The borrower defaults when the project realisation is less than the repayment amount
of the loan, 1 + r. We assume that the recovery value is zero when default occurs. Default
occurs when �1V1 < 1 + r, which can be written as
p�Y +
p1� �Xj < �dj; (5)
where dj is the distance to default:
dj =ln��0V01+r
�+ �� s2
2
s: (6)
12

0 0.2 0.4 0.6 0.8 10
2
4
6
8
10
12
z
dens
ity o
ver r
ealiz
ed a
sset
s
0 0.2 0.4 0.6 0.8 10
3
6
9
12
15
z
dens
ity o
ver r
ealiz
ed a
sset
s
ε = 0.2
ε = 0.3
ρ = 0.3 ε = 0.2
ε = 0.1
ρ = 0.01
ρ = 0.1
ρ = 0.3
Figure 5. Densities over realized values of loans with 1 dollar face value. The left-hand charts plotsdensities when � = 0:1 and " is varied from 0.1 to 0.3. The right-hand chart plots densities when " = 0:2and � varies from 0.01 to 0.3.
Thus, borrower j repays the loan when Zj � 0, where Zj is the random variable:
Zj = dj +p�Y +
p1� �Xj
= ���1 (") +p�Y +p1� �Xj; (7)
where " is the probability of default of borrower j, de�ned as " = �(�dj), and � is thestandard normal c.d.f.
Conditional on Y , defaults are independent. In the limit where the number of borrowers
becomes large, the realised value of 1 dollar face value of loans can be written as a deter-
ministic function of Y , by the law of large numbers. The realised value per one dollar face
value of loans is the random variable w (Y ) de�ned as:
w (Y ) = Pr�p
�Y +p1� �Xj � ��1 (") jY
�= �
�Yp����1(")p1��
�: (8)
The c.d.f. of w is then given by
Pr (w � z) = Pr�Y � w�1 (z)
�= �
�w�1 (z)
�= �
���1(")+
p1����1(z)p�
�: (9)
Figure 5 plots the density over realised values of loans with one dollar face value, and shows
how the density shifts to changes in the default probability " (left-hand panel) or to changes
13

in � (right-hand panel). From (9), the c.d.f. of w is increasing in ", so that higher values of
" imply a �rst degree stochastic dominance shift left for the asset realisation density. Since
" decreases with local currency appreciation (that is, an increase in �0), therefore exchange
rates have a direct impact on the credit environment in our model.
3.3 Lender to corporates
Our model of credit supply to corporates is a simpli�ed version of Bruno and Shin (2015a)
where banks lend to corporates subject to a Value-at-Risk (VaR) constraint. Denote by Cs
the credit supplied by global banks at date 0 (in dollars). Since the interest rate is r, the
payo¤ of the bank at date 1 is given by the random variable:
(1 + r)Cs � w: (10)
Denote by E the book equity of the bank and by L the dollar funding raised by the bank
and denote by f the dollar funding cost, which we assume is constant for simplicity.4
The bank is risk-neutral, and aims to maximise expected pro�t subject only to its VaR
constraint that stipulates that the probability of default is no higher than some �xed constant
� > 0. The bank remains solvent as long as the realised value of w (Y ) is above its notional
liabilities at date 1. Since the funding rate on liabilities is f , the notional liability of the
bank at date 1 is (1 + f)L. Since the bank is risk-neutral, its VaR constraint binds:
Pr
�w <
(1 + f)L
(1 + r)Cs
�= �
���1(")+
p1����1( (1+f)L(1+r)Cs
)p�
�= �: (11)
Re-arranging (11), we can write the ratio of notional liabilities to notional assets as
follows:
Notional liabilitiesNotional assets
=(1 + f)L
(1 + r)Cs= �
�p���1 (�)� ��1 (")p
1� �
�: (12)
We will use the shorthand:
' (�; "; �) � ��p
���1(�)���1(")p1��
�: (13)
Clearly, ' 2 (0; 1). From (12) and the balance sheet identity E + L = Cs, we can solve for
the bank�s supply of dollar credit. We have5
Cs =E
1� 1+r1+f
� ': (14)
4See Bruno and Shin (2015a) for a more complete model where the dollar funding cost f is determinedin the interbank market.
5Since E > 0 and Cs > 0, we need r, f and ' such that�1� 1+r
1+f � '�> 0.
14
The loan interest rate r is determined by market clearing that equates loan demand (3)
with loan supply (14). Since ' is decreasing in ", which in turn is decreasing in the current
exchange rate �0, we conclude from our expression for dollar credit supply given in (14) that
dollar credit supply is increasing in �0. In other words, dollar credit supply to corporates
is increasing in the value of the domestic currency against the dollar today. For any �xed
demand curve for dollar credit by entrepreneurs, increased dollar credit results in more
projects being �nanced. We summarise this interim result as follows:
Lemma 1 Aggregate investment by the corporate sector is increasing in the value of the
domestic currency against the dollar.
3.4 Sovereign bond investors
We now address the spillovers from the corporate sector to the sovereign bond market.
The global lender is a bond fund manager who can diversify across many EME sovereign
borrowers. Each sovereign borrower has a corporate sector that borrows in dollars, and for
which Lemma 1 applies.
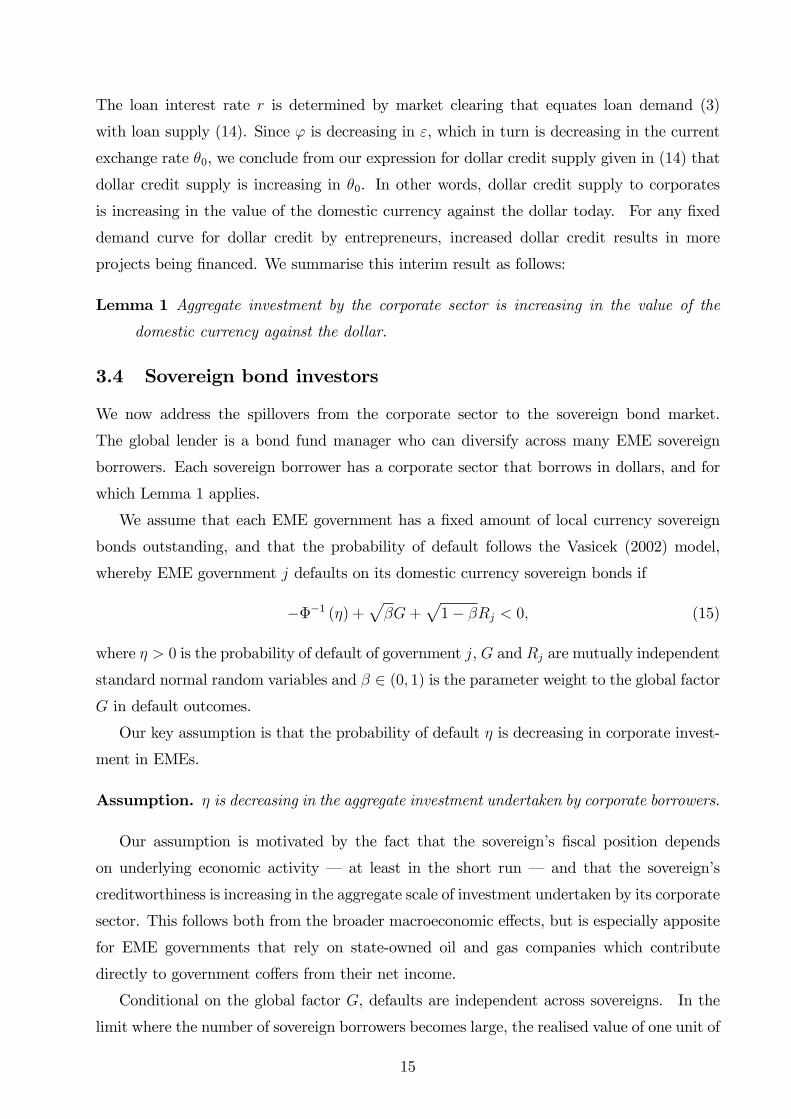
We assume that each EME government has a �xed amount of local currency sovereign
bonds outstanding, and that the probability of default follows the Vasicek (2002) model,
whereby EME government j defaults on its domestic currency sovereign bonds if
���1 (�) +p�G+
p1� �Rj < 0; (15)
where � > 0 is the probability of default of government j, G and Rj are mutually independent
standard normal random variables and � 2 (0; 1) is the parameter weight to the global factorG in default outcomes.
Our key assumption is that the probability of default � is decreasing in corporate invest-
ment in EMEs.
Assumption. � is decreasing in the aggregate investment undertaken by corporate borrowers.
Our assumption is motivated by the fact that the sovereign�s �scal position depends
on underlying economic activity � at least in the short run � and that the sovereign�s
creditworthiness is increasing in the aggregate scale of investment undertaken by its corporate
sector. This follows both from the broader macroeconomic e¤ects, but is especially apposite
for EME governments that rely on state-owned oil and gas companies which contribute
directly to government co¤ers from their net income.
Conditional on the global factor G, defaults are independent across sovereigns. In the
limit where the number of sovereign borrowers becomes large, the realised value of one unit of
15

a diversi�ed portfolio of local currency sovereign bonds is the random variable v (G) de�ned
as:
v (G) = Pr�p
�G+p1� �Rj � ��1 (�) jG
�= �
�Gp����1(�)p1��
�: (16)
3.5 Fund managers
Denote by B the credit supplied by local currency bond investors at date 0. Here, B could
be denominated in either local currency or foreign currency, and our results will not be
sensitive to the currency denomination of the bond portfolio. The key is that the exchange
rate impacts on �scal positions, and that this has a bearing on the tail risk of a diversi�ed
portfolio of sovereign bonds.
Denote by y the yield on the sovereign bonds. The payo¤ of the bond investor at date 1
is given by the random variable:
(1 + y)B � v (17)
The fund manager is risk-neutral and maximises expected return, but the portfolio deci-
sion is governed by an economic capital constraint � an analogue of the VaR constraint for
non-leveraged investors.
Denote by E the economic capital of the fund manager. The fund manager�s economic
capital constraint stipulates that the probability that the loss from the bond portfolio de�ned
as B � (1 + y)B � v exceeds E is no more than some known constant � > 0. Formally, the
economic capital constraint is
Pr
�v <
B � E
(1 + y)B
�= �
���1(�)+
p1����1( B�E
(1+y)B )p�
�� �: (18)
Since the fund manager is risk-neutral, this constraint binds with equality. Re-arranging,
we have
B � E
(1 + y)B= �
�p���1 (�)� ��1 (�)p
1� �
�(19)
Using the shorthand:
� ��p
���1(�)���1(�)p1��
�; (20)
16

and re-arranging, we can solve for the supply of credit by the bond fund manager:6 ;7
B =E
1� (1 + y) : (21)
The yield y can be obtained from the market clearing where bond credit supply (21) is
equated to the �xed supply of local currency bonds outstanding, denoted by S. We have
1 + y =1� E=S
: (22)
Gathering together our earlier steps, we can thus state our main comparative statics
result in terms of �0, the current value of the local currency against the dollar.
Proposition 1 The yield on EME sovereign bonds is decreasing in �0.
The proof follows from our earlier steps in derivation. From our assumption that default
probability � is decreasing in corporate investment, and from Lemma 1, � is decreasing in
�0. From (20), we know that is decreasing in �. Therefore, from (22), an appreciation of
the local currency against the dollar is associated with a higher , and hence with lower y.
This proves the proposition.
As well as our result on the yield y, our model also has a prediction regarding the size
of the local currency EME sovereign bond portfolio held by the global bond investor. The
expression for the demand for bonds by the investor given by (21) means that currency
appreciation gives rise to larger local currency bond holdings. We therefore have the following
corollary:
Corollary 1 The holding of EME bonds by the global investor is increasing in �0.
The proof follows straightforwardly from the expression for the demand for bonds (21) and
the fact that is increasing in �0.
With Proposition 1 and Corollary 1, we have the key features unearthed by our empirical
investigation of the risk-taking channel. Currency appreciation in EMEs is associated with
lower local currency sovereign bond yields, higher global investment in sovereign bonds,
and more buoyant economic conditions in EMEs underpinned by dollar-�nanced corporate
investment.
Note, moreover, that the investment positions that result from the economic capital con-
straint operate in a manner similar to the VaR constraint for the banks. As the dollar
6Since E > 0 and B > 0, we need y and such that 1� (1 + y) > 0 holds.7We can de�ne the loss more generally as (1 + k)B � (1 + y)B � v . In this case, equation (21) becomes
B = E(1+k)�(1+y) , and k, f and should satisfy (1 + k)� (1 + y) > 0.
17

depreciates against EME currencies, the tail risk is curtailed for the portfolio of local cur-
rency sovereign bonds, and lower tail risks are associated with larger portfolio positions.
In this respect, the operation of the mechanism outlined in our paper depicts shifts in risk
appetite of the investor. The fact that our empirical �ndings hold with respect to the Du
and Schreger (2015) spreads is indicative of the mechanism working through �uctuations in
the risk premium associated with local currency sovereign bonds.
4 Empirical investigation
Based on the key �ndings in the model, we proceed to a more systematic empirical investi-
gation in this section.
In the existing literature, EME �nancial conditions are commonly modelled as a function
of business cycle indicators as well as of indicators of a country�s �scal and external position
and its indebtedness (see, eg, Bellas, Papaioannou and Petrova (2010) and Du and Schreger
(2015)). The exchange rate is usually not considered.8 Here we delve deeper into the risk-
taking channel and extend this literature by considering the role of the exchange rate for
EME �nancial conditions explicitly. The hypothesis is that the estimated impact of the
exchange rate on EME �nancial conditions indicates the existence of a risk-taking channel
that a¤ects credit supply to these economies. When the exchange rate of EMEs appreciates,
EME borrowers look more creditworthy and, at the same time, lenders� lending capacity
increases.
In order to delve deeper into the empirical evidence, we run a set of monthly �xed-e¤ects
panel regressions, regressing price- and quantity-based indicators of EME sovereign bond
market conditions y on the (log) change in the exchange rate (�ER) and a set of control
variables (X):
yi;t = �i + ��ERi;t�1 + �Xi;t�1 + "i;t: (23)
For the indicators of sovereign bond market conditions y, we consider di¤erent price-
and quantity-based measures. Speci�cally, on the price side we consider the change in local
currency bond spreads, the change in US dollar-denominated CDS spreads, the change in
foreign currency (ie US dollar-denominated) bond spreads and the change in local currency
sovereign credit risk measures recently proposed by Du and Schreger (2015). On the quantity
side, we consider investor �ows to a country�s bond market through EME sovereign bond
funds (henceforth, �aggregate bond fund �ows�).8 An exception is the BIS study by Gadanecz, Miyajima and Shu (2014) who focus on exchange rate risk
measured by implied exchange rate volatility rather than on movements in the exchange rate itself.
18

In order to assess which exchange rate matters for EME �nancial conditions, we run
the regressions in �ve di¤erent speci�cations: (i) with the bilateral US dollar exchange rate
(BER); (ii) with the nominal e¤ective exchange rate (NEER); (iii) with the wedge between
the NEER and the BER; (iv) including both the BER and the NEER; and (v) including
both the BER and the wedge between the NEER and the BER.9 The wedge between the
NEER and the BER is obtained by regressing for each country separately the change in
the NEER on the change in the BER, and retaining the residuals as the part of the NEER
change that is unrelated to the change in the BER. The exchange rates are de�ned such that
an increase is an appreciation of the domestic currency.
X is a set of standard control variables including the log change in the VIX, the log
change in the US consumer price index (CPI), the log change in US industrial production,
the change in the US short-term interest rate (3-month money market rate), the log change
in the domestic CPI, the log change in domestic industrial production and the change in the
domestic short-term interest rate (3-month money market rate).10
As already discussed in section 2, endogeneity is an important issue we need to address in
the empirical analysis. The model presented in the previous section suggests that exchange
rate appreciation loosens �nancial conditions and lowers risk spreads, but higher bond in�ows
and lower risk spreads may in turn drive up the value of the domestic currency. For instance,
Della Corte et al. (2015) present evidence suggesting that a decrease in sovereign risk,
captured by the CDS spread, is associated with an appreciation of the bilateral exchange
rate against the US dollar across EMEs and AEs. One way to address endogeneity is to
use an instrumental variable estimator. This approach is however plagued by the problem
of �nding good instruments for the exchange rate (and any other endogenous variable in
the regression). For this reason, we adopt a di¤erent approach and address endogeneity by
lagging all explanatory variables by one month.
The control variables should capture factors that a¤ect EME �nancial conditions and
possibly also exchange rates at the same time. The correlation between the lagged exchange
rate and EME �nancial conditions that we uncover through our regressions is conditional
on these control variables and should therefore not just re�ect common factors driving both
exchange rates and �nancial conditions, such as a shift in investor risk appetite or changes
in global or domestic macroeconomic or monetary conditions.
9We have conducted the analysis also based on real exchange rates. The results, which are available upon
request from the authors, are very similar, because real exchange rate movements are primarily driven by
nominal exchange rate movements.10We did not include control variables capturing a country�s �scal and external position or its indebtedness
as such variables are mostly available only at a lower frequency (quarterly or even annual) than the monthly
one adopted in the analysis here.
19

The sample period of the regressions is from January 2005 to August 2015 (to December
2014 for the bond �ows). The sample of countries covers up to 20 EMEs except for the
regressions with the foreign currency bond spreads and the Du-Schreger credit risk spreads
where the sample is, respectively, reduced to 13 and 14 countries because of more limited
data availability. More details on the data and their sources are provided in Appendix 1.
Statistical inference is consistently based on cluster-robust standard errors.
4.1 EME sovereign bond and credit risk spreads
This subsection investigates the impact of the exchange rate on price-based measures of
bond market conditions in EMEs. We start by assessing the impact of the exchange rate
on the spread of the 5-year local currency sovereign bond yield over the 5-year US Treasury
yield. The results suggest that an appreciation of the local currency against the US dollar is
associated with a signi�cant reduction in local currency bond spreads (Table 2). Speci�cally,
the estimates suggest that a 1% appreciation of an EME�s local currency against the US
dollar decreases the local currency bond spread of a country by about 2.4 basis points and
the e¤ect is signi�cant at the 1% level.
An appreciation of the e¤ective exchange rate has a very similar e¤ect. However, when we
consider the wedge between the e¤ective and the bilateral exchange rate and the speci�cations
where both the bilateral and the e¤ective exchange rates are included, we see that it is the
US dollar exchange rate that matters for local currency sovereign bond spreads. The impact
of the wedge is not statistically signi�cant. In the regressions where both exchange rates are
included, the US dollar exchange rate remains signi�cant at the 1% level, while the e¤ective
exchange rate variable is always insigni�cant.
These results support the notion that the US dollar exchange rate a¤ects credit supply
to EMEs, with an increase in supply when EME currencies appreciate against the US dollar.
Importantly, the results obtain after controlling for a large number of factors that could shift
the US dollar exchange rate and EME sovereign yields in opposite directions which might
explain a negative unconditional correlation between the two variables. Indeed, many of the
control variables have a highly signi�cant impact on EME bond spreads. Across the di¤erent
speci�cations, we �nd that increases in the VIX lead to higher bond spreads, presumably
re�ecting the well-established negative e¤ects of investor risk appetite on credit supply. We
also �nd a consistent signi�cantly positive impact of US and domestic in�ation on bond
spreads. The change in domestic short-term interest rates has a highly signi�cant positive
e¤ect on spreads. Speci�cally, a 100 basis point increase in the EME short-term interest rate
is associated with an increase in EME bond spreads of roughly 12 basis points.
20

The change in the US short-term rate has a signi�cantly negative e¤ect on the spread,
presumably re�ecting its positive e¤ect on US Treasury yields which here works to lower
spreads. This result, however, does not mean that a US monetary tightening would lower
EME bond spreads. Such a tightening would also work to increase EME spreads through a
higher VIX (Bekaert et al. (2013)), a depreciation of the bilateral exchange rate and higher
domestic interest rates through direct interest rate spillovers (Hofmann and Takáts (2015)).
The negative direct e¤ect of the US rate change is the residual e¤ect left after controlling for
these channels in the regression through the inclusion of the VIX, the exchange rate and the
domestic interest rate, respectively.
A drawback of the use of local currency bond spreads for our analysis is that they re�ect
both risk premia and di¤erences in the expected path of short-term interest rates. It remains
therefore unclear through which of these two components the exchange rate operates. In
order to shed some light on this question, we re-run the panel regressions using sovereign
credit risk measures instead of the local currency bond spreads. We consider three such
measures: (i) the sovereign CDS spread denominated in US dollars; (ii) the spread of the
yield of US dollar-denominated EME bonds over a roughly corresponding US Treasury yield
(foreign currency bond spread); and (iii) the measure of local currency sovereign credit risk
recently proposed by Du and Schreger (2015).
Sovereign CDS spreads measure the cost for a sovereign bond investor of insuring against
the default of the sovereign on the bond. They are widely used indicators of the market
perception of sovereign credit risk. An alternative measure is the foreign currency bond
spread, measured as the spread of the JP Morgan EMBI country-level yield over the 5-year
US Treasury yield. Both the CDS spread and the foreign currency bond spread are, however,
derived from US dollar denominated instruments and are thus only an imperfect gauge of
local currency credit risk. The Du-Schreger (2015) sovereign credit risk measure, on the
other hand, provides such a measure of local currency sovereign credit risk. It is given by the
spread of the local currency sovereign bond yield over a �synthetic�local currency risk-free
rate. This risk-free rate is calculated as the US Treasury yield adjusted for the forward
currency premium constructed from cross-currency and interest rate swap rates.
We estimate �xed-e¤ects panel regressions for the 5-year CDS spread, the foreign currency
bond spread and the 5-year Du-Schreger local currency sovereign credit risk spread11 using
the same speci�cation as before. The results, which are reported in Tables 3, 4 and 5, suggest
that the impact of the US dollar on EME local currency bond spreads works through credit
11 We calculate the credit spread based on the information provided in the online appendix of Du and
Schreger (2015) available under http://scholar.harvard.edu/schreger/Research.
21

Table 2. Local currency sovereign bond spreads. This table reports monthly country �xed-e¤ects panelregressions; dependent variable is the change in the spread of the 5-year local currency sovereign bond yieldover the corresponding US Treasury yield. �BER is the log change in the bilateral exchange rate against theUS dollar; positive �BER is an appreciation of the EME currency. �NEER is the log change in the nominale¤ective exchange rate, and Orth �NEER is the residual from the regression of �NEER on �BER. �VIXis the log change in the VIX index, �CPIUS is the log change in US CPI, �IPUS is the log change in USindustral production, �IRUS is the change in US 3-month money market rate, �CPI is the log change indomestic CPI, �IP is the log change in domestic industrial production, and �IR is the change in domestic3-month money market rate. t-statistics reported in brackets are calculated based on cluster-robust standarderrors. *, ** and *** denote, respectively, signi�cance at the 10 percent, 5 percent and 1 percent level.
Dependent variable: change in 5 yr LC spread over US Treasuries(1) (2) (3) (4) (5)
�BERt�1 �0.024*** �0.033*** �0.024***[�4.58] [�3.77] [�4.66]
�NEERt�1 �0.023*** 0.012[�3.50] [1.14]
Orth �NEERt�1 0.001 0.006[0.09] [0.57]
�VIXt�1 0.001* 0.001*** 0.002*** 0.001* 0.001*[1.81] [2.68] [3.99] [1.75] [1.80]
�CPIUSt�1 0.177*** 0.137*** 0.125*** 0.190*** 0.183***[4.18] [3.67] [2.95] [3.87] [3.94]
�IPUSt�1 �0.005 �0.007 �0.013 �0.005 �0.005[�0.41] [�0.57] [�0.97] [�0.42] [�0.42]
�IRUSt�1 �0.140*** �0.107*** �0.110*** �0.153*** �0.145***[�4.32] [�3.44] [�2.81] [�4.01] [�4.01]
�CPIt�1 0.064*** 0.066*** 0.075*** 0.065*** 0.064***[3.26] [3.44] [4.02] [3.22] [3.24]
�IPt�1 0.001 0.000 0.001 0.001 0.001[0.26] [0.17] [0.28] [0.31] [0.28]
�IRt�1 0.115*** 0.121*** 0.141*** 0.116*** 0.114***[3.99] [4.34] [4.22] [3.90] [3.95]
N 20 20 20 20 20N�T 2436 2436 2436 2436 2436Within R2 0.081 0.073 0.060 0.082 0.081
22

risk spreads. For all three credit risk measures, we �nd that an appreciation of the BER
signi�cantly lowers credit risk spreads. In contrast, an appreciation of the NEER that is not
driven by an appreciation against the US dollar does not lower risk spreads.
A 1% appreciation of the local currency against the US dollar is estimated to decrease
the 5-year CDS spreads by roughly 1.7 basis points (Table 3). The e¤ect is highly signi�cant,
with a t-statistic of 7.2. A similar result obtains for the foreign currency bond spread. Here,
a 1% appreciation of the US dollar exchange rate lowers the spread by roughly 2.2 basis
points and the e¤ect is also statistically signi�cant at the 1% level with a t-statistic of 5.7
(Table 4). For both the CDS spread and the foreign currency spread, an appreciation of
the NEER is also associated with lower risk spreads. But the e¤ects are smaller and less
signi�cant. The coe¢ cient on the wedge between the NEER and the BER is positive and
signi�cant at the 1% level. This indicates that an appreciation of the e¤ective exchange rate
that is unrelated to an appreciation of the US dollar exchange rate increases EME bond
spreads. In the speci�cations where both the bilateral and the e¤ective exchange rates are
included we get the same result: an appreciation of the bilateral US dollar exchange rate is
associated with lower bond spreads, while an appreciation of the e¤ective exchange rate leads
to higher spreads. This result probably re�ects the standard textbook trade channel-type
e¤ects where an appreciation has a negative e¤ect on trade and, through this channel, also
on the wider economy, which may in turn adversely a¤ect perceptions of sovereign credit risk
and hence credit supply.
For the Du-Schreger spread, we �nd that an increase in the BER lowers local currency
credit risk by about 1.6 basis points in a statistically signi�cant way with a t-statistic of 2.6
(Table 5). An appreciation of the NEER also lowers risk spreads by a similar magnitude, but
the e¤ect is only marginally signi�cant at the 10% level. The e¤ect of the wedge between the
NEER and the BER is not statistically signi�cant. In the regressions where both exchange
rate variables are included, it is always only the coe¢ cient on the US dollar exchange rate
that comes out signi�cantly negative. Thus, also for local currency credit risk, it is the US
dollar exchange rate that matters.
The regression results reported in Tables 3, 4 and 5 show that the VIX also has a positive
and mostly highly signi�cant impact on the di¤erent risk spreads. An increase in investor risk
aversion leads to a tightening of credit conditions for EMEs. For the other control variables,
no clear patterns across the di¤erent regressions emerge.
Finally, we show that the compression of EME local currency sovereign yields due to
currency appreciation does not operate through the change in the expectation of interest
rates already priced into forward rates. To this end, we run the same regression where the
23

Table 3. Sovereign CDS spreads. This table reports monthly country �xed-e¤ects panel regressions;dependent variable is the change in the spread of the US dollar-denominated 5-year CDS spread over thecorresponding US CDS spread. �BER is the log change in the bilateral exchange rate against the US dollar;positive �BER is an appreciation of the EME currency. �NEER is the log change in the nominal e¤ectiveexchange rate, and Orth �NEER is the residual from the regression of �NEER on �BER. �VIX is the logchange in the VIX index, �CPIUS is the log change in US CPI, �IPUS is the log change in US industralproduction, �IRUS is the change in US 3-month money market rate, �CPI is the log change in domesticCPI, �IP is the log change in domestic industrial production, and �IR is the change in domestic 3-monthmoney market rate. t-statistics reported in brackets are calculated based on cluster-robust standard errors.*, ** and *** denote, respectively, signi�cance at the 10 percent, 5 percent and 1 percent level.
Dependent variable: change in 5 yr CDS spread(1) (2) (3) (4) (5)
�BERt�1 �0.017*** �0.044*** �0.018***[�7.16] [�7.04] [�6.74]
�NEERt�1 �0.011*** 0.036***[�3.18] [5.06]
Orth �NEERt�1 0.031*** 0.034***[4.53] [5.63]
�VIXt�1 0.002*** 0.003*** 0.003*** 0.002*** 0.002***[6.20] [7.25] [7.64] [5.96] [5.90]
�CPIUSt�1 0.136*** 0.103*** 0.126*** 0.175*** 0.171***[7.48] [6.30] [5.63] [7.43] [7.85]
�IPUSt�1 �0.062*** �0.064*** �0.068*** �0.062*** �0.062***[�8.06] [�8.30] [�8.71] [�8.08] [�8.11]
�IRUSt�1 �0.013 0.011 �0.017 �0.051** �0.043*[�0.62] [0.58] [�0.77] [�2.29] [�1.95]
�CPIt�1 �0.035* �0.032 �0.028 �0.034* �0.036*[�1.73] [�1.58] [�1.64] [�1.81] [�1.85]
�IPt�1 0.000 0.000 0.001 0.001 0.001[0.45] [0.38] [0.73] [0.80] [0.69]
�IRt�1 0.096*** 0.105*** 0.114*** 0.098*** 0.094***[3.59] [3.89] [3.44] [3.30] [3.21]
N 20 20 20 20 20N�T 2381 2381 2381 2381 2381Within R2 0.126 0.109 0.112 0.141 0.138
24

Table 4. Foreign currency bond spreads. This table reports monthly country �xed-e¤ects panel re-gressions; dependent variable is the change in the spread of the JP Morgan EMBI yield over the 5-year USTreasury yield. �BER is the log change in the bilateral exchange rate against the US dollar; positive �BERis an appreciation of the EME currency. �NEER is the log change in the nominal e¤ective exchange rate,and Orth �NEER is the residual from the regression of �NEER on �BER. �VIX is the log change in theVIX index, �CPIUS is the log change in US CPI, �IPUS is the log change in US industral production,�IRUS is the change in US 3-month money market rate, �CPI is the log change in domestic CPI, �IP isthe log change in domestic industrial production, and �IR is the change in domestic 3-month money marketrate. t-statistics reported in brackets are calculated based on cluster-robust standard errors. *, ** and ***denote, respectively, signi�cance at the 10 percent, 5 percent and 1 percent level.
Dependent variable: change in 5 yr FC spread over US Treasuries(1) (2) (3) (4) (5)
�BERt�1 �0.022*** �0.066*** �0.066***[�5.69] [�6.95] [�6.95]
�NEERt�1 �0.013** 0.059***[�2.06] [4.81]
Orth �NEERt�1 0.055*** 0.059***[4.15] [4.81]
�VIXt�1 0.004*** 0.004*** 0.005*** 0.003*** 0.003***[6.65] [7.82] [7.72] [5.88] [5.88]
�CPIUSt�1 0.185*** 0.141*** 0.185*** 0.246*** 0.246***[8.56] [8.15] [6.18] [8.68] [8.68]
�IPUSt�1 �0.063*** �0.067*** �0.071*** �0.064*** �0.064***[�6.29] [�6.60] [�7.71] [�6.64] [�6.64]
�IRUSt�1 �0.162*** �0.139*** �0.204*** �0.235*** �0.235***[�8.87] [�8.15] [�5.52] [�7.69] [�7.69]
�CPIt�1 �0.002 �0.000 �0.002 �0.002 �0.002[�0.06] [�0.00] [�0.09] [�0.11] [�0.11]
�IPt�1 0.003 0.003 0.004** 0.003* 0.003*[1.33] [1.41] [2.10] [1.82] [1.82]
�IRt�1 0.089*** 0.101*** 0.100*** 0.085*** 0.085***[3.36] [3.94] [3.55] [3.26] [3.26]
N 13 13 13 13 13N�T 1568 1568 1568 1568 1568Within R2 0.168 0.146 0.16 0.195 0.195
25

dependent variable is the di¤erence between the change in the 5-year local currency sovereign
bond spread and the change in the 5-year Du-Schreger spread, which is equivalent to the
change in the 5-year cross-currency swap rate. The results reported in Table 6 show that an
appreciation of the BER (and also of the NEER) indeed has an insigni�cant e¤ect on the
change in the cross-currency swap rate.
Overall, the results con�rm the notion that it is the US dollar exchange rate and not the
e¤ective exchange rate that matters for the exchange rate risk-taking channel in EMEs. The
impact of an appreciation of the US dollar is signi�cant at the 1% level throughout, while
an appreciation of the NEER that does not re�ect a likewise movement in the US dollar
exchange rate is never found to signi�cantly lower risk spreads.
But how important is the impact of the US dollar exchange rate on EME bond and
credit risk spreads economically? With magnitudes of between 1.5 to 2.5 basis points spread
reductions for a 1% appreciation, the economic impact seems small. However, we need to
put these estimated e¤ects into perspective against the background of observed exchange
rate �uctuations. Across the 20 economies covered by our analysis, the average standard
deviation of the change in the US dollar exchange rate over the sample period is about 2.5
percentage points. This means that a standard change in the exchange rate moves EME
spreads by roughly 4�6 basis points. It is also instructive to do a back-of-the-envelope
calculation to assess the cumulative e¤ect of the considerable exchange rate movements that
we have observed since 2013. Since the beginning of 2013, the EME currencies covered in
our analysis depreciated against the US dollar by on average about 30%. Our estimations
suggest that this might have added some 50 to 70 basis points to EME bond and credit risk
spreads through the risk-taking channel of exchange rate appreciation.
4.2 Fund �ows to EME sovereign bonds
Turning to a quantity-based measure of EME sovereign bond market conditions, this sub-
section investigates the impact of the exchange rate on investor �ows to a country�s bond
market through EME bond funds (henceforth, �aggregate bond fund �ows�). In section 2
we have already provided scatter plots showing the relationship between FX return, local
currency return and investor �ows for 36 EME local currency bond funds and established a
signi�cant unconditional positive relationship between an appreciation of the BER and bond
�ows.
Here we conduct a panel regression analysis in which the dependent variable is investor
�ows to each country via bond mutual funds and exchange-traded funds (ETFs) collected by
EPFR Global. We consider the same 20 EMEs that we investigate in the previous subsection
26

Table 5. Du-Schreger local currency sovereign risk spreads. This table reports monthly country�xed-e¤ects panel regressions; dependent variable is the change in the spread of the 5-year local currencybond yield over a synthetic risk-free rate calculated as the 5-year US Treasury yield adjusted for the forwardcurrency premium constructed from cross-currency and interest rate swap rates. �BER is the log change inthe bilateral exchange rate against the US dollar; positive �BER is an appreciation of the EME currency.�NEER is the log change in the nominal e¤ective exchange rate, and Orth �NEER is the residual from theregression of �NEER on �BER. �VIX is the log change in the VIX index, �CPIUS is the log change in USCPI, �IPUS is the log change in US industral production, �IRUS is the change in US 3-month money marketrate, �CPI is the log change in domestic CPI, �IP is the log change in domestic industrial production, and�IR is the change in domestic 3-month money market rate. t-statistics reported in brackets are calculatedbased on cluster-robust standard errors. *, ** and *** denote, respectively, signi�cance at the 10 percent, 5percent and 1 percent level.
Dependent variable: change in Du-Schreger risk spread(1) (2) (3) (4) (5)
�BERt�1 �0.016*** �0.030** �0.030**[�2.63] [�2.25] [�2.25]
�NEERt�1 �0.014* 0.019[�1.84] [1.12]
Orth �NEERt�1 0.003 0.019[0.15] [1.12]
�VIXt�1 0.001 0.002 0.002** 0.001 0.001[1.17] [1.44] [2.16] [1.13] [1.13]
�CPIUSt�1 0.118*** 0.090*** 0.083** 0.138*** 0.138***[3.58] [3.43] [2.13] [3.14] [3.14]
�IPUSt�1 �0.007 �0.009 �0.012 �0.008 �0.008[�0.63] [�0.75] [�1.07] [�0.64] [�0.64]
�IRUSt�1 �0.115* �0.092 �0.107 �0.140** �0.140**[�1.85] [�1.52] [�1.61] [�2.17] [�2.17]
�CPIt�1 0.027 0.028 0.031 0.027 0.027[1.07] [1.12] [1.33] [1.15] [1.15]
�IPt�1 0.004** 0.004** 0.005** 0.004** 0.004**[2.15] [2.16] [2.55] [2.22] [2.22]
�IRt�1 0.034 0.040 0.048 0.032 0.032[0.97] [1.14] [1.50] [0.94] [0.94]
N 14 14 14 14 14N�T 1564 1564 1564 1564 1564Within R2 0.054 0.046 0.037 0.057 0.057
27

Table 6. Cross-currency swap rates. This table reports monthly country �xed-e¤ects panel regressions;dependent variable is the di¤erence between the change in the 5-year local currency sovereign bond spreadand the change in the 5-year Du-Schreger spread, which is equivalent to the change in the 5-year cross-currency swap rate. �BER is the log change in the bilateral exchange rate against the US dollar; positive�BER is an appreciation of the EME currency. �NEER is the log change in the nominal e¤ective exchangerate, and Orth �NEER is the residual from the regression of �NEER on �BER. �VIX is the log change inthe VIX index, �CPIUS is the log change in US CPI, �IPUS is the log change in US industral production,�IRUS is the change in US 3-month money market rate, �CPI is the log change in domestic CPI, �IP isthe log change in domestic industrial production, and �IR is the change in domestic 3-month money marketrate. t-statistics reported in brackets are calculated based on cluster-robust standard errors. *, ** and ***denote, respectively, signi�cance at the 10 percent, 5 percent and 1 percent level.
Dependent variable: change in cross-currency swap rate(1) (2) (3) (4) (5)
�BERt�1 �0.007 �0.019 �0.019[�1.39] [�1.48] [�1.48]
�NEERt�1 �0.004 0.017[�0.62] [0.99]
Orth �NEERt�1 0.018 0.017[1.01] [0.99]
�VIXt�1 0.000 0.000 0.001 0.000 0.000[0.16] [0.32] [0.44] [0.11] [0.11]
�CPIUSt�1 0.104* 0.091* 0.107 0.122* 0.122*[1.86] [1.70] [1.53] [1.75] [1.75]
�IPUSt�1 0.004 0.003 0.002 0.004 0.004[0.30] [0.22] [0.14] [0.29] [0.29]
�IRUSt�1 �0.01 �0.001 �0.024 �0.032 �0.032[�0.21] [�0.03] [�0.47] [�0.65] [�0.65]
�CPIt�1 0.052 0.053 0.053 0.052 0.052[1.17] [1.20] [1.12] [1.13] [1.13]
�IPt�1 �0.002 �0.002 �0.002 �0.002 �0.002[�0.58] [�0.57] [�0.53] [�0.57] [�0.57]
�IRt�1 0.054*** 0.058*** 0.057*** 0.053*** 0.053***[3.22] [3.69] [3.80] [2.99] [2.99]
N 14 14 14 14 14N�T 1564 1564 1564 1564 1564Within R2 0.016 0.015 0.016 0.017 0.017
28

Table 7. Aggregate bond fund �ows. This table reports monthly country �xed-e¤ects panel regressions;dependent variable is the bond fund �ows into each EME�s bonds as a percentage of the beginning-of-periodnet asset value. �BER is the log change in the bilateral exchange rate against the US dollar; positive �BERis an appreciation of the EME currency. �NEER is the log change in the nominal e¤ective exchange rate,and Orth �NEER is the residual from the regression of �NEER on �BER. �VIX is the log change in theVIX index, �CPIUS is the log change in US CPI, �IPUS is the log change in US industral production,�IRUS is the change in US 3-month money market rate, �CPI is the log change in domestic CPI, �IP isthe log change in domestic industrial production, and �IR is the change in domestic 3-month money marketrate. t-statistics reported in brackets are calculated based on cluster-robust standard errors. *, ** and ***denote, respectively, signi�cance at the 10 percent, 5 percent and 1 percent level.
Dependent variable: aggregate bond fund �ows(1) (2) (3) (4) (5)
�BERt�1 0.182*** 0.338*** 0.187***[7.39] [4.29] [7.58]
�NEERt�1 0.148*** �0.215***[5.91] [�2.70]
Orth �NEERt�1 �0.215*** �0.245***[�3.20] [�3.90]
�VIXt�1 �0.020*** �0.025*** �0.028*** �0.019*** �0.019***[�14.82] [�16.90] [�25.17] [�12.86] [�12.93]
�CPIUSt�1 �0.242*** 0.070 �0.034 �0.456*** �0.473***[�3.17] [1.19] [�0.29] [�3.52] [�4.56]
�IPUSt�1 1.169*** 1.192*** 1.227*** 1.169*** 1.168***[27.86] [26.15] [29.33] [29.41] [29.43]
�IRUSt�1 0.668*** 0.424 0.635*** 0.895*** 0.879***[2.64] [1.64] [3.09] [4.74] [4.15]
�CPIt�1 �0.185 �0.211 �0.248** �0.185 �0.18[�1.32] [�1.53] [�2.02] [�1.41] [�1.39]
�IPt�1 0.017** 0.018*** 0.016** 0.015** 0.015**[2.28] [2.60] [2.48] [2.12] [2.06]
�IRt�1 �0.135 �0.201 �0.255* �0.125 �0.103[�0.97] [�1.48] [�1.80] [�0.89] [�0.73]
N 20 20 20 20 20N�T 2353 2353 2353 2353 2353Within R2 0.304 0.286 0.277 0.311 0.312
29

over the sample period from January 2005 to December 2014.
Since new EME bond funds are added to the EPFR database over the sample period,
we need to control for potential bias created by new funds�entering the database. We use
�ows normalised by NAV, and we consider investor �ows to a country by any fund that is
covered by the EPFR database at a point in time. An alternative approach is to �x a subset
of bond funds for which complete monthly data are available throughout the sample period.
The scatter charts in Section 2 were generated in this way.
We �nd that the coe¢ cient on the bilateral US dollar exchange rate is again both eco-
nomically and statistically more signi�cant than that on the trade-weighted exchange rate.
In particular, an increase in the log of the exchange rate against the US dollar (ie an appreci-
ation of the local currency of an EME against the US dollar) has a highly signi�cant positive
impact on �ows. Table 7 shows that, when an EME�s exchange rate appreciates by 1% in a
month against the US dollar, the ratio of �ows to NAV during the next month increases by
about 18 basis points. The e¤ect is highly signi�cant, with a t-statistic of 7.4.
When we run the same regressions using the NEER instead of the BER, the coe¢ cients
are also positive, but smaller and somewhat less signi�cant. However, the impact of the
NEER not explained by the BER is signi�cantly negative, con�rming the reverse direction
of the e¤ect of the e¤ective exchange rate movements that are unrelated to the US dollar on
�nancial conditions, as indicated by the analysis of the yield and risk spreads in the previous
subsection.
The regression results in Table 7 show that the signi�cant impact of the US dollar ex-
change rate on portfolio �ows obtains despite controlling for a number of variables that
signi�cantly impact �ows and that presumably also impact the exchange rate. Like the neg-
ative association of the bilateral US dollar exchange rate and bond and risk spreads uncovered
in the previous subsection, the positive association between the exchange rate and portfolio
�ows thus does not seem to merely capture common factors but appears to represent an
independent amplifying channel of transmission.
5 Conclusions
We have explored the risk-taking channel of currency appreciation which stands in contrast
to the traditional Mundell-Fleming analysis of currency appreciation operating through net
exports. Unlike the traditional model, the risk-taking channel can render a currency appre-
ciation expansionary through loosening of monetary conditions.
The risk-taking channel operates through the balance sheets of both borrowers and
lenders. For borrowers who have net liabilities in dollars, an appreciation of the domes-
30

tic currency makes borrowers more creditworthy. In turn, when borrowers become more
creditworthy, the lenders �nd themselves with greater lending capacity. Through the impact
on the government�s �scal position, dollar lending to corporates for investment and portfo-
lio holding of domestic sovereign bonds go hand in hand, injecting a positive relationship
between currency appreciation and the compression of domestic long-term interest rates.
We have shown that the main predictions of the risk-taking channel are borne out in the
empirical investigation for our spread-based measures of domestic monetary conditions as
well as for bond portfolio �ows.
A key implication of the paper is that currency appreciation is associated with increased
investment, corporate borrowing in dollars, improved government �scal position and dimin-
ished tail-risk of default and greater supply of bond credit. These e¤ects reverse when the
currency depreciates. Together with the evidence that lower sovereign risk pushes up the
exchange rate (see, eg, Della Corte et al. (2015)), this implies that self-reinforcing feedback
loops between exchange rate appreciation (depreciation) and �nancial easing (tightening)
can develop.
Our analysis addresses the procyclicality stemming from portfolio �ows that depend sen-
sitively on tail risk, and hence which transmit �nancial conditions through global markets.
In this respect, our paper adds to the debate on the cross-border transmission of �nancial
conditions, recently galvanised by the �ndings in Rey (2013, 2014) that monetary policy has
cross-border spillover e¤ects on �nancial conditions even in a world of freely �oating curren-
cies. Similarly, Obstfeld (2015) has shown that �nancial globalisation worsens the trade-o¤s
monetary policy faces in navigating among multiple domestic objectives, which makes ad-
ditional tools of macroeconomic and �nancial policy more valuable. The potential spillover
e¤ects may be ampli�ed if EME central banks attempt to insulate domestic �nancial condi-
tions from spillovers by shadowing global policy rates through direct interest rate spillover
e¤ects (Hofmann and Takáts (2015)).
We have not addressed the detailed policy implications of our �ndings here. Broadly,
however, our analysis suggests that attention may be paid to three areas: (i) policy actions
to restrict the degree of valuation mismatch on the balance sheet of corporates, which is
the source of the problem; (ii) ex ante prudential measures on FX exposures to discourage
excessive risk taking during boom periods accompanied by EME local currency appreciation,
such as price-based measures (taxes or capital requirements on FX borrowing) or quantity-
based measures (aiming to slow down the speed of foreign borrowing by corporates and
sovereigns, ie capital �ow management measures targeting banking and bond in�ows); and
(iii) ex post measures during bust periods accompanied by EME local currency depreciation,
31

such as loosening quantity constraints on foreign borrowing or relaxing price-based measures
to lower borrowing costs.
32
References
Aastveit, Knut Are, Hilde C. Bjornland and Leif Anders Thorsrud (2015): �What drives oilprices? Emerging versus developed economies�, Journal of Applied Econometrics, vol 30(7),pp 1013-1028.
Agénor, Pierre-Richard, Koray Alper and Luiz Pereira da Silva (2014): �Sudden �oods,macroprudential regulation and stability in an open economy�, Journal of InternationalMoney and Finance, vol 48, pp 68�100.
Akram, Qaiser Farooq (2009): �Commodity prices, interest rates and the dollar�, EnergyEconomics, vol 31, pp 838�851.
Amstad, Marlene, Eli Remolona and Jimmy Shek (2016): �How do global investors di¤er-entiate between sovereign risks? The new normal versus the old�, Journal of InternationalMoney and Finance, forthcoming.
Avdjiev, Stefan, Robert McCauley and Hyun Song Shin (2015): �Breaking free of the triplecoincidence in international �nance�, BIS Working Papers no 526, October.
Bacchetta, Philippe (2012): �Explaining deviations from uncovered interest rate parity�,Chapter 23 in G. Caprio (ed.), Handbook of Safeguarding Global Financial Stability: Political,Social, Cultural, and Economic Theories and Models, Academic Press.
Baskaya, Yusuf Soner, Julian di Giovanni, Sebnem Kalemli-Ozcan, José-Luis Peydró andMehmet Fatih Ulu (2015): �Capital �ows, credit cycle and investment: the role of macro-prudential policy�, paper presented at the CBRT-BIS-IMF conference on MacroprudentialPolicy: E¤ectiveness and Implementation Challenges, Istanbul, 26�27 October 2015.
Bekaert, Geert, Marie Hoerova and Marco Lo Duca (2013): �Risk, uncertainty and monetarypolicy�, Journal of Monetary Economics, vol 60, pp 771�788.
Bellas, Dimitri, Michael Papaioannou and Iva Petrova (2010): �Determinants of emergingmarket sovereign bond spreads: fundamentals vs �nancial stress�, IMF Working PapersWP/10/281, December.
Blanchard, Olivier, Jonathan Ostry, Atish Ghosh and Marcos Chamon (2015): �Are capitalin�ows expansionary or contractionary? Theory, policy implications and some evidence�,NBER Working Paper no 21619.
Borio, Claudio and Philip Lowe (2002): �Assessing the risk of banking crises�, BIS QuarterlyReview, December, pp 43�54.
Borio, Claudio and Haibin Zhu (2012): �Capital regulation, risk-taking and monetary policy:a missing link in the transmission mechanism?�Journal of Financial Stability, vol 8(4), pp236�251.
Bruno, Valentina and Hyun Song Shin (2015a): �Cross-border banking and global liquidity�,Review of Economic Studies, vol 82(2), pp 535�564.
33

Bruno, Valentina and Hyun Song Shin (2015b): �Capital �ows and the risk-taking channelof monetary policy�, Journal of Monetary Economics, vol 71, pp 119�132.
Cerutti, Eugenio, Stijn Claessens and Lev Ratnovski (2014): �Global liquidity and driversof cross-border bank �ows�, IMF Working Papers WP/14/69.
Céspedes, Luis Felipe, Roberto Chang and Andrés Velasco (2004): �Balance sheets andexchange rate policy�, American Economic Review, vol 94(4), pp 1183�1193.
Della Corte, Pasquale, Lucio Sarno, Maik Schmeling and Christian Wagner (2015): �Ex-change rates and sovereign risk�, unpublished manuscript.
Du, Wenxin and Jesse Schreger (2014): �Sovereign risk, currency risk and corporate balancesheets�, unpublished manuscript.
Du, Wenxin and Jesse Schreger (2015): �Local currency sovereign risk�, Journal of Finance,forthcoming.
Feyen, Erik H.B., Swati R. Ghosh, Katie Kibuuka and Suika Farazi (2015): �Global liquidityand external bond issuance in emerging markets and developing economies�, World BankPolicy Research Working Paper WPS7363.
Fleming, J. Marcus (1962): �Domestic �nancial policies under �xed and �oating exchangerates�, IMF Sta¤ Papers, vol 9, pp 369�379.
Gadanecz, Blaise, Ken Miyajima and Chang Shu (2014): �Exchange rate risk and localcurrency sovereign bond yields in emerging markets�, BIS Working Papers no 474, December.
Gourinchas, Pierre-Olivier and Maurice Obstfeld (2012): �Stories of the twentieth centuryfor the twenty-�rst�, American Economic Journal: Macroeconomics, vol 4(1), pp 226�265.
Hnatkovska, Viktoria, Amartya Lahiri and Carlos A. Vegh (2016): �The exchange rateresponse to monetary policy innovations�, American Economic Journal: Macroeconomics,forthcoming.
Hofmann, Boris and El½od Takáts (2015): �International monetary spillovers�, BIS QuarterlyReview, September, pp 105�118.
Kaminsky, Graciela L. and Carmen M. Reinhart (1999): �The twin crises: the causes ofbanking and balance-of-payments problems�, American Economic Review, vol 89, pp 473�500.
Kohlscheen, Emanuel (2014): �The impact of monetary policy on the exchange rate: a highfrequency exchange rate puzzle in emerging economies�, Journal of International Money andFinance, vol 44, pp 69�96.
Krugman, Paul (1999): �Balance sheets, the transfer problem and �nancial crises,� in P.Isard, A. Razin, and A.K. Rose (eds.), International �nance and �nancial crises: essays inhonor of Robert P Flood, Jr. Boston: Kluwer Academic, pp 31�44.
34

Krugman, Paul (2014): �Currency regimes, capital �ows and crises�, IMF Economic Review,vol 62(4), pp 470�493, Mundell-Fleming Lecture, November 2013.
McCauley, Robert N., Patrick McGuire and Vladyslav Sushko (2015): �Global dollar credit:links to US monetary policy and leverage�, Economic Policy, vol 30(82), pp 187�229, April.
Merton, Robert C. (1974): �On the pricing of corporate debt: the risk structure of interestrates�, Journal of Finance, vol 29, pp 449�470.
Mian, Atif, Amir Su� and Emil Verner (2015): �Household debt and business cycles world-wide�, NBER Working Paper no 21581, September.
Mundell, Robert A. (1963): �Capital mobility and stabilisation policy under �xed and �exibleexchange rates�, Canadian Journal of Economic and Political Science, vol 29(4), pp 475�485.
Morais, Bernardo, José-Luis Peydró and Claudia Ruiz (2015): �The international bank lend-ing channel of monetary policy rates and quantitative easing�, World Bank Policy ResearchWorking Paper WPS7216.
Obstfeld, Maurice (2015): �Trilemmas and trade-o¤s: living with �nancial globalisation�,BIS Working Papers no 480, January.
Plantin, Guillaume and Hyun Song Shin (2016): �Exchange rates and monetary spillovers�,BIS Working Papers no 537, January.
Reinhart, Carmen M. and Vincent Reinhart (2009): �Capital �ow bonanzas: an encompass-ing view of the past and present�, NBER Macroeconomics Annual, University of ChicagoPress.
Rey, Hélène (2013): �Dilemma not trilemma: the global �nancial cycle and monetary policyindependence�, proceedings of the Federal Reserve Bank of Kansas City Economic Sympo-sium at Jackson Hole.
Rey, Hélène (2014): �International channels of transmission of monetary policy and theMundellian trilemma�, Mundell-Fleming Lecture at the �fteenth Jacques Polak Annual Re-search Conference on Cross-Border Spillovers, November 2014.
Shek, Jimmy, Ilhyock Shim and Hyun Song Shin (2015): �Investor redemptions and fundmanager sales of emerging market bonds: how are they related?�BIS Working Papers no509, August.
Sobrun, Jhuvesh and Philip Turner (2015): �Bond markets and monetary policy dilemmasfor the emerging markets�, BIS Working Papers no 508, August.
Vasicek, Oldrich (2002): �The Distribution of Loan Portfolio Value�Risk, December,http://www.moodyskmv.com/conf04/pdf/papers/dist_loan_port_val.pdf
35

Appendix 1: Detailed description of data
Appendix Table 1.1: 20 EMEs in the sampleAfrica and the Middle East (3) Israel, Turkey, South Africa
Emerging Asia (8) China, India, Indonesia, Korea,
Malaysia, Philippines, Singapore, Thailand
Emerging Europe (4) Czech Republic, Hungary, Poland, Russia
Latin America and the Caribbean (5) Brazil, Chile, Colombia, Mexico, Peru
Appendix Table 1.2: 14 EMEs for which the Du-Schreger spread is availableAfrica and the Middle East (3) Israel, Turkey, South Africa
Emerging Asia (5) Indonesia, Korea, Malaysia, Philippines, Thailand
Emerging Europe (2) Hungary, Poland
Latin America and the Caribbean (4) Brazil, Colombia, Mexico, Peru
Appendix Table 1.3: 13 EMEs for which foreign currency bond yield is availableAfrica and the Middle East (3) Israel, Turkey, South Africa
Emerging Asia (4) Indonesia, Korea, Malaysia, Philippines
Emerging Europe (2) Hungary, Poland
Latin America and the Caribbean (4) Brazil, Colombia, Mexico, Peru
Appendix Table 1.4: 36 EME local currency bond fundsNo Fund name Benchmark
1 Aberdeen G lobal - Emerging Markets Local Currency Bond JPM GBI-EM G lobal D iversi�ed
2 Aberdeen G lobal I I - Emerging Europ e Bond Fund JPM GBI-EM G lobal D iversi�ed Europ e
3 Ashmore SICAV Emerging Markets Lo cal Currency Bond Fund JPM GBI-EM G lobal D iversi�ed
4 Aviva Investors - Emerging Markets Local Currency Bond Fund JPM GBI-EM Broad D iversi�ed
5 BankInvest Ho jrentelande lokalvaluta JPM GBI-EM G lobal D iversi�ed
6 B lackRock G lobal Funds Emerging Markets Local Currency Bond Fund JPM GBI-EM G lobal D iversi�ed
7 BNY Mellon Emerging Markets Debt Local Currency Fund JPM GBI-EM G lobal D iversi�ed
8 Dreyfus Emerging Markets Debt Local Currency Fund JPM GBI-EM Diversi�ed
9 Eaton Vance Emerging Markets Local Incom e Fund JPM GBI-EM G lobal D iversi�ed
10 Goldman Sachs G rowth & Emerging Markets Debt Local Portfo lio JPM GBI-EM G lobal D iversi�ed
11 Goldman Sachs Local Emerging Markets Debt Fund JPM GBI-EM G lobal D iversi�ed
12 Invesco Emerging Local Currencies Debt Fund JPM GBI-EM G lobal D iversi�ed
13 Invesco Emerging Market Lo cal Currency Debt Fund JPM GBI-EM G lobal D iversi�ed
14 Investec GSF Emerging Markets Lo cal Currency Debt Fund JPM GBI-EM G lobal D iversi�ed
15 ISI Emerging Market Lo cal Currency Bonds Fund JPM GBI-EM Broad D iversi�ed
16 JPMorgan Funds - Emerging Markets Lo cal Currency Debt Fund JPM GBI-EM G lobal D iversi�ed
17 Jyske Invest Emerging Local M arket Bonds JPM GBI-EM Diversi�ed
18 Lazard G IF Emerging Markets Lo cal Debt Fund JPM GBI-EM G lobal D iversi�ed
19 LO Funds - Emerging Local Currency Bond Fundamental JPM GBI-EM G lobal D iversi�ed
20 MFS Investm ent Funds - EM Local Currency Debt Fund JPM GBI-EM G lobal D iversi�ed
21 MFS Merid ian Funds - EM Debt Local Currency Fund JPM GBI-EM G lobal D iversi�ed
22 Morgan Stan ley Emerging Markets Domestic Debt Fund JPM GBI-EM G lobal D iversi�ed
23 Morgan Stan ley Investm ent Funds - Emerging Markets Domestic Debt JPM GBI-EM G lobal D iversi�ed
24 Natix is Intl Fds (Lux) Loom is Sayles Emerging Debt & Currencies Fund JPM GBI-EM G lobal D iversi�ed
25 P ictet - Emerging Local Currency Debt JPM GBI-EM G lobal D iversi�ed
26 P ictet - Latin American Local Currency Debt JPM GBI-EM G lobal Latin America
27 PIMCO Emerging Local Bond Fund JPM GBI-EM G lobal D iversi�ed
28 PIMCO GIS Emerging Local Bond Fund JPM GBI-EM G lobal D iversi�ed
29 P ineBridge G lobal Emerging Markets Local Currency Bond Fund JPM GBI-EM G lobal D iversi�ed
30 P ioneer Funds - Emerging Markets Bond Local Currencies JPM GBI-EM G lobal D iversi�ed
31 T Rowe Price SICAV Emerging Local M arkets Bond Fund JPM GBI-EM G lobal D iversi�ed
32 TCW Emerging Markets Local Currency Incom e Fund JPM GBI-EM G lobal D iversi�ed
33 Threadneed le Emerging Market Lo cal Fund JPM GBI-EM G lobal D iversi�ed
34 UBAM - Local Currency Emerging Market Bond JPM GBI-EM G lobal D iversi�ed
35 Vontob el Fund - Eastern Europ ean Bond JPM GBI-EM G lobal Europ e
36 W isdomTree Emerging Markets Local Debt Fund JPM GBI-EM G lobal D iversi�ed
36

Appendix Table 1.5: Description of variables used in regression analysesVariab le Description Unit Sources
Lo cal currency 5-year lo cal currency sovereign Percentage p oints B lo omberg, Datastream ,
b ond spread bond yields over 5-year US G lobal F inancia l Data,
Treasury yield national data
CDS spread 5-year US dollar sovereign CDS spread Percentage p oints Markit
Foreign currency EMBI country-level y ield over Percentage p oints Datastream ,
b ond spread 5-year US Treasury yield JP Morgan Chase
Du-Schreger 5-year lo cal currency bond yield Percentage p oints Du and Schreger (2015):
spread over a synthetic risk-free rate calcu lated �Local currency sovereign
as the US Treasury yield adjusted for risk�
the forward currency prem ium
constructed from cross-currency and
interest rate swap rates
V IX CBOE volatility index Percentage p oints B lo omberg
CPI CPI in�ation (seas. ad justed) 2000 Q1 = 100 National data
IP Industria l production (seas. ad justed) 2000 Q1 = 100 National data
IR 3-month money market rate Per cent B loomberg, Datastream ,
IMF International F inancia l
Statistics, national data
BER Exchange rate against the US dollars p er un it National data
US dollar of lo cal currency
NEER Nom inal e¤ective exchange rate, broad 2000 Q1 = 100 National data
index
37

All volumes are available on our website www.bis.org.
Previous volumes in this series
No Title Author
537 January 2016
Exchange rates and monetary spillovers Guillaume Plantin and Hyun Song Shin
536 January 2016
Is macroprudential policy instrument blunt? Katsurako Sonoda and Nao Sudo
535 January 2016
Interbank networks in the national banking era: their purpose and their role in the panic of 1893
Charles W Calomiris and Mark Carlson
534 December 2015
Labour reallocation and productivity dynamics: financial causes, real consequences
Claudio Borio, Enisse Kharroubi, Christian Upper and Fabrizio Zampolli
533 December 2015
Managing price and financial stability objectives – what can we learn from the Asia-Pacific region?
Soyoung Kim and Aaron Mehrotra
532 December 2015
Mortgage risk and the yield curve Aytek Malkhozov, Philippe Mueller, Andrea Vedolin and Gyuri Venter
531 December 2015
The supply side of household finance Gabriele Foà, Leonardo Gambacorta, Luigi Guiso and Paolo Emilio Mistrulli
530 November 2015
Commercial Bank Failures During The Great Recession: The Real (Estate) Story
Adonis Antoniades
529 November 2015
A search-based model of the interbank money market and monetary policy implementation
Morten Bech and Cyril Monnet
528 November 2015
External shocks, banks and optimal monetary policy in an open economy
Yasin Mimir and Enes Sunel
527 November 2015
Expectations and Risk Premia at 8:30AM: Macroeconomic Announcements and the Yield Curve
Peter Hördahl, Eli M Remolona and Giorgio Valente
526 November 2015
Modelling the Time-Variation in Euro Area Lending Spread
Boris Blagov, Michael Funke and Richhild Moessner
525 October 2015
Capital flows and the current account: Taking financing (more) seriously
Claudio Borio and Piti Disyatat
524 October 2015
Breaking free of the triple coincidence in international finance
Stefan Avdjiev, Robert N McCauley and Hyun Song Shin
523 October 2015
The evolution of inflation expectations in Canada and the US
James Yetman
522 October 2015
Do banks extract informational rents through collateral?
Bing Xu, Honglin Wang and Adrian van Rixtel
521 October 2015
Does variance risk have two prices? Evidence from the equity and option markets
Laurent Barras and Aytek Malkhozov
Top Related