


Languages
Pages
Legal

Birrindudu Detailed Gravity Survey, NT 2005
Logistics Report
Project 200580
Prepared by Fugro Ground Geophysics
August 2005
Fugro Ground Geophysics GRAVITY LOGISTICS REPORT August 2005 1
TABLE OF CONTENTS
1. INTRODUCTION.................................................................................................................................. 3 1.1 GENERAL.............................................................................................................................. 3 1.2 EQUIPMENT AND PERSONNEL............................................................................................. 2
1.2.1 Gravity Meter Calibration........................................................................................... 2
2. SURVEY PROCEDURE AND SPECIFICATIONS .................................................................................... 3 2.1 DATA ACQUISITION .............................................................................................................. 3 2.2 NAVIGATION ......................................................................................................................... 3 2.3 READING OFFSET ................................................................................................................ 3 2.4 GRAVITY SURVEYING........................................................................................................... 4
2.4.1 Datum Control.......................................................................................................... 4 2.4.2 Drift Control ............................................................................................................. 7 2.4.3 Gravity Repeats ....................................................................................................... 8
2.5 GPS SURVEYING .................................................................................................................. 9 2.5.1 Control Point Establishment ...................................................................................... 9 2.5.2 GPS Repeats..........................................................................................................12
3. DATA PROCESSING...........................................................................................................................13 3.1 OBSERVED GRAVITY ...........................................................................................................13 3.2 BOUGUER GRAVITY ............................................................................................................14 3.3 TERRAIN CORRECTIONS .....................................................................................................15 3.4 GPS .....................................................................................................................................15
3.4.1 ELLIPSOID-GEOID SEPARATION...........................................................................15 3.5 OFFICE REPROCESSING .....................................................................................................16
4. ERROR ANALYSIS .............................................................................................................................17
5. DATA PRODUCTS ..............................................................................................................................18 5.1 FIELD DATA PRODUCTS ......................................................................................................18 5.2 FINAL DATA PRODUCTS ......................................................................................................18
5.2.1 Final Data Format ....................................................................................................18
Fugro Ground Geophysics GRAVITY LOGISTICS REPORT August 2005 2
FIGURES
Figure 1. Birrindudu Gravity Survey – Survey Area Location ........................................................................ 3 Figure 2. Birrindudu Gravity Survey – Station Locations .............................................................................. 1 Figure 3. Primary Gravity Base Station 200580.9901 .................................................................................. 7 Figure 4. Instrument Drift Characteristics.................................................................................................... 7 Figure 5. Observed Gravity Repeats.......................................................................................................... 8 Figure 6. GPS Base Station Network. .......................................................................................................11 Figure 7. Elevation Repeats.....................................................................................................................12
APPENDICES
APPENDIX A GRAVITY LOOP STATISTICS
APPENDIX B SURVEY METADATA
APPENDIX C GRAVITY METER CALIBRATION RANGE RESULTS
APPENDIX D GRAVITY STATIONS – REPEAT LISTING
APPENDIX E AFGN BASE STATION 6491.0129 (HALLS CREEK)
APPENDIX F STATISTICAL ANALYSIS AND ERROR CALCULATION
APPENDIX G VERIFICATION IMAGES – COMPLETE BOUGUER (2.67gm/cc) &
AHD71 ELEVATION
Fugro Ground Geophysics GRAVITY LOGISTICS REPORT August 2005 3
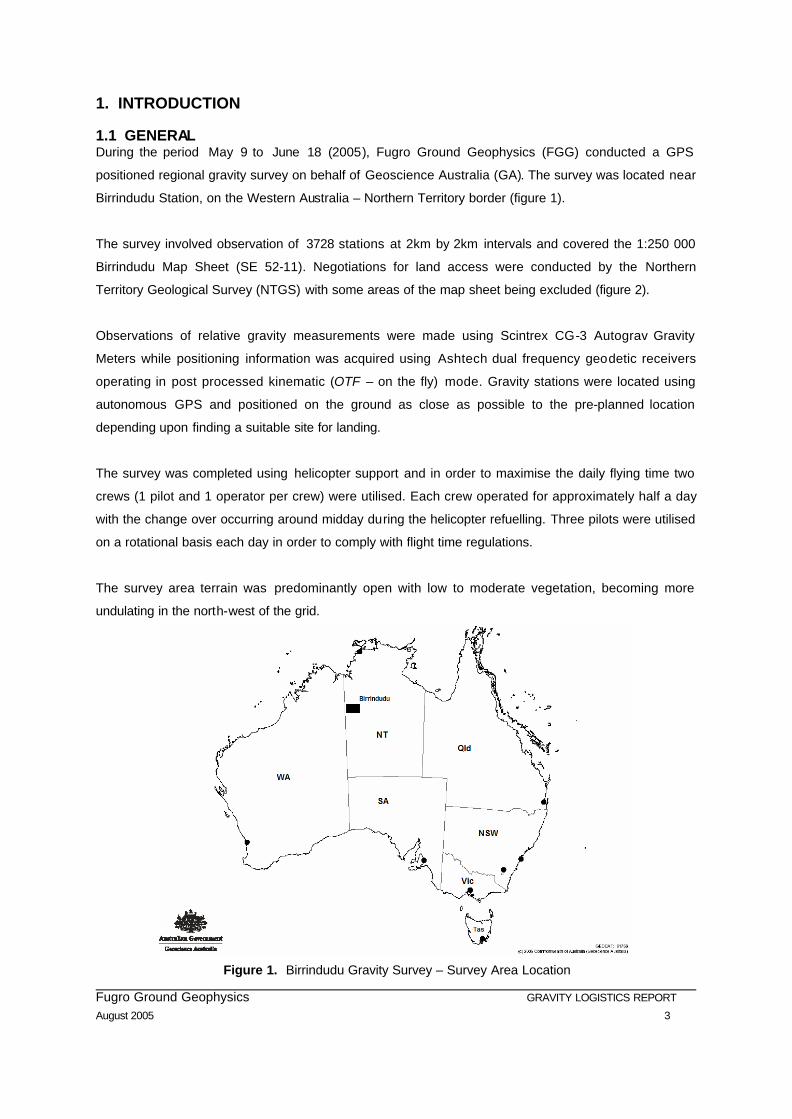
1. INTRODUCTION 1.1 GENERAL During the period May 9 to June 18 (2005), Fugro Ground Geophysics (FGG) conducted a GPS
positioned regional gravity survey on behalf of Geoscience Australia (GA). The survey was located near
Birrindudu Station, on the Western Australia – Northern Territory border (figure 1).
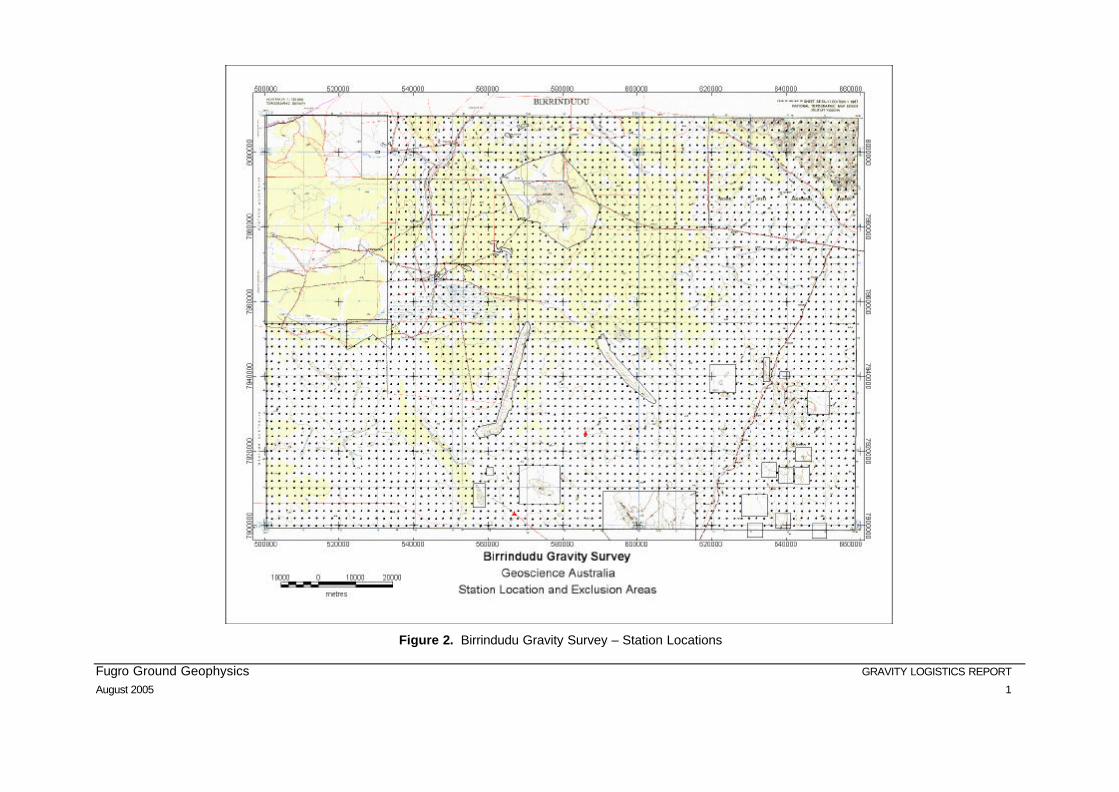
The survey involved observation of 3728 stations at 2km by 2km intervals and covered the 1:250 000
Birrindudu Map Sheet (SE 52-11). Negotiations for land access were conducted by the Northern
Territory Geological Survey (NTGS) with some areas of the map sheet being excluded (figure 2).
Observations of relative gravity measurements were made using Scintrex CG-3 Autograv Gravity
Meters while positioning information was acquired using Ashtech dual frequency geodetic receivers
operating in post processed kinematic (OTF – on the fly) mode. Gravity stations were located using
autonomous GPS and positioned on the ground as close as possible to the pre-planned location
depending upon finding a suitable site for landing.
The survey was completed using helicopter support and in order to maximise the daily flying time two
crews (1 pilot and 1 operator per crew) were utilised. Each crew operated for approximately half a day
with the change over occurring around midday during the helicopter refuelling. Three pilots were utilised
on a rotational basis each day in order to comply with flight time regulations.
The survey area terrain was predominantly open with low to moderate vegetation, becoming more
undulating in the north-west of the grid.
Figure 1. Birrindudu Gravity Survey – Survey Area Location
Fugro Ground Geophysics GRAVITY LOGISTICS REPORT August 2005 1
Figure 2. Birrindudu Gravity Survey – Station Locations
Fugro Ground Geophysics GRAVITY LOGISTICS REPORT August 2005 2
1.2 EQUIPMENT AND PERSONNEL
The following FGG personnel were on-site during field operations:
GRAVITY/GPS PERSONNEL
PERSONNEL POSITION Gregory Kunda Crew Chief / Data Processor / Gravity Observer Keith Clinton Gravity Observer Laurie Murphy Gravity Observer Jack Larsen (Heliwork) Pilot David Creed (Heliwork) Pilot Pat Maher (Heliwork) Pilot Craig Iesley (Heliwork) Pilot
FGG supplied the following equipment for the survey:
Num HARDWARE 4 Scintrex CG-3/M gravity meters 1 LaCoste & Romberg gravity meter 5 Ashtech Z-Surveyor dual frequency GPS receivers 2 Ashtech Z12 dual frequency GPS receivers 3 Garmin GPS for navigation 3 Robinson R44 helicopters (on a rotational basis) 2 Inclinometers (Suunto PM-5) 1 Leica Disto-meter 4 Telit Global Star satellite telephones 2 Toyota Landcruiser 4 X 4 utility vehicles 1 Computer / printer / modem Safety equipment / first aid and survival kits Camp equipment (tents / messing / power) SOFTWARE GRAVI Gravity Processing software Geosoft – Oasis Montaj PNav – Ashtech post processing software
The field crew and all operations were based out of Birrindudu Station for the duration of the survey.
1.2.1 Gravity Meter Calibration
In order to ensure the accuracy of the gravity meters used on the survey, the calibration factor
(GCAL1) was checked by making observations on the Perth (Mundairing) calibration range upon the
completion of the survey. Observations of gravity differences were made between stations 7391.0217
(Mt Gungin) and 8090.0317 (Mundairing Wier Pumping Station) which has a published difference of
541.8µms -2. Errors in the observed difference between these stations for each meter were -0.23µms -2
(9808440), -0.16µms -2 (9002133), 0.05µms -2 (9507283) and -0.08µms -2 (9610353) all well within the
contractual requirement of 0.5µms -2. No adjustments have been made to the survey data based on
these results. Results of these tests are contained in Appendix C of this report.

Fugro Ground Geophysics GRAVITY LOGISTICS REPORT August 2005 3
2. SURVEY PROCEDURE AND SPECIFICATIONS
2.1 DATA ACQUISITION
The survey consisted of a total of 3728 stations which were acquired at the following parameters:
PARAM ETER Grid
Line Spacing 2km
Station Spacing 2km
Number of Stations 3728
Number of Repeats 225 (Gravity)
205 (GPS)
Navigation Real time GPS (autonomous)
Surveying Dual frequency GPS
Survey Method OTF Kinematic
2.2 NAVIGATION
Station location and helicopter navigation were completed using real time GPS (non-corrected).
Coordinates for each station were up-loaded daily to the helicopter’s Garmin GPS receiver, which
displayed a steering indicator and the distance to the next station. The pilot followed the steering
indicator until the distance to the station was less than 100 metres, at which point a search for a suitable
landing site would commence. Because of the varying nature of the vegetation and topography present
in parts of the survey area, it was not always possible to land safely at the designated location. In these
cases, the pilot attempted to land as close as was safely possible.
2.3 READING OFFSET
The GPS antenna was located approximately mid-way along the tail boom of the helicopter to enable
it as clear view as possible for continuous satellite tracking. As this position is outside of the field of
view of the pilot and would mean working dangerously close to the tail rotor, the actual reading
position for the gravity meter was located at right angles to the helicopter. In order to correct for this
offset and comply with the requirement that all stations must be located with a 1m accuracy (X-Y
position), measurements of offset between the reading position and the antenna were made at each
station. The offset distance was measured using a Leica disto-meter with a reading accuracy of better
than 1cm, and the offset direction was measured using a standard Sunnt o compass (KB-14/360) with
a reading accuracy of better than 1º. From these measurements and using simple geometry the
components of east and north could be computed and the position of the gravity meter determined

Fugro Ground Geophysics GRAVITY LOGISTICS REPORT August 2005 4
relative to the GPS antenna (to better than 1m accuracy). All reading sites were chosen to be as flat
as possible to minimise elevation differences between the antenna and the reading site (<10cm).
2.4 GRAVITY SURVEYING
During surveying, measurements of relative gravity were made using Scintrex CG-3 and CG-3M
Autograv gravity meters. At each station, readings were averaged for a duration of 30 seconds with a
minimum of 2 readings taken having a difference of less than 0.3µms-2. During processing multiple
gravity readings taken at each station were averaged.
All gravity surveying consisted of measuring data in independent, closed loops which started and
finished at base 200580.9901. This was due to the fact the crew were based at Birrindudu Station (t he
site at which 200580.9901 was located) for the duration of the survey and it was convenient to start
and end loops at this point. Loop duration was generally around 10 – 12 hours but in order to ensure
data quality was high, a minimum of 5% of stations were repeated with both internal and external
repeat readings taken.
Field notes were recorded by the operator at each station which included the station identifier (line
and station number), relative gravity reading, time, measurements of distance and direction offset of
the gravity meter from the GPS antenna and inclinometer measurements for Hammer Zones B and C
if required. Digital data was recorded by the gravity meter which was downloaded at the end of each
day and checked against field notes to ensure consistency.
Whenever possible gravity stations were located as far away as practical from abrupt changes in
elevation in order to limit the effect of terrain on the gravity meter.
2.4.1 Datum Control
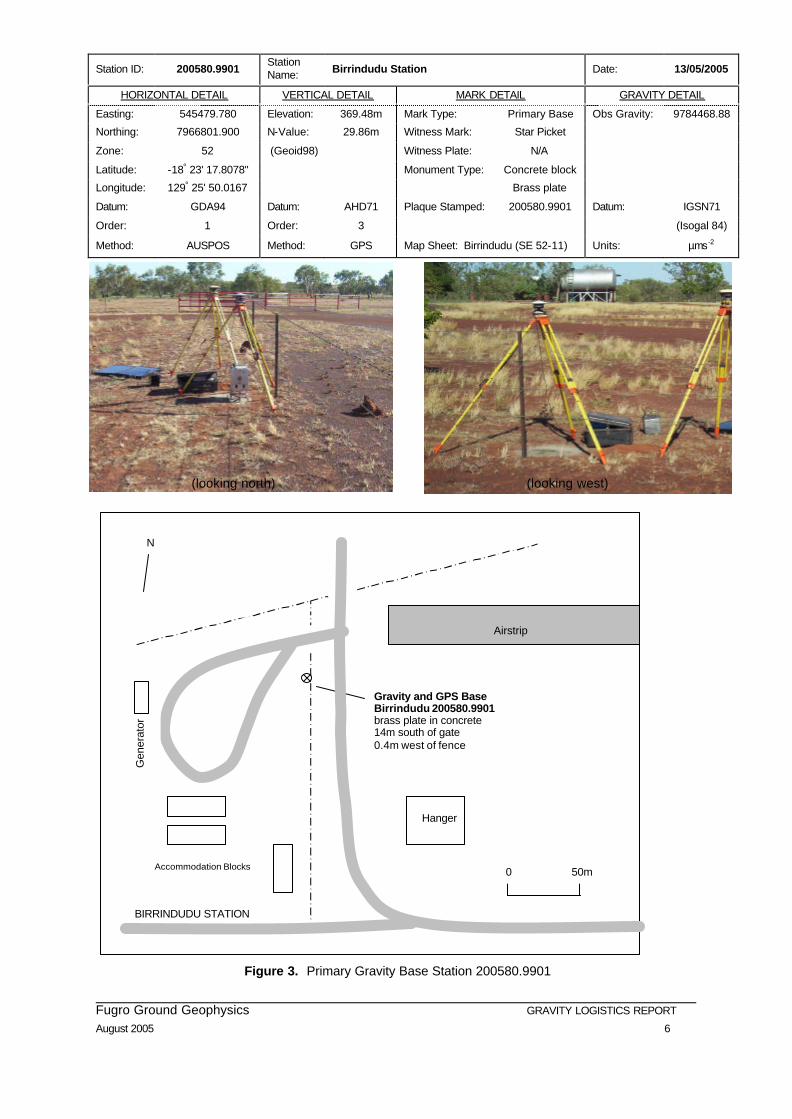
A primary gravity base station (200580.9901) was established at Birrindudu Station for the purpose of
datum and drift control. This base station is located immediately west of an existing fence post (star
picket), and marked with a flat topped concrete monument embedded with a brass plate stamped with
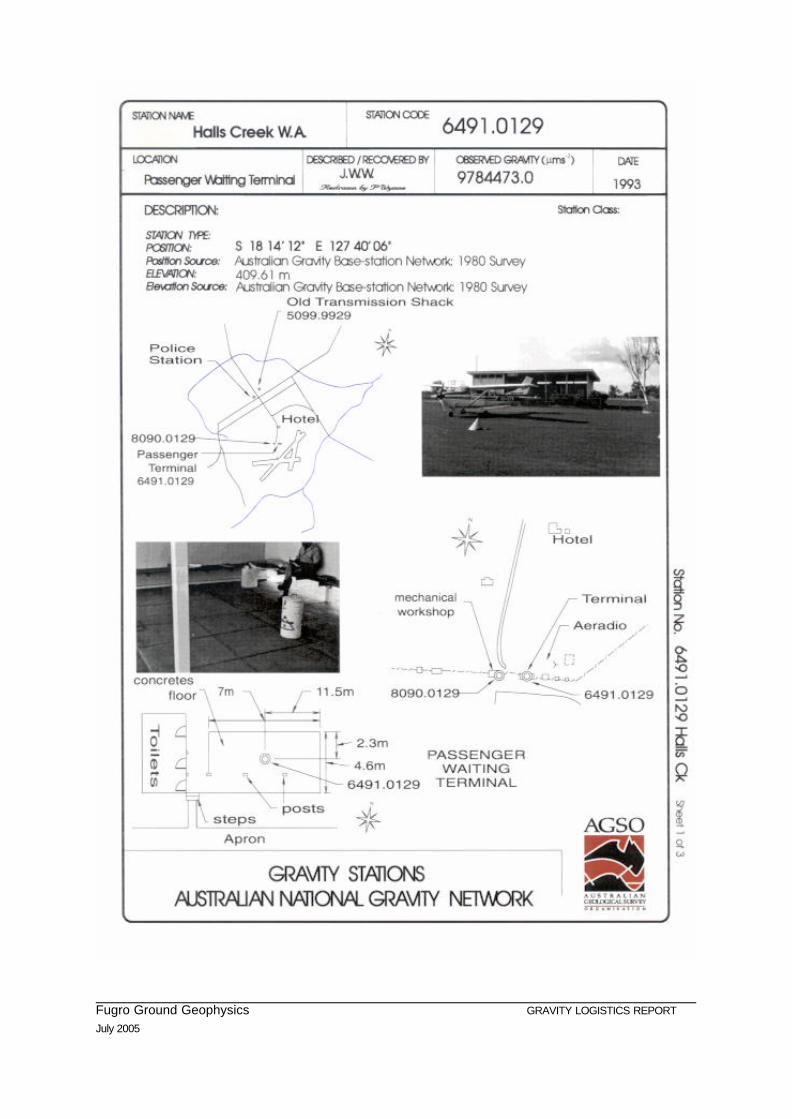
the station number (figure 3). Base station 200580.9901 was tied to the Australian Fundamental Gravity
Network (AFGN) by several A-B-A loops using multiple gravity meters. The tie was made to GA base
station 6491.0129 at the Halls Creek Airport Terminal. Details for this base station can be found in
Appendix E. Because of the large distance between the stations (a travel time of some 8 hours return
trip) it was not possible to complete any more than one loop per day but to improve accuracy and
confirm the reliability of the value for 200580.9901, several ties were done over a number of days using
different gravity meters.
Fugro Ground Geophysics GRAVITY LOGISTICS REPORT August 2005 5
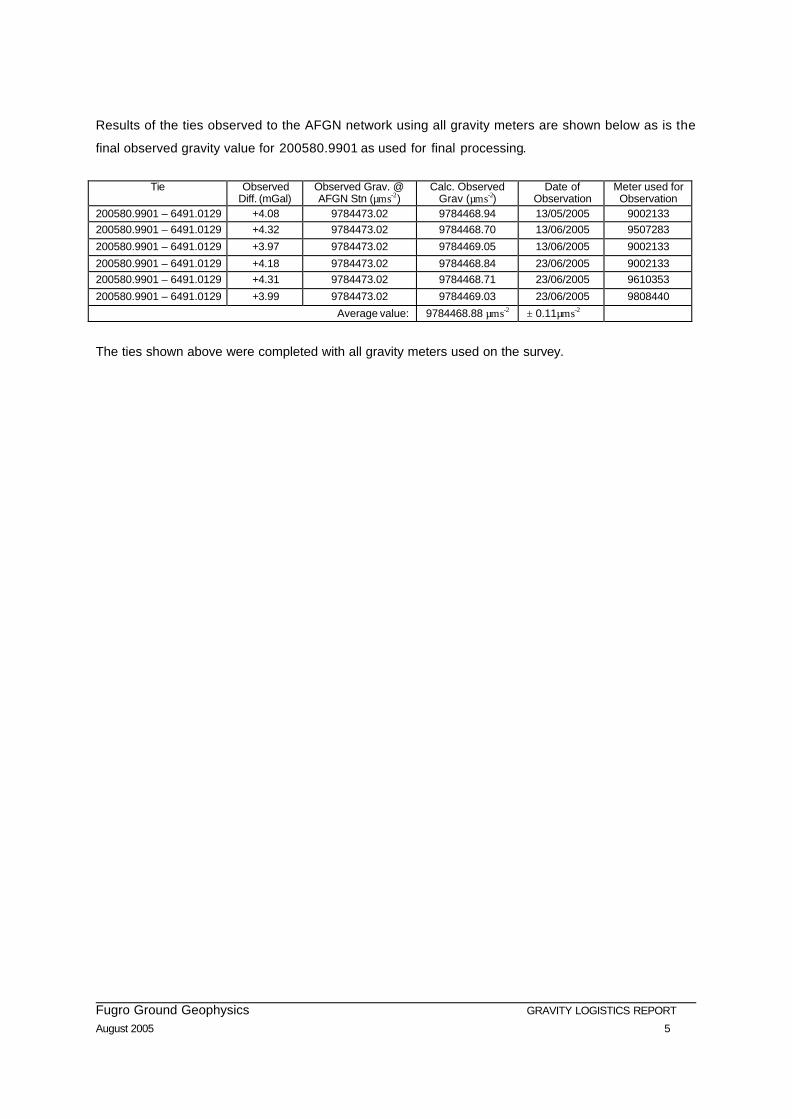
Results of the ties observed to the AFGN network using all gravity meters are shown below as is the
final observed gravity value for 200580.9901 as used for final processing.
Tie Observed
Diff. (mGal) Observed Grav. @ AFGN Stn (µms-2)
Calc. Observed Grav (µms-2)
Date of Observation
Meter used for Observation
200580.9901 – 6491.0129 +4.08 9784473.02 9784468.94 13/05/2005 9002133 200580.9901 – 6491.0129 +4.32 9784473.02 9784468.70 13/06/2005 9507283
200580.9901 – 6491.0129 +3.97 9784473.02 9784469.05 13/06/2005 9002133
200580.9901 – 6491.0129 +4.18 9784473.02 9784468.84 23/06/2005 9002133 200580.9901 – 6491.0129 +4.31 9784473.02 9784468.71 23/06/2005 9610353
200580.9901 – 6491.0129 +3.99 9784473.02 9784469.03 23/06/2005 9808440
Average value: 9784468.88 µms-2 ± 0.11µms-2
The ties shown above were completed with all gravity meters used on the survey.
Fugro Ground Geophysics GRAVITY LOGISTICS REPORT August 2005 6
(looking north) (looking west)
Figure 3. Primary Gravity Base Station 200580.9901
Station ID: 200580.9901 Station Name: Birrindudu Station Date: 13/05/2005
HORIZONTAL DETAIL VERTICAL DETAIL MARK DETAIL GRAVITY DETAIL
Easting: 545479.780 Elevation: 369.48m Mark Type: Primary Base Obs Gravity: 9784468.88
Northing: 7966801.900 N-Value: 29.86m Witness Mark: Star Picket
Zone: 52 (Geoid98) Witness Plate: N/A
Latitude: -18º 23' 17.8078" Monument Type: Concrete block
Longitude: 129º 25' 50.0167 Brass plate
Datum: GDA94 Datum: AHD71 Plaque Stamped: 200580.9901 Datum: IGSN71
Order: 1 Order: 3 (Isogal 84)
Method: AUSPOS Method: GPS Map Sheet: Birrindudu (SE 52-11) Units: µms-2
Airstrip
Hanger
Accommodation Blocks
N
Gravity and GPS Base Birrindudu 200580.9901 brass plate in concrete 14m south of gate 0.4m west of fence
BIRRINDUDU STATION
Gen
erat
or
0 50m
Fugro Ground Geophysics GRAVITY LOGISTICS REPORT August 2005 7
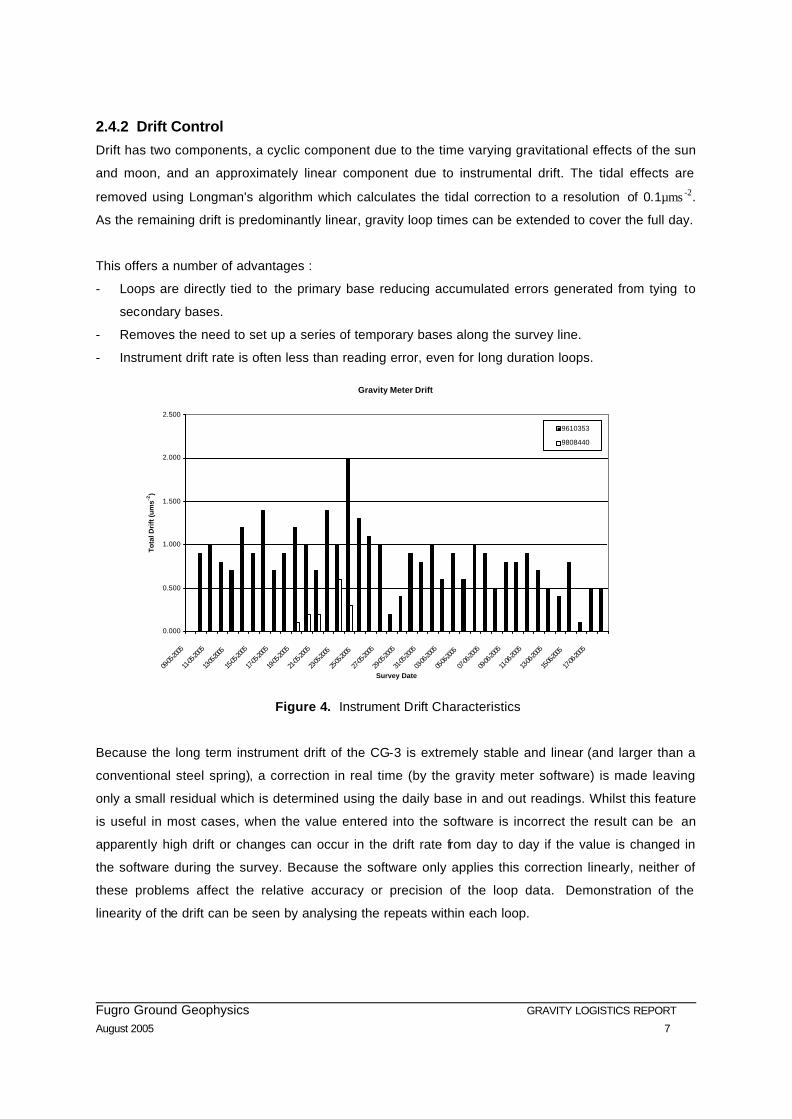
2.4.2 Drift Control
Drift has two components, a cyclic component due to the time varying gravitational effects of the sun
and moon, and an approximately linear component due to instrumental drift. The tidal effects are
removed using Longman's algorithm which calculates the tidal correction to a resolution of 0.1µms -2.
As the remaining drift is predominantly linear, gravity loop times can be extended to cover the full day.
This offers a number of advantages :
- Loops are directly tied to the primary base reducing accumulated errors generated from tying to
secondary bases.
- Removes the need to set up a series of temporary bases along the survey line.
- Instrument drift rate is often less than reading error, even for long duration loops.
Gravity Meter Drift
0.000
0.500
1.000
1.500
2.000
2.500
09-05
-2005
11-05
-2005
13-05-
2005
15-05
-2005
17-05
-2005
19-05
-2005
21-05
-2005
23-05-
2005
25-05-
2005
27-05
-2005
29-05
-2005
31-05
-2005
03-06
-2005
05-06-
2005
07-06
-2005
09-06
-2005
11-06
-2005
13-06
-2005
15-06-
2005
17-06
-2005
Survey Date
To
tal D
rift
(u
ms-2
)
9610353
9808440
Figure 4. Instrument Drift Characteristics
Because the long term instrument drift of the CG-3 is extremely stable and linear (and larger than a
conventional steel spring), a correction in real time (by the gravity meter software) is made leaving
only a small residual which is determined using the daily base in and out readings. Whilst this feature
is useful in most cases, when the value entered into the software is incorrect the result can be an
apparently high drift or changes can occur in the drift rate from day to day if the value is changed in
the software during the survey. Because the software only applies this correction linearly, neither of
these problems affect the relative accuracy or precision of the loop data. Demonstration of the
linearity of the drift can be seen by analysing the repeats within each loop.
Fugro Ground Geophysics GRAVITY LOGISTICS REPORT August 2005 8
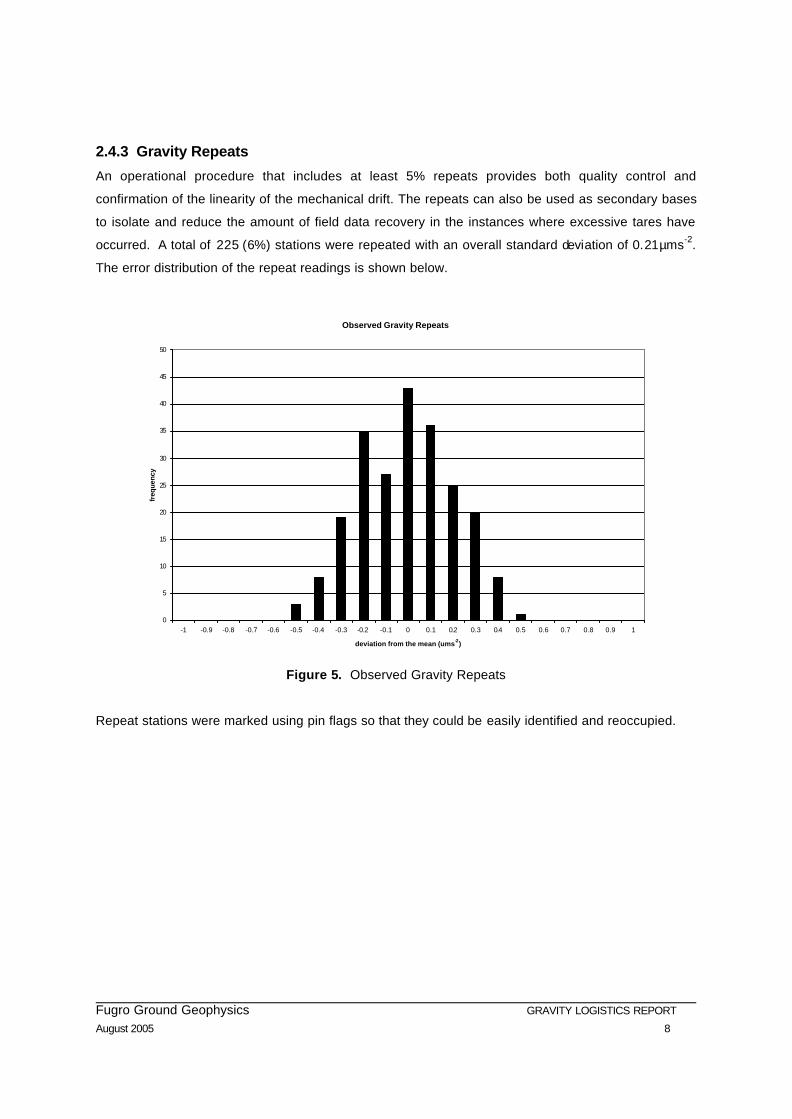
2.4.3 Gravity Repeats
An operational procedure that includes at least 5% repeats provides both quality control and
confirmation of the linearity of the mechanical drift. The repeats can also be used as secondary bases
to isolate and reduce the amount of field data recovery in the instances where excessive tares have
occurred. A total of 225 (6%) stations were repeated with an overall standard deviation of 0.21µms-2.
The error distribution of the repeat readings is shown below.
Observed Gravity Repeats
0
5
10
15
20
25
30
35
40
45
50
-1 -0.9 -0.8 -0.7 -0.6 -0.5 -0.4 -0.3 -0.2 -0.1 0 0.1 0.2 0.3 0.4 0.5 0.6 0.7 0.8 0.9 1
deviation from the mean (ums-2)
freq
uenc
y
Figure 5. Observed Gravity Repeats
Repeat stations were marked using pin flags so that they could be easily identified and reoccupied.
Fugro Ground Geophysics GRAVITY LOGISTICS REPORT August 2005 9
2.5 GPS SURVEYING
FGG surveyed all gravity stations with GPS utilising Ashtech Z-Surveyors and Z-12 dual frequency
geodetic receivers. Data was recorded continuously during the day at 5 second intervals and stored
on either internal memory (Z-12) or removable PCMCIA cards (Z-Surveyor) and downloaded at the
completion of each day.
In order to minimise the loss of survey data in the event of a hardware failure, two GPS receivers
were used to log data in the helicopter at all times (logging simultaneously) in addition to two GPS
receivers running concurrently at each field base station site.
2.5.1 Control Point Establishment
39 stations were established in order to provide positioning control during the survey. The primary GPS
base station was located coincident with gravity base 200580.9901 (Birrindudu Station) and this station
was used to establish all local field bases. In general, a receiver positioned at GPS base 200580.9901
logged each day in order to establish the local field base which was set out by the helicopter crew in the
morning. For processing purposes, the local field base was used to correct the helicopter rover data in
order to limit the baseline length (base – rover separation) to less than 30km. Base station 200580.9901
was then used to derive coordinates for the local field base via a static tie with approximately 8 – 10
hours of data providing extremely stable and reliable solutions. External repeats between loops
established from different GPS base stations also demonstrate compatibility and consistency between
the GPS base stations. Field bases were marked with a pin flag and established only for short term (one
day) use.
Survey control station 200580.9901 was established using long baseline processing (AUSPOS). This
facility is provided by GA, and uses the Australian Regional GPS Network (ARGN) base stations
situated around Australia. The data processing is accurate to 10-20mm in the horizontal and 20-30mm
in vertical ellipsoidal height provided sufficient data is observed at the field base. Files from logging on
the 09-05-05 (5.5hrs) and 13-05-05 (10.5hrs) at 200580.9901 were submitted for processing with
differences of 6mm in the easting, 0mm in the northing and 11mm in the elevation.
Because coordinates from the AUSPOS processing are generated in ITRF/GDA94, simply applying the
Ausgeoid98 N-value to survey stations processed differentially from a base using these coordinates
would result in an absolute error of around 0.3–0.5m in the AHD elevation (but this error would be
consistent over the survey area making the relative error between stations much smaller). In order to
improve the absolute error at each field station (to less than 0.1m) base station 200580.9901 was tied to
the Northern Territory Survey Control Network at Benchmark FH 31. This benchmark is 3rd order and
provided a means for tieing the survey to an accurate AHD reference datum providing 3rd order
accuracy to the AHD elevations at each field station (relative to the accuracy/reliability of the original
Fugro Ground Geophysics GRAVITY LOGISTICS REPORT August 2005 10
AHD value at the benchmark). This benchmark was situated approximately 25km west of Birrindudu
Station.
The preliminary tie to BM FH31 showed an absolute difference of 0.6m between the supplied 3rd order
AHD and that calculated using AUSPOS derived base coordinates for 200580.9901. This difference is
due only to the absolute error in the Ausgeoid98 grid in the area, which was used to derive AHD
values initially. As a result, the base coordinates for 200580.9901 along with all field stations were
adjusted for this difference.
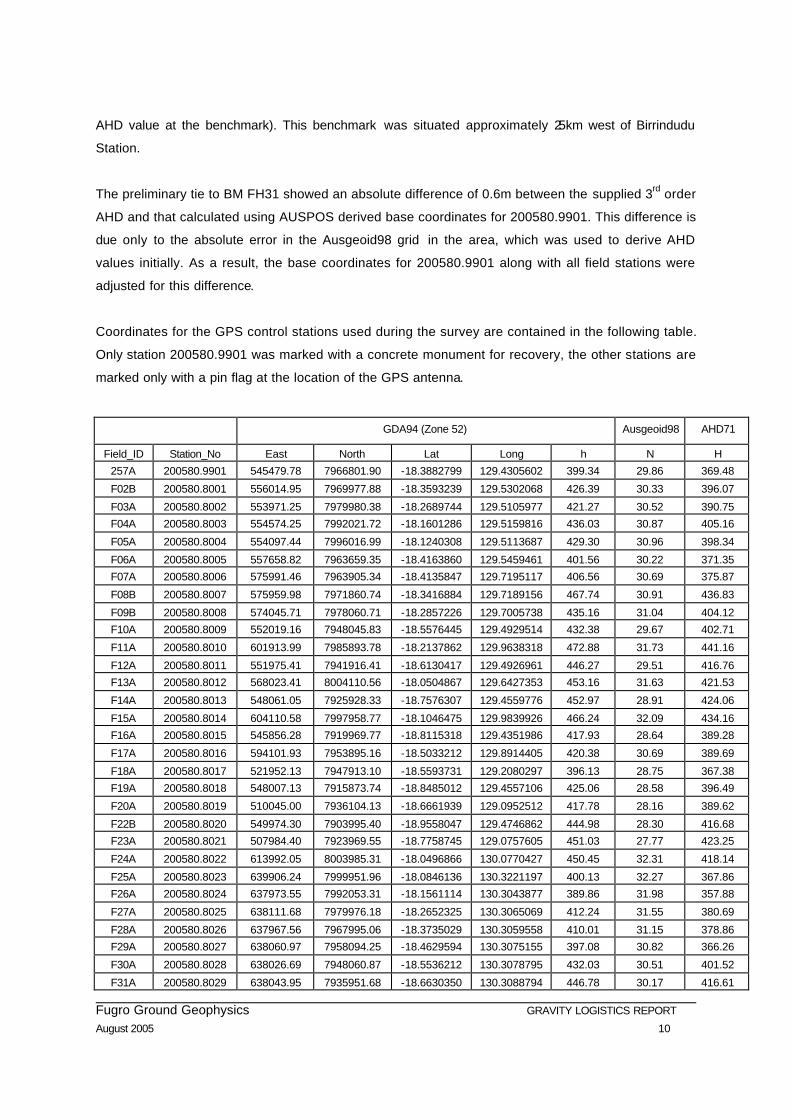
Coordinates for the GPS control stations used during the survey are contained in the following table.
Only station 200580.9901 was marked with a concrete monument for recovery, the other stations are
marked only with a pin flag at the location of the GPS antenna.
GDA94 (Zone 52) Ausgeoid98 AHD71
Field_ID Station_No East North Lat Long h N H
257A 200580.9901 545479.78 7966801.90 -18.3882799 129.4305602 399.34 29.86 369.48
F02B 200580.8001 556014.95 7969977.88 -18.3593239 129.5302068 426.39 30.33 396.07
F03A 200580.8002 553971.25 7979980.38 -18.2689744 129.5105977 421.27 30.52 390.75
F04A 200580.8003 554574.25 7992021.72 -18.1601286 129.5159816 436.03 30.87 405.16
F05A 200580.8004 554097.44 7996016.99 -18.1240308 129.5113687 429.30 30.96 398.34
F06A 200580.8005 557658.82 7963659.35 -18.4163860 129.5459461 401.56 30.22 371.35
F07A 200580.8006 575991.46 7963905.34 -18.4135847 129.7195117 406.56 30.69 375.87
F08B 200580.8007 575959.98 7971860.74 -18.3416884 129.7189156 467.74 30.91 436.83
F09B 200580.8008 574045.71 7978060.71 -18.2857226 129.7005738 435.16 31.04 404.12
F10A 200580.8009 552019.16 7948045.83 -18.5576445 129.4929514 432.38 29.67 402.71
F11A 200580.8010 601913.99 7985893.78 -18.2137862 129.9638318 472.88 31.73 441.16
F12A 200580.8011 551975.41 7941916.41 -18.6130417 129.4926961 446.27 29.51 416.76
F13A 200580.8012 568023.41 8004110.56 -18.0504867 129.6427353 453.16 31.63 421.53
F14A 200580.8013 548061.05 7925928.33 -18.7576307 129.4559776 452.97 28.91 424.06
F15A 200580.8014 604110.58 7997958.77 -18.1046475 129.9839926 466.24 32.09 434.16
F16A 200580.8015 545856.28 7919969.77 -18.8115318 129.4351986 417.93 28.64 389.28
F17A 200580.8016 594101.93 7953895.16 -18.5033212 129.8914405 420.38 30.69 389.69
F18A 200580.8017 521952.13 7947913.10 -18.5593731 129.2080297 396.13 28.75 367.38
F19A 200580.8018 548007.13 7915873.74 -18.8485012 129.4557106 425.06 28.58 396.49
F20A 200580.8019 510045.00 7936104.13 -18.6661939 129.0952512 417.78 28.16 389.62
F22B 200580.8020 549974.30 7903995.40 -18.9558047 129.4746862 444.98 28.30 416.68
F23A 200580.8021 507984.40 7923969.55 -18.7758745 129.0757605 451.03 27.77 423.25
F24A 200580.8022 613992.05 8003985.31 -18.0496866 130.0770427 450.45 32.31 418.14
F25A 200580.8023 639906.24 7999951.96 -18.0846136 130.3221197 400.13 32.27 367.86
F26A 200580.8024 637973.55 7992053.31 -18.1561114 130.3043877 389.86 31.98 357.88
F27A 200580.8025 638111.68 7979976.18 -18.2652325 130.3065069 412.24 31.55 380.69
F28A 200580.8026 637967.56 7967995.06 -18.3735029 130.3059558 410.01 31.15 378.86
F29A 200580.8027 638060.97 7958094.25 -18.4629594 130.3075155 397.08 30.82 366.26
F30A 200580.8028 638026.69 7948060.87 -18.5536212 130.3078795 432.03 30.51 401.52
F31A 200580.8029 638043.95 7935951.68 -18.6630350 130.3088794 446.78 30.17 416.61

Fugro Ground Geophysics GRAVITY LOGISTICS REPORT August 2005 11
F32A 200580.8030 638008.95 7923993.05 -18.7710906 130.3093791 404.66 29.80 374.86
F33A 200580.8031 638002.35 7907962.21 -18.9159371 130.3104400 463.26 29.28 433.98
F34A 200580.8032 609925.09 7912042.31 -18.8807582 130.0436329 517.26 29.63 487.63
F35A 200580.8033 584016.41 7913981.46 -18.8644519 129.7975924 459.85 29.40 430.45
F36A 200580.8034 513901.89 7923844.49 -18.7769735 129.1319098 433.14 27.91 405.23
F37A 200580.8035 600065.70 7925937.08 -18.7556983 129.9493324 484.80 29.97 454.83
F38A 200580.8036 524071.24 7925916.15 -18.7581571 129.2283772 434.12 28.22 405.90
F39A 200580.8037 593932.13 7946027.62 -18.5744281 129.8902003 444.66 30.48 414.18
F40A 200580.8038 595939.98 7934012.77 -18.6829143 129.9098046 469.76 30.18 439.58
FH31 (NT_Surveys) 500049.66 7973439.20 -18.3287773 129.0004700 399.63 28.68 370.95
Station FH31 is Benchmark FH31 with a supplied 3rd order AHD elevation but scaled horizontal
coordinates (+/- 500m). From the GPS observations made during this survey 1st order X and Y
coordinates have been generated and are shown in the table above. GPS field base stations have
been number in the range 200580.8001 – 200580.8038. Figure 6 shows the GPS base station
network established during the survey.
Figure 6. GPS Base Station Network

Fugro Ground Geophysics GRAVITY LOGISTICS REPORT August 2005 12
2.5.2 GPS Repeats
In order to demonstrate the repeatability and reliability of the GPS data, 205 (5.5%) repeats were
observed with an overall standard deviation of 0.04m. The error distribution is shown as follows.
Elevation Repeats
0
10
20
30
40
50
60
70
80
-0.20 -0.18 -0.16 -0.14 -0.12 -0.10 -0.08 -0.06 -0.04 -0.02 0.00 0.02 0.04 0.06 0.08 0.10 0.12 0.14 0.16 0.18 0.20
deviation from the mean (m)
freq
uenc
y
Figure 7. Elevation Repeats
Fugro Ground Geophysics GRAVITY LOGISTICS REPORT August 2005 13
3. DATA PROCESSING
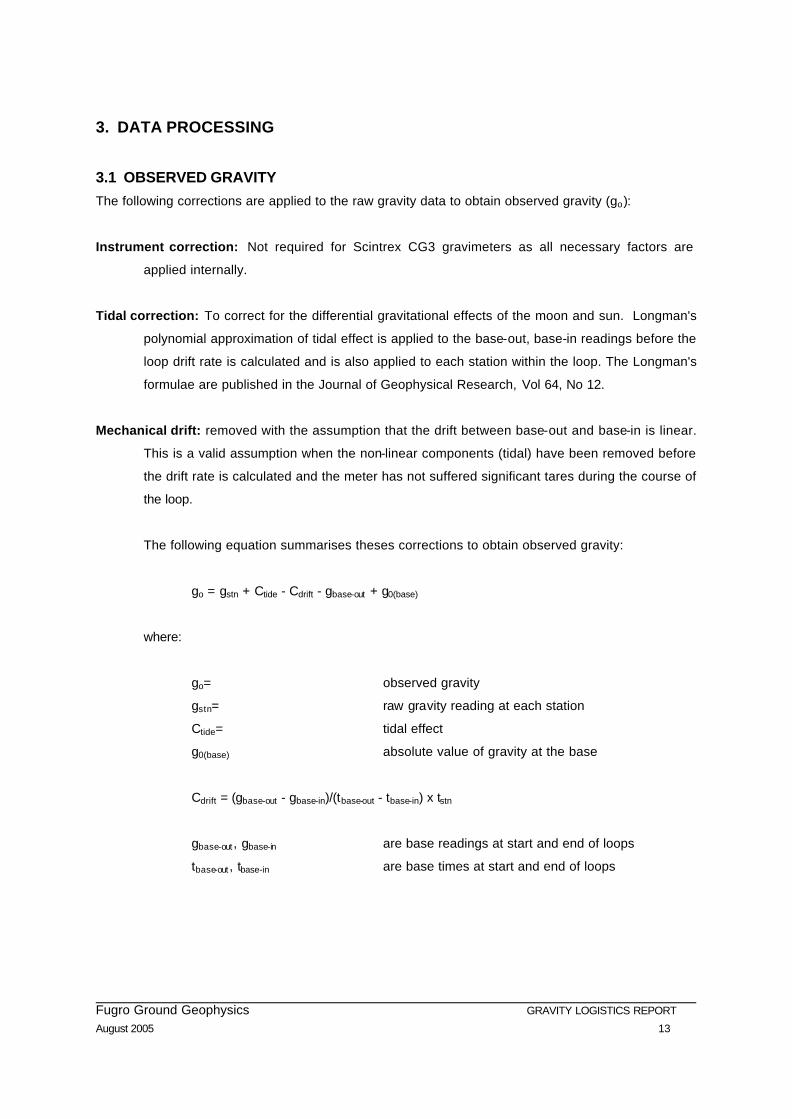
3.1 OBSERVED GRAVITY
The following corrections are applied to the raw gravity data to obtain observed gravity (go):
Instrument correction: Not required for Scintrex CG3 gravimeters as all necessary factors are
applied internally.
Tidal correction: To correct for the differential gravitational effects of the moon and sun. Longman's
polynomial approximation of tidal effect is applied to the base-out, base-in readings before the
loop drift rate is calculated and is also applied to each station within the loop. The Longman's
formulae are published in the Journal of Geophysical Research, Vol 64, No 12.
Mechanical drift: removed with the assumption that the drift between base-out and base-in is linear.
This is a valid assumption when the non-linear components (tidal) have been removed before
the drift rate is calculated and the meter has not suffered significant tares during the course of
the loop.
The following equation summarises theses corrections to obtain observed gravity:
go = gstn + Ctide - Cdrift - gbase-out + g0(base)
where:
go= observed gravity
gstn= raw gravity reading at each station
Ctide= tidal effect
g0(base) absolute value of gravity at the base
Cdrift = (gbase-out - gbase-in)/(tbase-out - tbase-in) x tstn
gbase-out , gbase-in are base readings at start and end of loops
tbase-out , tbase-in are base times at start and end of loops
Fugro Ground Geophysics GRAVITY LOGISTICS REPORT August 2005 14
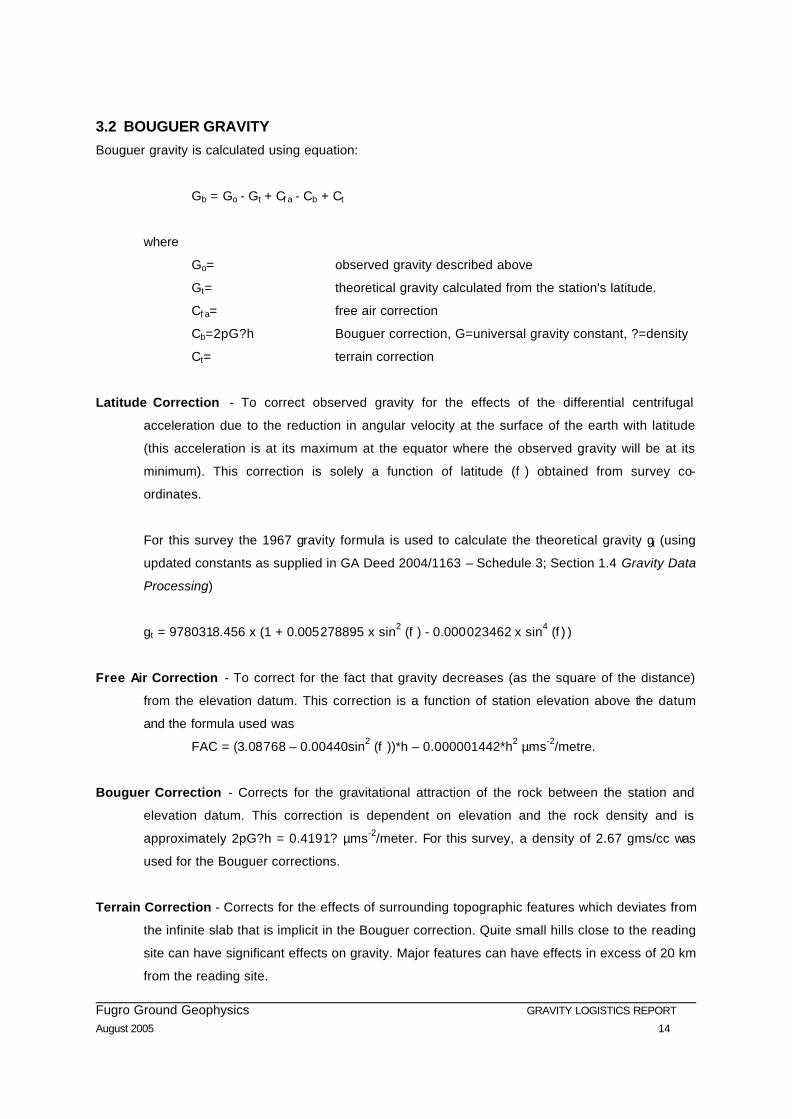
3.2 BOUGUER GRAVITY
Bouguer gravity is calculated using equation:
Gb = Go - Gt + Cf a - Cb + Ct
where
Go= observed gravity described above
Gt= theoretical gravity calculated from the station's latitude.
Cf a= free air correction
Cb=2pG?h Bouguer correction, G=universal gravity constant, ?=density
Ct= terrain correction
Latitude Correction - To correct observed gravity for the effects of the differential centrifugal
acceleration due to the reduction in angular velocity at the surface of the earth with latitude
(this acceleration is at its maximum at the equator where the observed gravity will be at its
minimum). This correction is solely a function of latitude (f ) obtained from survey co-
ordinates.
For this survey the 1967 gravity formula is used to calculate the theoretical gravity gt (using
updated constants as supplied in GA Deed 2004/1163 – Schedule 3; Section 1.4 Gravity Data
Processing)
gt = 9780318.456 x (1 + 0.005278895 x sin2 (f ) - 0.000023462 x sin4 (f ) )
Free Air Correction - To correct for the fact that gravity decreases (as the square of the distance)
from the elevation datum. This correction is a function of station elevation above the datum
and the formula used was
FAC = (3.08768 – 0.00440sin2 (f ))*h – 0.000001442*h2 µms-2/metre.
Bouguer Correction - Corrects for the gravitational attraction of the rock between the station and
elevation datum. This correction is dependent on elevation and the rock density and is
approximately 2pG?h = 0.4191? µms-2/meter. For this survey, a density of 2.67 gms/cc was
used for the Bouguer corrections.
Terrain Correction - Corrects for the effects of surrounding topographic features which deviates from
the infinite slab that is implicit in the Bouguer correction. Quite small hills close to the reading
site can have significant effects on gravity. Major features can have effects in excess of 20 km
from the reading site.
Fugro Ground Geophysics GRAVITY LOGISTICS REPORT August 2005 15
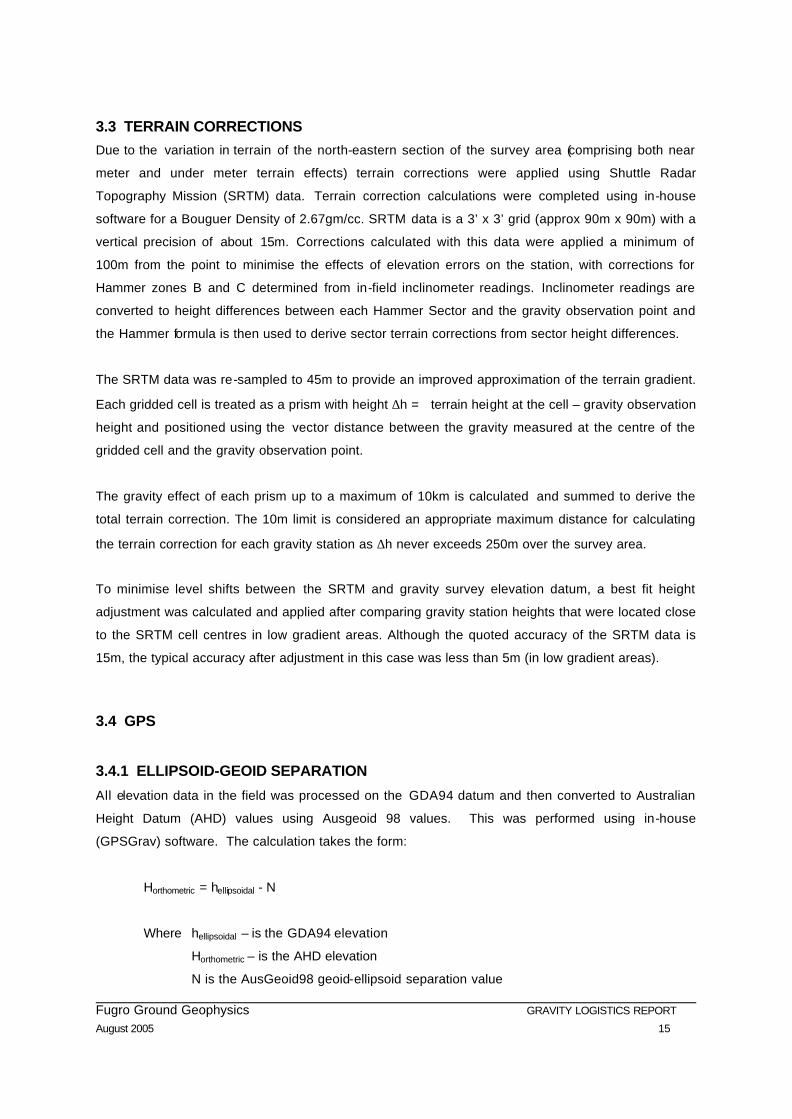
3.3 TERRAIN CORRECTIONS
Due to the variation in terrain of the north-eastern section of the survey area (comprising both near
meter and under meter terrain effects) terrain corrections were applied using Shuttle Radar
Topography Mission (SRTM) data. Terrain correction calculations were completed using in-house
software for a Bouguer Density of 2.67gm/cc. SRTM data is a 3’ x 3’ grid (approx 90m x 90m) with a
vertical precision of about 15m. Corrections calculated with this data were applied a minimum of
100m from the point to minimise the effects of elevation errors on the station, with corrections for
Hammer zones B and C determined from in-field inclinometer readings. Inclinometer readings are
converted to height differences between each Hammer Sector and the gravity observation point and
the Hammer formula is then used to derive sector terrain corrections from sector height differences.
The SRTM data was re-sampled to 45m to provide an improved approximation of the terrain gradient.
Each gridded cell is treated as a prism with height ∆h = terrain height at the cell – gravity observation
height and positioned using the vector distance between the gravity measured at the centre of the
gridded cell and the gravity observation point.
The gravity effect of each prism up to a maximum of 10km is calculated and summed to derive the
total terrain correction. The 10m limit is considered an appropriate maximum distance for calculating
the terrain correction for each gravity station as ∆h never exceeds 250m over the survey area.
To minimise level shifts between the SRTM and gravity survey elevation datum, a best fit height
adjustment was calculated and applied after comparing gravity station heights that were located close
to the SRTM cell centres in low gradient areas. Although the quoted accuracy of the SRTM data is
15m, the typical accuracy after adjustment in this case was less than 5m (in low gradient areas).
3.4 GPS
3.4.1 ELLIPSOID-GEOID SEPARATION
All elevation data in the field was processed on the GDA94 datum and then converted to Australian
Height Datum (AHD) values using Ausgeoid 98 values. This was performed using in-house
(GPSGrav) software. The calculation takes the form:
Horthometric = hellipsoidal - N
Where hellipsoidal – is the GDA94 elevation
Horthometric – is the AHD elevation
N is the AusGeoid98 geoid-ellipsoid separation value
Fugro Ground Geophysics GRAVITY LOGISTICS REPORT August 2005 16
3.5 OFFICE REPROCESSING
As a standard procedure, all data is routinely checked throughout the survey, and undergoes a final
checking process via a reprocessing sequence if required subsequent to the completion of the survey.
The following data integrity checks were made:
All data entry of raw gravity are checked against field books
GPS and Gravity Base station ties are checked and reprocessed
Fugro Ground Geophysics GRAVITY LOGISTICS REPORT August 2005 17
4. ERROR ANALYSIS
The total probable error in the final Bouguer Gravity data, ebg, is calculated using: (from Appendix F)
ebg2=eg
2 + egt2 + (c*eh)
2
where
eg is the error in the observed gravity
egt is the error in the theoretical gravity value used
eh is the error in the elevation value
c=(3.08768-2p?G)
where G=6.67x10⁻⁸ (dyne cm2)/g Universal Gravity Constant
?=2.67 g/cc
c=1.967 µms-2/metre
From preceding sections
eg = 0. 21 x 0.707 = 0.1485 µms-2
eh = 0.040 x 0.707 = 0.0283 metres
egt = 0.0081 sin(2 x latitude) µms-2/metre x northing error
= 0.001 µms-2
It follows that the probable Bouguer error for the survey
ebg2 = 0.14852 + 0.0012 + (0.0283 x 1.967)2
ebg = 0.15 µms-2
Fugro Ground Geophysics GRAVITY LOGISTICS REPORT August 2005 18
5. DATA PRODUCTS
5.1 FIELD DATA PRODUCTS
Preliminary field data was sent during the survey and upon completion of the field work to GA. Data
was sent in the form of located TIFF images with a weekly report on operations and survey progress.
5.2 FINAL DATA PRODUCTS
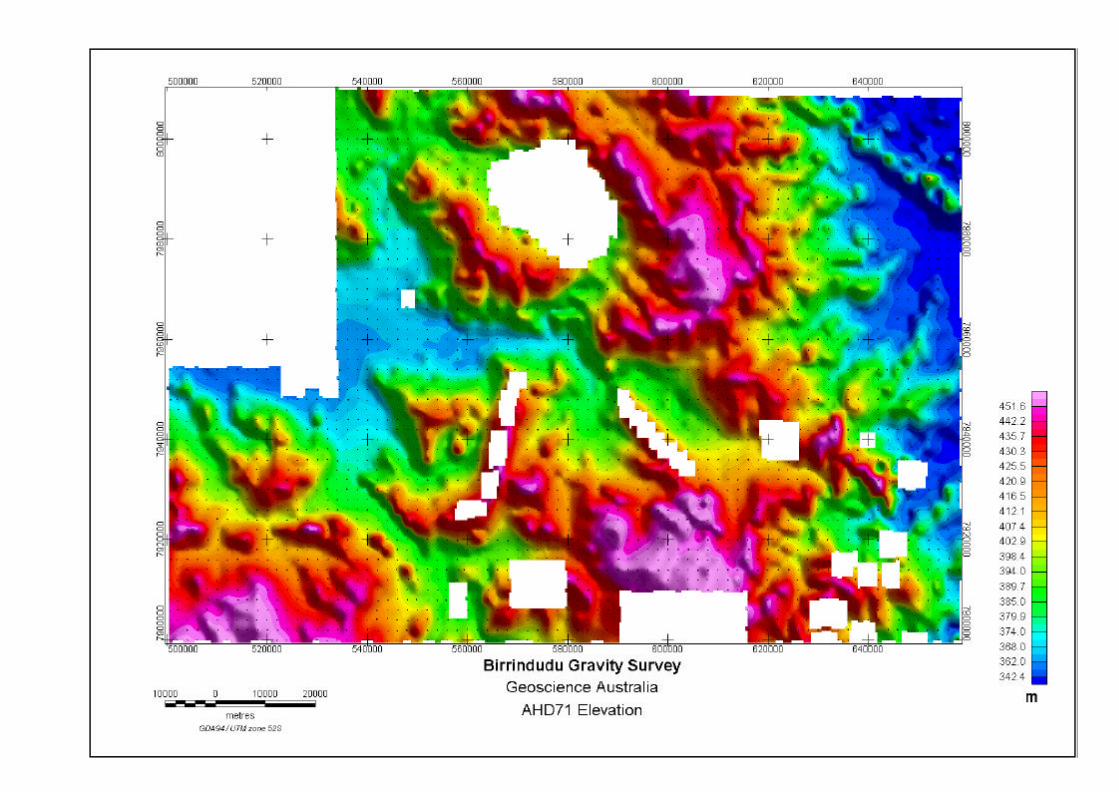
Verification images of terrain corrected Bouguer Gravity at a density of 2.67gm/cc as well as a map of
AHD elevation can be found in Appendix G. Final digital data is contained on a CD appended to this
report.
5.2.1 Final Data Format
The final data is supplied in a ASEG-GDF format including definition and projection files. All horizontal
coordinate data has been supplied in GDA94, elevation data in AHD71 and gravity data in µms-2 on
the AFGN (Isogal84). Bouguer Gravity data have been terrain corrected.
For and on behalf of Fugro Ground Geophysics
Peter Johnson
Operations Manager
Fugro Ground Geophysics
Fugro Ground Geophysics GRAVITY LOGISTICS REPORT July 2005
APPENDIX A
GRAVITY LOOP STATISTICS
Fugro Ground Geophysics GRAVITY LOGISTICS REPORT July 2005
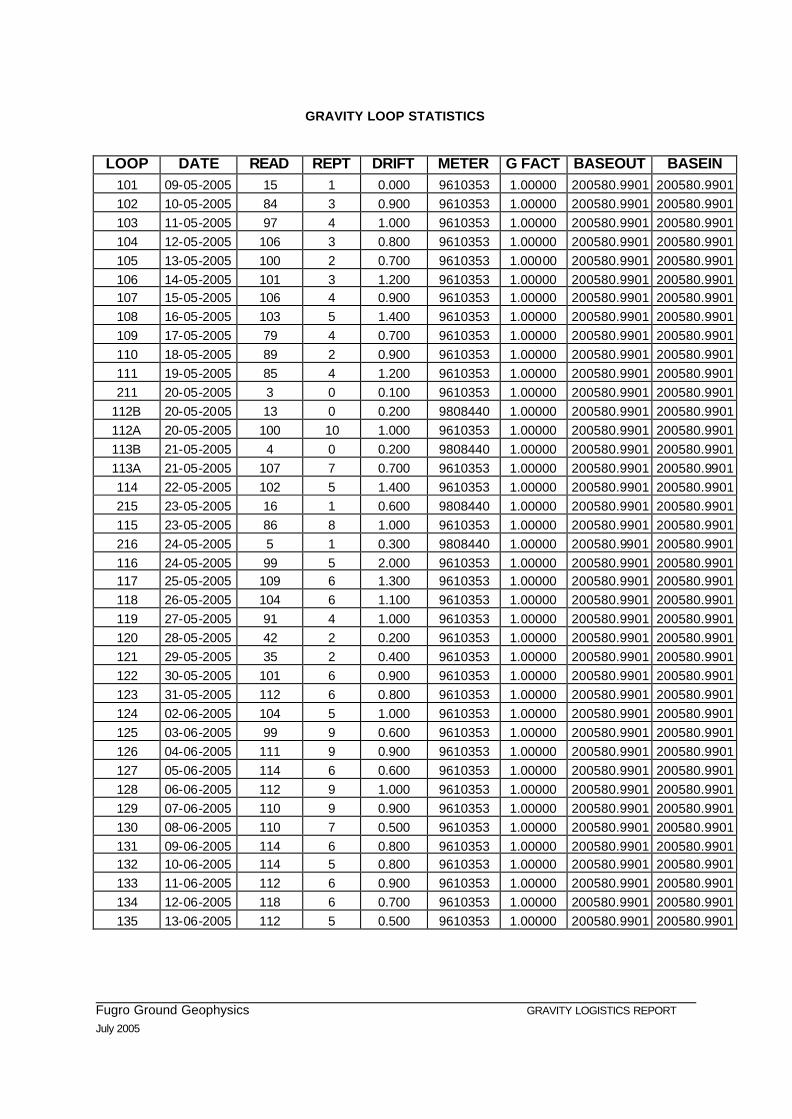
GRAVITY LOOP STATISTICS
LOOP DATE READ REPT DRIFT METER G FACT BASEOUT BASEIN 101 09-05-2005 15 1 0.000 9610353 1.00000 200580.9901 200580.9901 102 10-05-2005 84 3 0.900 9610353 1.00000 200580.9901 200580.9901 103 11-05-2005 97 4 1.000 9610353 1.00000 200580.9901 200580.9901 104 12-05-2005 106 3 0.800 9610353 1.00000 200580.9901 200580.9901 105 13-05-2005 100 2 0.700 9610353 1.00000 200580.9901 200580.9901 106 14-05-2005 101 3 1.200 9610353 1.00000 200580.9901 200580.9901 107 15-05-2005 106 4 0.900 9610353 1.00000 200580.9901 200580.9901 108 16-05-2005 103 5 1.400 9610353 1.00000 200580.9901 200580.9901 109 17-05-2005 79 4 0.700 9610353 1.00000 200580.9901 200580.9901 110 18-05-2005 89 2 0.900 9610353 1.00000 200580.9901 200580.9901 111 19-05-2005 85 4 1.200 9610353 1.00000 200580.9901 200580.9901 211 20-05-2005 3 0 0.100 9610353 1.00000 200580.9901 200580.9901
112B 20-05-2005 13 0 0.200 9808440 1.00000 200580.9901 200580.9901 112A 20-05-2005 100 10 1.000 9610353 1.00000 200580.9901 200580.9901 113B 21-05-2005 4 0 0.200 9808440 1.00000 200580.9901 200580.9901 113A 21-05-2005 107 7 0.700 9610353 1.00000 200580.9901 200580.9901 114 22-05-2005 102 5 1.400 9610353 1.00000 200580.9901 200580.9901 215 23-05-2005 16 1 0.600 9808440 1.00000 200580.9901 200580.9901 115 23-05-2005 86 8 1.000 9610353 1.00000 200580.9901 200580.9901 216 24-05-2005 5 1 0.300 9808440 1.00000 200580.9901 200580.9901 116 24-05-2005 99 5 2.000 9610353 1.00000 200580.9901 200580.9901 117 25-05-2005 109 6 1.300 9610353 1.00000 200580.9901 200580.9901 118 26-05-2005 104 6 1.100 9610353 1.00000 200580.9901 200580.9901 119 27-05-2005 91 4 1.000 9610353 1.00000 200580.9901 200580.9901 120 28-05-2005 42 2 0.200 9610353 1.00000 200580.9901 200580.9901 121 29-05-2005 35 2 0.400 9610353 1.00000 200580.9901 200580.9901 122 30-05-2005 101 6 0.900 9610353 1.00000 200580.9901 200580.9901 123 31-05-2005 112 6 0.800 9610353 1.00000 200580.9901 200580.9901 124 02-06-2005 104 5 1.000 9610353 1.00000 200580.9901 200580.9901 125 03-06-2005 99 9 0.600 9610353 1.00000 200580.9901 200580.9901 126 04-06-2005 111 9 0.900 9610353 1.00000 200580.9901 200580.9901 127 05-06-2005 114 6 0.600 9610353 1.00000 200580.9901 200580.9901 128 06-06-2005 112 9 1.000 9610353 1.00000 200580.9901 200580.9901 129 07-06-2005 110 9 0.900 9610353 1.00000 200580.9901 200580.9901 130 08-06-2005 110 7 0.500 9610353 1.00000 200580.9901 200580.9901 131 09-06-2005 114 6 0.800 9610353 1.00000 200580.9901 200580.9901 132 10-06-2005 114 5 0.800 9610353 1.00000 200580.9901 200580.9901 133 11-06-2005 112 6 0.900 9610353 1.00000 200580.9901 200580.9901 134 12-06-2005 118 6 0.700 9610353 1.00000 200580.9901 200580.9901 135 13-06-2005 112 5 0.500 9610353 1.00000 200580.9901 200580.9901

Fugro Ground Geophysics GRAVITY LOGISTICS REPORT July 2005
LOOP DATE READ REPT DRIFT METER G FACT BASEOUT BASEIN 136 14-06-2005 96 7 0.400 9610353 1.00000 200580.9901 200580.9901 137 15-06-2005 108 8 0.800 9610353 1.00000 200580.9901 200580.9901 138 16-06-2005 106 5 0.100 9610353 1.00000 200580.9901 200580.9901 139 17-06-2005 120 7 0.500 9610353 1.00000 200580.9901 200580.9901 140 18-06-2005 100 9 0.500 9610353 1.00000 200580.9901 200580.9901
Notes: 1. Loop number is in format cdd where c is crew number, dd is day number 2. DATE is date of loop acquisition in format dd-mm-yyyy 3. READ is number of stations observed within the loop 4. REPT is number of repeats contained within the loop 5. DRIFT is total meter drift for the loop in µms-2 6. METER is the gravity meter serial number used to observe loop 7. G-FACTOR is calibration constant for loop meter (1.00000 for CG-3) 8. BASEOUT / BASEIN are loop gravity base station used (morning / afternoon) 9. All loops have a minimum 1 repeat reading. Those in the table above which show 0 have
been reported in other loops

Fugro Ground Geophysics GRAVITY LOGISTICS REPORT July 2005
APPENDIX B
SURVEY METADATA

Fugro Ground Geophysics GRAVITY LOGISTICS REPORT July 2005
Name: Birrindudu Gravity Survey
Start Date: May 9, 2005
End Date: June 18, 2005
Operators: Geoscience Australia & Northern Territory Geological Survey
Contractor: Fugro Ground Geophysics Pty Ltd
Processors: Gregory Kunda & Ray Lockwood
Software: PNAV (GPS post processing), GRAVI (GPS/Gravity data file
merging and manipulation, and terrain corrections), Geosoft
Oasis Montaj (imaging / flight planning)
Vessel Type: Helicopter – Robinson R44
Geodetic Datum: Geocentric Datum of Australia 1994
Projection: Map Grid of Australia (Zone 52)
Horizontal Accuracy: < 0.1m
Location Method: real time GPS (non-corrected)
Gravity Station Spacing Minimum: nominal 2km x 2km
Gravity Station Spacing Maximum: nominal 2km x 2km
Gravity Stations: 3728
Elevation Accuracy: < 0.1m
Elevation Datum: AHD71
Gravity Accuracy: < 0.5µms-2
Gravity Datum: IGSN71
Terrain Correction: using in-house software (based on using prisms to
approximate terrain and compute terrain effect)
Computation Method:
Layout: combination traverse & cell centre method
Equipment Details: Ashtech Z-Surveyors: s/n UZ01196, UZ01197, UZ01198,
UZ02540, UZ01097
Ashtech Z-12: s/n 04998, 02272
Scintrex CG-3/M Gravity Meters: s/n 9610353, 9808440,
9002133, 9507283
Gravity Observers: Gregory Kunda, Keith Clinton & Laurie Murphy
Fundamental Gravity: Halls Creek Airport Terminal – 6491.0129
Base Station Ties: A – B – A; Completed on 13/05/05 & 23/06/05 using 4 gravity
meters
Any Other Information:
Fugro Ground Geophysics GRAVITY LOGISTICS REPORT July 2005
APPENDIX C
GRAVITY METER CALIBRATION RANGE RESULTS
Notes:
1. Calibration range testing was completed between GA stations 7391.0217 (Mt Gungin) and 8090.0317 (Weir Pumping Station)
2. All values shown are differences only in gravity between the range stations (not observed gravity values) in µms-2
Fugro Ground Geophysics GRAVITY LOGISTICS REPORT July 2005
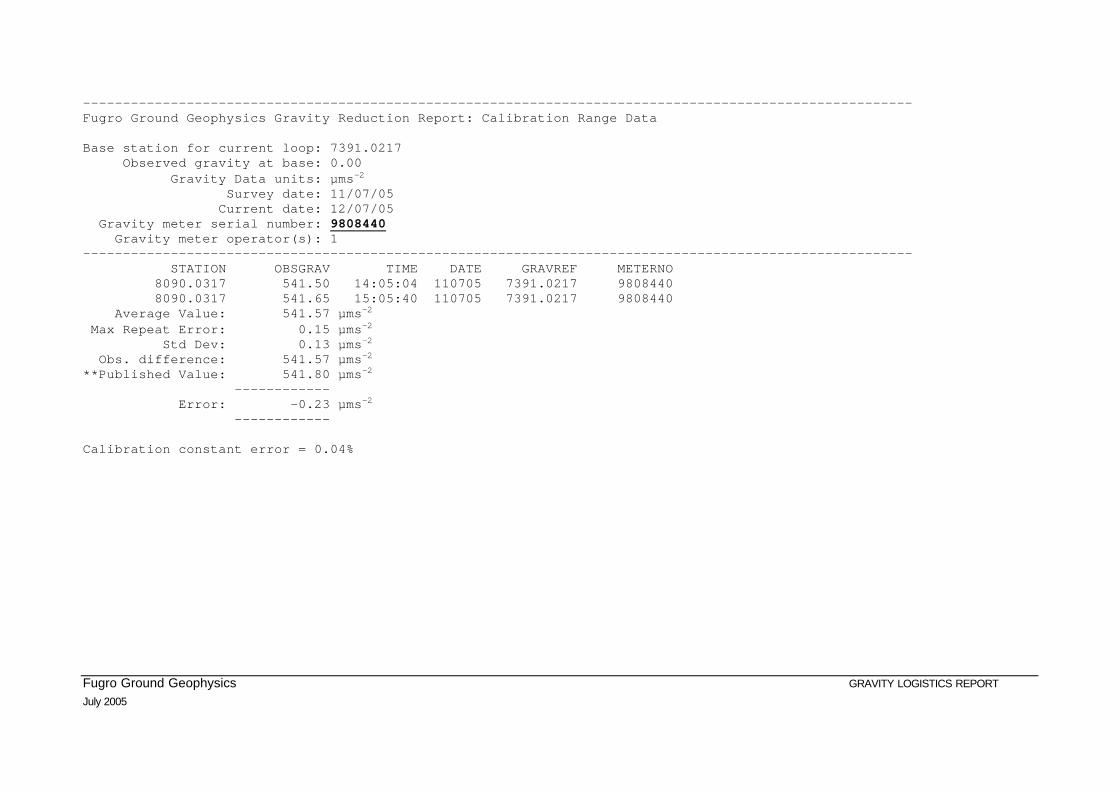
-------------------------------------------------------------------------------------------------------- Fugro Ground Geophysics Gravity Reduction Report: Calibration Range Data Base station for current loop: 7391.0217 Observed gravity at base: 0.00 Gravity Data units: µms-2 Survey date: 11/07/05 Current date: 12/07/05 Gravity meter serial number: 9808440 Gravity meter operator(s): 1 -------------------------------------------------------------------------------------------------------- STATION OBSGRAV TIME DATE GRAVREF METERNO 8090.0317 541.50 14:05:04 110705 7391.0217 9808440 8090.0317 541.65 15:05:40 110705 7391.0217 9808440 Average Value: 541.57 µms-2 Max Repeat Error: 0.15 µms-2 Std Dev: 0.13 µms-2 Obs. difference: 541.57 µms-2 **Published Value: 541.80 µms-2 ------------ Error: -0.23 µms-2 ------------ Calibration constant error = 0.04%
Fugro Ground Geophysics GRAVITY LOGISTICS REPORT July 2005
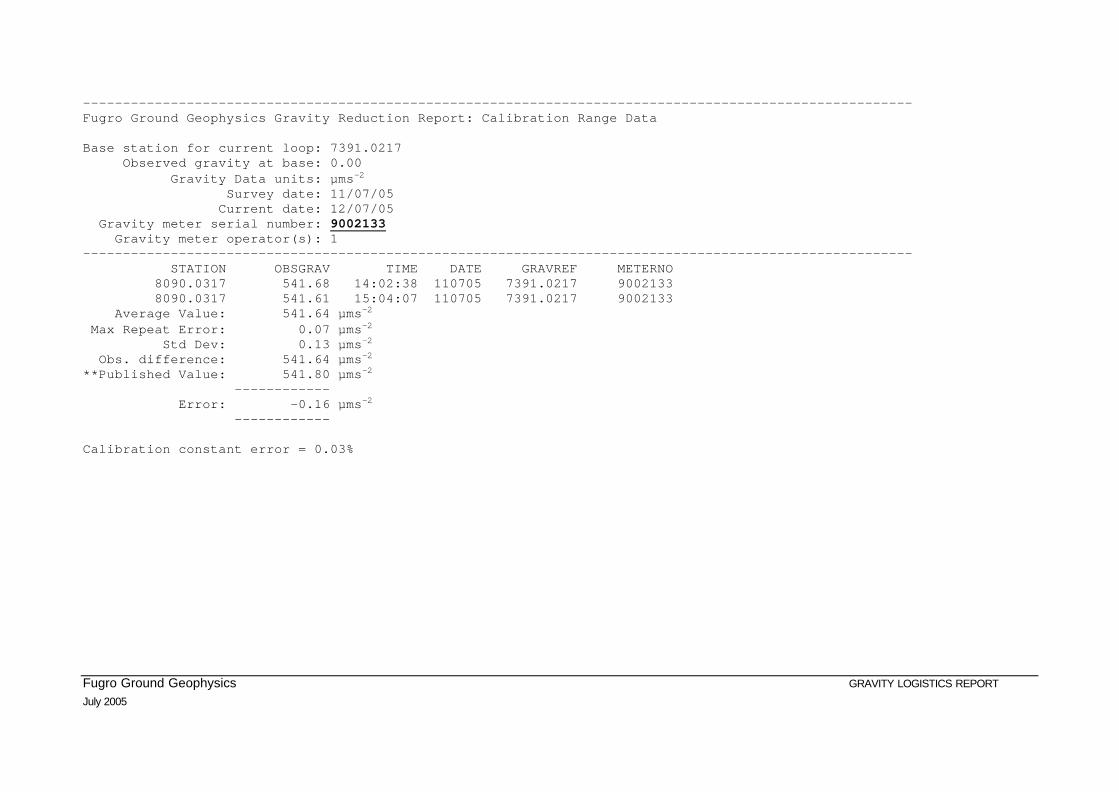
-------------------------------------------------------------------------------------------------------- Fugro Ground Geophysics Gravity Reduction Report: Calibration Range Data Base station for current loop: 7391.0217 Observed gravity at base: 0.00 Gravity Data units: µms-2 Survey date: 11/07/05 Current date: 12/07/05 Gravity meter serial number: 9002133 Gravity meter operator(s): 1 -------------------------------------------------------------------------------------------------------- STATION OBSGRAV TIME DATE GRAVREF METERNO 8090.0317 541.68 14:02:38 110705 7391.0217 9002133 8090.0317 541.61 15:04:07 110705 7391.0217 9002133 Average Value: 541.64 µms-2 Max Repeat Error: 0.07 µms-2 Std Dev: 0.13 µms-2 Obs. difference: 541.64 µms-2 **Published Value: 541.80 µms-2 ------------ Error: -0.16 µms-2 ------------ Calibration constant error = 0.03%

Fugro Ground Geophysics GRAVITY LOGISTICS REPORT July 2005
-------------------------------------------------------------------------------------------------------- Fugro Ground Geophysics Gravity Reduction Report: Calibration Range Data Base station for current loop: 7391.0217 Observed gravity at base: 0.00 Gravity Data units: µms-2 Survey date: 11/07/05 Current date: 12/07/05 Gravity meter serial number: 9507283 Gravity meter operator(s): 1 -------------------------------------------------------------------------------------------------------- STATION OBSGRAV TIME DATE GRAVREF METERNO 8090.0317 541.88 14:02:35 110705 7391.0217 9507283 8090.0317 541.82 15:04:21 110705 7391.0217 9507283 Average Value: 541.85 µms-2 Max Repeat Error: 0.06 µms-2 Std Dev: 0.00 µms-2 Obs. difference: 541.85 µms-2 **Published Value: 541.80 µms-2 ------------ Error: 0.05 µms-2 ------------ Calibration constant error = 0.01%

Fugro Ground Geophysics GRAVITY LOGISTICS REPORT July 2005
-------------------------------------------------------------------------------------------------------- Fugro Ground Geophysics Gravity Reduction Report: Calibration Range Data Base station for current loop: 7391.0217 Observed gravity at base: 0.00 Gravity Data units: µms-2 Survey date: 11/07/05 Current date: 12/07/05 Gravity meter serial number: 9610353 Gravity meter operator(s): 1 -------------------------------------------------------------------------------------------------------- STATION OBSGRAV TIME DATE GRAVREF METERNO 8090.0317 541.64 14:02:18 110705 7391.0217 9610353 8090.0317 541.79 15:03:40 110705 7391.0217 9610353 Average Value: 541.72 µms-2 Max Repeat Error: 0.15 µms-2 Std Dev: 0.13 µms-2 Obs. difference: 541.72 µms-2 **Published Value: 541.80 µms-2 ------------ Error: -0.08 µms-2 ------------ Calibration constant error = 0.01%

Fugro Ground Geophysics GRAVITY LOGISTICS REPORT July 2005
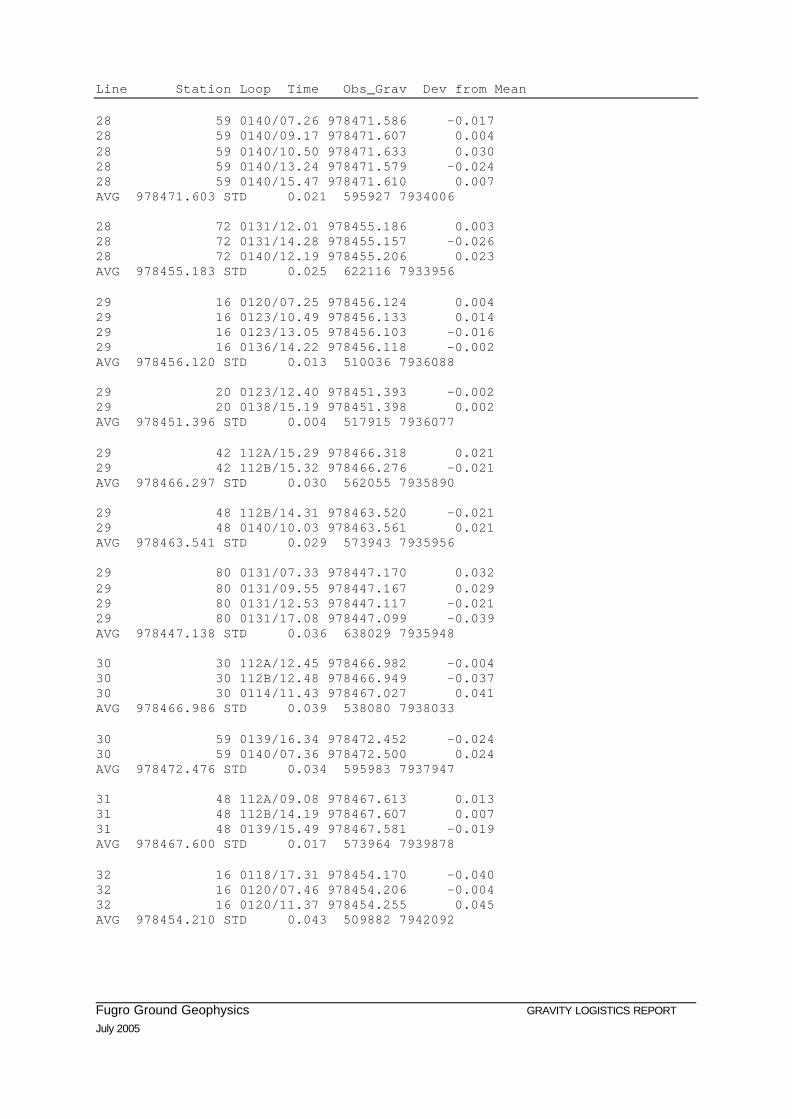
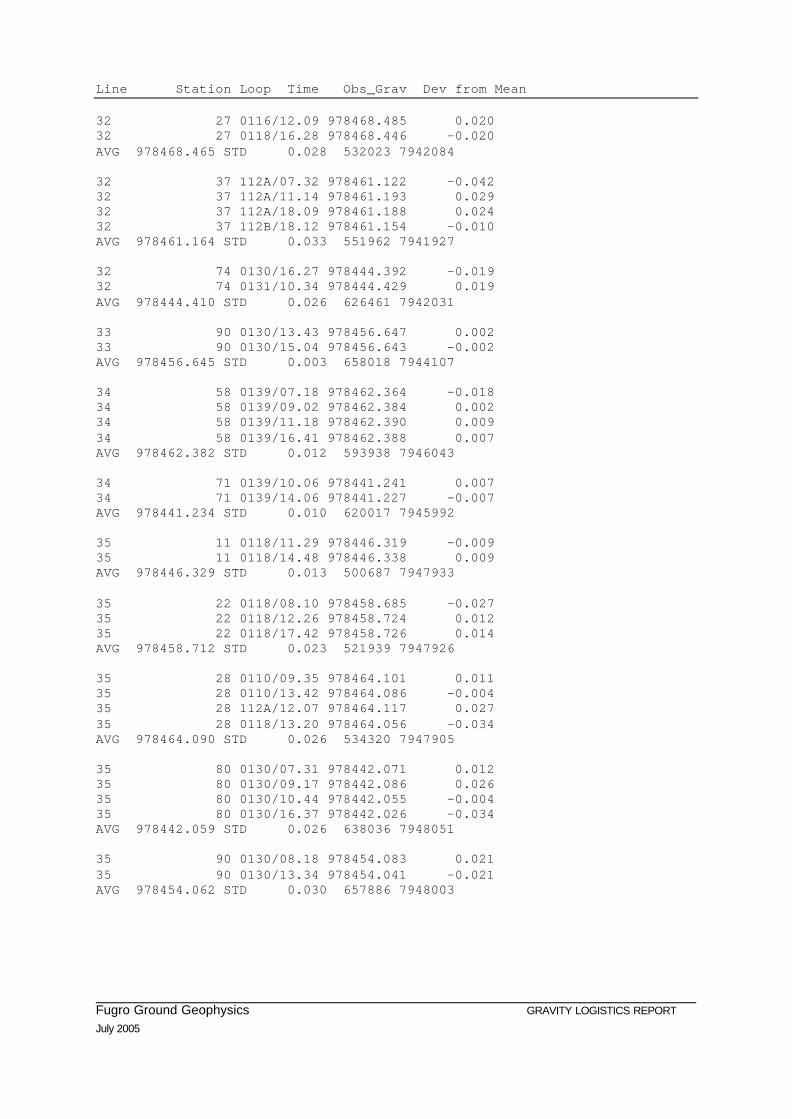
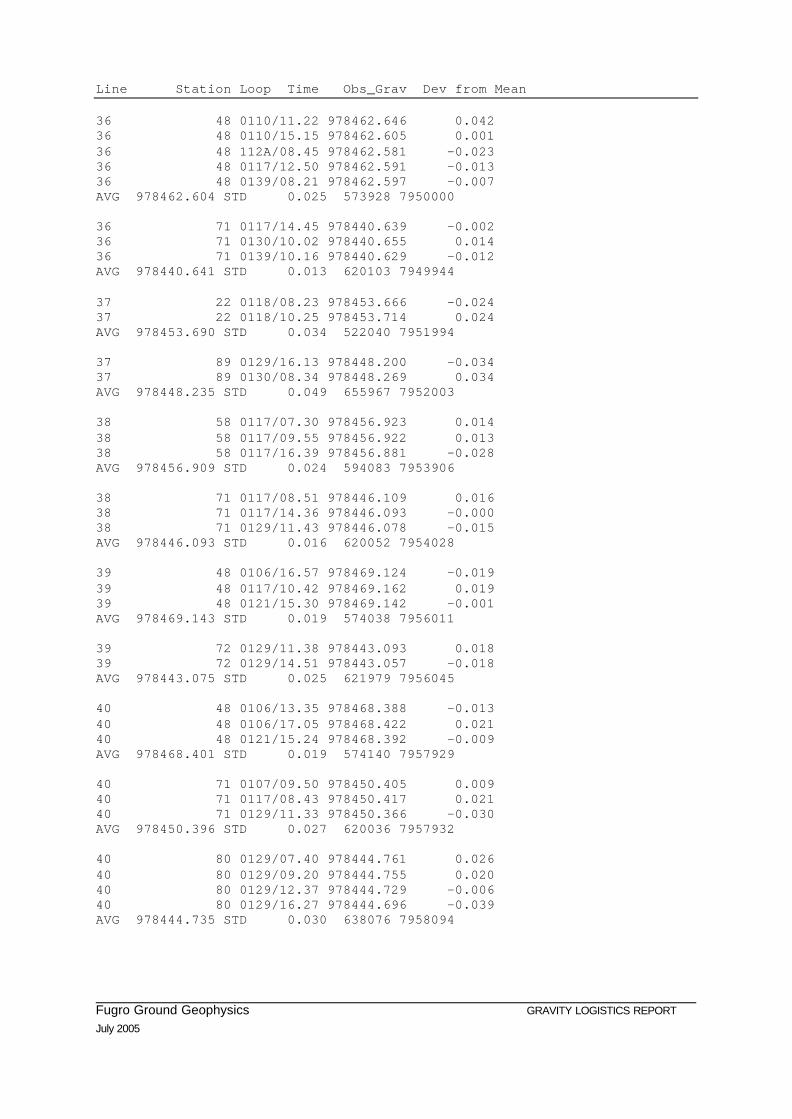
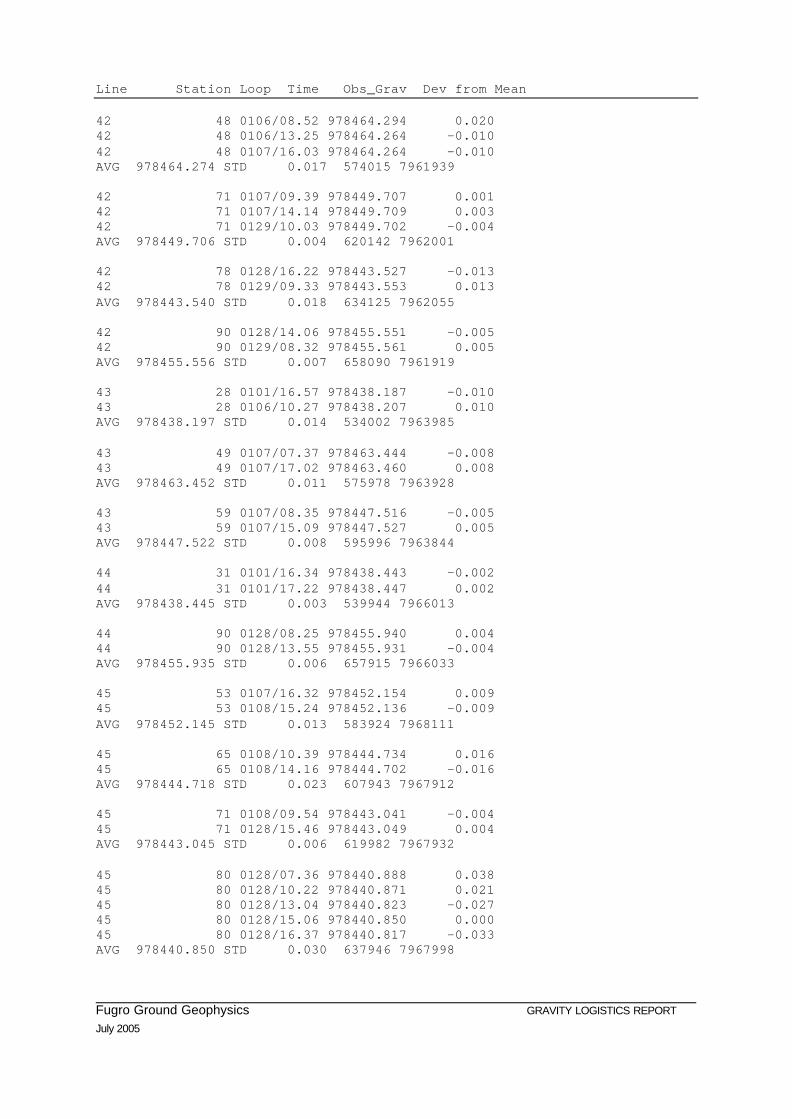
APPENDIX D
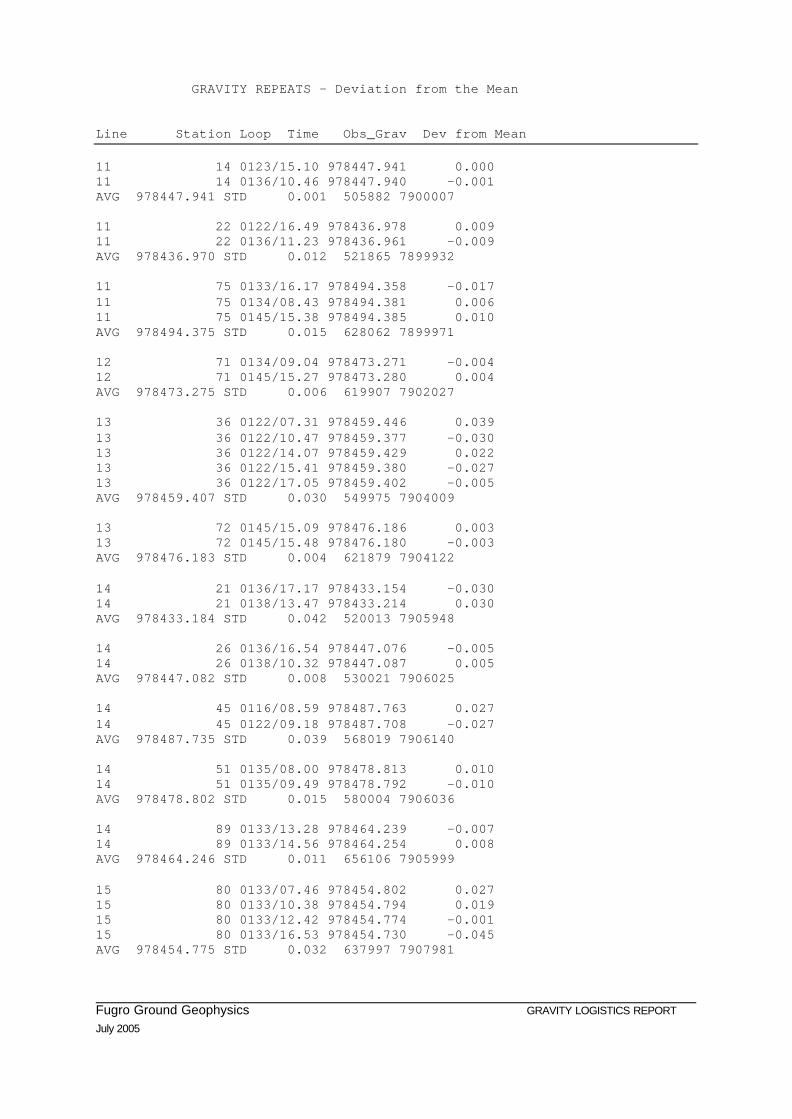
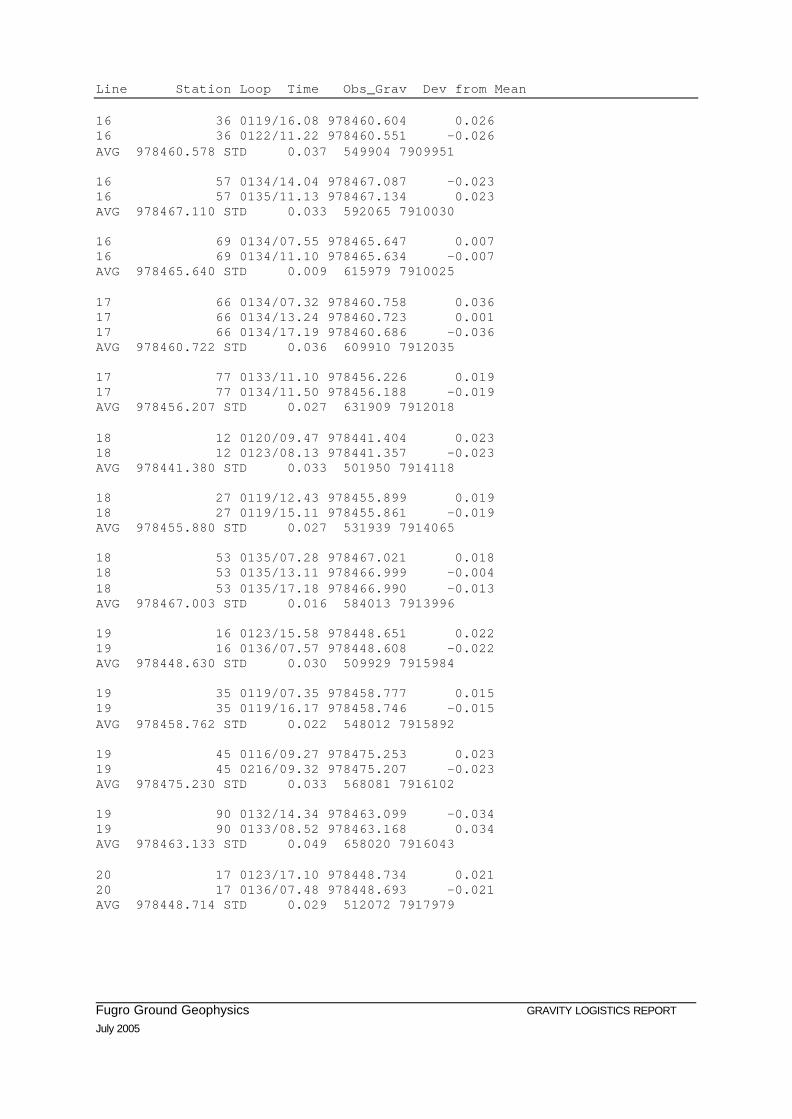
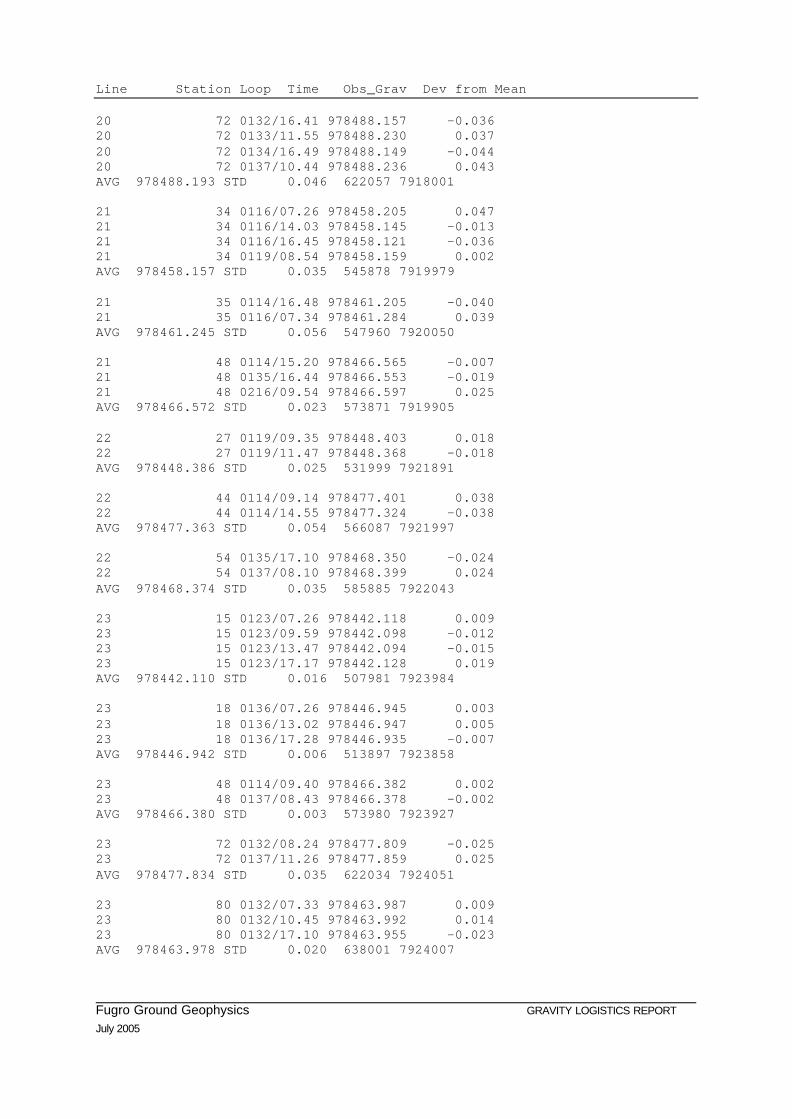
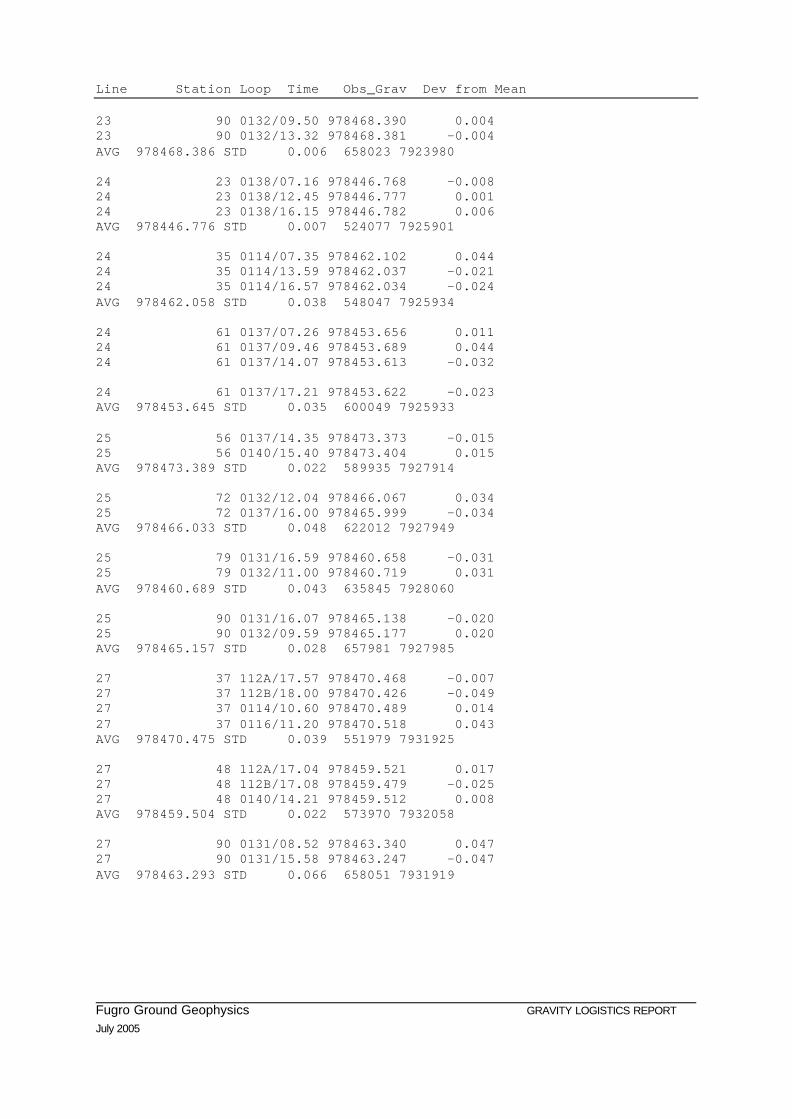
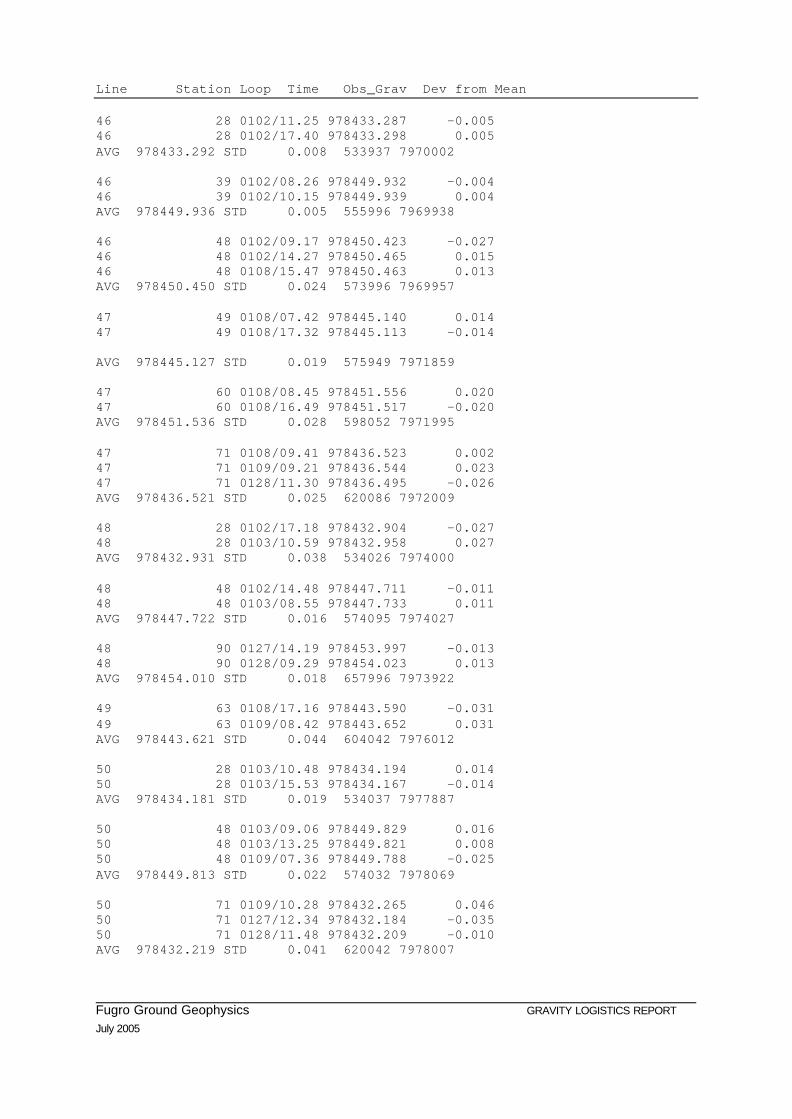
GRAVITY REPEAT STATION LISTING
Notes:
1. Listing is based on line/station identifiers. To convert to GA number format add line & station together with prefix “200580.” (ie line 44, station 30 is 200580.4430)
2. Loop is in the format CCDD where CC is crew number and DD is survey day number (day number is a serial day count since the start of the survey with day 1 being Monday, 09/05/05)
3. All gravity data is in milligals 4. Deviation from mean is the standard deviation of all readings taken
at the station
Fugro Ground Geophysics GRAVITY LOGISTICS REPORT July 2005
GRAVITY REPEATS - Deviation from the Mean Line Station Loop Time Obs_Grav Dev from Mean 11 14 0123/15.10 978447.941 0.000 11 14 0136/10.46 978447.940 -0.001 AVG 978447.941 STD 0.001 505882 7900007 11 22 0122/16.49 978436.978 0.009 11 22 0136/11.23 978436.961 -0.009 AVG 978436.970 STD 0.012 521865 7899932 11 75 0133/16.17 978494.358 -0.017 11 75 0134/08.43 978494.381 0.006 11 75 0145/15.38 978494.385 0.010 AVG 978494.375 STD 0.015 628062 7899971 12 71 0134/09.04 978473.271 -0.004 12 71 0145/15.27 978473.280 0.004 AVG 978473.275 STD 0.006 619907 7902027 13 36 0122/07.31 978459.446 0.039 13 36 0122/10.47 978459.377 -0.030 13 36 0122/14.07 978459.429 0.022 13 36 0122/15.41 978459.380 -0.027 13 36 0122/17.05 978459.402 -0.005 AVG 978459.407 STD 0.030 549975 7904009 13 72 0145/15.09 978476.186 0.003 13 72 0145/15.48 978476.180 -0.003 AVG 978476.183 STD 0.004 621879 7904122 14 21 0136/17.17 978433.154 -0.030 14 21 0138/13.47 978433.214 0.030 AVG 978433.184 STD 0.042 520013 7905948 14 26 0136/16.54 978447.076 -0.005 14 26 0138/10.32 978447.087 0.005 AVG 978447.082 STD 0.008 530021 7906025 14 45 0116/08.59 978487.763 0.027 14 45 0122/09.18 978487.708 -0.027 AVG 978487.735 STD 0.039 568019 7906140 14 51 0135/08.00 978478.813 0.010 14 51 0135/09.49 978478.792 -0.010 AVG 978478.802 STD 0.015 580004 7906036 14 89 0133/13.28 978464.239 -0.007 14 89 0133/14.56 978464.254 0.008 AVG 978464.246 STD 0.011 656106 7905999 15 80 0133/07.46 978454.802 0.027 15 80 0133/10.38 978454.794 0.019 15 80 0133/12.42 978454.774 -0.001 15 80 0133/16.53 978454.730 -0.045 AVG 978454.775 STD 0.032 637997 7907981
Fugro Ground Geophysics GRAVITY LOGISTICS REPORT July 2005
Line Station Loop Time Obs_Grav Dev from Mean 16 36 0119/16.08 978460.604 0.026 16 36 0122/11.22 978460.551 -0.026 AVG 978460.578 STD 0.037 549904 7909951 16 57 0134/14.04 978467.087 -0.023 16 57 0135/11.13 978467.134 0.023 AVG 978467.110 STD 0.033 592065 7910030 16 69 0134/07.55 978465.647 0.007 16 69 0134/11.10 978465.634 -0.007 AVG 978465.640 STD 0.009 615979 7910025 17 66 0134/07.32 978460.758 0.036 17 66 0134/13.24 978460.723 0.001 17 66 0134/17.19 978460.686 -0.036 AVG 978460.722 STD 0.036 609910 7912035 17 77 0133/11.10 978456.226 0.019 17 77 0134/11.50 978456.188 -0.019 AVG 978456.207 STD 0.027 631909 7912018 18 12 0120/09.47 978441.404 0.023 18 12 0123/08.13 978441.357 -0.023 AVG 978441.380 STD 0.033 501950 7914118 18 27 0119/12.43 978455.899 0.019 18 27 0119/15.11 978455.861 -0.019 AVG 978455.880 STD 0.027 531939 7914065 18 53 0135/07.28 978467.021 0.018 18 53 0135/13.11 978466.999 -0.004 18 53 0135/17.18 978466.990 -0.013 AVG 978467.003 STD 0.016 584013 7913996 19 16 0123/15.58 978448.651 0.022 19 16 0136/07.57 978448.608 -0.022 AVG 978448.630 STD 0.030 509929 7915984 19 35 0119/07.35 978458.777 0.015 19 35 0119/16.17 978458.746 -0.015 AVG 978458.762 STD 0.022 548012 7915892 19 45 0116/09.27 978475.253 0.023 19 45 0216/09.32 978475.207 -0.023 AVG 978475.230 STD 0.033 568081 7916102 19 90 0132/14.34 978463.099 -0.034 19 90 0133/08.52 978463.168 0.034 AVG 978463.133 STD 0.049 658020 7916043 20 17 0123/17.10 978448.734 0.021 20 17 0136/07.48 978448.693 -0.021 AVG 978448.714 STD 0.029 512072 7917979
Fugro Ground Geophysics GRAVITY LOGISTICS REPORT July 2005
Line Station Loop Time Obs_Grav Dev from Mean 20 72 0132/16.41 978488.157 -0.036 20 72 0133/11.55 978488.230 0.037 20 72 0134/16.49 978488.149 -0.044 20 72 0137/10.44 978488.236 0.043 AVG 978488.193 STD 0.046 622057 7918001 21 34 0116/07.26 978458.205 0.047 21 34 0116/14.03 978458.145 -0.013 21 34 0116/16.45 978458.121 -0.036 21 34 0119/08.54 978458.159 0.002 AVG 978458.157 STD 0.035 545878 7919979 21 35 0114/16.48 978461.205 -0.040 21 35 0116/07.34 978461.284 0.039 AVG 978461.245 STD 0.056 547960 7920050 21 48 0114/15.20 978466.565 -0.007 21 48 0135/16.44 978466.553 -0.019 21 48 0216/09.54 978466.597 0.025 AVG 978466.572 STD 0.023 573871 7919905 22 27 0119/09.35 978448.403 0.018 22 27 0119/11.47 978448.368 -0.018 AVG 978448.386 STD 0.025 531999 7921891 22 44 0114/09.14 978477.401 0.038 22 44 0114/14.55 978477.324 -0.038 AVG 978477.363 STD 0.054 566087 7921997 22 54 0135/17.10 978468.350 -0.024 22 54 0137/08.10 978468.399 0.024 AVG 978468.374 STD 0.035 585885 7922043 23 15 0123/07.26 978442.118 0.009 23 15 0123/09.59 978442.098 -0.012 23 15 0123/13.47 978442.094 -0.015 23 15 0123/17.17 978442.128 0.019 AVG 978442.110 STD 0.016 507981 7923984 23 18 0136/07.26 978446.945 0.003 23 18 0136/13.02 978446.947 0.005 23 18 0136/17.28 978446.935 -0.007 AVG 978446.942 STD 0.006 513897 7923858 23 48 0114/09.40 978466.382 0.002 23 48 0137/08.43 978466.378 -0.002 AVG 978466.380 STD 0.003 573980 7923927 23 72 0132/08.24 978477.809 -0.025 23 72 0137/11.26 978477.859 0.025 AVG 978477.834 STD 0.035 622034 7924051 23 80 0132/07.33 978463.987 0.009 23 80 0132/10.45 978463.992 0.014 23 80 0132/17.10 978463.955 -0.023 AVG 978463.978 STD 0.020 638001 7924007
Fugro Ground Geophysics GRAVITY LOGISTICS REPORT July 2005
Line Station Loop Time Obs_Grav Dev from Mean 23 90 0132/09.50 978468.390 0.004 23 90 0132/13.32 978468.381 -0.004 AVG 978468.386 STD 0.006 658023 7923980 24 23 0138/07.16 978446.768 -0.008 24 23 0138/12.45 978446.777 0.001 24 23 0138/16.15 978446.782 0.006 AVG 978446.776 STD 0.007 524077 7925901 24 35 0114/07.35 978462.102 0.044 24 35 0114/13.59 978462.037 -0.021 24 35 0114/16.57 978462.034 -0.024 AVG 978462.058 STD 0.038 548047 7925934 24 61 0137/07.26 978453.656 0.011 24 61 0137/09.46 978453.689 0.044 24 61 0137/14.07 978453.613 -0.032 24 61 0137/17.21 978453.622 -0.023 AVG 978453.645 STD 0.035 600049 7925933 25 56 0137/14.35 978473.373 -0.015 25 56 0140/15.40 978473.404 0.015 AVG 978473.389 STD 0.022 589935 7927914 25 72 0132/12.04 978466.067 0.034 25 72 0137/16.00 978465.999 -0.034 AVG 978466.033 STD 0.048 622012 7927949 25 79 0131/16.59 978460.658 -0.031 25 79 0132/11.00 978460.719 0.031 AVG 978460.689 STD 0.043 635845 7928060 25 90 0131/16.07 978465.138 -0.020 25 90 0132/09.59 978465.177 0.020 AVG 978465.157 STD 0.028 657981 7927985 27 37 112A/17.57 978470.468 -0.007 27 37 112B/18.00 978470.426 -0.049 27 37 0114/10.60 978470.489 0.014 27 37 0116/11.20 978470.518 0.043 AVG 978470.475 STD 0.039 551979 7931925 27 48 112A/17.04 978459.521 0.017 27 48 112B/17.08 978459.479 -0.025 27 48 0140/14.21 978459.512 0.008 AVG 978459.504 STD 0.022 573970 7932058 27 90 0131/08.52 978463.340 0.047 27 90 0131/15.58 978463.247 -0.047 AVG 978463.293 STD 0.066 658051 7931919
Fugro Ground Geophysics GRAVITY LOGISTICS REPORT July 2005
Line Station Loop Time Obs_Grav Dev from Mean 28 59 0140/07.26 978471.586 -0.017 28 59 0140/09.17 978471.607 0.004 28 59 0140/10.50 978471.633 0.030 28 59 0140/13.24 978471.579 -0.024 28 59 0140/15.47 978471.610 0.007 AVG 978471.603 STD 0.021 595927 7934006 28 72 0131/12.01 978455.186 0.003 28 72 0131/14.28 978455.157 -0.026 28 72 0140/12.19 978455.206 0.023 AVG 978455.183 STD 0.025 622116 7933956 29 16 0120/07.25 978456.124 0.004 29 16 0123/10.49 978456.133 0.014 29 16 0123/13.05 978456.103 -0.016 29 16 0136/14.22 978456.118 -0.002 AVG 978456.120 STD 0.013 510036 7936088 29 20 0123/12.40 978451.393 -0.002 29 20 0138/15.19 978451.398 0.002 AVG 978451.396 STD 0.004 517915 7936077 29 42 112A/15.29 978466.318 0.021 29 42 112B/15.32 978466.276 -0.021 AVG 978466.297 STD 0.030 562055 7935890 29 48 112B/14.31 978463.520 -0.021 29 48 0140/10.03 978463.561 0.021 AVG 978463.541 STD 0.029 573943 7935956 29 80 0131/07.33 978447.170 0.032 29 80 0131/09.55 978447.167 0.029 29 80 0131/12.53 978447.117 -0.021 29 80 0131/17.08 978447.099 -0.039 AVG 978447.138 STD 0.036 638029 7935948 30 30 112A/12.45 978466.982 -0.004 30 30 112B/12.48 978466.949 -0.037 30 30 0114/11.43 978467.027 0.041 AVG 978466.986 STD 0.039 538080 7938033 30 59 0139/16.34 978472.452 -0.024 30 59 0140/07.36 978472.500 0.024 AVG 978472.476 STD 0.034 595983 7937947 31 48 112A/09.08 978467.613 0.013 31 48 112B/14.19 978467.607 0.007 31 48 0139/15.49 978467.581 -0.019 AVG 978467.600 STD 0.017 573964 7939878 32 16 0118/17.31 978454.170 -0.040 32 16 0120/07.46 978454.206 -0.004 32 16 0120/11.37 978454.255 0.045 AVG 978454.210 STD 0.043 509882 7942092
Fugro Ground Geophysics GRAVITY LOGISTICS REPORT July 2005
Line Station Loop Time Obs_Grav Dev from Mean 32 27 0116/12.09 978468.485 0.020 32 27 0118/16.28 978468.446 -0.020 AVG 978468.465 STD 0.028 532023 7942084 32 37 112A/07.32 978461.122 -0.042 32 37 112A/11.14 978461.193 0.029 32 37 112A/18.09 978461.188 0.024 32 37 112B/18.12 978461.154 -0.010 AVG 978461.164 STD 0.033 551962 7941927 32 74 0130/16.27 978444.392 -0.019 32 74 0131/10.34 978444.429 0.019 AVG 978444.410 STD 0.026 626461 7942031 33 90 0130/13.43 978456.647 0.002 33 90 0130/15.04 978456.643 -0.002 AVG 978456.645 STD 0.003 658018 7944107 34 58 0139/07.18 978462.364 -0.018 34 58 0139/09.02 978462.384 0.002 34 58 0139/11.18 978462.390 0.009 34 58 0139/16.41 978462.388 0.007 AVG 978462.382 STD 0.012 593938 7946043 34 71 0139/10.06 978441.241 0.007 34 71 0139/14.06 978441.227 -0.007 AVG 978441.234 STD 0.010 620017 7945992 35 11 0118/11.29 978446.319 -0.009 35 11 0118/14.48 978446.338 0.009 AVG 978446.329 STD 0.013 500687 7947933 35 22 0118/08.10 978458.685 -0.027 35 22 0118/12.26 978458.724 0.012 35 22 0118/17.42 978458.726 0.014 AVG 978458.712 STD 0.023 521939 7947926 35 28 0110/09.35 978464.101 0.011 35 28 0110/13.42 978464.086 -0.004 35 28 112A/12.07 978464.117 0.027 35 28 0118/13.20 978464.056 -0.034 AVG 978464.090 STD 0.026 534320 7947905 35 80 0130/07.31 978442.071 0.012 35 80 0130/09.17 978442.086 0.026 35 80 0130/10.44 978442.055 -0.004 35 80 0130/16.37 978442.026 -0.034 AVG 978442.059 STD 0.026 638036 7948051 35 90 0130/08.18 978454.083 0.021 35 90 0130/13.34 978454.041 -0.021 AVG 978454.062 STD 0.030 657886 7948003
Fugro Ground Geophysics GRAVITY LOGISTICS REPORT July 2005
Line Station Loop Time Obs_Grav Dev from Mean 36 48 0110/11.22 978462.646 0.042 36 48 0110/15.15 978462.605 0.001 36 48 112A/08.45 978462.581 -0.023 36 48 0117/12.50 978462.591 -0.013 36 48 0139/08.21 978462.597 -0.007 AVG 978462.604 STD 0.025 573928 7950000 36 71 0117/14.45 978440.639 -0.002 36 71 0130/10.02 978440.655 0.014 36 71 0139/10.16 978440.629 -0.012 AVG 978440.641 STD 0.013 620103 7949944 37 22 0118/08.23 978453.666 -0.024 37 22 0118/10.25 978453.714 0.024 AVG 978453.690 STD 0.034 522040 7951994 37 89 0129/16.13 978448.200 -0.034 37 89 0130/08.34 978448.269 0.034 AVG 978448.235 STD 0.049 655967 7952003 38 58 0117/07.30 978456.923 0.014 38 58 0117/09.55 978456.922 0.013 38 58 0117/16.39 978456.881 -0.028 AVG 978456.909 STD 0.024 594083 7953906 38 71 0117/08.51 978446.109 0.016 38 71 0117/14.36 978446.093 -0.000 38 71 0129/11.43 978446.078 -0.015 AVG 978446.093 STD 0.016 620052 7954028 39 48 0106/16.57 978469.124 -0.019 39 48 0117/10.42 978469.162 0.019 39 48 0121/15.30 978469.142 -0.001 AVG 978469.143 STD 0.019 574038 7956011 39 72 0129/11.38 978443.093 0.018 39 72 0129/14.51 978443.057 -0.018 AVG 978443.075 STD 0.025 621979 7956045 40 48 0106/13.35 978468.388 -0.013 40 48 0106/17.05 978468.422 0.021 40 48 0121/15.24 978468.392 -0.009 AVG 978468.401 STD 0.019 574140 7957929 40 71 0107/09.50 978450.405 0.009 40 71 0117/08.43 978450.417 0.021 40 71 0129/11.33 978450.366 -0.030 AVG 978450.396 STD 0.027 620036 7957932 40 80 0129/07.40 978444.761 0.026 40 80 0129/09.20 978444.755 0.020 40 80 0129/12.37 978444.729 -0.006 40 80 0129/16.27 978444.696 -0.039 AVG 978444.735 STD 0.030 638076 7958094
Fugro Ground Geophysics GRAVITY LOGISTICS REPORT July 2005
Line Station Loop Time Obs_Grav Dev from Mean 42 48 0106/08.52 978464.294 0.020 42 48 0106/13.25 978464.264 -0.010 42 48 0107/16.03 978464.264 -0.010 AVG 978464.274 STD 0.017 574015 7961939 42 71 0107/09.39 978449.707 0.001 42 71 0107/14.14 978449.709 0.003 42 71 0129/10.03 978449.702 -0.004 AVG 978449.706 STD 0.004 620142 7962001 42 78 0128/16.22 978443.527 -0.013 42 78 0129/09.33 978443.553 0.013 AVG 978443.540 STD 0.018 634125 7962055 42 90 0128/14.06 978455.551 -0.005 42 90 0129/08.32 978455.561 0.005 AVG 978455.556 STD 0.007 658090 7961919 43 28 0101/16.57 978438.187 -0.010 43 28 0106/10.27 978438.207 0.010 AVG 978438.197 STD 0.014 534002 7963985 43 49 0107/07.37 978463.444 -0.008 43 49 0107/17.02 978463.460 0.008 AVG 978463.452 STD 0.011 575978 7963928 43 59 0107/08.35 978447.516 -0.005 43 59 0107/15.09 978447.527 0.005 AVG 978447.522 STD 0.008 595996 7963844 44 31 0101/16.34 978438.443 -0.002 44 31 0101/17.22 978438.447 0.002 AVG 978438.445 STD 0.003 539944 7966013 44 90 0128/08.25 978455.940 0.004 44 90 0128/13.55 978455.931 -0.004 AVG 978455.935 STD 0.006 657915 7966033 45 53 0107/16.32 978452.154 0.009 45 53 0108/15.24 978452.136 -0.009 AVG 978452.145 STD 0.013 583924 7968111 45 65 0108/10.39 978444.734 0.016 45 65 0108/14.16 978444.702 -0.016 AVG 978444.718 STD 0.023 607943 7967912 45 71 0108/09.54 978443.041 -0.004 45 71 0128/15.46 978443.049 0.004 AVG 978443.045 STD 0.006 619982 7967932 45 80 0128/07.36 978440.888 0.038 45 80 0128/10.22 978440.871 0.021 45 80 0128/13.04 978440.823 -0.027 45 80 0128/15.06 978440.850 0.000 45 80 0128/16.37 978440.817 -0.033 AVG 978440.850 STD 0.030 637946 7967998
Fugro Ground Geophysics GRAVITY LOGISTICS REPORT July 2005
Line Station Loop Time Obs_Grav Dev from Mean 46 28 0102/11.25 978433.287 -0.005 46 28 0102/17.40 978433.298 0.005 AVG 978433.292 STD 0.008 533937 7970002 46 39 0102/08.26 978449.932 -0.004 46 39 0102/10.15 978449.939 0.004 AVG 978449.936 STD 0.005 555996 7969938 46 48 0102/09.17 978450.423 -0.027 46 48 0102/14.27 978450.465 0.015 46 48 0108/15.47 978450.463 0.013 AVG 978450.450 STD 0.024 573996 7969957 47 49 0108/07.42 978445.140 0.014 47 49 0108/17.32 978445.113 -0.014 AVG 978445.127 STD 0.019 575949 7971859 47 60 0108/08.45 978451.556 0.020 47 60 0108/16.49 978451.517 -0.020 AVG 978451.536 STD 0.028 598052 7971995 47 71 0108/09.41 978436.523 0.002 47 71 0109/09.21 978436.544 0.023 47 71 0128/11.30 978436.495 -0.026 AVG 978436.521 STD 0.025 620086 7972009 48 28 0102/17.18 978432.904 -0.027 48 28 0103/10.59 978432.958 0.027 AVG 978432.931 STD 0.038 534026 7974000 48 48 0102/14.48 978447.711 -0.011 48 48 0103/08.55 978447.733 0.011 AVG 978447.722 STD 0.016 574095 7974027 48 90 0127/14.19 978453.997 -0.013 48 90 0128/09.29 978454.023 0.013 AVG 978454.010 STD 0.018 657996 7973922 49 63 0108/17.16 978443.590 -0.031 49 63 0109/08.42 978443.652 0.031 AVG 978443.621 STD 0.044 604042 7976012 50 28 0103/10.48 978434.194 0.014 50 28 0103/15.53 978434.167 -0.014 AVG 978434.181 STD 0.019 534037 7977887 50 48 0103/09.06 978449.829 0.016 50 48 0103/13.25 978449.821 0.008 50 48 0109/07.36 978449.788 -0.025 AVG 978449.813 STD 0.022 574032 7978069 50 71 0109/10.28 978432.265 0.046 50 71 0127/12.34 978432.184 -0.035 50 71 0128/11.48 978432.209 -0.010 AVG 978432.219 STD 0.041 620042 7978007

Fugro Ground Geophysics GRAVITY LOGISTICS REPORT July 2005
Line Station Loop Time Obs_Grav Dev from Mean 51 64 0109/11.07 978437.685 0.014 51 64 0109/13.08 978437.658 -0.014 AVG 978437.672 STD 0.019 606042 7979899 51 80 0127/07.43 978438.106 0.005 51 80 0127/10.13 978438.105 0.004 51 80 0127/13.22 978438.088 -0.013 51 80 0127/16.38 978438.105 0.004 AVG 978438.101 STD 0.009 638103 7979990 52 44 0103/14.04 978445.801 -0.007 52 44 0104/08.36 978445.814 0.007 AVG 978445.807 STD 0.009 566142 7982006 53 34 0104/07.36 978432.603 -0.020 53 34 0104/09.34 978432.642 0.020 AVG 978432.623 STD 0.028 546111 7984057 53 71 0109/13.54 978433.607 -0.014 53 71 0111/09.13 978433.628 0.007 53 71 0127/11.50 978433.627 0.006 AVG 978433.621 STD 0.012 620009 7984138 54 62 0111/08.15 978437.069 0.036 54 62 0111/11.28 978437.004 -0.029 54 62 0111/17.29 978437.025 -0.008 AVG 978437.033 STD 0.033 601902 7985907 54 71 0111/09.02 978431.606 0.023 54 71 0111/15.53 978431.567 -0.016 54 71 0126/15.55 978431.575 -0.008 AVG 978431.583 STD 0.021 619996 7985951 54 90 0126/14.17 978444.991 0.000 54 90 0127/08.39 978444.990 -0.001 AVG 978444.991 STD 0.001 658140 7986094 55 77 0126/13.06 978433.157 -0.002 55 77 0126/15.27 978433.161 0.002 AVG 978433.159 STD 0.003 631807 7988312 56 71 0111/16.03 978428.503 0.010 56 71 0126/12.27 978428.482 -0.010 AVG 978428.492 STD 0.015 620023 7989970 56 90 0126/10.08 978447.323 0.020 56 90 0126/14.07 978447.283 -0.020 AVG 978447.303 STD 0.028 657942 7989813 57 67 0111/17.13 978425.127 -0.031 57 67 0115/08.20 978425.189 0.031 AVG 978425.158 STD 0.044 611953 7992035 57 80 0126/07.55 978440.180 0.028 57 80 0126/10.55 978440.146 -0.006 57 80 0126/17.12 978440.129 -0.023 AVG 978440.152 STD 0.026 637972 7992065

Fugro Ground Geophysics GRAVITY LOGISTICS REPORT July 2005
Line Station Loop Time Obs_Grav Dev from Mean 58 37 0104/13.49 978435.968 -0.004 58 37 0104/15.35 978435.975 0.004 AVG 978435.971 STD 0.005 552060 7994056 58 53 113A/15.23 978430.705 -0.019 58 53 0115/11.03 978430.742 0.019 AVG 978430.723 STD 0.026 584383 7994652 58 71 0115/08.43 978428.648 0.008 58 71 0126/11.50 978428.633 -0.007 AVG 978428.640 STD 0.011 619984 7993993 58 90 0125/15.20 978449.823 -0.026 58 90 0126/09.56 978449.876 0.026 AVG 978449.850 STD 0.037 658159 7993909 59 38 0104/17.24 978437.885 -0.012 59 38 0105/09.47 978437.908 0.012 AVG 978437.897 STD 0.016 554070 7996000 59 63 0115/07.51 978435.539 -0.020 59 63 0115/10.05 978435.579 0.020 AVG 978435.559 STD 0.028 604036 7996102 59 74 0125/12.35 978430.690 -0.025 59 74 0126/08.36 978430.741 0.025 AVG 978430.715 STD 0.036 625914 7995997 60 63 0115/07.44 978433.320 -0.014 60 63 0115/13.50 978433.352 0.018 60 63 0215/17.20 978433.331 -0.003 AVG 978433.334 STD 0.016 604093 7997971 60 71 0115/09.23 978421.011 0.017 60 71 0115/14.47 978420.978 -0.016 60 71 0125/11.58 978420.994 -0.000 AVG 978420.994 STD 0.017 620003 7998039 61 49 0105/08.39 978439.187 -0.019 61 49 113A/08.10 978439.215 0.009 61 49 113A/14.09 978439.217 0.011 AVG 978439.206 STD 0.017 576123 8000111 61 55 113A/16.40 978437.466 -0.010 61 55 0115/13.03 978437.489 0.013 61 55 0115/16.46 978437.504 0.027 61 55 0215/16.43 978437.447 -0.030 AVG 978437.476 STD 0.025 587943 8000009 61 73 0124/16.25 978424.677 -0.023 61 73 0125/11.43 978424.723 0.023 AVG 978424.700 STD 0.033 624039 8000056

Fugro Ground Geophysics GRAVITY LOGISTICS REPORT July 2005
Line Station Loop Time Obs_Grav Dev from Mean 61 81 0125/07.46 978442.389 0.013 61 81 0125/11.05 978442.405 0.029 61 81 0125/13.14 978442.354 -0.022 61 81 0125/16.20 978442.355 -0.021 AVG 978442.376 STD 0.025 639891 7999955 62 33 0105/12.59 978430.144 0.000 62 33 0105/15.11 978430.144 0.000 AVG 978430.144 STD 0.000 543899 8001857 62 71 0115/15.12 978423.658 0.018 62 71 0124/16.39 978423.623 -0.018 AVG 978423.640 STD 0.025 619983 8002017 62 82 0124/15.40 978445.628 -0.038 62 82 0125/10.60 978445.705 0.038 AVG 978445.667 STD 0.054 642081 8002078 63 38 0105/16.50 978436.755 -0.026 63 38 113A/10.11 978436.808 0.026 AVG 978436.782 STD 0.037 554034 8004127 63 45 113A/07.40 978433.647 0.011 63 45 113A/17.16 978433.616 -0.020 63 45 113B/17.22 978433.646 0.010 AVG 978433.636 STD 0.018 568026 8004126 63 68 0124/08.03 978425.122 0.027 63 68 0124/12.46 978425.097 0.002 63 68 0124/16.45 978425.066 -0.029 AVG 978425.095 STD 0.028 613984 8003996 63 71 0124/08.21 978425.040 0.026 63 71 0124/14.46 978424.987 -0.026 AVG 978425.014 STD 0.037 620080 8004084 63 90 0125/08.45 978454.339 -0.030 63 90 0125/10.18 978454.402 0.033 63 90 0125/14.06 978454.367 -0.002 AVG 978454.369 STD 0.032 657948 8003927 64 82 0124/13.56 978455.220 -0.004 64 82 0125/09.39 978455.229 0.004 AVG 978455.225 STD 0.006 642018 8006120 66 37 0105/16.25 978432.704 0.004 66 37 113A/12.45 978432.697 -0.004 AVG 978432.701 STD 0.005 551924 8009540 66 53 113A/15.60 978433.997 -0.046 66 53 113B/16.05 978434.089 0.046 AVG 978434.043 STD 0.065 583943 8009389 66 55 113A/17.04 978435.293 -0.016 66 55 0124/10.13 978435.326 0.016 AVG 978435.309 STD 0.023 587943 8009336

Fugro Ground Geophysics GRAVITY LOGISTICS REPORT July 2005
APPENDIX E
AFGN BASE 6491.0129 (HALLS CREEK) – STATION DESCRIPTION
Fugro Ground Geophysics GRAVITY LOGISTICS REPORT July 2005

Fugro Ground Geophysics GRAVITY LOGISTICS REPORT July 2005
APPENDIX F
STATISTICAL ANALYSIS AND ERROR CALCULATION
Fugro Ground Geophysics GRAVITY LOGISTICS REPORT July 2005
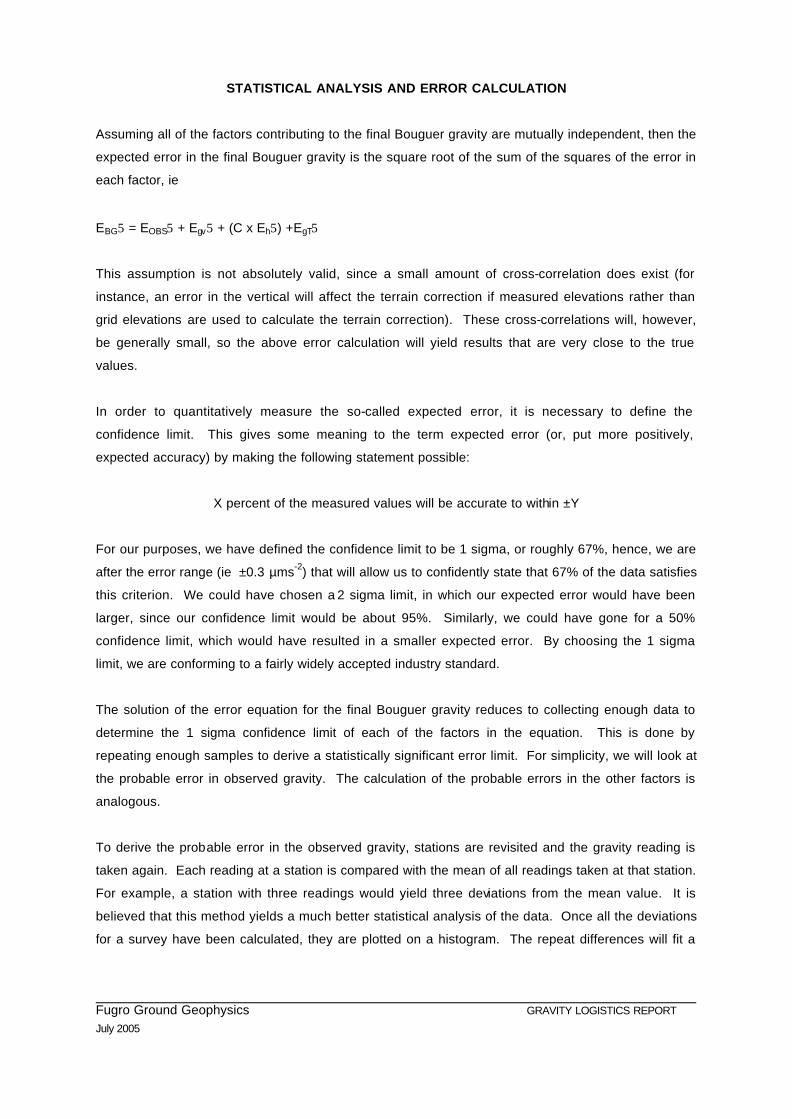
STATISTICAL ANALYSIS AND ERROR CALCULATION
Assuming all of the factors contributing to the final Bouguer gravity are mutually independent, then the
expected error in the final Bouguer gravity is the square root of the sum of the squares of the error in
each factor, ie
EBG5 = EOBS5 + Egv5 + (C x Eh5) +EgT5
This assumption is not absolutely valid, since a small amount of cross-correlation does exist (for
instance, an error in the vertical will affect the terrain correction if measured elevations rather than
grid elevations are used to calculate the terrain correction). These cross-correlations will, however,
be generally small, so the above error calculation will yield results that are very close to the true
values.
In order to quantitatively measure the so-called expected error, it is necessary to define the
confidence limit. This gives some meaning to the term expected error (or, put more positively,
expected accuracy) by making the following statement possible:
X percent of the measured values will be accurate to within ±Y
For our purposes, we have defined the confidence limit to be 1 sigma, or roughly 67%, hence, we are
after the error range (ie ±0.3 µms-2) that will allow us to confidently state that 67% of the data satisfies
this criterion. We could have chosen a 2 sigma limit, in which our expected error would have been
larger, since our confidence limit would be about 95%. Similarly, we could have gone for a 50%
confidence limit, which would have resulted in a smaller expected error. By choosing the 1 sigma
limit, we are conforming to a fairly widely accepted industry standard.
The solution of the error equation for the final Bouguer gravity reduces to collecting enough data to
determine the 1 sigma confidence limit of each of the factors in the equation. This is done by
repeating enough samples to derive a statistically significant error limit. For simplicity, we will look at
the probable error in observed gravity. The calculation of the probable errors in the other factors is
analogous.
To derive the probable error in the observed gravity, stations are revisited and the gravity reading is
taken again. Each reading at a station is compared with the mean of all readings taken at that station.
For example, a station with three readings would yield three deviations from the mean value. It is
believed that this method yields a much better statistical analysis of the data. Once all the deviations
for a survey have been calculated, they are plotted on a histogram. The repeat differences will fit a
Fugro Ground Geophysics GRAVITY LOGISTICS REPORT July 2005
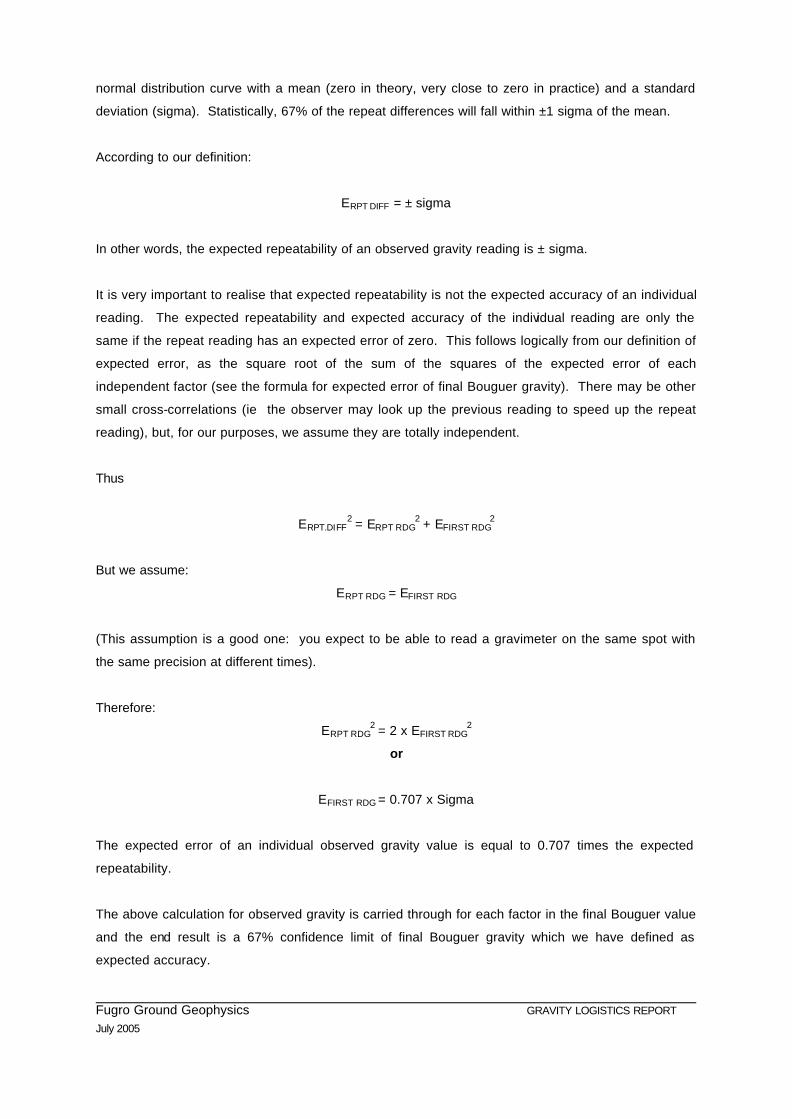
normal distribution curve with a mean (zero in theory, very close to zero in practice) and a standard
deviation (sigma). Statistically, 67% of the repeat differences will fall within ±1 sigma of the mean.
According to our definition:
ERPT DIFF = ± sigma
In other words, the expected repeatability of an observed gravity reading is ± sigma.
It is very important to realise that expected repeatability is not the expected accuracy of an individual
reading. The expected repeatability and expected accuracy of the individual reading are only the
same if the repeat reading has an expected error of zero. This follows logically from our definition of
expected error, as the square root of the sum of the squares of the expected error of each
independent factor (see the formula for expected error of final Bouguer gravity). There may be other
small cross-correlations (ie the observer may look up the previous reading to speed up the repeat
reading), but, for our purposes, we assume they are totally independent.
Thus
ERPT.DIFF2 = ERPT RDG
2 + EFIRST RDG2
But we assume:
ERPT RDG = EFIRST RDG
(This assumption is a good one: you expect to be able to read a gravimeter on the same spot with
the same precision at different times).
Therefore:
ERPT RDG2 = 2 x EFIRST RDG
2
or
EFIRST RDG = 0.707 x Sigma
The expected error of an individual observed gravity value is equal to 0.707 times the expected
repeatability.
The above calculation for observed gravity is carried through for each factor in the final Bouguer value
and the end result is a 67% confidence limit of final Bouguer gravity which we have defined as
expected accuracy.
Fugro Ground Geophysics GRAVITY LOGISTICS REPORT July 2005
APPENDIX G
VERIFICATION IMAGES

Top Related