


Languages
Pages
Legal

205
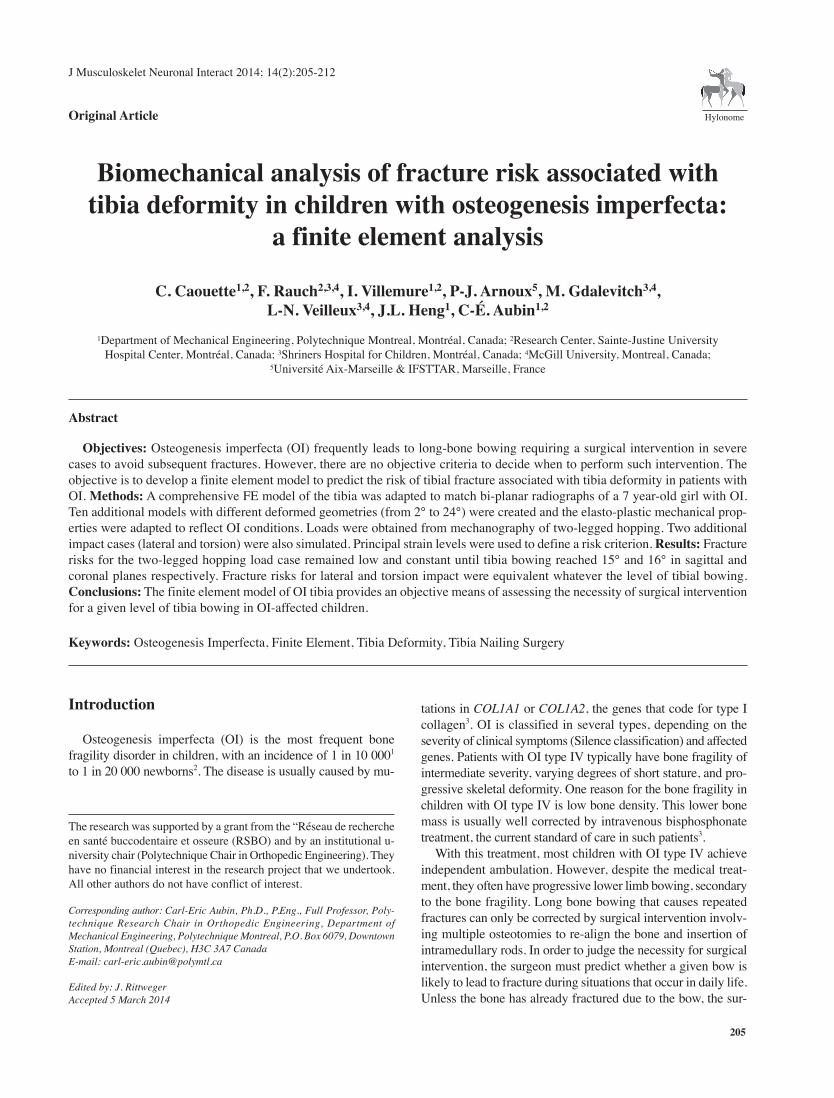
Introduction
Osteogenesis imperfecta (OI) is the most frequent bone
fragility disorder in children, with an incidence of 1 in 10 0001
to 1 in 20 000 newborns2. The disease is usually caused by mu-
tations in COL1A1 or COL1A2, the genes that code for type I
collagen3. OI is classified in several types, depending on the
severity of clinical symptoms (Silence classification) and affected
genes. Patients with OI type IV typically have bone fragility of
intermediate severity, varying degrees of short stature, and pro-
gressive skeletal deformity. One reason for the bone fragility in
children with OI type IV is low bone density. This lower bone
mass is usually well corrected by intravenous bisphosphonate
treatment, the current standard of care in such patients3.
With this treatment, most children with OI type IV achieve
independent ambulation. However, despite the medical treat-
ment, they often have progressive lower limb bowing, secondary
to the bone fragility. Long bone bowing that causes repeated
fractures can only be corrected by surgical intervention involv-
ing multiple osteotomies to re-align the bone and insertion of
intramedullary rods. In order to judge the necessity for surgical
intervention, the surgeon must predict whether a given bow is
likely to lead to fracture during situations that occur in daily life.
Unless the bone has already fractured due to the bow, the sur-
J Musculoskelet Neuronal Interact 2014; 14(2):205-212
Biomechanical analysis of fracture risk associated with tibia deformity in children with osteogenesis imperfecta:
a finite element analysis
C. Caouette1,2, F. Rauch2,3,4, I. Villemure1,2, P-J. Arnoux5, M. Gdalevitch3,4, L-N. Veilleux3,4, J.L. Heng1, C-É. Aubin1,2
1Department of Mechanical Engineering, Polytechnique Montreal, Montréal, Canada; 2Research Center, Sainte-Justine University
Hospital Center, Montréal, Canada; 3Shriners Hospital for Children, Montréal, Canada; 4McGill University, Montreal, Canada; 5Université Aix-Marseille & IFSTTAR, Marseille, France
Abstract
Objectives: Osteogenesis imperfecta (OI) frequently leads to long-bone bowing requiring a surgical intervention in severe
cases to avoid subsequent fractures. However, there are no objective criteria to decide when to perform such intervention. The
objective is to develop a finite element model to predict the risk of tibial fracture associated with tibia deformity in patients with
OI. Methods: A comprehensive FE model of the tibia was adapted to match bi-planar radiographs of a 7 year-old girl with OI.
Ten additional models with different deformed geometries (from 2° to 24°) were created and the elasto-plastic mechanical prop-
erties were adapted to reflect OI conditions. Loads were obtained from mechanography of two-legged hopping. Two additional
impact cases (lateral and torsion) were also simulated. Principal strain levels were used to define a risk criterion. Results: Fracture
risks for the two-legged hopping load case remained low and constant until tibia bowing reached 15° and 16° in sagittal and
coronal planes respectively. Fracture risks for lateral and torsion impact were equivalent whatever the level of tibial bowing.
Conclusions: The finite element model of OI tibia provides an objective means of assessing the necessity of surgical intervention
for a given level of tibia bowing in OI-affected children.
Keywords: Osteogenesis Imperfecta, Finite Element, Tibia Deformity, Tibia Nailing Surgery
Original Article Hylonome
The research was supported by a grant from the “Réseau de recherche
en santé buccodentaire et osseure (RSBO) and by an institutional u-
niversity chair (Polytechnique Chair in Orthopedic Engineering). They
have no financial interest in the research project that we undertook.
All other authors do not have conflict of interest.
Corresponding author: Carl-Eric Aubin, Ph.D., P.Eng., Full Professor, Poly-
technique Research Chair in Orthopedic Engineering, Department of
Mechanical Engineering, Polytechnique Montreal, P.O. Box 6079, Downtown
Station, Montreal (Quebec), H3C 3A7 Canada
E-mail: [email protected]
Edited by: J. Rittweger
Accepted 5 March 2014

C. Caouette et al.: Finite element analysis of OI deformed tibia
206
geon’s experience is essentially the only guide. Femoral bowing
is frequently treated surgically once it progresses to more than
20-30 degrees or when the patient has fractures. However, clin-
ical experience suggests that tibial bowing is better tolerated and
the degree of bow requiring surgical intervention is less clear.
Clinical decision-making could be put on a firmer basis if there
was a more objective way to assess the effect of bowing on a
bone’s capacity to withstand loading. The purpose of the present
study is to devise such a tool for tibial bowing.
Finite element analysis (FEA) is widely used in engineering
for the analysis of complex mechanical and/or geometrical
problems such as the present one4,5. FEA uses mesh generation
techniques to divide a structure into small subdivisions (“finite
elements”), thus allowing for the accurate representation of
complex geometries and the inclusion of heterogeneous ma-
terial properties. Several subject-specific models exist to eval-
uate fracture risks in the femoral neck for various loadings
such as walking and stumbling6-8. These models rely on CT-
scan exams for geometric reconstruction and use heteroge-
neous material properties (density, elasticity and strength)
distributions estimated from attenuation coefficient measure-
ment values of the CT-scan. Using these techniques, stresses
and strains can be estimated with good accuracy7. The maxi-
mal principal strain has been shown to be a good criterion to
determine risk of fracture as compared to stress-based criteria8.
Finite element models of the tibia have been used to evaluate
the types of loading (compression with bending, torsion) likely
to cause fractures in athletes9, to evaluate the effect of
varus/valgus misalignment on bone strains in the proximal
tibia after total knee arthroplasty10, or to predict the pattern of
fracture for a given load11. In certain cases, finite element mod-
els are better at predicting fracture than DXA or QCT exams12.
One published finite element model of the femur of an OI
patient13 featured a numerically deformed version of the stan-
dard femur model available for download through the Interna-
tional Society of Biomechanics mesh repository. Geometric
reconstruction of a patient’s femur was based on frontal plane
bowing evaluated from a single radiograph (sagittal bowing
was not evaluated). Bone elastic modulus was adapted to data
obtained from nanoindentation tests performed on pediatric OI
bone specimens14,15, and boundary conditions were based on
gait cinematic data of a subject with OI. The study concluded
that the particular femur that was investigated was not at risk
of fracture during walking. An equivalent model to assess the
effect of tibia curvatures on fracture risk has not been described.
Subject-specific finite element analyses of the lower limbs
are sensitive to the geometry of the bones16,17. The healthy
adult tibial bone has been shown in cadaveric studies to be op-
timized to carry compressive loading in its distal part (from 5
to 40% of its total height)18, and to resist the bending moment
created in the sagittal plane by an impact force delivered to its
distal extremity19. The effect of bowing on the tibia ability to
carry compressive loads has not been quantified. Numerous
finite element models have shown that cortical thickness is an
important parameter related to fracture risk in long bones4,20.
Cortical diaphysis of lower limb long bones from OI type IV
patients usually have reduced diameter and thinner cortex than
normal pediatric bones3. Treatment with bisphosphonates will
enhance cortical thickness, but will not correct bowing. The
biomechanical effect of this bowing and reduced cortical thick-
ness on fracture risk is not precisely known.
The objective of the current study is to develop a patient-
specific finite element model of the lower leg that is adapted
to OI bone. This model will be used to create a predictive frac-
ture model for patients with OI, and to assess the effect of tibial
bowing on fracture risk.
Materials and methods
Patient data
The patient whose radiographs served as a baseline for the
current study is a 7 year old girl with OI type IV due to a
Figure 1. Mesh and thickness distribution in the model, with localization of pQCT slices (posterior, lateral, anterior and medial views).
C. Caouette et al.: Finite element analysis of OI deformed tibia
207
COL1A1 mutation, who had undergone bilateral in-
tramedullary rodding to correct bowing in the femurs two
years previously. She has also received bisphosphonate treat-
ment at regular intervals to increase her bone density. Cali-
brated lateral and frontal radiographs of the right tibia were
taken using the low-dose EOS system (EOS imaging, Paris)
during a routine follow-up visit. Peripheral quantitative com-
puted tomography (pQCT) slices were taken at 4%, 14% and
38% of tibial height (see Figure 1), as per standard protocol
for this technique21. The patient was also asked to hop on two
feet on a force platform22 to provide a personalized load case
that will be further detailed in the boundary conditions section.
Geometry reconstruction
The tibia mesh was obtained from a previously developed
comprehensive finite element model of the lower limb23. The
model was developed using the explicit finite element code
RADIOSS (Altair HyperWorks, Troy, Michigan, USA) and was
adapted to perform dynamic analysis. This mesh was made of
shell elements for cortical bone (1744 elements of 3.25 mm
length) and solid elements for trabecular bone (2232 elements
of 3 mm length) and was initially constructed from MRI images
(scanning step of 1 mm in joint parts and range of 5 to 10 mm
in other regions) of a healthy adult male (50th percentile). Con-
vergence of the mesh and its ability to properly simulate tibial
fracture due to impact loading was verified in a previous
study24. Shell thicknesses were adjusted based on the cortical
bone measured on this initial MRI. The model (mesh and shell
thicknesses) was first scaled at 55% to fit the height of the OI
pediatric patient (asymptomatic geometry). To reproduce the
tibial bowing found on the medio-lateral and antero-posterior
radiographs of the patient, a lateral force was applied to the tib-
ial shaft and the model was solved. This was repeated up until
the mesh matched the tibial shape on the radiographs (see Fig-
ure 2). The stresses were reinitialized to zero and this deformed
geometry was then used as the initial geometry in the OI model
(OI patient geometry). The same technique was applied to ob-
tain ten different levels of simulated bows (see Table 1) in the
tibia (OI geometries). Bowing in the anterior direction (coronal
plane) and medial direction (sagittal plane) was measured be-
tween lines drawn in the middle of proximal and distal epiph-
ysis on the patient radiographs, as per the current standard in
clinical practice. The combined angle and angle of the curvature
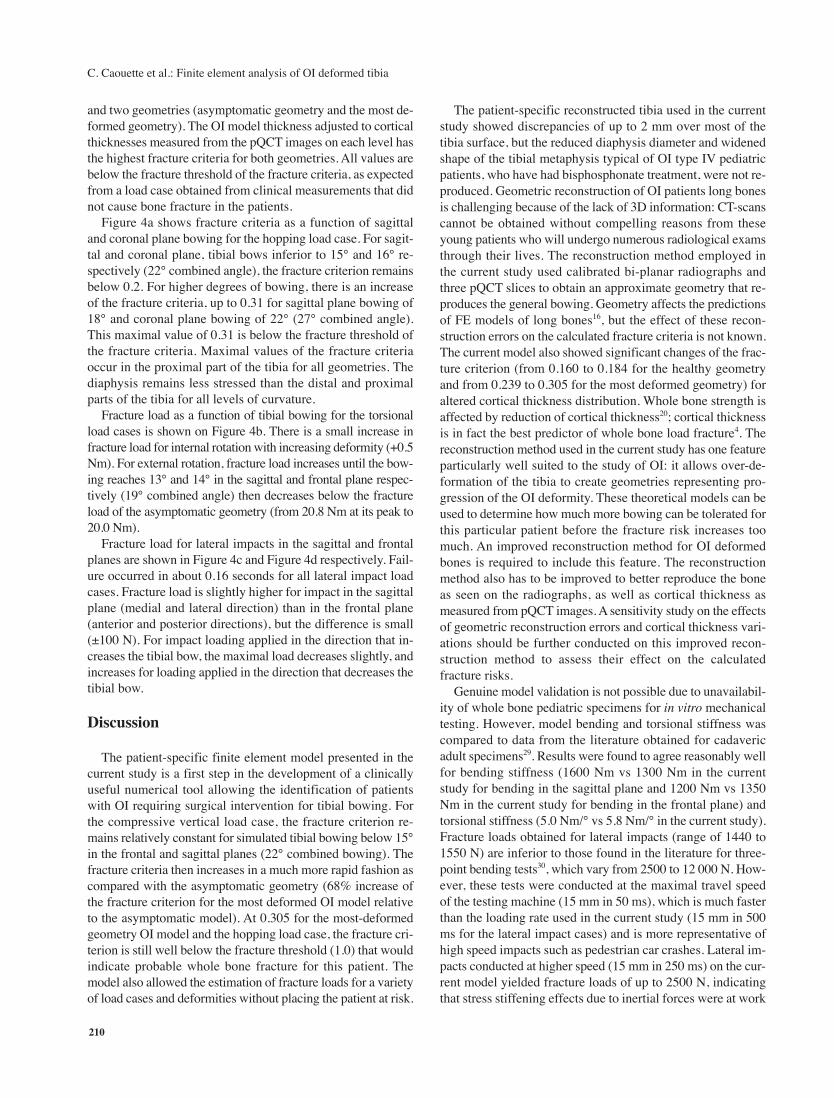
Model Sagittal plane bowing Coronal plane bowing Combined bowing angle (angle with respect to the
coronal plane)
0 (Asymptomatic geometry) 2.0° 8.0° 8.2° (46.8°)
1 (Actual Patient geometry) 11.8° 10.8° 15.8° (44.7°)
2 12.3° 12.2° 17.1° (45.0°)
3 13.2° 13.7° 18.7° (45.1°)
4 14.2° 15.3° 20.4° (45.3°)
5 15.3° 16.5° 22.0° (45.3°)
6 16.3° 18.2° 23.7° (45.5°)
7 16.8° 20.1° 25.4° (45.9°)
8 17.1° 21.4° 26.5° (46.1°)
9 17.7° 22.0° 27.2° (46.1°)
10 (Most deformed geometry simulated) 18.3° 24.2° 29.2° (46.5°)
Table 1. Deformation angles measured on the asymptomatic geometry, patient geometry and over-deformed geometries.
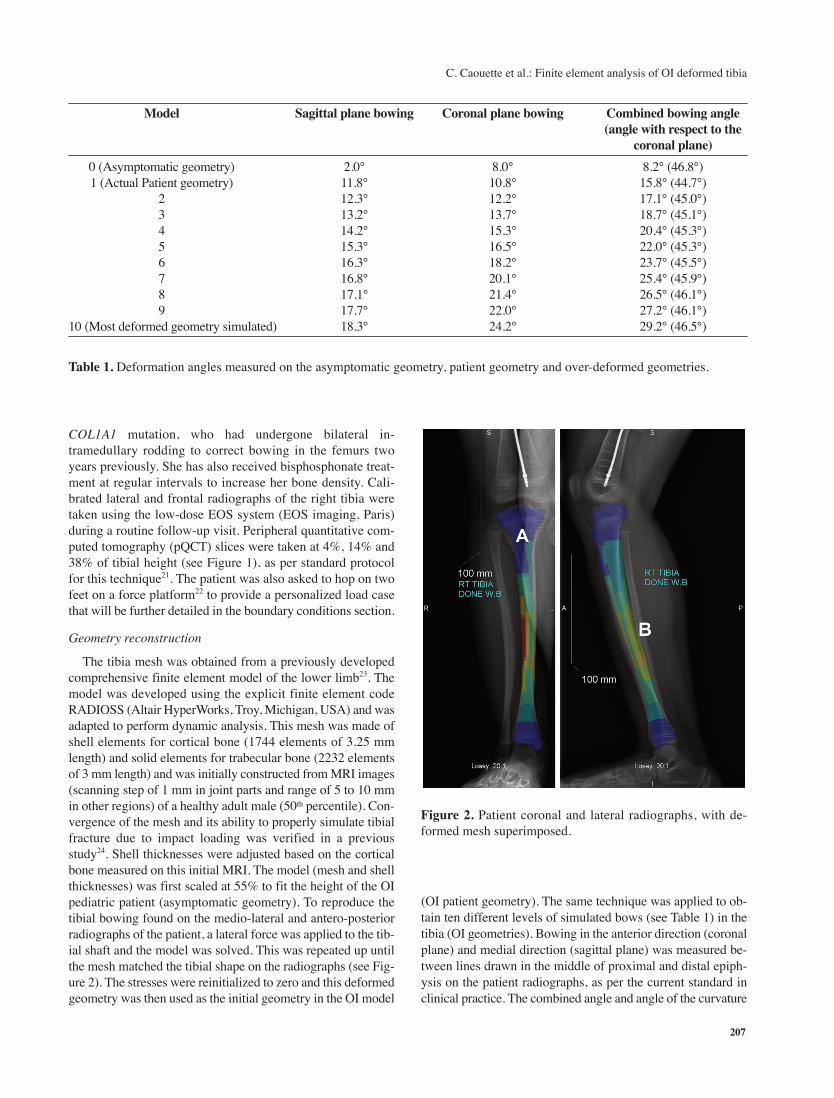
Figure 2. Patient coronal and lateral radiographs, with de-
formed mesh superimposed.

C. Caouette et al.: Finite element analysis of OI deformed tibia
208
plane with respect to the coronal plane are also provided as ref-
erence. Model 0 refers to the asymptomatic geometry, model 1
refers to the geometry fitted to patient radiographs, and models
2-10 refer to over-deformed geometries.
Cortical thickness, which is usually reduced in OI, was ad-
justed in the current model. Cortical thicknesses from the ini-
tial (non-OI) model were first scaled down by 55%. The pQCT
images were used to measure cortical thicknesses at 15° inter-
vals around the diaphysis diameter of each level and local ad-
justments were made to the OI model to improve the fit to
these values. The resulting thickness for the two models (non-
OI and OI) is shown on Figure 3.
Bone tissue material properties
Material properties were assumed to be isotropic, following
a symmetric and strain-rate dependent elasto-plastic material
law. This material law allows accounting for the initiation of
bone fracture: when the equivalent stress is lower than the
yield stress (115 MPa in the current study13), the material be-
haves as linear elastic. Once the critical value of strain is
reached locally in the bone, failure is modeled by removing
the ruptured elements from the model. This modeling approach
was used in similar projects to simulate vertebral fractures25,26.
The elastic modulus of OI cortical bone was set to 19 GPa; the
value was obtained from nanoindentation tests conducted on
pediatric OI type IV bone specimens15,27. Trabecular bone elas-
tic modulus was adjusted with bone mineral density values
from the pQCT exams and the equation of Varghese et al.28
(see Equation 1, where Etrabecular is trabecular bone elasticity
modulus and ρ is bone apparent density) was used to convert
bone density to elasticity modulus:
Etrabecular = 3 · ρ1.8 (1)
A normalized bone fracture criterion based on principal
strain in tension (εtension) and compression (εcompression) was cal-
culated for each simulation (see Equation 2). Values of 7,300
με in tension and 10,900 με in compression were used for the
analysis of fracture initiation, based on data from the litera-
ture28. The “fracture criterion” was calculated as the maximal
ratio between the principal tension and compression strains
and their respective fracture values (Equation 2). Thus, the risk
of fracture increases as the value of the calculated fracture cri-
terion approaches the fracture threshold of 1.0, when whole
bone fracture is predicted to occur. This fracture criterion was
shown to be able to accurately predict the onset of femoral
neck fracture on cadaveric femora8. The strains observed in
the OI patient (model 1) for the hopping test will obviously be
below the fracture threshold. However, using the 9 other mod-
els of different tibia curvatures, we expect that the stress will
increase with the bone curvature. For the torsion and horizontal
impact cases, the simulated loads were increased up until the
fracture criterion reached the fracture threshold to obtain a
maximal loading reference.
(2)
Loading cases and Boundary conditions
Seven different loading cases were simulated, corresponding
to (1) the forces that occur under physiological conditions dur-
ing two-legged hopping, (2-3) internal and external twisting of
the tibia along the diaphyseal axis (twisting load case), (4 to 7)
a direct hit on the tibia from a horizontal direction in the lateral,
medial, anterior and posterior directions (impact load cases).
For the first loading case, data from the mechanographic
clinical test was used. The maximum value of three recordings
was used for analysis. During hopping the lever arm (foot)
about the ankle joint has a ratio of about 3:1 relative to the
Achilles tendon. Therefore, resulting total force acting on the
tibia was estimated at four times the ground reaction force
data. Peak force of this load case (665 N) was here considered
the maximum physiological loading the bone is subjected to
in daily life and causes the highest strains in the bone tissue22.
For all load cases, the FE model was fully constrained (no
displacement or rotations allowed) at the tibial plateau, and a
distributed joint contact force was applied to the distal tibia.
The load was applied vertically for the hopping load case, in-
ternal and external rotation were simulated until fracture for
the twisting load cases, and loading was applied laterally and
medially (frontal plane impact) and posteriorly and anteriorly
(sagittal plane impact) for the impact load cases. Loading was
applied at the same speed as the mechanography load case
(9400 N/s) and increased until rupture of the tibia. Bending
and torsional stiffness were also evaluated.
Figure 3. Shell thickness distribution for the two models used
in the current study a) initial model (asymptomatic cortical
bone thickness, non-OI model) b) initial thickness scaled down
and adjusted to cortical thicknesses measured on pQCT slices
(patient-specific OI model).

C. Caouette et al.: Finite element analysis of OI deformed tibia
209
Results
The patient-specific reconstructed tibia (model 1) is shown
on Figure 2. The general shape and bowing of the patient bone
is reproduced by the finite element mesh, with discrepancies
below 2 mm for most of the tibia surface. The patient’s tibial
metaphysis (zone A on Figure 2) has a more widened shape
(33 mm) than the original scaled-down mesh (26 mm). The
patient’s diaphysis as seen on the frontal radiograph has re-
duced diameter (10 mm) compared with the scaled-down mesh
(12 mm, zone B on Figure 2). The tibia bending stiffness was
evaluated at 1300 Nm and 1350 Nm in sagittal and frontal
planes respectively. Torsional stiffness in internal and external
rotation was 5.8 Nm/°.
Table 2 shows the effect of cortical thickness on the maxi-
mal value of the fracture criterion, for the hopping load case
Figure 4. a) Fracture criterion as a function of sagittal and coronal plane bowing for the hopping load case b) Fracture torque as
a function of bowing for torsional load case c) Fracture load as a function of bowing for frontal plane impact d) Fracture load as
a function of bowing angles for sagittal plane impact.
Thickness approximation Maximal value of fracture criterionscheme used (hopping load case)
Asymptomatic geometry Most deformed geometry
OI model (adjusted to cortical
thickness from pQCT slices)0.184 0.305
Non-OI model 0.160 0.239
Table 2. Maximal value of fracture criterion for the hopping load case and the two thickness approximation schemes used.
C. Caouette et al.: Finite element analysis of OI deformed tibia
210
and two geometries (asymptomatic geometry and the most de-
formed geometry). The OI model thickness adjusted to cortical
thicknesses measured from the pQCT images on each level has
the highest fracture criteria for both geometries. All values are
below the fracture threshold of the fracture criteria, as expected
from a load case obtained from clinical measurements that did
not cause bone fracture in the patients.
Figure 4a shows fracture criteria as a function of sagittal
and coronal plane bowing for the hopping load case. For sagit-
tal and coronal plane, tibial bows inferior to 15° and 16° re-
spectively (22° combined angle), the fracture criterion remains
below 0.2. For higher degrees of bowing, there is an increase
of the fracture criteria, up to 0.31 for sagittal plane bowing of
18° and coronal plane bowing of 22° (27° combined angle).
This maximal value of 0.31 is below the fracture threshold of
the fracture criteria. Maximal values of the fracture criteria
occur in the proximal part of the tibia for all geometries. The
diaphysis remains less stressed than the distal and proximal
parts of the tibia for all levels of curvature.
Fracture load as a function of tibial bowing for the torsional
load cases is shown on Figure 4b. There is a small increase in
fracture load for internal rotation with increasing deformity (+0.5
Nm). For external rotation, fracture load increases until the bow-
ing reaches 13° and 14° in the sagittal and frontal plane respec-
tively (19° combined angle) then decreases below the fracture
load of the asymptomatic geometry (from 20.8 Nm at its peak to
20.0 Nm).
Fracture load for lateral impacts in the sagittal and frontal
planes are shown in Figure 4c and Figure 4d respectively. Fail-
ure occurred in about 0.16 seconds for all lateral impact load
cases. Fracture load is slightly higher for impact in the sagittal
plane (medial and lateral direction) than in the frontal plane
(anterior and posterior directions), but the difference is small
(±100 N). For impact loading applied in the direction that in-
creases the tibial bow, the maximal load decreases slightly, and
increases for loading applied in the direction that decreases the
tibial bow.
Discussion
The patient-specific finite element model presented in the
current study is a first step in the development of a clinically
useful numerical tool allowing the identification of patients
with OI requiring surgical intervention for tibial bowing. For
the compressive vertical load case, the fracture criterion re-
mains relatively constant for simulated tibial bowing below 15°
in the frontal and sagittal planes (22° combined bowing). The
fracture criteria then increases in a much more rapid fashion as
compared with the asymptomatic geometry (68% increase of
the fracture criterion for the most deformed OI model relative
to the asymptomatic model). At 0.305 for the most-deformed
geometry OI model and the hopping load case, the fracture cri-
terion is still well below the fracture threshold (1.0) that would
indicate probable whole bone fracture for this patient. The
model also allowed the estimation of fracture loads for a variety
of load cases and deformities without placing the patient at risk.
The patient-specific reconstructed tibia used in the current
study showed discrepancies of up to 2 mm over most of the
tibia surface, but the reduced diaphysis diameter and widened
shape of the tibial metaphysis typical of OI type IV pediatric
patients, who have had bisphosphonate treatment, were not re-
produced. Geometric reconstruction of OI patients long bones
is challenging because of the lack of 3D information: CT-scans
cannot be obtained without compelling reasons from these
young patients who will undergo numerous radiological exams
through their lives. The reconstruction method employed in
the current study used calibrated bi-planar radiographs and
three pQCT slices to obtain an approximate geometry that re-
produces the general bowing. Geometry affects the predictions
of FE models of long bones16, but the effect of these recon-
struction errors on the calculated fracture criteria is not known.
The current model also showed significant changes of the frac-
ture criterion (from 0.160 to 0.184 for the healthy geometry
and from 0.239 to 0.305 for the most deformed geometry) for
altered cortical thickness distribution. Whole bone strength is
affected by reduction of cortical thickness20; cortical thickness
is in fact the best predictor of whole bone load fracture4. The
reconstruction method used in the current study has one feature
particularly well suited to the study of OI: it allows over-de-
formation of the tibia to create geometries representing pro-
gression of the OI deformity. These theoretical models can be
used to determine how much more bowing can be tolerated for
this particular patient before the fracture risk increases too
much. An improved reconstruction method for OI deformed
bones is required to include this feature. The reconstruction
method also has to be improved to better reproduce the bone
as seen on the radiographs, as well as cortical thickness as
measured from pQCT images. A sensitivity study on the effects
of geometric reconstruction errors and cortical thickness vari-
ations should be further conducted on this improved recon-
struction method to assess their effect on the calculated
fracture risks.
Genuine model validation is not possible due to unavailabil-
ity of whole bone pediatric specimens for in vitro mechanical
testing. However, model bending and torsional stiffness was
compared to data from the literature obtained for cadaveric
adult specimens29. Results were found to agree reasonably well
for bending stiffness (1600 Nm vs 1300 Nm in the current
study for bending in the sagittal plane and 1200 Nm vs 1350
Nm in the current study for bending in the frontal plane) and
torsional stiffness (5.0 Nm/° vs 5.8 Nm/° in the current study).
Fracture loads obtained for lateral impacts (range of 1440 to
1550 N) are inferior to those found in the literature for three-
point bending tests30, which vary from 2500 to 12 000 N. How-
ever, these tests were conducted at the maximal travel speed
of the testing machine (15 mm in 50 ms), which is much faster
than the loading rate used in the current study (15 mm in 500
ms for the lateral impact cases) and is more representative of
high speed impacts such as pedestrian car crashes. Lateral im-
pacts conducted at higher speed (15 mm in 250 ms) on the cur-
rent model yielded fracture loads of up to 2500 N, indicating
that stress stiffening effects due to inertial forces were at work
C. Caouette et al.: Finite element analysis of OI deformed tibia
211
in the study by Rabl et al.30. Such effects are negligible for
loadings applied at speeds seen in stumbling load cases31 and
were therefore not considered in the current study. Fracture
loads obtained for the torsional load case (17 to 21 Nm) are in
the lower range of values found in the literature for torsional
fracture of cadaver tibias (from 25 to 100 Nm in a study by
Grutter et al.32, and from 12 to 82 in a study by Hong et al.33).
This is consistent with the reduced thickness tibia featured in
the current study.
Lateral and torsion load cases caused fracture to occur first
in the distal part of the tibia. This could be explained by the
fact that the tibial bone is optimized to carry compressive loads
in its distal portion (from 5 to 40% of its height) and is there-
fore more vulnerable to lateral impact and torsion load cases
in that section18. The study by Cristofolini et al.19 also showed
that the tibia is optimized to resist antero-posterior impact
loading in particular. Our results do not show such a trend:
fracture load for lateral impact in the antero-posterior direction
was comparable to that of all other directions of impact. Frac-
ture torque showed clinically insignificant variations with in-
creasing tibial bow. Torsional stiffness and strength are well
correlated to the cross-sectional area and polar moment of in-
ertia, as shown in a cadaveric study by Grutter et al.32. Because
they were kept constant when the bow was increased, the cur-
rent study found very limited effect of bowing on fracture
torque. Increased bowing was associated with increased frac-
ture risks in the case of compressive loading only. The addition
of a bow decreased resistance to compressive loading by
adding a flexion moment to the load carried by the tibia, as in
a curved beam under compressive loading34. It has also been
noted in the literature that the oblique fracture pattern usually
seen in traumatic fractures of long bones is associated with
combined loading including torque, but loads were applied one
type at a time in the current study and their effects on fracture
risk evaluated separately.
Bone tissue was assumed to behave isotropically in the cur-
rent study, and the elastic modulus of cortical bone was ad-
justed to fit nanoindentation tests conducted on samples from
OI type IV patients, as were cortical thicknesses throughout
the tibia. The increased trabecular bone density induced by bis-
phosphonate treatment was accounted for by adjusting me-
chanical properties based on density from the pQCT slices. OI
bone has been shown to be less anisotropic than normal bone14.
However, the allowable stress in the bone was taken from lit-
erature data and corresponds to adolescent healthy bone. OI
bone is more brittle than healthy bone: properties related to
crack initiation and propagation such as fracture toughness,
energy to failure and stress intensity factor have been shown
to be reduced in OI bone15,27. This was not taken into account
in the current study, which only considered the effect of bow-
ing on fracture risk: hence, the calculated fracture risks are un-
derestimated. The fracture loads obtained are therefore
overestimated and should be taken as an indication of the trend
caused by bony bowing and not as absolute values. A failure
criterion specially developed for OI bone would also be needed
for more accurate evaluation of fracture risks.
The model in its current version allows the evaluation of the
effect of increased tibial bowing on fracture risk. It can be ex-
tended to build a semi-parametric model that could be fitted
to patients and used to evaluate other clinical problems related
to OI. For instance, this semi-parametric model can be used to
evaluate severely deformed bones, and maximal loads can be
estimated. It can also be used to run series of simulations in
which structural (bone tissue properties) and geometrical (an-
gles of bowing, plane of bowing, cortical thickness) parame-
ters are varied within their possible ranges, allowing the
development of an abacus of bowing associated risks. Such a
model could eventually be used to study other clinical situa-
tions related to OI, such as the effect of nail diameter in the
rodding procedure often used to correct bowing.
A finite element model of the tibia in OI for the evaluation
of the effect of bowing on whole bone fracture load was devel-
oped which allows the evaluation of tibia fracture risks in OI
children. The model showed increased fracture risk associated
with tibial bowing for vertical compressive loading, but not for
lateral impact or twisting. The patient-specific model outlined
requires improvements to further analyze the effects of geomet-
ric features typical of OI such as the widened metaphysis.
Acknowledgements
Many thanks to Fuhao Mo for his help with the model. Funding from
the Réseau de recherche en santé buccodentaire et osseuse (RSBO) is
gratefully acknowledged. The study was also supported by the Shriners
of North America and Polytechnique Chair in Orthopedic Engineering.
References
1. Glorieux FH. Osteogenesis imperfecta. Best Pract Res
Clin Rheumatol 2008;22:85-100.
2. Michell C, Patel V, Amirfeyz R, et al. Osteogenesis im-
perfecta. Curr Orthop 2007;21:236-241.
3. Rauch F, Glorieux FH. Osteogenesis imperfecta. Lancet
2004;363:1377-85.
4. Ural A, Bruno P, Zhou B, et al. A new fracture assessment
approach coupling HR-pQCT imaging and fracture me-
chanics-based finite element modeling. J Biomech 2013.
5. Ascenzi M-G, Kawas NP, Lutz A, et al. Individual-specific
multi-scale finite element simulation of cortical bone of
human proximal femur. J Comput Phys 2013;244:298-311.
6. Keyak JH, Rossi SA, Jones KA, et al. Prediction of
femoral fracture load using automated finite element
modeling. J Biomech 1997;31:125-33.
7. Taddei F, Cristofolini L, Martelli S, et al. Subject-specific
finite element models of long bones: An in vitro evalua-
tion of the overall accuracy. J Biomech 2006;39:2457-67.
8. Schileo E, Taddei F, Cristofolini L, et al. Subject-specific
finite element models implementing a maximum princi-
pal strain criterion are able to estimate failure risk and
fracture location on human femurs tested in vitro. J Bio-
mech 2008;41:356-67.
9. Sonoda N, Chosa E, Totoribe K, et al. Biomechanical

C. Caouette et al.: Finite element analysis of OI deformed tibia
212
analysis for stress fractures of the anterior middle third of
the tibia in athletes: nonlinear analysis using a three-di-
mensional finite element method. J Orthop Sci 2003;
8:505-13.
10. Perillo-Marcone A, Taylor M. Effect of varus/valgus
malalignment on bone strains in the proximal tibia after
TKR: an explicit finite element study. J Biomech Eng
2007;129:1-11.
11. Wong C, Mikkelsen P, Hansen LB, et al. Finite element
analysis of tibial fractures. Dan Med Bull 2010;57:A4148.
12. Edwards WB, Schnitzer TJ, Troy KL. Torsional stiffness
and strength of the proximal tibia are better predicted by
finite element models than DXA or QCT. J Biomech
2013;46:1655-62.
13. Fritz JM, Guan Y, Wang M, et al. A fracture risk assess-
ment model of the femur in children with osteogenesis im-
perfecta (OI) during gait. Med Eng Phys 2009;31:1043-8.
14. Fan Z, Smith PA, Eckstein EC, et al. Mechanical proper-
ties of OI type III bone tissue measured by nanoindenta-
tion. J Biomed Mater Res A 2006;79A:71-7.
15. Fan ZF, Smith P, Rauch F, et al. Nanoindentation as a
means for distinguishing clinical type of osteogenesis im-
perfecta. Compos Part B-Eng 2007;38:411-5.
16. Taddei F, Martelli S, Reggiani B, et al. Finite-element
modeling of bones from CT data: sensitivity to geometry
and material uncertainties. IEEE Trans Biomed Eng 2006;
53:2194-200.
17. Eberle S, Göttlinger M, Augat P. An investigation to de-
termine if a single validated density-elasticity relationship
can be used for subject specific finite element analyses of
human long bones. Med Eng Phys 2013;35:875-83.
18. Capozza RF, Feldman S, Mortarino P, et al. Structural
analysis of the human tibia by tomographic (pQCT) serial
scans. J Anat 2010;216:470-81.
19. Cristofolini L, Angeli E, Juszczyk JM, et al. Shape and
function of the diaphysis of the human tibia. J Biomech
2013;46:1882-92.
20. Pistoia W, van Rietbergen B, Rüegsegger P. Mechanical
consequences of different scenarios for simulated bone
atrophy and recovery in the distal radius. Bone 2003;
33:937-45.
21. Anliker E, Rawer R, Boutellier U, et al. Maximum ground
reaction force in relation to tibial bone mass in children
and adults. Med Sci Sports Exerc 2011;43:2102-9.
22. Veilleux LN, Rauch F. Reproducibility of jumping
mechanography in healthy children and adults. J Muscu-
loskelet Neuronal Interact 2010;10:256-66.
23. Arnoux PJ, Cesari D, Behr M, et al. Pedestrian Lower
Limb Injury Criteria Evaluation: A Finite Element Ap-
proach. Traffic Inj Prev 2005;6:288-97.
24. Mo F, Arnoux PJ, Jure JJ, et al. Injury tolerance of tibia
for the car-pedestrian impact. Accident Anal Prev 2012;
46:18-25.
25. El-Rich M, Arnoux P-J, Wagnac E, et al. Finite element
investigation of the loading rate effect on the spinal load-
sharing changes under impact conditions. J Biomech
2009;42:1252-62.
26. Garo A, Arnoux PJ, Wagnac E, et al. Calibration of the
mechanical properties in a finite element model of a lum-
bar vertebra under dynamic compression up to failure.
Med Biol Eng Comput 2011;49:1371-9.
27. Fan Z, Smith PA, Harris GF, et al. Comparison of nanoin-
dentation measurements between osteogenesis imperfecta
Type III and Type IV and between different anatomic lo-
cations (femur/tibia versus iliac crest). Connect Tissue
Res 2007;48:70-5.
28. Bayraktar HH, Morgan EF, Niebur GL, et al. Comparison
of the elastic and yield properties of human femoral trabec-
ular and cortical bone tissue. J Biomech 2004;37:27-35.
29. Cristofolini L, Conti G, Juszczyk M, et al. Structural be-
haviour and strain distribution of the long bones of the
human lower limbs. J Biomech 2010;43:826-35.
30. Rabl W, Haid C, Krismer M. Biomechanical properties
of the human tibia: fracture behavior and morphology.
Forensic Sci Int 1996;83:39-49.
31. Bergmann G, Graichen F, Rohlmann A. Hip joint contact
forces during stumbling. Langenbecks Arch Surg 2004;
389:53-9.
32. Grutter R, Cordey J, Wahl D, et al. A biomechanical
enigma: why are tibial fractures not more frequent in the
elderly? Injury 2000;31(Suppl 3):C72-7.
33. Hong Y, Parks BG, Miller SD. Biomechanical analysis of
tibial strength after harvest of unicortical tibial grafts from
two different sites. Foot Ankle Int 2006;27:190-5.
34. Boresi AP, Schmidt RJ. Advanced mechanics of materi-
als. New York:Wiley; 2003.
Top Related