


Languages
Pages
Legal


BEYOND DEPENDENCY:
AN OPTIMAL POLICY FRAMEWORK FOR RENEWABLE AND NUCLEAR
ENERGY DEVELOPMENT IN SOUTH AFRICA.
A Thesis
Presented to
The Graduate School of Global Studies
Doshsisha University
In Partial Fulfillment
Of the requirement for the Degree
Master of Arts in
Global Society Studies.
By
Katleho Matsoso
(3I 15 0353)
July/2017

TABLE OF CONTENTS:
Abstract……………………………………………………………………………………i
List of Abbreviations……………………………………………………………….……..ii
List of Tables, Charts and Figures…………………………………………………..…….v
CHAPTER 1: INTRODUCTION
1.1 Background………….………………………………………………………………….1
1.2 Aims and Objectives.…………………………………………….......................………4
1.3 Methodology……….……………………………………..……………….……………5
1.4 Structural Outline….………………………………………………………..…………..6
1.5 Literature Review ………………………………………………………………………8
CHAPTER 2: SOUTH AFRICA’S ENERGY DILEMMA IN A NUTSHELL
2.1 Dependency on coal………………………………………………………..…………..13
2.2 Constitutional background……………….……………….……………………..……..18
2.3 Government strategies………………………………………………………………….20
2.4 Eskom’s electricity predicament …………………………………………….…….…..28
CHAPTER 3: COMPOSITION OF SOUTH AFRICA’S ENERGY MIX
3.1 Non-Renewable energy sources………………………………………...………...........31
3.2 Renewable energy sources……………………………………………………………..37
CHAPTER 4: A TALE OF TWO NATIONS
4.1 Pioneers of innovative energy sustainability…………………..………….….….…......41
4.2 Case study: Netherlands ……………………………………………………….………42
4.3 Case study: Japan…...………………………………………………….…….…..…….46
CHAPTER 5: CONCLUSION: THE WAY FORWARD
5.1 Lessons learned………………………………………………………………………...48
5.2 Energy policy recommendations……………………………………………….........…49
BIBLIOGRAPHY……………………………………………………...…………...…...…50

Abstract
The objective of this thesis is to explain the cause of the recurrent power failures in South
Africa, as well as its effect on the country from an economic, social and environmental
perspective. By doing so, the various forms of South Africa’s current energy mix can be
defined, analyzed and can then be determined as to which energy source/s require attention.
Empirical research will be conducted on the Netherlands and Japan in order to determine the
course of action they pursued in order to attain reliable energy development, reduce their
carbon emissions, but more so taking into account the other underlying factors such as cost,
time, energy security, institutions and climate change. Thus, primary and secondary sources
will be used to present the problem, possible solutions/s and together with white policy papers
to draft a proposal for renewable and/ or nuclear energy development as a long-term
resolution toward an optimal energy mix through a recommendation for a policy framework.
Keywords: South Africa, development, energy, coal

LIST OF ABBREVIATIONS
AfDB African Development Bank
ANC African National Congress
ACM Authority for Consumers and Markets
CHS Commission for Human Security
CSP concentrated solar power
DEA Department of Environmental Affairs
DME Department of Minerals and Energy
DoE Department of Energy
DPE Department of Public Enterprises
Dept. Department
DSM Demand Side Management
est. estimate
GEAR Growth, Employment and Redistribution Strategy
GDP Gross Domestic Product
GHG Greenhouse gas
GW gigawatt

IDM Integrated Demand Management
IEA International Energy Agency
IPCC Intergovernmental Panel on Climate Change
IPP Independent Power Producer
IRP Integrated Resource Plan
LNG liquified natural gas
MEC Minerals-Energy Complex
Mt Megatonne
MW megawatt
MDGs Millennium Development Goals
Mtoe Million tonnes of oil equivalent
NECSA South African Nuclear Energy Corporation
NERSA National Energy Regulator of South Africa
NNR National Nuclear Regulator
OCGT Open Cycle Gas Turbine
R Rands

REIPPPP Renewable Energy Independent Power Producer Procurement
Programme
RDP Reconstruction and Development Programme
R&D Research and Development
SADC Southern African Development Community
SDGs Sustainable Development Goals
SDM Supply Side Management
SOCs state owned companies
TPES total primary energy supply
TSO transmission system operator
WB World Bank
WRI World Resources Institute
WWF World Wind Fund for Nature

LIST OF TABLES, CHARTS AND FIGURES
List of Tables
Table 2.1: Sectoral Composition of the South African economy
Table 2.2: Major coal producers
Table 2.3: Major coal exporters
Table 2.4: The Regulatory bodies
Table 2.5: Advisory electricity power levels
Table 3.1: Functions of various power stations
Table 3.2: Eskom power station mix
Table 3.3: Properties of different types of conventional power stations
Table 4.1: Factors behind green electricity market success
List of Charts
Chart 3.1: South Africa’s total primary energy consumption, 2015
Chart 3.2: Planned new renewable generation mix 2030
Chart 4.1: Netherlands total primary energy consumption, 2014
Chart 4.2: Japans total primary energy consumption, 2015

List of Figures
Figure 3.1: World map of water stress by countries
Figure 4.1: Map of the Netherlands specifying location
Figure 4.2: Wind turbines
Figure 4.3: Wind turbine
Figure 4.4: Map of Japan specifying location

Beyond Dependency: An Optimal Policy Framework for Renewable and
Nuclear Energy Development in South Africa.
Katleho Matsoso
CHAPTER 1
INTRODUCTION
1.1 Background
From September 6th to 8th of 2000, the United Nations General Assembly adopted a
resolution titled, “United Nations Millennium Declaration” (General Assembly resolution
55/2, 2000). The prime objective of this binding document was to eradicate various problems
affecting developed, but more importantly developing countries. The framework was
structured into eight Millennium Development Goal’s (MDGs), namely: poverty, education,
gender equality, child mortality, maternal health, diseases, the environment and global
partnership, with each having a specific target/s and the intention to drastically reduce or
completely eradicate them during a 15-year (2000 - 2015) period (Galatsidas & Sheehy,
2015). Despite varying results in regard to each Goal that was set, there were a few which
were achieved and although the rest reached as far as half, they still fell short of the two thirds
target previously set.
As of September 25, 2015, the Sustainable Development Goals (SDGs) were adopted
and only came into effect from January 1, 2016 with functions more elaborate to that of the
MDGs and spanning a 15-year (2016-2030) period (un.org). However, although it is not
binding, the agenda for this particular framework was designed to expand from the previous
goals which were too narrow and thus increasing them to 17 Goals with a vast array of targets
that would make them as inclusive and as universal as possible (Thomson, 2016).
Considering that governments, private sector and civil society are responsible for the
progression of the 17 Goals, there are two in particular which are very much interconnected
and a topic of discussion on various platforms, which are; Goals 7) affordable and clean
energy, as well as 13) climate action. These goals have been envisaged as;
“ ...to promote broader energy access and increased use of renewable
energy, including through enhanced international cooperation and
expanded infrastructure and technology for clean energy.”
“…presents the single biggest threat to development, and its widespread,
unprecedented effects disproportionately burden the poorest and the most
vulnerable. Urgent action is needed not only to combat climate change and
its impacts, but also to build resilience in responding to climate-related
hazards and natural disasters” (un.org).
Energy generation and climate change have gradually come to be considered as two
themes which, for a while now, have been taken for granted. As a result of their
interconnectedness and arguments raised by skeptics on the aforementioned issues, they have
since gained recognition to become the most prevalent topics environmentally, politically,
economically, as well as academically. Articles, journals and even books pertaining to this

particular subject have been written by scholars of various backgrounds in order to identify
barriers, to also raise awareness and provide statistical, empirical and theoretical solutions.
South Africa on the other hand, considering its historical background in addition to
its various social and political issues, is currently experiencing an energy crisis dating as far
back as mid-late 2007. The notion of “load shedding,” defined by Eskom, is the process
whereby the demand for electricity is monitored against the ability to meet supply; in the
event that the power system experiences constraints then the controlled power cuts are
initiated to prevent a complete blackout (eskom.co.za). As a result of this, what needs to be
taken into account is the fact that two basic human rights such as access to energy and a clean
environment are at risk of being undermined if the situation is not addressed. However, it
may seem as though 2007 was not the initial year the problem surfaced, but rather a gradual
circumstance of government’s efforts to suspend an issue that was not regarded as an
immediate problem then. The adoption of the White Paper on Energy Policy (DME, 1998)
was intended to lay a foundation for future energy development in order to address the issue
of accessibility to electricity, future challenges, in addition to continually innovating means
to produce clean, as well as affordable energy. Thus, other documents such as the Integrated
Energy Plan 2003 and the DME Energy Efficiency Strategy 2005 are a few of many strategies
which get their mandate from the White Paper on Energy Policy 1998 in order to provide a
plan of action to establish affordable energy for all through the diversification of energy
sources, drafting and implementation of acts and legislations, as well as the introduction of
programmes and projects (DME, 2003 & 2005).

1.2 Aims and Objectives
This particular study’s objective is to analyze in detail the gravity of the situation in South
Africa, considering the backlash that government, particularly Eskom, has been receiving in
regard to the indefinite electricity crisis. Taking into consideration its historical past and
contextualizing its development in energy generation from then until now, will determine its
impact economically, socially and environmentally. Moreover, it is imperative to carefully
scrutinize the energy parastatal, as well as the various energy sources by examining the
underlying factors such as cost, time, institutions and energy security to name a few. In doing
so, it can then be determined which areas, particularly relating to renewable and nuclear
energy, require attention and investment. In addition to that, the comparison of the different
energy mixes, including a case study of two developed countries, namely the Netherlands
and Japan is intended to compare and contrast their past, present, as well as future prospects
and to finally recommend an optimal energy policy for implementation.
This also raises the questions as to:
1. How can South Africa, in collaboration with the new Sustainable Development Goals
(SDGs), attain sustainable energy development while reducing its reliance on coal by
2030?
2. Furthermore, what measures should South Africa pursue from the lessons learned
from the Netherlands and Japan, regarding their energy security policies; in order to
adopt and implement sound policies?

1.3 Methodology
For this study, quantitative and particularly qualitative methods were used to conduct the
research. The collection and the critical analysis of existing research can be categorized as
being primary and secondary data sources. The use of these two sources consisted of
newspaper articles, press releases, government documents (policies, reports...) and academic
journals which were used to define South Africa’s historical background on energy, in
addition to its recurrent electricity crisis. Moreover, academic journals and books pertaining
to Energy Resources and their Systems were also used to determine the various energy
sources that make up South Africa’s current energy mix, elaborate on where the problems lie
by structurally taking into account variables such as cost, time, institutions and energy
security will be retrieved from Eskom and various regulatory bodies. Furthermore, analysis
of newspaper articles, together with scholarly journals, would provide insight on each
countries background in relation to energy; while the critical analysis and comparison of
governmental policies would present a detailed outlook. Thus, the aforementioned, together
with a combination of other proposals would be used to answer the identified questions as to
which path to optimal energy sustainability South Africa should follow.

1.4 Structural Outline
In order to answer the aforementioned questions, the study has been chronologically
organized into five chapters, namely;
Chapter 1 provides a brief description of the energy crisis that has been affecting the country
for almost a decade now. In addition to that, it provides the aims and objectives which attempt
to address the significance of the study and highlights questions that it intends to answer. The
methodology will determine the approach in which the research was conducted and how it
will be utilized toward underlining the problem, presenting possible solutions and then
determining the best recourse for long-term energy sustainability. The outline provides brief
summaries on what is entailed in each of the chapters, as well as the conclusion.
Chapter 2 briefly gives a background of South Africa, particularly in regard to its geographic,
historical and past on energy generation from 1994 in order to determine the origins of the
cause/s to the energy shortage affecting the country. The legislative frameworks set in place,
together with the institutions that are responsible for their implementation, will be analyzed
for their role in conjunction with the energy crisis.
Chapter 3 is structured into three sections, namely; Non-Renewable energy sources,
Renewable energy sources and a comparison analysis of both. Each of the first two sections
is structured to give the reader a detailed description of South Africa’s current energy mix.
The final section will attempt to focus attention on how each contributes or deduces towards
greenhouse gases, as well as compare and contrast underlying factors such as cost, time
(longevity) and energy security.

Chapter 4 is intended as a base for comparison between two developed countries in regard to
their Non-Renewable and Renewable energy policies considering that they are pioneers in
sustainable energy development. Both the Netherlands and Japan will be used as case studies
due to the aforementioned criteria, in addition to other factors such as their geography,
economies and other demographics. This can be used as a foundation for South Africa to
more or less learn from and adopt certain ideas or policies on market liberalization,
particularly in the energy sector.
Chapter 5 is structured into two sections, namely; Lessons learned and Energy policy
recommendations’. The first section will reflect on the successes or failures by the
Netherlands and Japan as possible short or long-term solutions. Moreover, the second section
will determine the direction in which the South African government, particularly the
Department of Energy and Eskom, should consider on past successes and failures of the
aforementioned countries, thus determining which policy recommendation is feasible. In
conclusion, everything documented will be summarized in order to determine the direction
South Africa must advance in, in order to produce more reliable and sustainable energy
development while drastically diminishing its dependence on coal, as well as reducing its
carbon emissions.

1.5 Literature Review
This paper will demonstrate how energy plays a vital role toward the economy, particularly
in regard to economic growth and development. South Africa is a country that has an
abundance of fossil fuels such as coal and uranium which it benefits not only as commodities
for exports, but more importantly for primary energy generation. In addition to that, its
strategic location also gives it an added advantage in regard to other untapped energy sources.
With Ghosh and Prelas (2009) asserting that energy is the driving force behind most
economies, in South Africa’s case, 95% of energy (electricity) generated nationally comes
from coal. However, as a result of there being a shortage in energy supply to meet demand,
a stagnant economy and the need for more sustainable energy development, South Africa
faces a long-term energy crisis unless alternative sustainable options are invested in soon.
The scope of the review will be limited to published works particularly on energy, energy
sustainability and energy development in South Africa and around the world.
Komor (2004), takes a more pragmatic approach by pointing out that renewable
energy plays an important role in the future of our planet. Apart from providing a detailed
introduction on the problems associated with renewables, the author examines how policies
for renewable energy can be implemented for large scale electricity production. Furthermore,
the author provides how various government efforts have either succeeded or failed and as a
result what measures were taken into account to either improve on or learn from. The author
does so by carefully using jargon free language, as well as technologic, economic and
political terminology on renewable energy cost and performance through various case studies.

Ghosh and Prelas (2009) offer a more comprehensive theoretical approach which
simply defines energy resources and their systems. The authors define and then compare the
difference between Renewables and Non-Renewable sources, thus further applying technical
explanations from scientific and economic stand points. The authors discuss in great detail
the including the type of energy, methods of converting energy, pointing out various
engineering design issues associated with the energy converting system, the efficiency of the
conversion process, the economics, risks and the environmental impact globally.
Diesendorf (2010) argues that although global warming poses a worldwide ecological
threat, the advances in sustainable energy technologies, particularly renewable energies, are
seen as long-term solutions to reductions in non-renewable energy reliance and reductions in
greenhouse gases. The author uses Australia as a case study by using a theoretical approach
to define the problem, covers various sustainable technologies, presenting policies and
strategies on the plan of action. By using Australia as a case study, he reiterates that it is one
of the largest exporters of coal and emitters of greenhouse gases in the world. He argues that
despite being a coal and oil dependent country, Australia could achieve an ecologically
sustainable energy system.
Todaro and Smith (2011) assert that without energy there cannot be any development;
and without development there can be no energy. The authors approach confronts the
problems and challenges of the developing world such as population growth, poverty, as well
as environment and development. They adopt a problem – and policy oriented approach by
considering macro and international topics by addressing them through theoretical and

empirical analysis of data (new measures and statistics), case studies by country and relevant
policies.
Sebitosi and Pillay (2008) assert that “different countries and societies depending on
the prevailing socio-economic environment draft and apply their policy frameworks
differently.” This can either be facilitated through investment cost reduction, public
investment or market facilitation. Prior to 1994, South Africa was internationally isolated
which prompted the government to be self-sufficient in energy generation and thus this
resulted in there being inadequate information (data), lack of human development and slow
development. Even though South Africa had an abundance of sunshine and wind, the
electricity shortfall of 2008 prompted the expansion of coal generating capacity, with the
need for an increase in renewable energy to the energy mix. Problems associated include
political pressure/ interference, no particular guiding framework, outdated legislation, lack
of education on topic/theme and calls for privatization (mixed public/private business model).
Sebitosi (2008) points out that “energy efficiency has become recognized as one of
the most cost-effective ways of meeting the demands of sustainable development.” In order
to do so the Department of Minerals and Energy would have to more or less improve off of
the 1998 Paper on how to improve its energy efficiency by 2015, with the baseline year
beginning from the year 2000. Due to the country being one of the biggest emitters of
greenhouse gases per capita, this posed serious environmental issues, in addition to the need
for further investment in new generating power capacity by 2007 using the business as usual
model. By reviewing the energy policies of Japan (2006) and the United States (2007), South
Africa would have to draft a well-executed policy strategy, together with a rigorous plan of

action which is key to achieving efficient energy gains. Problems associated include; failure
of government and Eskom (public sensitization and information model), Eskom’s
administration, energy generation, as well as their transmission infrastructure. Proposed
solutions include; future decentralization, adoption of low carbon technologies, government
action to energy possibilities, legal instruments alone inadequate, lack in human capacity
(technical skills) and transparency (disclosure of decisions, rates...etc.).
Winkler and Marquand (2009) assert that “climate change mitigation poses
significant challenges for South Africa and its energy development.” Although South Africa
is a middle-income developing country, there are various developmental challenges such as
high levels of inequality and unemployment, together with an energy intensive economy
which in turn contributes towards increased carbon emissions. The authors present the case
for South Africa in an overview of the developmental challenges as a result of post 1994. By
elaborating on the past policy frameworks, the authors make a key finding on the GHG gas
emissions between 1990 and 1994, which can be directly attributed to South Africa’s primary
energy consumption of coal. The authors further states that it is imperative for the South
African government and other key stakeholders to integrate climate change into other policy
domains, develop international and national climate policy and determining energy policies
and their implication for mitigating climate change. And finally, the author emphasizes that
the three key areas include: 1 - energy efficiency (reduce demand or use it more efficiently),
2 - changing the fuel mix (converting to lower- or non-carbon-emitting energy sources) and
3 - structural changes to the economy (lower the energy intensity of the whole economy and
investment to less energy-intensive sectors) as long-term solutions.

Pegels (2010) states that “the challenge of transforming entire economies is
enormous; even more so if a country is a fossil fuel based and emission intensive as South
Africa.” The author acknowledges that according to various reports by the Intergovernmental
Panel on Climate Change (IPCC), World Bank (WB) and World Resources Institute (WRI),
climate change is most likely going to impact the African continent in numerous ways,
particularly water availability. South Africa on the other hand, although a contributor, will
likely experience a deterioration water supply and quality, desertification, decline in
biodiversity, health issues and a decline in agricultural output. The author then goes on to
give a detailed breakdown of the country’s energy mix and that as a result of the power
shortages in 2008, these resulted in detrimental economic impact of roughly USD 253 and
282 million. Furthermore, by defining the electricity problem and a plan of action by the
DME from a demand side management/ supply side management (DSM/SSM) point of view
in the short and long-term, the problems the country may encounter include; electricity
undersupply, financial investment and environmental damage. The author also noted that
there are three barriers in regard to the state of renewable energy in South Africa, namely;
market for RE relatively young, legislation hurdles and unfair competition particularly for
the Independent Power Producers (IPPs). Seeing as there is a huge gap between RE and actual
policy implementation, the author makes 6 detailed bullet points in the form of
recommendations with various approaches from the government, Eskom and inclusivity with
the South African public on crucial decisions.
Baker (2016), points out that in order to understand South Africa’s background in the
energy sphere; one would have to look at the country’s historically unique, yet complex

political economy particularly its electricity policy considering that it involves various
players (sectors) and more importantly the concept of the “minerals-energy complex (MEC)”
(Fine and Rustomjee, 1996). Briefly summed, “it is a highly electricity and carbon-intensive
economy based on the country’s abundant and historically cheap sources of coal.” The author
emphasizes that as a vertically integrated monopoly, Eskom benefiting from the from this
uneven distribution which also contributed towards the lack of electricity for the majority of
South Africa. Moreover, five of the biggest mining companies, namely: Glencore, Anglo-
American, South 32 (demerged from BHP Billiton in 2015), Exxaro and Sasol all benefitted
from deals made with Eskom (Eberhard, 2011). This points out that, apart from South Africa
accounting for a significant share of the world’s mining industry, in 2008 Eskom encountered
an electricity crisis, together with issues such as mismanagement and disorganization of the
utility, inadequate maintenance of the utility’s older power stations and funding issues for
infrastructure. As a result, they have far exceeded their allocated expenditure in addition to
the loans they received from the African Development Bank (AfDB) in 2009 and the World
Bank in 2010, respectively. Furthermore, as a quick fix solution to recoup the millions spent,
Eskom requested an increase in electricity tariffs from NERSA.
The reduction in greenhouse gas emissions through an optimal mix has not only been
addressed on a national scale, but more aggressively on an international level. The Africa
Progress Report 2015 emphasizes that both global poverty and climate change have a
common link, which is energy. Moreover, the report also points out that although “sub-
Saharan Africa is desperately short of electricity, the region’s grid has a power generation
capacity of just 90 gigawatts and half of it is located in one country, South Africa.”

South Africa in this context, finds itself in quite a predicament as energy consumption goes
hand in hand with greenhouse gas emissions and global climate change. While energy
security is the governments top priority, there is also a need to highlight that alternative
energy sources are key not only to a sustainable optimal mix, but beneficial towards
environmental security. This study would attempt to ultimately develop an optimal policy
framework to determine how the inclusion of renewable and nuclear energy on a
decentralized level would assist South Africa in reducing its greenhouse gas emissions, while
achieving sustainable energy security.

CHAPTER 2
SOUTH AFRICA’S ENERGY DILEMMA IN A NUTSHELL
2.1 Dependency on coal
“Energy is the lifeline of the economy for any country” (Ghosh & Prelas, 2009:1). It has a
very comprehensive and important role to play particularly when you consider the economy
(locally and globally), population growth, environmental implications and the depletion of
the energy resources in the process. Energy generation in South Africa, like in many
developing and emerging markets, proves to be a stumbling block as development cannot
advance without sustainable and affordable energy. The lacklustre implementation of and
sluggish infrastructural development of alternative energy generation sources resulted in
periodic rolling blackouts, which have consequentially affected the already stagnant
economy economically, socially and more importantly environmentally.
South Africa is located at the southern tip of the African continent and shares its
borders with six countries; Namibia, Botswana, Zimbabwe, Mozambique, Swaziland and
Lesotho. The country has a population made up of 54, 300, 704 million people (2016 est.),
has a total area that covers up to 1, 219, 090 square kilometers, is strategically subdivided
into 9 provinces with those located inland/in the interior mostly semiarid and those along the
coast having a subtropical climate (cia.gov). As a result of its strategic geographic location,
South Africa has an abundance of arable land and more importantly is well endowed with a
wide range of mineral reserves that include ferrous minerals, non-ferrous minerals and metals,
precious metals and minerals, energy and industrial minerals (cia.gov; dmr.gov). Given its
illustrious history in mining, South Africa’s economy is built on the extractive minerals of

gold, diamonds and coal which contribute in part to a large share of exports with key trading
partners. In addition to mining, other key sectors that contribute towards the Gross Domestic
Product (GDP) include, agriculture, manufacturing, wholesale and retail trade,
communications, transport, electricity, construction, financial services, government services
and other services which complete the composition of the economy (IDC, 2015;5).
Table 2.1: Sectoral composition of the South African economy
Source: Swiss Programme for Research on Global Issues for Development, compiled from SARB data; IDC, compiled from Stats SA data.
With South Africa ranked as one of the world’s 12 highest carbon dioxide emitters,
it also makes it the highest contributor to greenhouse gases (GHG) in Africa with emissions
reaching a total of 579 million tonnes of carbon dioxide emitted in 2010 (Wolpe & Reddy,
2015: 6; DEA, 2013). Due to South Africa having an abundance of together with access to
cheap coal (by international standards), the extremely energy intensive economy relies on
Sector: 1995 2005 2015
Agriculture, forestry & fishing 2,6% 2,7% 2,3%
Mining & quarrying 10,1% 7,6% 8,0%
Manufacturing 19,6% 18,5% 13,0%
Electricity, gas & water 2,6% 2,4% 3,6%
Construction 2,5% 2,8% 4,0%
Wholesale & retail trade, catering & accommodation 13,1% 13,9% 15,0%
Transport, storage and communication 7,5% 10,0% 10,0%
Finance, insurance, real estate & business services 17,4% 21,1% 20,9%
Community, social & personal services 6,4% 6,3% 5,7%
General government 19,1% 14,9% 17,4%
Total 100% 100% 100%

fossil fuels as a primary energy source in order to increase economic, as well as human
development (Wolpe & Reddy, 2015: 6; DEA, 2013). In addition to that, the Department of
Energy (DoE) states that 77% of primary energy comes from coal which is obtained by large,
as well as small-scale producers at 51% (underground method) and 49% (open-cast method)
respectively, with 28% of South Africa’s coal production playing a fundamentally key role
as a crucial export and a major problem altogether.
The International Energy Agency (IEA) and the US Energy Information
Administration (EIA) both published an excerpt, as well as a document titled, “Coal
Information: Key coal trends 2016” and “International Energy Outlook 2016” respectively.
The former goes into detail about coal from a global to a regional (OECD and non-OECD
members) point of view discussing the production, trading and consumption patterns; with
the latter providing a comprehensive overview on Petroleum and other liquid fuels, natural
gas, electricity, as well as building, industrial and the transport sectors energy consumption
through past, current and future projections using policies as indicators. These documents
also present valuable information on the major coal producers and exporters which will be
summarized in the following two tables in order to provide an outlook on where South Africa
ranks in the world.
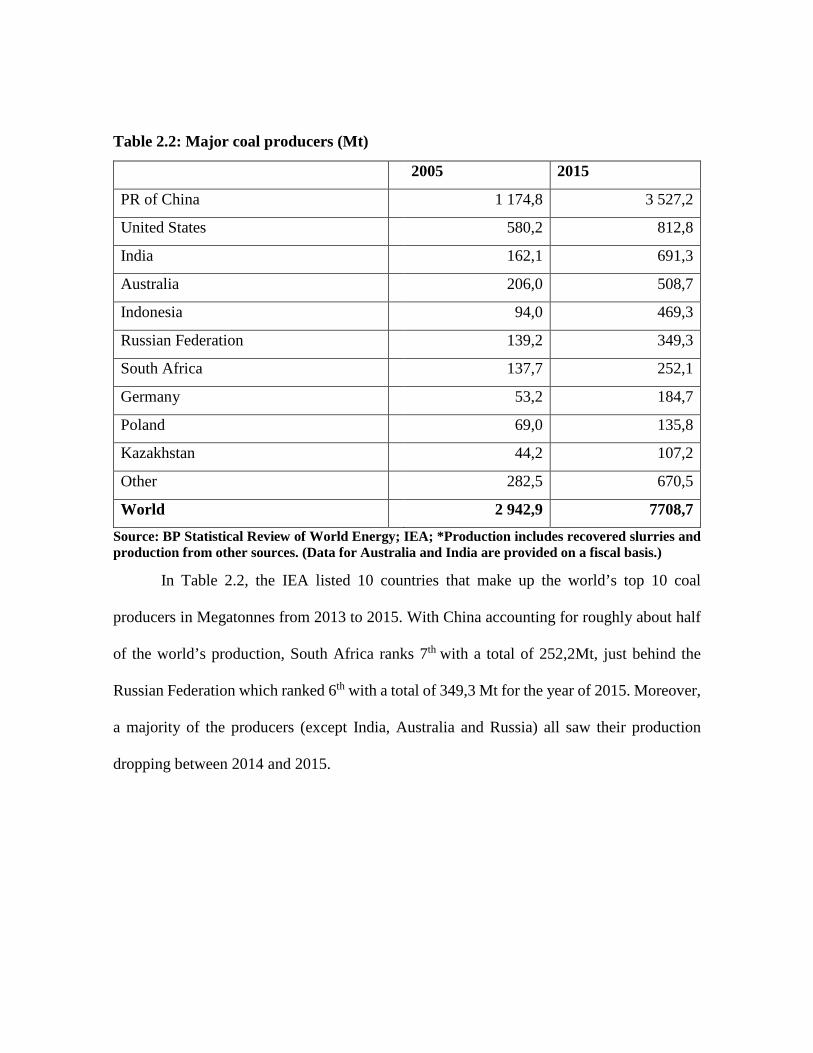
Table 2.2: Major coal producers (Mt)
2005 2015
PR of China 1 174,8 3 527,2
United States 580,2 812,8
India 162,1 691,3
Australia 206,0 508,7
Indonesia 94,0 469,3
Russian Federation 139,2 349,3
South Africa 137,7 252,1
Germany 53,2 184,7
Poland 69,0 135,8
Kazakhstan 44,2 107,2
Other 282,5 670,5
World 2 942,9 7708,7 Source: BP Statistical Review of World Energy; IEA; *Production includes recovered slurries and production from other sources. (Data for Australia and India are provided on a fiscal basis.)
In Table 2.2, the IEA listed 10 countries that make up the world’s top 10 coal
producers in Megatonnes from 2013 to 2015. With China accounting for roughly about half
of the world’s production, South Africa ranks 7th with a total of 252,2Mt, just behind the
Russian Federation which ranked 6th with a total of 349,3 Mt for the year of 2015. Moreover,
a majority of the producers (except India, Australia and Russia) all saw their production
dropping between 2014 and 2015.

Table 2.3: Major coal exporters (Mt)
2005 2015
Australia 231,3 392,3
Indonesia 108,0 368,4
Russian Federation 75,7 155,1
Colombia 55,8 82,0
South Africa 73,0 77,3
United States 45,1 67,1
PR of China 71,8 36,2
Canada 27,7 30,5
Kazakhstan 16,9 27,4
Poland 20,8 19,9
Other 45,3 55,0
World 749,0 1 311,1 Source: IEA statistics 2006, IEA (Data for Australia are provided on a fiscal basis.)
In Table 2.3, South Africa is regarded as one of the highest coal exporters in the world,
ranking 5th, and accounting for 6% of global exports. In addition to that, in 2014, 69Mt of
coal worth R46,7 billion were exported (chamberofmines.org.za).
South Africa’s path to development has progressively adopted a capital and energy-intensive
approach, driven by resource extraction which is closely linked with other economic
activities and defined by Fine and Rustomjee (1996) as the “Mineral-Energy Complex”
(Winkler & Marquand, 2009: 48). This particular concept is touched on in the Greenpeace
Report of 2012 titled, “The Eskom factor: Power politics and the electricity sector in South
Africa,” as it emphasises that the socio-economic challenges such as inequality,
unemployment and more importantly the lack of access to electricity are in actual fact a by-
product of the MEC during and post-apartheid era (Steele et al, 2012: 5; Baker, 2016: 4).

However, in order to fully understand the gravity of the aforementioned and how they affect
South Africa from an economic, social and environmental view, it is imperative to observe
its energy policy/s and institutions from a historical viewpoint in order to determine the build
up to its current situation which will be discussed in the following section.
2.2 Constitutional background
When considering South Africa’s historical together with its background on energy
policies, there are three different phases to take into account, namely; the first phase was
during the apartheid regime (1948 – 1994), the second phase was after the country’s first
democratic elections (1994 – 2000) and the third phase is from 2000 till this present day
(Winkler et al, 2006: 5). However, for research purposes, the time frame that will be covered
will be from 1994 in order to determine the measures the post-apartheid government took to
address the inequalities inherited, particularly energy generation from the previous
government.
In 1994, South Africa held its first ever non-racial general elections with the African
National Congress (ANC) at the forefront to not only winning the elections by popular vote,
but also bound to make history and become the nation’s first democratically elected
government. Much as this was a monumental achievement for the country, the new
government still had the daunting task of tending to underlying issues such as the lack to
housing, basic services which include water, sanitation and electricity, as well as restriction
to information on energy data which they all inherited from the previous government
(Winkler & Marquand, 2009: 48; Sebatosi & Pillay, 2008: 3313; Winkler et al, 2006: 5). The

governments priority at that point in time was to apply itself to the inequities of apartheid by
proposing a broad policy framework that was intended to address macroeconomic problems
and attempt to provide services and employment for the masses; hence the adoption of the
following programmes, namely: the 1994 Reconstruction and Development Plan (RDP), the
1996 Growth, Employment and Redistribution Strategy (GEAR), the 1994 – 99 National
Electrification Programme (Winkler & Marquand, 2009: 49; Wolpe & Reddy, 2015: 5-6;
ibid). The former was intended to provide housing in addition to providing basic services
such as water and electrification to empower the majority that marginalized during apartheid;
while the latter’s objective was to open the economy to investment and exports primarily for
economic growth and macroeconomic stability to address the creation of employment and
reallocation of resources through the budget (DMR, 1998: 7). However, in order for the
mentioned programmes, strategies or policies to be in effect and for the country to further
develop, the law had to be amended.
With the ratification of Act 108 of 1996, also known as the Constitution of the
Republic of South Africa as the supreme law, the three components consisting of the
Executive (Cabinet), Legislature (Parliament) and Judiciary (Courts) make up the South
African government and are responsible for the for the adoption and implementation of all
proclamations under the provisions of the Constitution. For instance, Winkler et al (2006)
emphasize that over time the key behind South Africa’s development on a social and
economic scale is due to energy production, in spite of the fact that the emissions from coal
combustion such as carbon, sulfur and nitrogen oxides are rather unfavorable toward the
environment. The paradox with this situation is that in order for South Africa to maintain its

hegemonic status in energy generation on the continent, it has to maintain and increase its
energy production to meet its demand; meaning increasing mining for coal extraction and
burning more coal at the expense of the environment. In the Constitution, Chapter 2: Bill of
Rights in section 24 on Environment states that;
“Everyone has the right –
(a) to an environment that is not harmful to their health or wellbeing; and
(b) to have the environment protected, for the benefit of present and future
generations, through reasonable legislative and other measures that –
(i) prevent pollution and ecological degradation;
(ii) promote conservation; and
(iii) secure ecologically sustainable development and use of natural resources
while promoting justifiable economic and social development.”
2.3 Government strategies
As a result of this, the Department of Minerals and Energy drafted a document titled
the “1998 White Paper on the Energy Policy of the Republic of South Africa”, which acquired
its mandate from the from the Constitution (DME, 1998; Sebitosi & Pillay, 2008: 3313;
Winkler et al, 2006: 8-9). The paper was structured in 5 sections, namely: 1) introduction,
2) context and priorities for energy policy, 3) demand sectors, 4) supply sectors and 5) cross
cutting issues. The introduction briefly talks of the necessary steps taken to drafting an
Energy Policy Discussion Document for thorough analysis of the problems and causes, as
well as comments on solutions prior to it its adoption in 1998. The five policy objectives are
entailed as:
1. “Increasing access to affordable energy services - disadvantaged households,
small businesses, small farms and community services.”
2. “Improving energy governance - determining specific roles and functions of
governmental institutions particularly in regard to accountability,
transparency and inclusivity through membership for blacks and women.”
3. “Stimulating economic development - encourage competition within energy
markets.”
4. “Managing energy-related environmental and health impacts – promotion of
access to basic energy services for poor households, in order to ameliorate
the negative health impacts arising from the use of certain fuels.”
5. “Securing supply through diversity – given increased opportunities for
energy trade, particularly within the Southern African region, government
will pursue energy security by encouraging a diversity of both supply sources
and primary energy carriers.” (DME, 1998: 8-9; ibid).
From the demand side, the paper addresses five sectors; households, industry,
commerce and mining, transport, as well as agriculture. Energy services by the previous
government proved to be inadequate for low income households, but from a modern
industrial urban societal view accommodated to the industrial sector and the privileged white
minority. Moreover, the use of fossil fuels such as fuelwood and coal by rural communities

has an environmental impact that contributes toward air pollution which has serious health
consequences. Although energy security may reduce poverty and improve living standards,
government intends initiate this through the appropriation of efficient appliances and fuels,
thermally efficient low-cost housing and energy savings. Little attention was paid toward
energy efficiency by the apartheid government, but the latter noted that greater efficiency
contributed towards financial and environmental benefits with an increase in competition
internationally. Thus, it was noted that greater energy efficiency could save between 10%
and 20% of current consumption. Even though the obstacles that were highlighted include:
inappropriate economic signals, lack of awareness, information and skills, lack of efficient
technologies, high economic return criteria and high capital costs; government is committed
to ensuring the application of greater energy efficiency through innovative technology,
accountable institutions and adequate legislation. Equitable access to affordable public
transport, together with fuel diversity needs to be increased in addition to addressing other
challenges. Other specific sectors such as small holder agriculture, rural schools, clinics,
roads and communication infrastructure require improved energy services and policies.
From the supply side, the paper elaborates on the seven energy sources; nuclear
energy, oil and gas: exploration and production, liquid fuels, gas, coal, renewable sources
and transitional fuels: Low-Smoke Fuels. In order to provide electricity that is low cost and
equitably priced, government will expect greater public participation in decisions on large
public-sector electricity investments, and will require evaluations using integrated resource
planning (IRP) methodologies. The notion of nuclear energy being a possible option in the
future depends on various alternative energy sources environmental and economic merits. In

regard to South Africa’s role on the exploration and production of oil and gas, the
government intends to utilize the principles of “use it and keep it” or “polluter pays.”
However, the paper also emphasizes that minimal intervention in connection with the liquid
fuels industry can: increase international competition and investment, issue adequate
environmental and safety standards, together with sustainable employment by taking into
account black interests. On the other hand, the development of natural gas and coal-bed
methane would require the legislation for the transmission of, storage, distribution and
trading of piped gas as they are attractive options. Although the coal industry would remain
unregulated and its performance monitored, it is still the major source of energy. In turn,
government intends to promote clean technologies and other alternatives primarily to reduce
its environmental impact. Furthermore, it perceives that renewables can provide low cost
energy service to remote areas and also has added benefits from a social and an
environmental point of view. The facilitation of sustainable production, management of solar
power and non-grid electrification systems would be devoted to rural communities. In
addition to that, government would also promote research into low-smoke fuels as an energy
source for rural households.
The cross cutting issues are structured to outline:
• “Integrated energy planning.”
• “Substantial statistics and information.”
• “Considerable energy efficiency promotion.
• “Equilibrium between environment, health and safety objectives.

• “Research and development to be carried out by energy suppliers and
private sector.” • “Human resource development.”
• “Capacity building, education and information dissemination.”
• “Establishment of international energy trade and cooperation.”
• “Aligning fiscal and energy policies through levies, tax differentials and
other options that involve sustainable energy, as well as efficiency.”
After the implementation of the 1998 Energy Paper which laid the foundation for
governments objectives in regard to energy, three papers pertaining to the legislation of and
future expectations of energy development in South Africa from 2003 involve;
DME Integrated Energy Plan 2003: this document was structured as a framework whereby
specific energy policy, development resolutions in addition to how energy supply trade-offs
can be determined according to a project-by-project basis. Moreover, it emphasizes on South
Africa’s reliance on coal as a primary source for energy and the need to diversify its energy
supply (DME, 2003a).
DME White Paper on Renewable Energy 2003: the basis for this document was intended for
the implementation of renewable energy. Furthermore, as a policy objective it intends to
reach a target of 10 000GWh from renewable energy contribution by 2013 (DME, 2003b).
DME Energy Efficiency Strategy 2005: this document was structured as a policy objective
through national targets to determine how South Africa can improve its efficiency on energy
of 12% by 2015 through the utilization of “implantation instruments” (DME, 2005).

Other papers that were published in correlation with the issue of energy in South Africa
include the Biofuels Industrial Strategy 2007, 2008 Energy Act, the Integrated Resource Plan
(IRP) for Electricity 2010 – 2030 and the National Development Plan (NDP) 2011 to name
a few.
However, in order to understand which governmental departments are responsible for
the implementation of a particular policy and the role regulatory bodies or parastatals play
will each be defined accordingly from a top down approach. From 1994 until 2009, the
Departments of Minerals and Energy, as well as the Department of Environmental Affairs
and Tourism were divided in order to have each having its own specialization. These were
then categorized as:
• Department of Minerals and Resources which aims “to promote and regulate the
minerals and mining for transformation, growth, development and ensure that all
South Africans derive sustainable benefit from the country’s mineral wealth,”
(dmr.gov.za)
• Department of Energy which aims to “formulate energy policies, regulatory
frameworks and legislation, and oversee their implementation to ensure energy
security, promotion of environmentally-friendly energy carriers and access to
affordable and reliable energy for all South Africans,” (energy.gov.za)
• Department of Environmental Affairs which aims to “provide leadership in
environmental management, utilisation, conservation and protection of ecological
infrastructure.” (environment.gov.za)

• Department of Tourism which aims to “create conditions for the sustainable growth
and development of tourism in South Africa” (tourism.gov.za).
In addition to the aforementioned departments, there is also the Department of Public
Enterprises (DPE) which “aims to drive investment, productivity and transformation in
the departments portfolio of state owned companies (SOCs), their customers and
suppliers so as to unlock growth, drive industrialization, create jobs and develop skills”
(dpe.gov.za). In Table 2.4 is a detailed list with state owned public companies and
regulatory authorities which in accordance with the Constitution and various mandates
work under or with the departments to ensure that objectives are met.
Table 2.4: The Regulatory bodies
Role players Objectives
National Energy Regulator of South Africa (NERSA)
Regulate the energy industry in accordance with government
laws and policies, standards and international best practices in
support of sustainable and orderly development.
South African Nuclear Energy Corporation (NECSA)
Undertake and promote research and development in the field
of nuclear energy and radiation sciences and technology, to
process source material, special nuclear material and
restricted material, to reprocess and enrich source material
and nuclear material, and to co-operate with any person or
institution in any maters falling within these functions. Necsa
also had to execute institutional responsibilities on behalf of
government, such as decommissioning and waste
management.
National Nuclear Regulator (NNR)
Monitor and enforce regulatory safety standards for the
achievement of safe operating conditions, prevention of
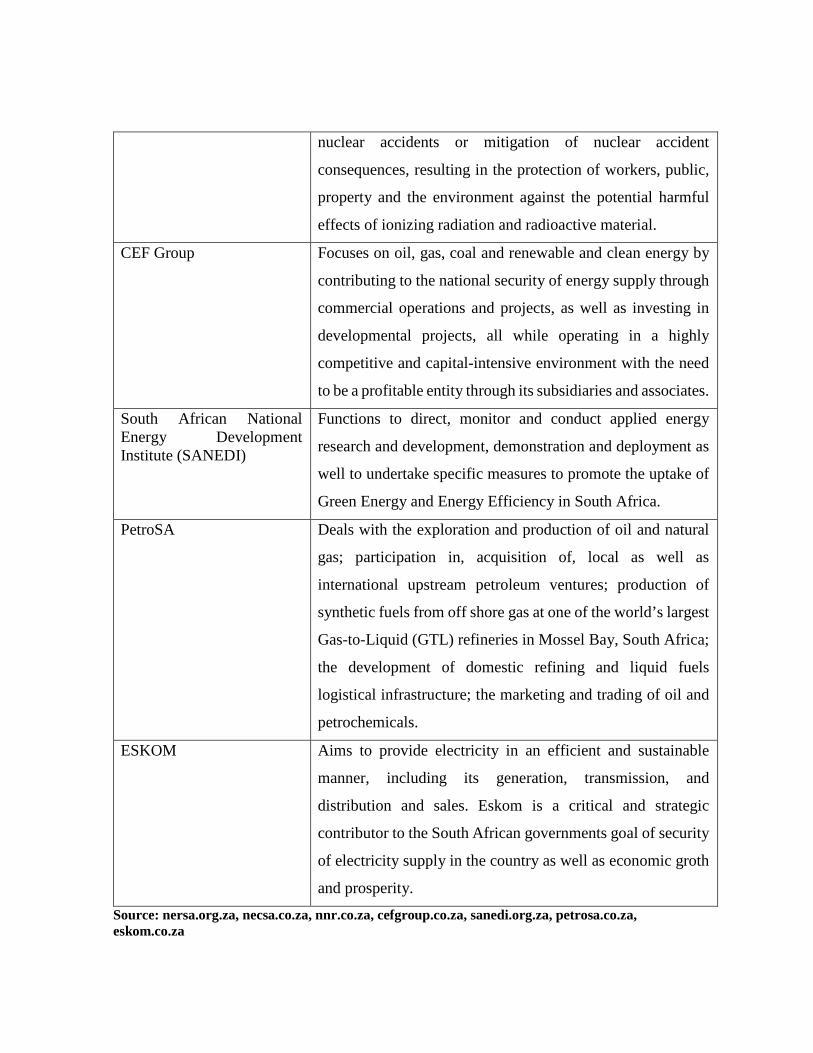
nuclear accidents or mitigation of nuclear accident
consequences, resulting in the protection of workers, public,
property and the environment against the potential harmful
effects of ionizing radiation and radioactive material.
CEF Group Focuses on oil, gas, coal and renewable and clean energy by
contributing to the national security of energy supply through
commercial operations and projects, as well as investing in
developmental projects, all while operating in a highly
competitive and capital-intensive environment with the need
to be a profitable entity through its subsidiaries and associates.
South African National Energy Development Institute (SANEDI)
Functions to direct, monitor and conduct applied energy
research and development, demonstration and deployment as
well to undertake specific measures to promote the uptake of
Green Energy and Energy Efficiency in South Africa.
PetroSA Deals with the exploration and production of oil and natural
gas; participation in, acquisition of, local as well as
international upstream petroleum ventures; production of
synthetic fuels from off shore gas at one of the world’s largest
Gas-to-Liquid (GTL) refineries in Mossel Bay, South Africa;
the development of domestic refining and liquid fuels
logistical infrastructure; the marketing and trading of oil and
petrochemicals.
ESKOM Aims to provide electricity in an efficient and sustainable
manner, including its generation, transmission, and
distribution and sales. Eskom is a critical and strategic
contributor to the South African governments goal of security
of electricity supply in the country as well as economic groth
and prosperity. Source: nersa.org.za, necsa.co.za, nnr.co.za, cefgroup.co.za, sanedi.org.za, petrosa.co.za, eskom.co.za

2.4 Eskom’s electricity predicament
In late 2007, South Africa started experiencing recurring bouts of power failures as a
result of the demand for electricity exceeding that which could only be supplied. According
to “Private Sector Investment in Infrastructure” by Jeffrey Delmon, load shedding is defined
as “... the offtake purchaser experiences an increase in demand so that even fast start
generation and frequency responsive generation cannot compensate, the offtake purchaser
may need to use demand shedding, or load shedding, by switching off demand centres or
decreasing provision as necessary to avoid the failure of other power plants. This would
require extremely rapid response by the project to offtake purchaser requirements and the
ability to modify output accordingly.” The world economic crisis of 2008 further
compounded the energy issue in South Africa with power cuts became more frequent and
with most lasting 2-3 hours/ times a day, which in turn affected the demand side sector,
particularly the mining industry (gold and platinum producers) and leading to sharp increases
in the price for precious metals (M&G, 2008; NY Times, 2008). Moreover, the primary issues
as to why there is load shedding can be attributed to there being a lack of capacity to generate
enough power and the inability to keep many of its plants working (ibid). Additional reasons
that contributed to the situation included poor management and the incompetence of Eskom’s
upper echelons to better handle the situation, although they still received their exorbitantly
high bonuses (Daily Maverick, 2012). Furthermore, other externalities that hindered
stabilizing the supply of electricity include over expenditure, delays to plants completion
such as Medupi and Kusile, as well the most recent pertaining to the 2014 collapse of the
Majuba silo which prohibited the delivery of coal to the plant (ibid). As a result of this,

mining and manufacturing are affected as they take time to restart operations, traffic is
congested, business as well as governmental institutions close and in turn this leads to a loss
in productivity, economic activity and international rating agencies downgrading the country
together with its SOE’s thus affecting the potential for future investment.
Eskom’s solution to curbing the problem at the time involved various supply side
mechanisms. For example, Hilary Joffe, the spokeswoman for Eskom at the time stated that,
“the power system is going to be tight for the next two years and the most effective way of
matching supply and demand is to reduce demand. (ibid)” In order to ease the situation,
Eskom monitors the demand and its ability to supply electricity to the public through the
PowerAlert system, which is a website that shows four different levels before load shedding
commences. These can be structured as;
Table 2.5: Advisory power levels
Green Grid power supply is stable. Efficient electricity use.
Green Grid power supply is limited. Switch off all unnecessary lights.
Yellow Grid power supply is strained. Switch off all unnecessary lights,
geyser and pool pump.
Red Grid power is severely under
pressure
Switch off all unnecessary lights,
geyser, pool pump and all other
appliances.
Black Grid requires power to be reduced, if not through energy saving load
shedding begins. Source: Eskom.co.za, poweralert.co.za

In conjunction with this initiative, Eskom also an Integrated Demand Management (IDM)
division. Their primary role was to ensure short-term security of electricity through multiple
programmes and initiatives with the objective of advising and replacing energy intensive
technologies, systems and processes with energy efficient solutions for business and
residential sectors (eskom.co.za).
However, load shedding continues to still be a hindrance which will continually
hurt the South African economy for the foreseeable future if management and technical
issues are not addressed, together with the long-term investment of other sources of energy.
The Economist published an article titled, “Unplugged – Rolling power cuts are fraying
tempers” which basically summed up that as long as the power cuts continue, the economy
will continually stay stagnant which in turn would be detrimental to both big industry and
small business for the foreseeable future. Moreover, President Jacob Zuma is noted as having
passed the blame of the country’s electricity situation on to apartheid seeing as energy
production was intended for the minority instead of the country as a whole (The Economist,
2015). He goes on to emphasize that since the ANC came to power significant progress has
been made in regard to providing electricity to at least 11 million homes since 1994, thus
highlighting the problem instead of providing viable solutions (ibid).

CHAPTER 3
THE COMPOSITION OF SOUTH AFRICA’S ENERGY MIX
“Sustainable development is a pattern of development that permits future generations to live
at least as well as the current generation, generally requiring at least a minimum
environmental protection” (Todaro & Smith, 2011). South Africa is a country that is well
endowed with multiple forms of energy generation, particularly with more emphasis based
on thermal energy to produce electricity from coal. These various energy sources, readily
available or remaining untapped, can be classified into two categories either as; Non-
Renewable and Renewable Energy Sources.
Non-renewable energy resources
In Energy Resources and Systems, by Ghosh and Prelas, Non-Renewable energy is
defined as, “a resource that is not replaced on a continuous basis or is replaced only very
slowly, but dependent completely on natural process.” These resources, better known as
fossil fuels consist of oil, coal, natural gas and uranium which is primarily used for nuclear
energy generation. All four sources play a major role in the composition of South Africa’s
total primary energy consumption. According to the Deloitte: Oil and gas taxation in South
Africa 2016 report, the country’s total primary energy generation capacity consisted of coal
(71%), oil (23%), natural gas (3%), nuclear (3%) and renewables (1%, primarily from
hydropower) (see Chart 3.1). As a vertically integrated SOE, Eskom deals with generation,
transmission and distribution of electricity to both South Africa and the Southern African
Development Community (SADC). In addition to producing approximately 95% of South
Africa’s electricity from a net max generating capacity of 41.9 GW through a transmission

and distribution network of 373 280 kilometers, Eskom also supplies electricity to industry,
mining, commercial, agricultural and residential customers (IEA, 2014; Matjila, 2014). Of
the 15 coal power stations mentioned, there are some which were recommissioned and
refurbished primarily with the objective of providing energy until Kusile and Medupi’s
construction is complete and ready to be to be connected to the grid and provide a combined
total of 9600 MW of installed capacity (eskom.co.za).
Chart 3.1: South Africa’s total primary energy consumption, 2015
Source: Deloitte: Oil and gas taxation in South Africa (2016)
Moreover, it is also important to take into account the variations of the demand for electricity
particularly during the summer (November to February) and winter (June to August) months
throughout South Africa (van Deventer, 2014: 88). Van Deventer also goes on to demonstrate
how the spikes in winter represent morning and evening times, and colder climates where
heating is in high demand. On the other hand, during summer demand grows gradually from
71%
23%
3% 3%1%
TOTAL PRIMARY ENERGY CONSUMPTION
Coal Oil Natural Gas Nuclear Renewables

the morning until it peaks in the afternoon, when appliances’ such as electric fans and air-
conditioning take precedence as cooling at that point in time is in high demand (ibid).
Diesendorf (2010) asserts that although it is very expensive to store large quantities
of electricity, power stations are required to match this demand as it varies throughout the
day. However, it also important to note that regardless of the design, no single type of power
station can solely supply enough electricity to match demand during the morning, afternoon
and the evening. Table 3.1 is meant to give a representation of what the demand for electricity
in a single day is like during the summer and winter months respectively, which vary on a
yearly basis and consist of various contributions particularly from base-, intermediate- and
peak-load power stations. In Greenhouse Solutions with Sustainable Energy by Mark
Diesendorf, various power stations can be categorized into three levels of output supply with
a brief definition of the properties of the aforementioned as;
Table 3.1: Functions of various power stations
1. “Base-load power stations are designed to run 24 hours a day, seven days per
week, at their rated power. They take all day to start up from cold and, in general,
their output cannot be ramped (changed up or down) quickly enough to handle
sharp peaks. Base-load power stations, especially coal fired, are cheap to operate,
but their capital costs are high.”
2. “Intermediate-load power stations fill the gap in supply between base- and peak-
load. They are more readily ramped than base-load, but less than peak-load. Their
operating costs lie between those of base- and peak-load. Sometimes,
intermediate-load is supplied by older, smaller coal fired stations and sometimes
by gas-fired stations.”

3. “Peak-load power stations are designed to be run for short periods of time each
day to supply the peaks in demand and to handle unpredictable fluctuations in
demand on time scales ranging from a few minutes to several tens of minutes. They
can be started rapidly from cold and their output can be ramped rapidly. Some
peak-load stations are gas turbines, similar to jumbo jet engines, fuelled by gas or
(rarely) by oil. They have high operating costs (mostly fuel), but low capital costs.
Hydro-electricity is also used to provide peak-load power. Because the amount of
water available is limited to that in the dam, the ‘fuel’ of a hydro power station
may also be considered to be expensive.” Source: Diesendorf, M. (2010). Greenhouse solutions with sustainable energy. Sydney NSW 2052: University of New South Wales Press Ltd.
Having briefly summed up the three levels of output supply, Table 3.1 is structured to give a
better understanding of the various power stations which provide South Africa with
electricity not only from coal, but also open cycle gas turbine and nuclear energy. As noted,
the installed capacity for Medupi and Kusile are new build stations which are not fully
functional as yet. However, the first unit (800MW) of Medupi was synchronized in March
2015 (Eskom.co.za).
Table 3.2: Eskom power station mix
Type Name Year (Age*) Installed Capacity
1.
Komati 1961-66 (mothballed 1987; recommissioned 2012)
1000MW
2. Camden 1967 (mothballed 1990; recommissioned between 2005 and 2008)
1600MW
3. Grootvlei 1969 (mothballed 1989/90; recommissioned 2008)
1200MW
4. Hendrina 1970-76 (refurbished between 1995 and 2003)
2000MW

5.
COAL Arnot 1975 (3 units mothballed
1992; recommissioned 1997 and 1998)
2100MW
6. Duvha 1975 3600MW
7. Kriel 1979 3000MW
8. Lethabo 1985 3708MW
9. Matla 1983 3600MW
10. Tutuka 1985 3654MW
11. Kendal 1993 4116MW
12. Majuba 1996 4107MW
13. Matimba 1998 3990MW
14. Kusile Under construction (first unit 2017)
(4800MW) (est.)
15. Medupi Under construction (first unit synchronized March 2015)
800MW (4800MW) (est.)
16. Open Cycle Gas
Turbine (OCGT)
Acacia 1976 171MW
17. Port Rex 171MW
18. Ankerlig 2007-2009 1327MW
19. Gourikwa 2007-2008 740MW
25. Nuclear Koeberg 1984 1800MW
TOTAL (excl. Kusile and Medupi) 42 684MW
Source: Eskom.co.za
Coal-fired base-load power stations, are intended to run continuously at its rated
power although this is not always the case. There have been instances on multiple occasions
according to Eskom whereby a station either unexpectedly breaks down or is deliberately
shutdown for planned maintenance. On the other hand, when demand for electricity on the
grid is very low, a coal-fired power station is most likely to be run at reduced power or shut
down.

Table 3.3: Properties of different types of conventional power stations
Type Fuels Capital cost (annualized)
Operating cost
(mostly fuel)
Ability to ramp output
Capacity factor
Base-load Coal,
nuclear,
gas
High Low Low High
Intermediate-
load
Coal, gas Medium Medium Medium Medium
Peak-load Gas, oil,
hydro
Low
(not hydro)
High High Low
Source: Diesendorf, M. (2010). Greenhouse solutions with sustainable energy. Sydney NSW 2052: University of New South Wales Press Ltd.
Table 3.2 is structured to correlate with Table 3.1 as it defines the type of plant according to
the type of fuel, the capital cost, operating cost, their ability to ramp output, as well as the
capacity factor of each.
Renewable energy sources
Renewable energy sources can be defined as, “any energy resource that is available
naturally on a continuous basis or can be continually generated over a short period of time;
which may be on a daily basis, or over several days, or several years” (Ghosh & Prelas,
2009). These sources, also known as renewables consist of solar, wind, hydropower,
geothermal, ocean (tidal) and biomass energy. Moreover, these sources can either be derived
from the suns radiation directly (thermal, photochemical and photoelectric), indirectly (wind,
hydropower and photosynthetic energy stored in biomass) or naturally from the environment

(geothermal and tidal energy) (ibid; Kreith, 2015: 56-63). South Africa’s renewable energy
industry is still relatively small, but slowly growing. As noted in Chart 3.1, renewables play
a very small role in the total primary energy consumption of South Africa accounting for
roughly 1%. Moreover, a significant share of the energy produced from renewables comes
from hydropower; in spite of the fact that South Africa, like many African countries is a water
stressed state.
Figure 3.1: World map of water stress by countries
Source: wri.org
The White Paper on Renewable Energy (2003) released by the Department of Energy clearly
states that their primary objective was to produce 10 000GWh of energy using renewable
energy sources such as biomass, wind, solar and small-scale hydro by 2013. By achieving
the target, this was expected to:

• “Add about 1. 667MW new renewable energy capacity, with a net impact on GDP as
high as R1. 071- billion a year”;
• “Create additional government revenue of R299-million”;
• “Stimulate additional income that will flow to low-income households by as much as
R128-million, creating just over 20 000 new jobs”; and
• “Contribute to water savings of 16.5-million kiloliters, which translates into a R26.6-
million saving” (DoE, 2003b).
Although this target was not achieved, the Department of Energy is still committed to
generating 18.2GW by 2030 using renewable sources such as;
Wind - 8.4GW
Solar PV - 8.4GW
CSP - 1GW
Other - 0.4GW (ibid).
Furthermore, the Integrated Resource Plan (IRP) for Electricity 2010-2030 plans to further
readjust South Africa’s long-term renewable energy mix by 40,5% in the near future.

Chart 3.2: Planned new renewable generation mix 2030
Source: energy.gov.za
Even though Eskom produces clean energy from the Sere Wind Farm Project which has a
total generating capacity of 100MW, there is still a notable demand for sustainable, clean
energy. Much of the energy that is being produced for mass consumption comes from few
Independent Power Producers (IPPs) whom sell the energy generated to Eskom. However,
the market for IPPs is still relatively small considering the fact that Eskom has a stronghold
on the South African energy market. In order to increase investment from the private sector
to Renewable Energy Independent Power Producer Procurement Programme (REIPPPP) was
introduced in order to encourage private investment to further develop South Africa’s
renewable energy sector. In order to determine how South Africa can achieve their long-term
goal of renewable energy sustainability, the following chapter will highlight how the
countries in the following chapter assimilated their respective energy mixes.
18%
5%
40%
37%
Planned new renewable generation mix 2030
Hydro
CSP
Wind
Solar PV

CHAPTER 4
A TALE OF TWO NATIONS
Pioneers of innovative energy sustainability
The world has become so interconnected and interdependent over time that globalization has
gradually come to be recognized as one of the most effective avenues to solving global issues.
This particular phenomenon transcends above and beyond national boundaries by not only
integrating economies and providing beneficial solutions’, but it also plays a role as a catalyst
in compounding complex problems on a global scale. The aforementioned can stem from
contributions such as trade, finance, environmental conservation, technological innovation,
terrorism and migration.
Fossil fuels are the lifeblood of an industrialized society, supplying most of its energy
needs. In recent years, the problems with these fossil fuels-including environmental damage,
unequal global distribution of fossil fuel resources, price instability, and ultimately supply
constraints-have led to a reexamination of their use and a search for alternatives (Komor,
2004: 1). Renewable energy-solar, wind, hydropower, and others-is a promising alternative
to fossil fuels. Considering that renewable energy is relatively clean and widely available,
they also come with limitations as they are intermittent. In this section, two countries will be
used as case studies considering the fact that one is European, one is Asian, they both have
developed economies, IEA and OECD member countries and, that they are both innovators
particularly in the non-renewable and renewables sectors. Furthermore, the issue of climate
change is one that affects each and every country in the world.

Profile:
Country: The Netherlands
Area: 41, 543 square kilometers
Population: 17, 016, 967 million (2016 est.)
Key sectors: Agriculture (1,6%), industry (17,8%), services (70,4%)
Sector theme: Energy
Key project identified: Electricity
Figure 4.1: Map of the Netherlands specifying location
Source: cia.gov
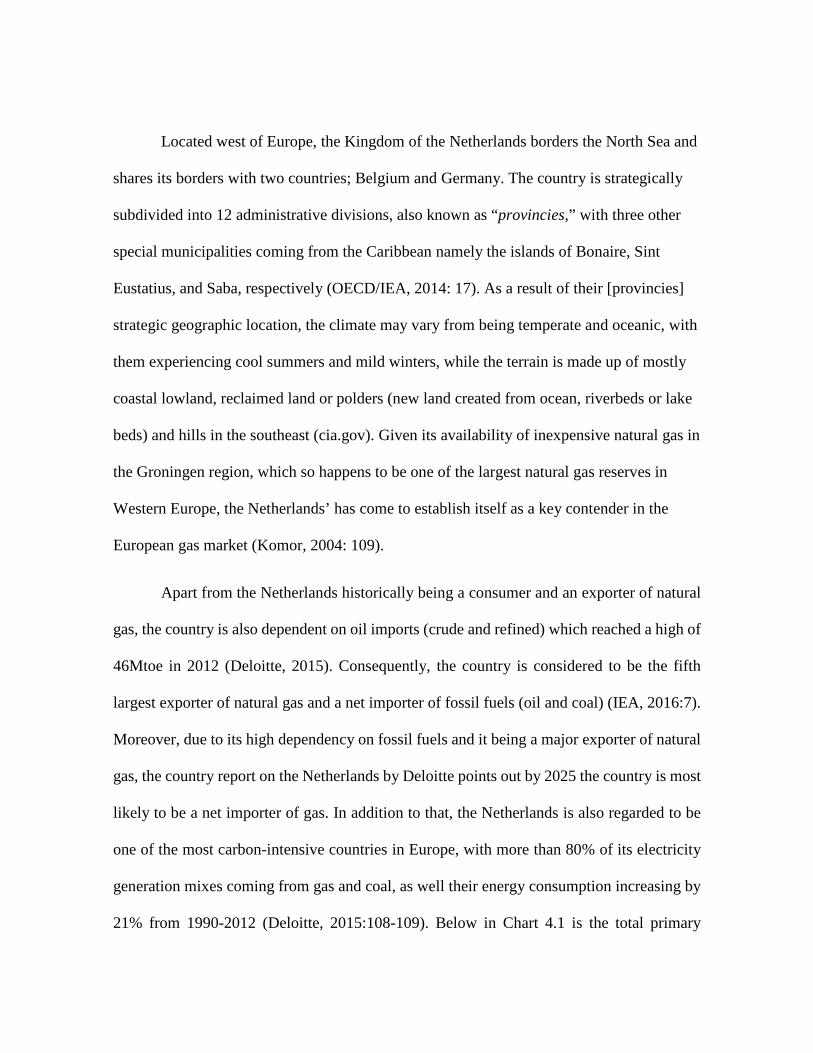
Located west of Europe, the Kingdom of the Netherlands borders the North Sea and
shares its borders with two countries; Belgium and Germany. The country is strategically
subdivided into 12 administrative divisions, also known as “provincies,” with three other
special municipalities coming from the Caribbean namely the islands of Bonaire, Sint
Eustatius, and Saba, respectively (OECD/IEA, 2014: 17). As a result of their [provincies]
strategic geographic location, the climate may vary from being temperate and oceanic, with
them experiencing cool summers and mild winters, while the terrain is made up of mostly
coastal lowland, reclaimed land or polders (new land created from ocean, riverbeds or lake
beds) and hills in the southeast (cia.gov). Given its availability of inexpensive natural gas in
the Groningen region, which so happens to be one of the largest natural gas reserves in
Western Europe, the Netherlands’ has come to establish itself as a key contender in the
European gas market (Komor, 2004: 109).
Apart from the Netherlands historically being a consumer and an exporter of natural
gas, the country is also dependent on oil imports (crude and refined) which reached a high of
46Mtoe in 2012 (Deloitte, 2015). Consequently, the country is considered to be the fifth
largest exporter of natural gas and a net importer of fossil fuels (oil and coal) (IEA, 2016:7).
Moreover, due to its high dependency on fossil fuels and it being a major exporter of natural
gas, the country report on the Netherlands by Deloitte points out by 2025 the country is most
likely to be a net importer of gas. In addition to that, the Netherlands is also regarded to be
one of the most carbon-intensive countries in Europe, with more than 80% of its electricity
generation mixes coming from gas and coal, as well their energy consumption increasing by
21% from 1990-2012 (Deloitte, 2015:108-109). Below in Chart 4.1 is the total primary

energy consumption of Netherlands which shows how dependent they are on fossil fuels,
considering that they import much of their oil and coal with renewables playing a very small
role with a combined share of 0,6%. However, one needs to understand what and how the
Dutch were successful in implementing their “green” electricity boon.
Prior to 1995 when the Dutch green electricity market was about to take off, the
market itself was characterized by a monopolistic and fragmented market construct.
(Agterbosch, 2006:45-47).
Chart 4.1: Netherlands total primary energy consumption, 2014.
Source: iea.org
Gas38%
Oil36%
Coal10%
Biofuels and waste13%
Nuclear1%
Wind0%
Solar0%
Other2%
Total primary energy consumption
Gas Oil Coal Biofuels and waste Nuclear Wind Solar Other

During this time (1989-1995), although the electricity companies were owned and controlled
by provincial and municipal authorities, they were able to generate electricity, connect high
voltage transmission, low voltage distribution and supply to the end users (ibid).
In Renewable Energy Policy, Paul Komor, gives a brief, detailed example as to how
the Dutch green electricity market was a success. The market began in 1995 with a pilot
program run by the Dutch utility PNEM. As a result, this lead to an innovative market
campaign by the World Wind Fund for Nature (WWF) whom restructured the electricity
market by giving residential and non-residential consumers electricity choice. (Komor, 2004:
109). This proved to be successful for a number of reasons, namely; 1) price – green
electricity cost about the same as brown electricity with non-green users having to pay an
“ecotax”, 2) the market being open to multiple providers and consumers having the choice
of choosing which product best suited them, 3) smart marketing in the form of sign-ups,
innovative approaches, as well as there being:
• “Heavy taxes on fossil-based electricity, green electricity is about the same price as
non-green electricity”,
• “The green market opened first, creating a competitive green market in advance of
overall competition”,
• “Dutch companies have used creative marketing techniques to promote green
electricity”,
• “In addition to fossil fuel taxes, the Dutch government has several other aggressive
policies that support renewable electricity” (ibid, Agterbosch, 2006).

In order to elaborate on the aforementioned steps to success, Table 4.1 will delve further into
briefly explaining the necessary steps that government took in order to achieve their goal of
sustainable green energy market.
Table 4.1: Factors behind green electricity market success
Price Due to green electricity products in the Netherlands costing roughly
the same as regular brown electricity, users of non-green electricity
pay a regulating energy tax known as an “ecotax.” This entitles
users to pay per-kilowatt-hour (kWh) according to their
consumption.
Choice Seeing as the market was opening up to multiple providers,
consumers could basically choose a green product that suited their
needs. As a result, this built on building brand awareness and
accommodating unsatisfied customers.
(e.g. – billing dispute, bad article review, “word of mouth”..etc.).
Smart marketing These include attracting sign-ups through innovative approaches
such as raising environmental awareness and the involvement of
various stakeholders.
(e.g. – Publicity campaign “Don’t let the North Pole melt.” On the
other hand, various companies using different methods such as
receiving food gift vouchers, international call vouchers and price
guarantees to users of green electricity.)
Policies • Tax exemptions for those investing in green funds.
• Accelerated depreciation for certain technologies.
• Tax credits for certain technology investments.
• Direct support payments to renewable generators’
• Green certificate trading system. Source: Komor, P. (2004). Renewable Energy Policy. New York: Diebold Institute for Public Policy Studies. iUniverse, Inc.

In the previous table, there is mention of “green certificates.” These accounting tools, also
known as tradeable renewable certificates (TRC’s), green tags or renewable obligation
certificates (ROC’s) are used to account for or monetize the environmental attributes of
renewable-sourced electricity generation. However, these come with various advantages,
namely: 1.) coming with widespread political support with little or no direct political
opposition; 2.) providers prefer them as they provide a new revenue system; 3.) offer
reasonable administrative costs; 4.) is a market mechanism that is economically efficient
(Komor, 2004: 110). From a disadvantage point of view, it points out that it is: 1.)
complicated to understand and implement; 2.) effects on renewables are largely unknown;
3.) unclear relationship with carbon or other pollutant trading, as well as 4.) international
trading raising difficult administrative and policy questions (ibid). As much as the green
market experienced a success in the Netherlands, results varied in other countries such as the
United Kingdom and the United States of America due to moderate-low participation/ sign-
up levels.
The Dutch power generation market is moderately concentrated with four main actors
(NUON/ Vattenfall, Essent/RWE, E.ON and Electrabel/ GDF SUEZ) who hold a significant
market share, managed 55% of installed power capacity in 2013 (Deloitte, 2015: 110;
Agterbosch, 2006: 50-53). Moreover, with the market being fully open to competition since
2004, and 2002 for industry, entry for large European vertically integrated companies (E.ON,
RWE, GDF and Vattenfall) entitled them to purchase assets from former national generation
and distribution companies such as NUON and Essent. As a result, Tennet which is the state
enterprise, is the sole national transmission system operator (TSO), while the distribution

network is operated by 8 distribution companies which are fully independent (provincial or
locally owned) and others which are independently governed, respectively.
Figure 4.1: Wind turbines
Source: Author
With the Netherlands moving away from the use of fossil fuels and looking to
increasing its production of renewables, its energy targets according to the Energy Agreement
for Sustainable Growth aims to have final energy consumption to come from renewable
energies by 14% in 2020 to 16% by 2023 (OECD/IEA, 2014:11). Wind Power is expected
to expand in the long-run, thus contributing to closing the renewable energy gap. In order to
do so there are various policies/ programmes (short- medium- long) which the Dutch

government has implemented and is continually improving in order to achieve their demand,
supply and environmental goals. These consist of:
• Energy Law of 1998
• Clean and Efficient Programme (2007)
• National Renewable Energy Action Plan (2011)
• Environmental Management Act (2013)
• Energy Agreement for Sustainable Growth (2013)
• National Energy Efficiency Action Plan (3rd NEEAP, 2014) (OECD/IEA, 2014: 23-
27).
Figure 4.3: Wind turbine
Source: Author

In order to certify that the aforementioned policies or programmes are properly regulated,
there are government institutions, regulatory authorities and organizations that all work
together for efficient implementation. For example, ministries such as that of Economic
Affairs; Housing Spatial Planning and Environment to name a few are closely involved in
energy and environmental policy. On the other hand, the Netherlands Authority for
Consumers and Markets (ACM) has regulatory powers to supervise electricity, natural gas
and district heating markets; while the organizations primarily deal with research and
development (R&D) (OECD/IEA, 2014: 22-23).
However, although the Netherlands is working towards producing clean, efficient
energy it has also encountered problems particularly in regard to renewables which include;
opposition to new capacity being built (politically), conflict between landowners and
neighbors’ (“visual intrusion” with no compensation) and shortages in renewable supply
leading to importing renewable electricity resulting in questioning as to whether it is
subsidized or not considering its point of origin? (Komor, 2004, 112). Thus, in order to handle
supply constraints, there is a need for further attention to be paid particularly towards policy
on both the supply and demand ends of the various energy markets.

Profile:
Country: Japan
Area: 377, 915 square kilometers
Population: 126, 702, 133 million (2016 est.)
Key sectors: Agriculture (1,2%), industry (27,7%), services (71,1%)
Sector theme: Energy
Key project identified: Electricity
Figure 4.4: Map of Japan specifying location.
Source: cia.gov

Located in Eastern Asia, Japan is a mountainous island chain located between the
North Pacific Ocean and the Sea of Japan, stretching as far as east of the Korean Peninsula.
Although it shares no borders with any other countries, its closest neighbors north-west off
of the Sea of Japan consist of Russia, China as well as North and South Korea. The country
is strategically subdivided into 47 administrative divisions, known as “prefectures,” with the
climate varying from being hot and tropical in the south to cool temperate and cold winters
in the north (cia.gov). As a result of its strategic geographic location, Japan’s terrain is mostly
rugged, with arable land covering a total area of roughly about 13% (cia.gov).
The island nation of Japan heavily relies on fossil fuel imports which contribute
towards a large share of its total energy supply, and as a result has placed energy security
as its primary priority. Consequently, this lead to Japan not only being a pioneer in the field
of energy technology development, but also made them one of the world’s largest
consumers and importers of energy, particularly in the liquified natural gas (LNG) trade (IEA,
2016: 9). In addition to that, the extensive use of nuclear energy throughout the decades
contributed exponentially not only towards Japans energy mix, but also its strong position
as one of the worlds’ leading economies, as well as the fifth largest electricity user (IEA,
2016: 9). Considering how important energy efficiency is for Japan, imports for fossil fuel
supply are seen as key to providing sufficient, efficient energy. However, the question
remains to be answered as to how they are able to achieving energy and environmental
protection. Below in Chart 4.2 is the total primary energy consumption of Japan which
points out how dependent they are on fossil fuels, with renewables in 2005 making up a

3.0% share of total primary energy supply (TPES) and merely increasing to 5.7% of TPES in
2015 (IEA, 2008: 148; IEA, 2016: 119).
Chart 4.2: Japan’s total primary energy consumption, 2015.
Source: iea.org
Apart from oil, coal, and natural gas making up a considerable portion of Japans energy mix,
renewables and nuclear energy make up a small fraction of the country’s TPES. Moreover,
the renewables consist of biofuels and waste (2,6%), hydro (1,7%), geothermal (0,5%), solar
(0,8%) and wind (0,1%) (IEA, 2016: 17). However, one needs to understand why it is that a
developed country such as Japan comprises of such a miniscule nuclear energy supply ratio
compared with other energy sources?
42.90%, 43%
27.50%, 27%
23.30%, 23%
0.60%, 1%5.70%, 6%
TOTAL PRIMARY ENERGY CONSUMPTION
Oil Coal Natural Gas Nuclear Energy Renewables

There are two reasons that point out as to why this may be the case, namely:
• Human security
• The Fukushima disaster.
According to the Commission on Human Security (CHS), the notion of “human
security” in its final report is defined as:
“…to protect the vital core of all human lives in ways that enhance human
freedoms and human fulfillment. Human security means protecting
fundamental freedoms – freedoms that are the essence of life. It means
protecting people from critical (severe) and pervasive (widespread) threats
and situations. It means using processes that build on people’s strengths
and aspirations. It means creating political, social, environmental,
economic, military and cultural systems that together give people the
building blocks of survival, livelihood and dignity.” (un.org).
Moreover, as a people-centered concept, human security threats involve economic, food,
health, environmental, personal, community and political security. Thus, the aforementioned
threats are in one way or another interlinked, with those in Japan, particularly economic and
environmental taking precedence over the others. However, as mentioned before, securing
efficient, sustainable energy is the is the key determinant in assessing the economic
development and the environmental impact.
With the first commercial nuclear power plant operational in 1966; nuclear power was
considered as complementary in regard to its energy mix, while on the other hand it was seen

as an alternative to fossils fuels on the subject of clean air (Bae & Maruyama, 2015: 105). As
a result, from 1966 to 2005, the number of nuclear reactors was on the rise until it reached a
total of 55 nationwide (ibid). These contributed toward security in terms of supply, improving
economic performance and reducing GHG. Although nuclear plants produce electricity
without releasing any GHG, the downside to using it as an energy source is that it produces
radioactive waste which may pose as a serious long-term concern regarding the safety and
environmental aspect of human security.
March 11, 2011 marked a turning point in regard to nuclear power, particularly
toward policy implementation, considering that policymakers were tasked with undertaking
an in-depth review of the current state of affairs and how this would affect the country’s
energy supply. The Great East Japan earthquake, which triggered a tsunami, disabled and
partially if not completely destroyed a majority of the reactors at the Fukushima Daiichi
nuclear power plant. Unlike, the Three Mile Island accident (1979) and the Chernobyl
accident (1986) which resulted from a cooling malfunction and a flawed reactor design, as
well as inadequately trained staff, respectively; the Fukushima disaster was a consequent of
a natural disaster which in turn incapacitated 3 reactors causing their cores to completely
melt, thus producing and releasing high levels of radioactive waste (world-nuclear.org). As
a result, the government ordered the shutdown of all its nuclear reactors, which lead to:
• 30% gap in electricity supply (closed by LNG, coal and oil; in part by renewables and
electricity savings).
• Dependence on fossil fuels rising from 80% - 94% (2010 - 2013).

• Annual carbon dioxide emissions had rising by more than 110 million tonnes (IEA,
2016: 9).
However, prior to the 2011 Fukushima disaster, in 2009 Japan attended the 15th Conference
of Parties (COP 15) in Copenhagen, Denmark, where they pledged to reduce its GHG
emissions by 25% (1990 - 2020), hence, increasing the nuclear power share from 30% - 50%
(ibid).
With Japan having envisioned their long-term energy objectives sidetracked as a
result of the disaster and the temporary closure of their nuclear power plants, their goal of
reducing their GHG emissions in the specified timeframe seemed highly unlikely. This can
be attributed to the significant drop in nuclear energy supply in a short space of time, which
raised concerns among demonstrators regarding their safety and calls for the complete
termination of the of nuclear power generation by 2030 considering that reliance on fossil
fuels is too costly for government in the medium to long-term. On the other hand,
policymakers had the daunting task of reanalyzing their energy policies which comprise of:
• Third Strategic Energy Plan (2010)
• Fourth Strategic Energy Plan (2014)
• Long-term Supply and Demand Outlook to 2030 (2015)
• National Energy and Environment Strategy for Technological Innovation Towards
2050 (2016) (ibid, 22).
Although the Japanese government had intended on implementing the 3rd Strategic Energy
Plan which sought to expand the share of nuclear and renewable resources up to 70% by

2030, the unforeseen events of March 11, 2011 resulted in it being superseded by the 4th Plan
(ibid).
Thus, the aforementioned policies were structured with the objective of;
1. “Smaller role for nuclear energy than the 2010 plan”,
2. “Reductions in demand through energy efficiency, reform, and deregulation of both
the electricity and gas markets”,
3. “Accelerated deployment of innovative technologies in renewable energy, solar and
wind in particular”,
4. “Optimization of the oil refining and distribution industry”,
5. “Promotion of efficient coal-fired power plants”,
6. “Robust investment in advanced energy research and development”,
7. “Creation of a strong safety culture in a smaller nuclear industry.” (ibid, 23-24;
meti.go.jp).
Japan has a well-organized, structured governing body of organizations, regulatory
authorities and various government institutions which are interconnected, if not autonomous,
to work together towards implementing sound programmes and policies. Table 4.2 will
provide a list of the various institution and what each of their functions or specialty is.
Table 4.2: Japan’s Regulatory bodies
Ministry of Economy Trade and
Industry (METI)
“has the overall responsibility for energy policy in
Japan.”
Agency for Natural Resources
and Energy (ANRE)
“in charge of comprehensive energy policies to ensure
strategic energy security, realize an efficient energy

supply and promote environment friendly energy
policies.”
Ministry of the Environment “climate change and air pollution mitigation.”
Ministry of Education, Culture,
Sports, Science and Technology
“certain areas of energy research and development.”
Ministry of Land, Infrastructure,
Transport and Tourism
“energy efficiency.”
Ministry of Foreign Affairs “resource diplomacy.”
Electricity and Gas Market
Surveillance Commission
(EGC)
“monitors the electricity, gas and heat markets.”
“enforces strict regulations to ensure the neutrality of
electricity networks.”
“It can suggest policy recommendations to the minister
regarding rulemaking in the market.”
Japan Fair Trade Commission
(JFTC)
“responsible for monitoring competition in all sectors
of the economy.”
Nuclear Regulation Authority
(NRA)
“independent body in charge of protecting the general
public and the environment through rigorous and
reliable regulation and oversight of nuclear activities.” Source: iea.org
As much as Japan is working towards reducing the GHG emissions by 2030, the
country is still very much dependent on fossil fuels. Although it is continually working
towards further promoting renewable energy, this is not an easy task as their energy policy’s
primary objective is to create sustainable, efficient energy through nuclear development.
However, the current nuclear infrastructure requires thorough inspections and monitoring as
they slowly plan to gradually decrease the use of nuclear energy. Those opposed to nuclear
power have voiced their opinion that nuclear power generation should be abolished by 2030.

This leaves Japan in quite a predicament, as they will have to find other alternatives
and other technological advancements’ in regard to fossil fuels to reduce the GHG emission
targets. Furthermore, careful attention to policy is imperative towards energy development.

CHAPTER 5
Lessons learned
The Netherlands’ and Japan are two countries that share a commonality in energy
dependency on fossil fuels such as natural gas and nuclear power, respectively. Both of the
aforementioned countries, although high GHG emitters, have found or are finding innovative
ways of generating efficient, sustainable energy through sound energy policies.
As much as the majority of energy generation for the Netherlands (natural gas – 38%;
oil – 36%; coal – 10%) and Japan’s (natural gas – 23%; oil – 43%; coal – 28%) coming
from fossil fuels, these countries are working toward reducing their reliance on one or more
of the energy sources mentioned. For example, considering that the Netherlands produces
natural gas, it is investing in renewables (particularly wind) as natural gas is eventually going
to run out.
Similarly, Japan on the other hand is also working towards reducing their reliance on the
importation of oil which has gradually become an expensive commodity. As a result, they
have also resorted to stock piling barrels of oil in the event of an energy crisis, hence, the
Fukushima disaster. Moreover, the eventual phasing out of nuclear energy power and the
transition of renewable energy in the long-run is seen as imperative from various perspectives.
In order for this to be viable, both countries have various institutions’ which regulate,
cooperate, as well as provide research and development which contribute towards a common
purpose. By doing so, they are able to draft and implement energy policies which are
environmentally friendly, economically feasible and socially accepted.

Energy policy recommendations
South Africa has been and will always be an energy intensive country. Looking at the
various sectors that contribute towards the country’s economy, coal like many other fossil
fuels, still have a major role to play in growing the economy and maintaining its hegemonic
status. However, the country does need to reduce its reliance on coal by increasing its energy
mix, particularly in regard to nuclear and more importantly renewables (wind, solar/
concentrated solar power – CSP/ biomass...etc.). Having analyzed case studies of both the
Netherlands and Japan, South Africa has much to learn from both considering their
backgrounds in renewable and nuclear energy development, as well as policy implementation
methods. In order to do so, South Africa must;
Decentralize its energy generating, transmission and distribution systems,
As a result of decentralization, the provinces should be autonomous in regard to operating
infrastructure and generating their own electricity (comparative advantage in regard to
producing electricity from a particular energy source of that region) ,
Nationally liberalize the energy market for various utility companies,
By heavily taxing brown energy (coal, oil…etc.) for non -residential consumers according to
their GHG emissions,
Promote green energy to be a choice for various users, according to their socioeconomic
status,

Adopt and promote policies that provide incentives for both residential and non – residential
users, such as “price guarantees’” as well as “green certificates” similar to those used in the
Netherlands,
Government also needs to implement short, medium and long-term energy policy objective
which should be reviewed every 2, 4 and 8 – year basis, respectively (primarily to determine
whether the objectives on a local, national and an international level are being met and if not,
how they can be attained),
Finally, government (departments) need to constantly communicate with other departments,
agencies, organizations’ and involve the public on decisions involving energy expenditure as
well as policy proposals (transparency).

Bibliography
AGTERBOSCH, S. (2006). “Empowering wind power: On social and institutional
conditions affecting the performance of entrepreneurs in the wind supply market in
the Netherlands.” Copernicus Institute for Sustainable Development and
Innovation. https://dspace.library.uu.nl/handle/1874/14051
BAE, S, & MARUYAMA, M. (2015). “Human security, changing states and global
responses: institutions and practices.” New York. Routledge.
BEARAK, B. & DUGGER, C. W. (2008). “Power Failures Outrage South Africa.” The
New York Times.
http://www.nytimes.com/2008/01/31/world/africa/31safrica.html?_r=0
EBERHARD, A. et al. (2014). “South Africa’s Renewable IPP Procurement Program:
Success Factors and Lessons.” PPIAF.
http://www.gsb.uct.ac.za/files/ppiafreport.pdf
EDKINS, M. et al. (2010). “South Africa’s renewable energy policy roadmaps.” Energy
Research Center, University of Cape Town.
https://open.uct.ac.za/bitstream/item/19473/Edkins_South_Africa_039_s_renewable
_2010.pdf?sequence=1
GALATSIDAS, A. & SHEEHY, F. (2015). “What have the millennium development goals
achieved?” theguardian.com. Web. 14 Jan. 2017.
https://www.theguardian.com/global-development/datablog/2015/jul/06/what-
millennium-development-goals-achieved-mdgs

GHOSH, T.K., & PRELAS, M.A. (2009). “Energy Resources and Systems: Volume 1:
Fundamentals and Non-Renewable Resources.” Japan. Springer Science + Business
Media B.V.
HLONGWANE, S. (2012). “Hey Eskom, remember 2008?” Daily Maverick.
https://www.dailymaverick.co.za/article/2012-01-12-hey-eskom-remember-2008/
KOMOR, P. (2004). “Renewable Energy Policy.” New York. Diebold Institute for Public
Policy Studies. iUniverse, Inc.
MATJILA, C. (2014). “Eskom Integrated Results for the year ended 31 March 2014.”
[PowerPoint slides]. Retrieved from
http://www.eskom.co.za/OurCompany/MediaRoom/Documents/IRpresentation2014
NEWBERY, D., & EBERHARD, A. (2007). “South African Network Infrastructure
Review: Electricity.” World Bank.
http://www.gsb.uct.ac.za/files/saelectricitypaper08.pdf
PETRIE, B. & MACQUEEN, D. (2013). “South African biomass energy: little heeded but
much needed.” International Institute for Environment and Development.
http://pubs.iied.org/pdfs/17165IIED.pdf
REIG, P. et al. (2013). “World’s 36 Most Water-Stressed Countries.” wri.org.
http://www.wri.org/blog/2013/12/world%E2%80%99s-36-most-water-stressed-
countries

THOMSON, S. (2016). “What are the Sustainable Development Goals?” weforum.org.
Web. 15 Jan. 2017. https://www.weforum.org/agenda/2015/09/what-are-the-
sustainable-development-goals/
TODARO, M. P. & SMITH, S. C. (2011). “Economic Development.” England. Addison-
Wesley: Pearson Education Limited.
van DEVENTER, A. (2014). “South African power system status overview.” 64th AMEU
Convention 2014. http://www.ee.co.za/wp-content/uploads/2014/11/AMEU-
Convention-2014-p87-89.pdf
WINKLER et al. (2006). “Energy Policies for Sustainable Development in South Africa:
Options for the future.” Energy Research Centre. (2006) 1-190.
https://open.uct.ac.za/bitstream/handle/11427/16747/Winkler_Energy_policies_for_
2006.pdf?sequence=1
WINKLER, H. & MARQUAND, A. (2009). “Changing development paths: From an
energy-intensive to low-carbon economy in South Africa.” Climate and
Development 1. (2009) 47-65.
http://dspace.africaportal.org/jspui/bitstream/123456789/33709/1/09Winkler-
Marquard_Changing_devt_paths.pdf?1

WOLPE, P. & REDDY, Y., (2015). “The contribution of low-carbon cities to South
Africa’s greenhouse gas emissions reduction goals: Briefing on urban energy use
and greenhouse gas emissions.” sei-international.org. https://www.sei-
international.org/mediamanager/documents/Publications/Climate/Cities-low-
carbon-future-2015-South-Africa-briefing.pdf
“Chernobyl Accident 1986.” (2016). world-nuclear.org. http://www.world-
nuclear.org/information-library/safety-and-security/safety-of-plants/chernobyl-
accident.aspx
“Coal Information 2006.” (2006). International Energy Agency (IEA). OECD Publishing,
Paris. DOI: http://dx.doi.org/10.1787/coal-2006-en
“Coal information: Key coal trends 2016.” (2016). International Energy Agency (IEA).
iea.org.
http://www.iea.org/publications/freepublications/publication/KeyCoalTrends.pdf
“Coal resources.” Department of Energy. energy.gov.za.
http://www.energy.gov.za/files/coal_frame.html
“Coal.” Chamber Of Mines of South Africa. Chamberofmines.org.za.
http://www.chamberofmines.org.za/sa-mining/coal
“Economic trends: Key trends in the South African economy.” (2014). Industrial
Development Corporation (IDC). idc.co.za.
http://www.idc.co.za/images/download-files/research-
reports/Economic_Trends_Key_trends_in_SA_economy_March_2014.pdf
“Economic trends: Key trends in the South African economy.” (2015). Industrial
Development Corporation (IDC). idc.co.za.
http://www.idc.co.za/images/download-files/research-
reports/key_trends_sa_economy_mar_2015.pdf
“Economic trends: Key trends in the South African economy.” (2016). Industrial
Development Corporation (IDC). idc.co.za.
https://www.idc.co.za/images/download-files/economic-overviews/RI-publication-
Keytrends-in-SA-economy_March2016.pdf
“Energy Efficiency Strategy.” (2005). Department of Minerals and Energy. energy.gov.za.
http://www.energy.gov.za/files/esources/electricity/ee_strategy_05.pdf
“Energy market reform in Europe. European energy and climate policies: achievements
and challenges to 2020and beyond.” (2015). Deloitte.
https://www2.deloitte.com/content/dam/Deloitte/global/Documents/Energy-and-
Resources/gx-er-energy-market-reform-in-europe.pdf

“Energy Policies of IEA Countries: Japan – 2008 Review.” (2008). International Energy
Agency (IEA).
https://www.iea.org/publications/freepublications/publication/Japan2008.pdf
“Energy Policies of IEA Countries: Japan – 2016 Review.” (2016). International Energy
Agency (IEA).
http://www.iea.org/publications/freepublications/publication/EnergyPoliciesofIEAC
ountriesJapan2016.pdf
“Fukushima Accident.” (2017). world-nuclear.org. http://www.world-
nuclear.org/information-library/safety-and-security/safety-of-plants/fukushima-
accident.aspx
“Greenhouse gas emissions.” (2013). Department of Environmental Affairs. deat.gov.za.
http://soer.deat.gov.za/172.html
“Human Security in Theory and Practice – An Overview of the Human Security Concept
and the United Nations Trust Fund for Human Security.” (2009). United Nations.
un.org.
http://www.un.org/humansecurity/sites/www.un.org.humansecurity/files/human_sec
urity_in_theory_and_practice_english.pdf
“Integrated Energy Plan.” (2003a). Department of Minerals and Energy. energy.gov.za.
http://www.energy.gov.za/files/media/explained/statistics_intergratedenergyplan_20
03.pdf

“International Energy Outlook 2016.” (2016). US Energy Information Administration
(EIA). eia.gov. 73-75. https://www.eia.gov/outlooks/ieo/pdf/0484(2016).pdf
“Japan.” (2017). Central Intelligence Agency. cia.gov.
https://www.cia.gov/library/publications/the-world-factbook/geos/ja.html
“Long-term Energy Supply and Demand Outlook.” (2015). Ministry of Economy, Trade
and Industry (METI). meti.go.jp.
http://www.meti.go.jp/english/press/2015/pdf/0716_01a.pdf
“Netherlands.” (2017). Central Intelligence Agency. cia.gov.
https://www.cia.gov/library/publications/the-world-factbook/geos/nl.html
“Per capita carbon emissions.” 2013. Department of Environmental Affairs. deat.gov.za.
http://soer.deat.gov.za/612.html
“Prepare for a month of load shedding.” (2008). Mail & Guardian.
http://mg.co.za/article/2008-01-29-prepare-for-a-month-of-loadshedding
“Renewable Energy.” 2003b. Department of Minerals and Energy. energy.gov.za.
https://unfccc.int/files/meetings/seminar/application/pdf/sem_sup1_south_africa.pdf
“South Africa.” (2017). Central Intelligence Agency. cia.gov.
https://www.cia.gov/library/publications/the-world-factbook/geos/sf.html

“State of Renewable Energy in South Africa.” (2015). Department of Energy.
http://www.gov.za/sites/www.gov.za/files/State%20of%20Renewable%20Energy%
20in%20South%20Africa_s.pdf
“The Impact of Global Coal Supply on Worldwide Electricity Prices – Overview and
comparison between Europe, the United States, Australia, Japan, China and South
Africa.” (2014). IEA Insight Series 2014.
https://www.iea.org/publications/insights/insightpublications/ImpactGlobalCoalSup
ply_WorldwideElectricityPrices_FINAL.pdf
“The Millennium Development Goals Report 2015.” (2015). un.org.
http://www.un.org/millenniumgoals/2015_MDG_Report/pdf/MDG%202015%20re
v%20(July%201).pdf
“The Sustainable Development Goals Report 2016.” (2016). un.org.
https://unstats.un.org/sdgs/report/2016/The%20Sustainable%20Development%20G
oals%20Report%202016.pdf
“Three Mile Island Accident.” (2012). world-nuclear.org. http://www.world-
nuclear.org/information-library/safety-and-security/safety-of-plants/three-mile-
island-accident.aspx

“Unplugged – Rolling power cuts are fraying tempers.” (2015). The Economist.
http://www.economist.com/news/middle-east-and-africa/21637396-rolling-power-
cuts-are-fraying-tempers-unplugged
CEF Group. http://www.cefgroup.co.za/
Constitution of the Republic of South Africa, Act 108 of 1996.
http://www.justice.gov.za/legislation/constitution/SAConstitution-web-eng.pdf
ESKOM. http://www.eskom.co.za/Pages/Landing.aspx
General Assembly resolution 55/2, (2000). United Nations Millennium Declaration,
A/RES/55/2, http://www.un.org/millennium/declaration/ares552e.pdf
National Energy Regulator of South Africa (NERSA). http://www.nersa.org.za/
National Nuclear Regulator (NNR). http://www.nnr.co.za/
PetroSA. http://petrosa.co.za/Pages/Home.aspx
South African National Energy Development Institute (SANEDI).
http://www.sanedi.org.za/
South African Nuclear Energy Corporation (NECSA). http://www.necsa.co.za/
Top Related