


Languages
Pages
Legal


1
Pretoria Portland Cement Company Limited
Beyond 2010Unaudited interim results
for the half-year ended 31 March 2009

2
2009 – A TALE OF 2 HALVES
1ST HALF 2009
Picture
• Group financial overview• Cement
• Market• Production and costs• Capital projects
• Lime and aggregates
Precast Yard for the Gautrain

3
H1 2009 - Financial Highlights
• Revenue R3.26bn 12% [R2.92bn]
• EBITDA* R1.24bn 5% [R1.18bn]
• EBITDA margin* 38.2% [40.5%]
• Cash generated from operations R1.03bn (7%) [R1.11bn]
• Operating profit* R1.10bn 2% [R1.08bn]
• Interim dividend 45 cps [45 cps]
* Excluding impact of the BBBEE IFRS 2 charges

4
H1 2009 – Summary Income Statement
2009R million
2008R million
% Change
Revenue 3 261 2 919 12
EBITDA 1 245 1 181 5
Depreciation and amortisation (145) (104) 38
BBBEE IFRS 2 charges (487) -
Operating profit 613 1 077 (43)
Finance costs (180) (57) (216)
Investment income 39 59 (34)
Profit before exceptional items 472 1 079 (56)
Exceptional items - 1
Share of associate’s retained profit 4 7
Taxation (363) (413) (12)
Profit for the period 113 674 (83)
HEPS (cents) (excluding BBBEE IFRS 2 charges) 105.4 125.6 (16)
CASH EARNINGS PER SHARE (cents) (excl. BBBEE IFRS 2 charges) 101.4 104.3 (3)
DPS (cents) 45 45 -

5
H1 2009 – Summary Balance Sheet
ASSETS2009
R million2008
R million
Non-current assetsProperty, plant and equipment 3 114 2 487Other 384 398
Current assets Inventories 482 336Trade and other receivables 857 756Cash and cash equivalents 374 468
TOTAL ASSETS 5 211 4 445EQUITY AND LIABILITIES Capital and reserves 166 1 298
Non-current liabilities
Long-term borrowings 2 627 68
Deferred taxation 340 165
Provisions and other non-current liabilities 207 127
Current liabilities Short-term borrowings 1 237 2 161
Trade and other payables 634 626TOTAL EQUITY AND LIABILITIES 5 211 4 445

6
H1 2009 - Summary Cash Flow Statement
2009R million
2008R million
Cash flow from operating activities
Operating cash flows before movement in working capital 1 258 1 194
Net investment in working capital (232) (88)
Net (finance costs) / investment income (97) 9
Taxation paid (398) (555)
Cash available from operations 531 560
Capital investment and other movements (396) (433)
Net funding raised 2 156 795
BBBEE – Trust’s shares consolidated as treasury shares (1 185) -
Acquisition of treasury shares (by PPC subsidiary) - (589)
Net cash flow before dividends paid 1 106 333
Dividends paid (956) (1 166)
Net cash inflow/(outflow) 150 (833)
Deferred tax benefit of Batsweledi
Cement/ clinker low last year end + maintenance items

7
• HEPS -16% (excl. BEE charges)
• Sales volumes• Regional cement sales -6%• Lime burnt product -36% and Operating Profit down 60%
• Input cost pressures peaked• Cement R/t delivered cost ~24% Y-on-Y (but moving down)
• Operations• Dwaalboom kiln2 performing - 3 old inland kilns shut-down to match demand
• Cash finance charges/ investment income (net):• R97m on increased borrowings – mainly expansion projects related
H1 2009 – Financial Overview
• Continued strong cash generation• Cash generated from operations and EBITDA +5%

8
H1 2009 - Segmental Analysis*
n.b. Dwaalboom K2 depreciation R32m 2009R million
2008R million
% change 2008Year
Cement
EBITDA 1 168 1 056 10.6% 2 281
EBITDA margin 40.3% 42.0% -1.7% pts 42.5%
Operating profit 1 043 970 +7.5% 2 100
Lime
EBITDA 46 90 -48.9% 167
EBITDA margin 19.2% 31.4% -12.2% pts 27.9%
Operating profit 31 77 -60% 141
Aggregates
EBITDA 31 35 -11.4% 93
EBITDA margin 25.0% 28.9% -3.9% pts 33.1%
Operating profit 26 30 -13% 82
GROUP
EBITDA 1 245 1 181 +5.4% 2 541
EBITDA margin 38.2% 40.5% -2.3% pts 40.7%
Operating profit 1 100 1 077 +2.1% 2 323
* Excluding impact of BBBEE IFRS 2 charges

9
H1 2009 - Cement – Industry Regional Sales
• Regional industry cement volumes for the 6 months down 7.5%
• Mpumalanga +8.6%, Botswana +14.2%
• Gauteng -15.5%, Western Cape -21.0%
• Construction sector +12% indicating demand from infrastructure projects
• Number of infrastructure projects now taking cement
• Medupi power station & area (H1 ~50 000 tons), Gauteng, Mpumalanga & Limpopo road upgrades
• Major projects recently started
• Kusile power station, Ingula pumped storage
• Industry clinker and cement imports down to almost nothing

10
H1 2009 - Cement – Industry Imports
Cement and Clinker Imports
20
40
60
80
100
120
140
160
180
Mar-07
May-07
Jul-07
Sep-07
Nov-07
Jan-08
Mar-08
May-08
Jul-08
Sep-08
Nov-08
Jan-09
Mar-09
kt
0%
2%
4%
6%
8%
10%
12%
14%
16%
18%Clinker
Cement
% of Regional Sales
700kt less imports in period under review = 11% of regional sales

11
H1 2009 - Cement – PPC Regional Sales
• PPC Regional sales -6%
• Preferred supplier to most major infrastructure projects
• Re-entered some exports markets – but Rand strength making it less profitable
• Partially offset decline in the coastal markets
• Sold 23 000 tons clinker
• Dwaalboom kiln 2 production allowed the planned shutdown of 3 older kilns
• Jupiter, Hercules kilns 4 & 5
• average 39 yrs old
• De Hoek kiln 5 running intermittently – lower demand in Western Cape

12
H1 2009 – PPC - Cement - Input Cost Increases
Ranked in order of total impact –Rand/ ton cement
% change vs H1 ‘08
Road distribution costs 24%
(Diesel) 13%
Coal (delivered) 63%
Maintenance 28%
Packaging 25%
ESKOM/ Municipal Power 39%

13
H1 2009 – Cement – Distribution cost increase
• Complex logistics in Q1 –• Market tightness generally made optimisation difficult• Transported cement from the W. Cape when inland competitor shortage developed
in Nov & Dec’08
• Excess dedicated transport fleet – has been downsized to match demand• Some diesel reduction has been gained since January/ February• Market transport rates have recently been trending softer (other than diesel
costs)

14
H1 2009 - Dwaalboom Kiln 2 Progress
• Finished cost will be within budget• Regularly achieves daily output above
design capacity • To April kiln has produced 400 000t of
clinker (500 000 tons cement equivalent)
• Achieved 83% availability in April• Cash cost benefits exciting! Covered
on slide 22
Dwaalboom Kiln 2

15
H1 2009 - Capital Projects Progress
• Ntšhafatso (Hercules) mill upgrade• 330 kt/yr additional capacity• Construction delays• Output now only expected FY10• Capex increase of R95 m -
• Geotechnical/ piling problems• Major escalations in contracts• Clinker silo/ congested area delays• Some increased scope
• Se Kïka (Riebeeck West) new 1,25mt/yr factory
• Nett additional capacity 700 kt/yr• EIA report submitted, approvals
awaited• Limited Capex likely in 2010
New Vertical Roller Mill – Hercules

16
H1 2009 - Lime and Aggregates
• Burnt product sales -36% due to lower demand from steel• Q1 worst affected in line with lowest steel producing quarter• Improvement expected in H2 09 as destocking cycle concludes• World Steel Association predicting 2009 global demand decline at -14.9%
• Recent significant energy cost increases being recovered through long term supply contracts price adjustments
• Aggregate volumes -10%• Reduced demand for metallurgical stone from steel industry• Tighter market in Gauteng partially offset by demand from road construction• Strong demand experienced in Botswana partially off-setting Gauteng decline
17
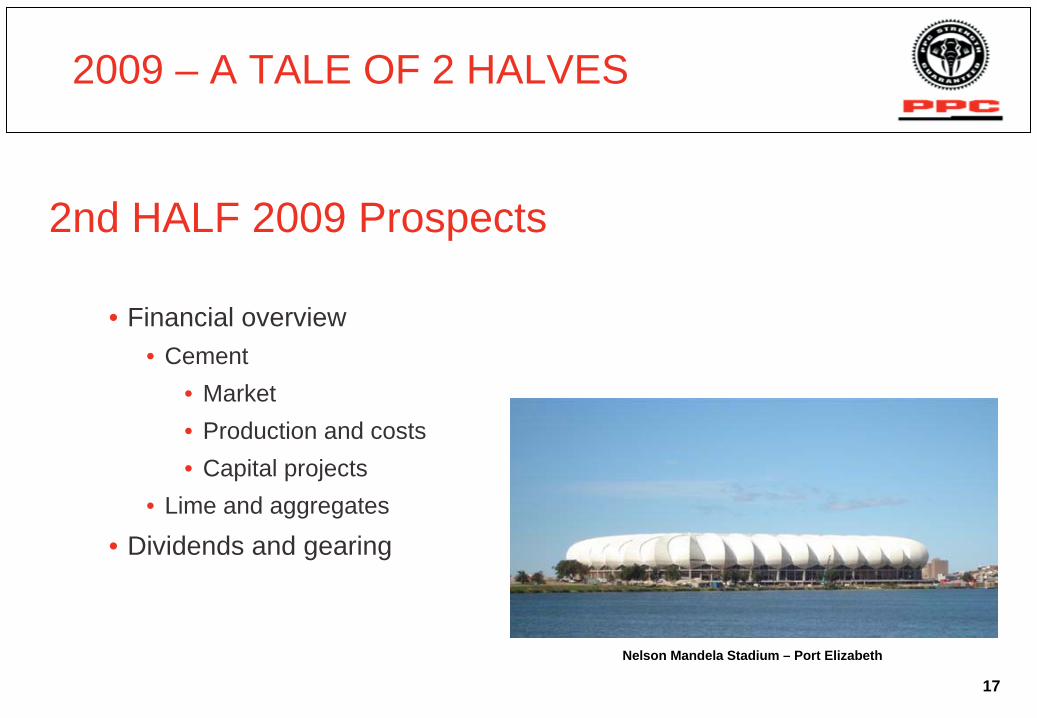
2009 – A TALE OF 2 HALVES
2nd HALF 2009 Prospects
• Financial overview• Cement
• Market• Production and costs• Capital projects
• Lime and aggregates
• Dividends and gearing
Nelson Mandela Stadium – Port Elizabeth

18
2009 - Prospects – Regional Cement Demand
• Civil Construction• R787bn Government infrastructure spend over next 3 years• New regime must now deliver on housing and services
• Tokyo Sexwale appointment to head up Dept. of Human Settlement• Housing Development Agency created and funded to acquire land
• Major infrastructure projects in progress or about to start
• Building - Residential• Interest rates 3.5 percentage points off peak, still very high real interest rates and encouraging
carry trade funds creating Rand strength• Further interest rate cuts inevitable? Or exports and especially mining will continue to shrink• SARB concerned about debt stressed consumers
• Building – Non residential • Hotels (10 City Lodges for 2010 World Cup, 3 hotels for Langa Sun Resort Hotels)• Mixed use developments incl. residential (Cradle City R35bn over 7 years)• New & upgraded retail developments
19
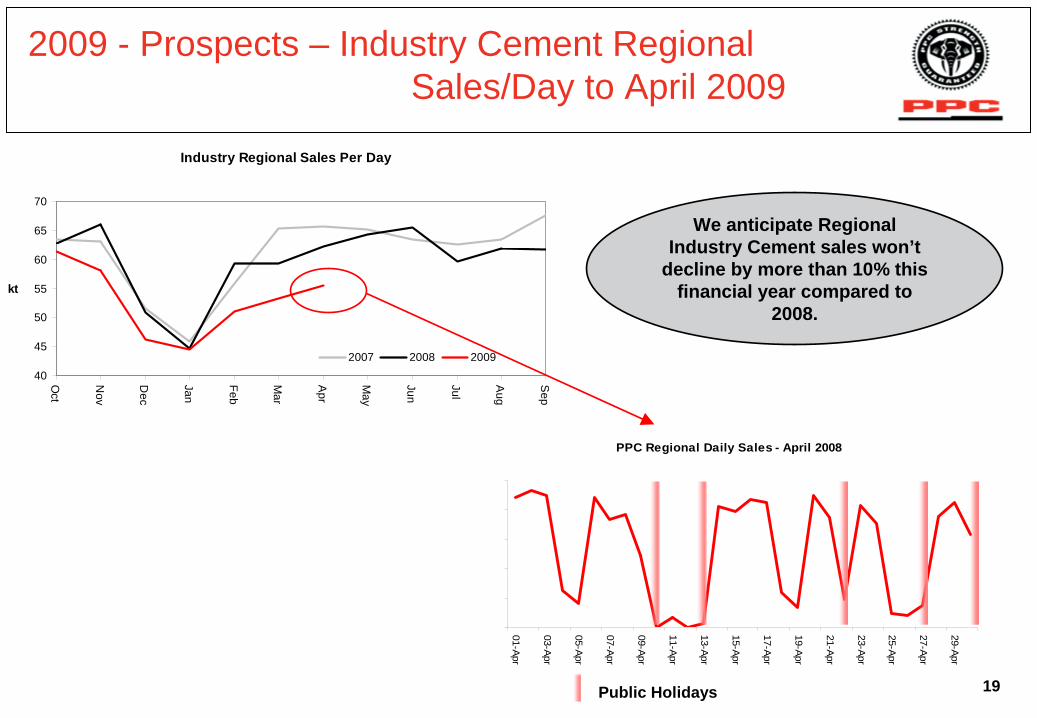
2009 - Prospects – Industry Cement Regional Sales/Day to April 2009
Industry Regional Sales Per Day
40
45
50
55
60
65
70
Oct
Nov
Dec
Jan
Feb
Mar
Apr
May
Jun
Jul
Aug
Sep
kt
2007 2008 2009
PPC Regional Daily Sales - April 2008
5
10
15
20
25
01-Apr
03-Apr
05-Apr
07-Apr
09-Apr
11-Apr
13-Apr
15-Apr
17-Apr
19-Apr
21-Apr
23-Apr
25-Apr
27-Apr
29-Apr
Public Holidays
We anticipate Regional Industry Cement sales won’t
decline by more than 10% this financial year compared to
2008.

20
2009 - Prospects – Market Intelligence
Building Plans Passed 2008Category Sub Category Value (R m)
% Value Cement*
Cement (000 tons)**
Residential
Dwelling-houses < 80 square metres 2 775 6.1 169
Dwelling-houses >= 80 square metres 19 902 5.9 1 174
Flats and townhouses 12 883 1.1 142
Other residential buildings 1 527 2.6 40
Non-residential
Office and banking space 4 669 2.4 110
Shopping space 5 650 1.6 90
Industrial and warehouse space 6 562 2.6 171
Other non-residential buildings 1 145 2.2 25
Additions &Alterations
Dwelling-houses 14 287 2.6 371
Other buildings 7 670 2.6 199
Total 77 069 2 491
Total SA Cement Consumed 13 472
Cement in Building Plans Passed as % of total SA cement sales 18%
* University of the Witwatersrand Study 2006 and 2008
** Calculated using a weighted average selling price of bags and bulk, delivered and through retail outlets
21
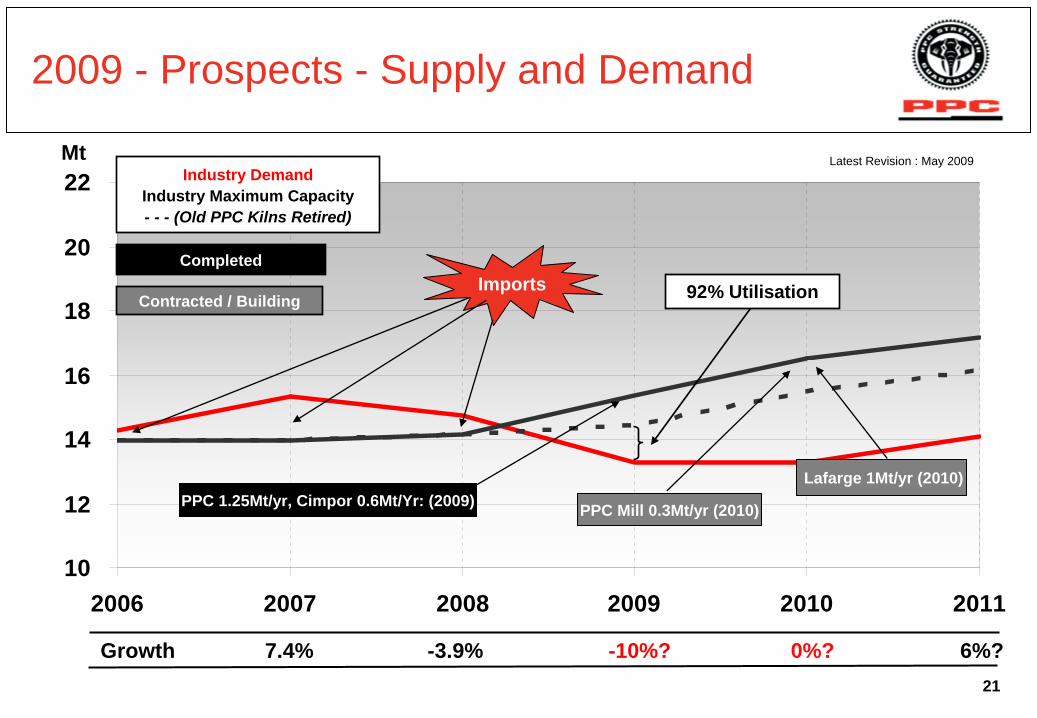
2009 - Prospects - Supply and Demand
10
12
14
16
18
20
22
2006 2007 2008 2009 2010 2011
Mt
Growth 7.4% -3.9% -10%? 0%? 6%?
PPC 1.25Mt/yr, Cimpor 0.6Mt/Yr: (2009)Lafarge 1Mt/yr (2010)
PPC Mill 0.3Mt/yr (2010)
Contracted / Building
Completed
Industry DemandIndustry Maximum Capacity- - - (Old PPC Kilns Retired)
Latest Revision : May 2009
Imports 92% Utilisation

22
2009 - Prospects – Cement – Costs/ Margins
• Potential cement cash cost savings in H2• Dwaalboom
• coal and electricity energy efficiency improvements between 20 – 25% vs the 3 kilns shut- down
• kiln total cash cost saving could benefit cement annual EBITDA % margin by the equivalent of 0.7 to 0.9 percentage points (pp)
• Balance of cement production• Distribution costs, mining diesel, coal savings and reduced maintenance load in H2 after
completing most annual shut-downs in H1• could add a further 1.2 to 1.6 pp to cement annual EBITDA % margin
• Focus is on extracting all possible savings no matter how small• Should the strong Rand continue throughout H2 further cost savings could arise, but we
should be cautious
23
2009 - Prospects – Cement Costs/ Margins cont.
• Further meaningful cost reductions can be expected in 2010 and especially from falling coal prices and transport costs
• The benefit of the lower Dwaalboom cash cost will be in for a full year
• Cement prices• Whereas only Q2 had the benefit of the January ~15% cost recovery price increase,
H2 will have the benefit for rest of year
• In view of expected cost reductions and the current economic situation, it is possible that the normal mid year selling price increase may be deferred
24
• Lime sales to the steel industry should improve in H2 and early signs have been seen. It will be sometime before they get back to early 2008 levels
• Lime January price adjustments will be in for the half
• Aggregates should maintain a steady performance
2009 - Prospects – Lime and Aggregates

25
2009 - Prospects - Capital Expenditure
2009
1st half
2009
2nd half
2009
Full year
2010
Full year
Dwaalboom Kiln 2 (Batsweledi) expansion
97 50 147 -
Hercules Mill (Ntšhafatso) expansion 134 270 404 100
Riebeeck (Se Kïka) expansion - - - ???
Other expansion projects 19 80 99 60
EXPANSION CAPEXEXPANSION CAPEX 250 400 650 160
Replacement & environmental capex 152 150 - 200 300 - 350 300 - 400
TOTAL CAPEXTOTAL CAPEX 401 550 - 600 950 – 1000 460 - 560

26
2009 - Prospects – Gearing and Dividends
• Future expansionary capital expenditure will continue to be funded through borrowings
• Current gross debt to EBITDA cover of 1.4 times is well within the stated target of 2 to 3 times cover
• Dividend cover will remain in the target range of 1.2 to 1.5 x earnings before non-cash IFRS 2 charges of R404 million
• Will consider the distribution of excess cash if and when this arises
• Level of shareholders’ equity and reserves will be the ultimate limiting factor – until reserves increase (through issue of shares etc.)

27
THANK YOUTHANK YOU
QUESTION TIME

28
ANNEXURES
PPC 2009 Interim ResultsPPC 2009 Interim Results

29
BBBEE transaction
• R2.7bn broad-based black ownership initiative - effected 15 December 2008
• Combination of strategic black partners, PPC employees, communities, construction and related industry associations
• 15.29% of increased issued share capital, 15.1% black owned
R75320 140
R1 19037 991
R548 558
R millions
000’s Shares• Impact on issued share capital
• New shares issued to strategic black partners, at par, with full economic and voting rights. ITO accounting treated as a separate class of shares for the calculation of EPS and HEPS
• Shares bought back by BEE Trusts in terms of Scheme of Arrangement @ R31.32/ share - consolidated as treasury shares
• Impact of new BEE shares issued was reduced by PPC 2008 buy- backs by a wholly-owned subsidiary - treated as treasury shares
Effective dilution is ONLY 5.3%

30
BBBEE transaction (continued)
• Impact on statement of comprehensive income• Variable interest rates were swopped for fixed interest rates to reduce interest rate
exposure• Dividends paid to certain internal trusts treated as an expense
• Impact on statement of financial position• Pretoria Portland Cement Company Limited guaranteed part of the funding required
for some of the Trust financing in the transaction• Have to consolidate that part of the funding structure as a result of residual risk• R1 190 million shares treated as treasury shares, including consolidated trusts• Related funding raised as liabilities• Total borrowings including BEE transaction still leave plenty of room for further
gearing to the targeted level if necessary

31
Detail of Borrowings & Gearing
31 March ’09*
R million
8-year bullet loan (reduced short-term borrowings already in place) 1 517
Redeemable preference shares issued in wholly-owned subsidiary 168
BBBEE SPV / Trusts redeemable preference shares and loans consolidated 939
Total funding raised with the BBBEE transaction 2 624
Other borrowings 1 240
Total borrowings 3 864
Included in long-term borrowings 2 627
Included in short-term borrowings 1 237
Annual gross debt to EBITDA (excluding IFRS 2 charges) of 1.4 tiAnnual gross debt to EBITDA (excluding IFRS 2 charges) of 1.4 times are well within the targeted mes are well within the targeted level of 2 to 3 times EBITDAlevel of 2 to 3 times EBITDA
* Total balance outstanding at 31 March 2009, net of costs

32
H1 2009 – Safety Statistics
Group Lost Time Injuries and Lost Time Injury Frequency Rate
0
1
2
3
4
5
6O
ct-0
6
Dec
-06
Feb-
07
Apr
-07
Jun-
07
Aug
-07
Oct
-07
Dec
-07
Feb-
08
Apr
-08
Jun-
08
Aug
-08
Oct
-08
Dec
-08
Feb-
09
0.00
0.10
0.20
0.30
0.40
0.50
0.60
LTIs (LHS) LTIFR (RHS)
H1 2009 11
H1 2008 10

33
Contacts
John Gomersall Chief Executive OfficerPeter Esterhuysen Chief Financial OfficerOrrie Fenn Chief Operating Officer
Kevin Odendaal Investor Relations
www.ppc.co.zaTel. 011 386 9000

34
Disclaimer
This document including, without limitation, those statements concerning the demand outlook, PPC¹s expansion projects and its capital resources and expenditure, contain certain forward-looking views. By their nature, forward- looking statements involve risk and uncertainty and although PPC believes that the expectations reflected in such forward-looking statements are reasonable, no assurance can be given that such expectations will prove to have been correct. Accordingly, results could differ materially from those set out in the forward- looking statements as a result of, among other factors, changes in economic and market conditions, success of business and operating initiatives, changes in the regulatory environment and other government action and business and operational risk management.
While PPC takes reasonable care to ensure the accuracy of the information presented, PPC accepts no responsibility for any consequential, indirect, special or incidental damages, whether foreseeable or unforeseeable, based on claims arising out of misrepresentation or negligence arising in connection with a forward-looking statement. This document is not intended to contain any profit forecasts or profit estimates, and the information published in this document is unaudited.