


Languages
Pages
Legal


May 27, 2015
Bernstein’s Strategic Decisions Conference
Ted Craver, Chairman andChief Executive Officer

May 27, 2015
Forward-Looking StatementsStatements contained in this presentation about future performance, including, without limitation, operating results, asset and rate base growth, capital expenditures, financial outlook, and other statements that are not purely historical, are forward-looking statements. These forward-looking statements reflect our current expectations; however, such statements involve risks and uncertainties. Actual results could differ materially from current expectations. These forward-looking statements represent our expectations only as of the date of this presentation, and Edison International assumes no duty to update them to reflect new information, events or circumstances. Important factors that could cause different results are discussed under the headings “Risk Factors” and “Management’s Discussion and Analysis” in Edison International’s Form 10-K, most recent form 10-Q, and other reports filed with the Securities and Exchange Commission, which are available on our website: www.edisoninvestor.com. These filings also provide additional information on historical and other factual data contained in this presentation. Further information on SCE’s capital expenditures and rate base forecasts, use of non-GAAP financial measures and reconciliation to the nearest GAAP measure may be found in the April 30, 2015 Business Update and which is also available on our website.

May 27, 2015
Edison EnergyNationally-focused new businesses
Commercial & industrial solar
Competitive transmission
Energy services
Edison International
Southern California EdisonRegional wires-focused electric utilityServes nearly 14 million residents50,000 square-mile service area
Our Business Platforms

May 27, 2015
EIX is Ready for Industry Change
• Public policy prioritizing environmental sustainability
• Accelerating technology advancement facilitating conservation and self-generation
• Increasing use of distributed resources and transportation electrification
• Regulation supporting new forms of competition
• Flattening domestic demand for electricity
• SCE– Invest in modernizing the grid– Productivity improvements to help
contain customer rates– Facilitate California’s low-carbon
economy goals• Edison Energy
– Provide integrated energy services to commercial and industrial customers
– Infrastructure investments that support electrification in:
– Water– Goods movement – Fiber
– Competitive transmission
Long-Term Industry Trends Strategy

May 27, 2015
EIX Strategy Should Produce Superior ValueSustainable
Earnings and Dividend GrowthPositioned for
Transformative Change
Rate Base and Core Earnings Growth:• 7 – 9% rate base growth through
2017
Constructive Regulatory Structure:• Decoupling• Balancing accounts• Forward-looking ratemaking
Sustainable Dividend Growth:• Target payout ratio: 45-55% of SCE
core earnings• Returning to target payout ratio in
steps over time produces above industry-average dividend growth
SCE Focus on Lower-Risk Energy Delivery• Only own 20% of generation
SCE Growth Drivers Beyond 2017:• Public safety and reliability• Grid readiness and transmission• EV charging and storage• State environmental policy
Edison Energy Competitive Strategy:• Integrate emerging technologies and
business models to expand electrification and serve commercial and industrial customers

May 27, 2015
$15.0$16.8
$18.8
$21.0 $21.1
$23.3
2009 2010 2011 2012 2013 2014
SCE Historical Rate Base and Core Earnings
Rate Base
Core Earnings
9%
12%
2009 – 2014 CAGR
Core EPS $4.68$2.68 $3.01 $3.33 $4.10
($ billions)
$3.88

May 27, 2015
SCE Rate Base Forecast
• Incorporates January 2015 GRC update
• Excludes Coolwater-Lugo transmission project
• Excludes SONGS regulatory asset
• FERC rate base is approximately 23% of SCE’s rate base forecast by 2017
($ billions)
Request
Range
23.125.0
26.9
$23.6
$26.0
$28.4
2015 2016 2017
Forecast 7-9% growth in 2015 –2017 rate base
Q4 2014Forecast $23.3 ‐ $23.8 $25.2 ‐ $26.2 $27.4 ‐ $29.0

May 27, 2015
EIX Annual Dividends Per Share
$0.80
$1.00$1.08
$1.16$1.22 $1.24 $1.26 $1.28 $1.30
$1.35$1.42
$1.67
2004 2005 2006 2007 2008 2009 2010 2011 2012 2013 2014 2015
Eleven Years of Dividend Growth
EIX targets a payout ratio of 45 – 55% of SCE core earningsand plans to return to target payout ratio in steps, over time

May 27, 2015
SCE Capital Expenditures Forecast
• Growth driven by infrastructure replacement, reliability investments, and public policy requirements
($ billions)
2015-17Total
Requested $4.1 $4.6 $4.4 $13.1
Range $3.6 $4.0 $3.9 $11.5
$4.1
$4.6$4.4
2015 2016 2017
Distribution Transmission Generation
$11.5 – $13.1 billion forecasted
capital program 2015-2017

May 27, 2015
Distribution Grid of the Future
One-Way Electricity Flow• System designed to generate
electricity from large central plant• Very few distributed energy
resources• Voltage relatively simple to maintain• Limited situational awareness and
visualization tools for grid operators
Renewable Generation Mandates
Subsidized Residential Solar
Lack of Electric Vehicle Charging Infrastructure
Variable, Two-Way Electricity Flow• Distribution system at the center of
the grid• System designed to serve variable
resources and customer demand • Digital monitoring and control
devices and advanced communications systems to manage two-way flows
• Improved data management and grid operations with cyber mitigation
Maximize Distributed Resources and Electric Vehicle Adoption• Distribution grid infrastructure
design supports customer choice and greater resiliency
Current State Future State

May 27, 2015
New Technology Grid Impacts
22
11
33
1111
11
22
22
Future state—from elctro-mechanical to digital
More automated and digital, with more sophisticated voltage control and protection schemes
Facilitates increasing distributed resources & two-way power flow
Cyber mitigation must be included
11
22
33
11
May 27, 2015
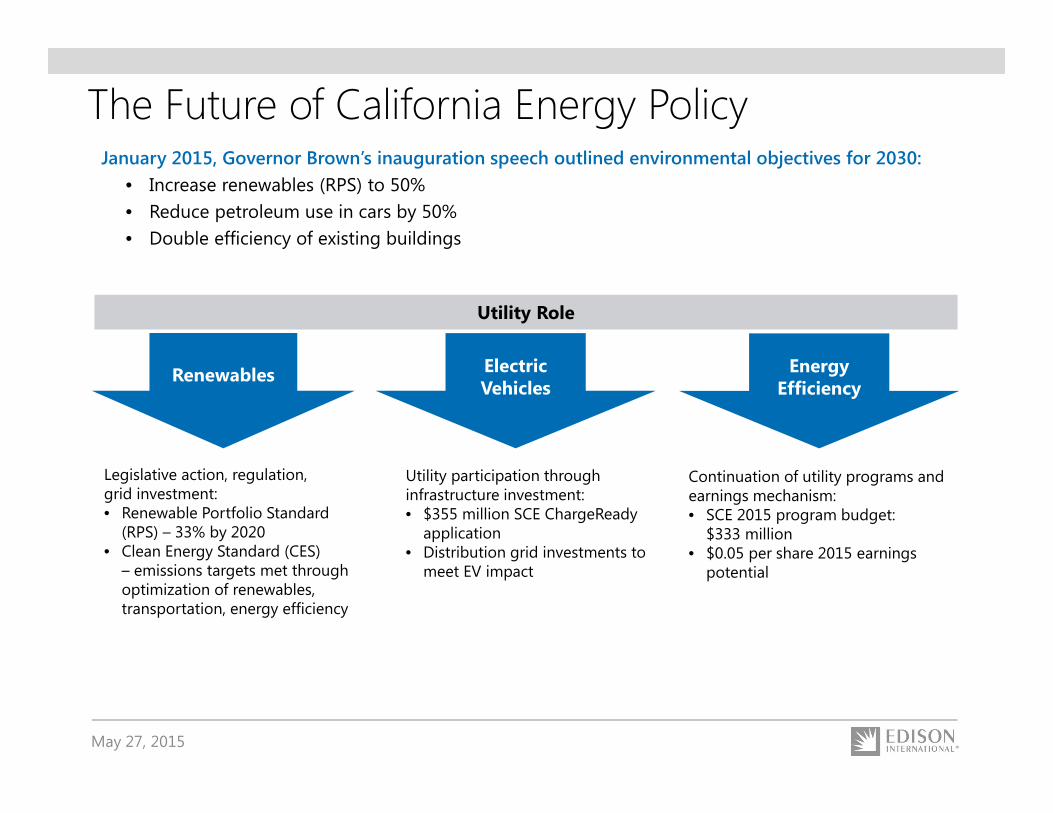
The Future of California Energy PolicyJanuary 2015, Governor Brown’s inauguration speech outlined environmental objectives for 2030:
• Increase renewables (RPS) to 50%• Reduce petroleum use in cars by 50%• Double efficiency of existing buildings
Renewables Electric Vehicles
Energy Efficiency
Legislative action, regulation,grid investment:• Renewable Portfolio Standard
(RPS) – 33% by 2020• Clean Energy Standard (CES)
– emissions targets met through optimization of renewables, transportation, energy efficiency
Utility participation through infrastructure investment:• $355 million SCE ChargeReady
application• Distribution grid investments to
meet EV impact
Continuation of utility programs and earnings mechanism:• SCE 2015 program budget:
$333 million • $0.05 per share 2015 earnings
potential
Utility Role

May 27, 2015
SCE Distribution Resources PlanAB 327 Requires Utility Submissions of Distribution Resources Plans in July, 2015 to Integrate Increasing Penetration of Distributed Energy Resources• Optimal locations for Distributed Energy Resources
• Move utilities towards seamless integration of distributed generation and other resources
• Enable a distribution system market
• Technology recommendations (information technology, communications, system planning, voltage and frequency controls, etc.)
SCE Anticipates Supplementing Required Filing Scope With Conceptual Capital Plan• Estimated scope of work, technology roadmap, timeline, and capital and expense cost estimates
• Incremental to traditional general rate case expenditures
• Implementation recommendations likely to be integrated into future general rate cases beginning with the 2018-2020 filing in the fall of 2016

May 27, 2015
Bernstein’s Strategic Decisions Conference
Top Related