


Languages
Pages
Legal


BENTHIC AND EPIBENTHIC INVERTEBRATES, DEMERSAL FISHES, AND
SEDIMENT STRUCTURE OFF TILLAMOOK BAY, OREGON, SEPTEMBER 1990,
WITH COMPARISONS TO PREVIOUS SURVEYS
by
Robert L. Emmett and
Susan A. Hinton
Final Report of Research
Funded by
U.s. Environmental Protection Agency Region 10
1200 Sixth Ave. Seattle, WA 98101
U.S. Army Corps of Engineers Portland District
P.O. Box 2946 Portland, Oregon 97208
(Contract E96900022)
and
Coastal Zone and Estuarine Studies Division Northwest Fisheries Science Center National Marine Fisheries Service
National Oceanic and Atmospheric Administration 2725 Montlake Boulevard East
Seattle, Washington 98112
September 1992

CONTENTS
Page
INTRODUCTION. . . . . . . • . . . . . . . . . . . . . . . . . . . . . . . . . . . . . . . . . . . . . . . . . . . . . . . .. 1
METHODS. . . . . . • . • . . . . . . . . . . . . . . . . . . . . . . . . . . . . . . . . . . . . . . • . . . . . . . • . . . . .• 1
Benthic Invertebrates and Sediments............... . . . . . . . . . . . .. 1
Trawling (Fishes and Large Epibenthic Invertebrates) ...•....... 3
Data Analysis.................................................. 5
Benthic Invertebrates.................................... 5
Fishes and Large Epibenthic Invertebrates ..•.......•...•• 5
Sediments ••...••..•••.••...•...•...•...•.• '. • . . . • . . . • . . . .. 6
RESULTS. . . . . . . . . . . . . . . . • . . . . . . . . . . . . . . . . . . . . . . . . . . . . . . . . . . . . . . . . . . . .. 6
Benthic Invertebrates.......................................... 6
Fishes and Large Epibenthic Invertebrates ...................... 9
Sediment s ...................................................... 15
DISCUSSION ..........•......•.................•.............•..•...... 20
CONCLUS IONS .......................................................... 24
ACKNOWLEDGMENTS ....•................................•................ 25
LITERATURE CITED ......•.......•.....................•................ 26
APPEND IX............................................................. 28
INTRODUCTION
Biological surveys conducted by the National Marine Fisheries Service
(NMFS) in 1984 and 1985 at the interim Ocean Dredged-Material Disposal Site
(ODMDS) offshore from Tillamook Bay, Oregon, revealed extremely high densities
of benthic invertebrates (Emmett et al. 1987, 1988). As a result, the U.S.
Army Corps of Engineers. (COE), Portland District, requested NMFS to sample
deeper areas in an attempt to find an area that was biologically less active.
In October 1988, benthic inve.rtebrate and sediment samples were collected
along a transect originating in the interim ODMDS [35-m (115-ft) depth
contour] and ending at the 73-m (240-ft) depth contour. Results from the
September 1988 survey revealed that benthic invertebrate densities at the
deeper stations were lower than those at the interim ODMDS; however, benthic
invertebrate densities may have been underestimated because of sampling
problems (Emmett et al. 1990).
To verify benthic invertebrate densities off Tillamook Bay, NMFS
conducted a fifth biological survey during September 1990; all previous
benthic invertebrate sampling stations (34) and 10 trawling stations were
reoccupied. This report presents the information collected during the
September 1990 survey and compares it to previous surveys.
METHODS
Benthic Invertebrates and Sediments
Benthic invertebrates and sediments were collected at 34 stations, primarily
located along three transects (Fig. 1). The first transect contained six stations
(T11-T16) and ran perpendicular from shore north of the interim ODMDS, starting at
the 18-m depth contour and ending at the 35-m contour. The second transect had 14
stations (T21-T240) and also ran perpendicular from shore, starting near the center
of the interim ODMDS at the 18-m depth contour and ending at the 73-m contour. The
third transect contained six stations (T31-T36) and was located south of the interim
ODMDS, running from the 18-m depth contour to the 35-m depth contour. Eight other
stations were also sampled, four north of the second transect (TR1, TR2, TN200,
TN240) at the 18-, 30-, 61-, and 73-m depth contours and four south of the second

3
transect (TR3, TR4, TS200, TS240) at similar depths. We used Loran-C navigational
readings to return to previous sampling stations (Appendix Table 1).
A 0.96-m2 Gray-O'Hara box corer (Pequegnat et al. 1981) was used to collect
six samples at each station. Five of these samples were individually sieved through
a 0.5-mm mesh screen, and the residue placed in jars with a buffered 5% formaldehyde
solution containing Rose Bengal (a protein stain). The sixth sample was used for
sediment analysis. Sediment grain size was determined by sieving, and total
volatile solids were determined by burning for 1 hour at 600°C. Sediment particle
sizes are presented using the phi scale where phi=-log2 of the particle diameter in
millimeters. Sediment analysis was done by the COE, North Pacific Division
Materials Laboratory at Troutdale, Oregon. Benthic organisms were sorted from the
preserved samples, identified to the lowest possible taxonomic level (usually
species), and counted. All identified specimens were archived in vials containing
70% ethyl alcohol and stored at the NMFS Point Adams Biological Field Station,
Hammond, Oregon.
Trawling (Fishes and Large Epibenthic Invertebrates)
We bottom-trawled at 10 stations (Fig. 2): 3 stations -(T1, T4, T110) within
the interim ODMDS at depth contours of 20, 28, and 34 m; 3 stations (T180, T200,
T220) directly west of the interim ODMDS at depth contours of 55, 61, and 66 m; and
2 stations each (TN200, TN220, TS200, TS220) north and south of these westerly
stations along the 61- and 67-m depth contours. Bottom trawling was done with an
8-m semiballoon shrimp trawl that had overall mesh size of 38.1 rom (stretched); a
12.7-rom mesh liner was inserted in the cod end to ensure retention of small fishes
and invertebrates. Fishing width of the trawl was estimated to be 5 m. Each
trawling effort lasted 10 minutes. We determined position fixes using Loran-C
navigational equipment (see Appendix Table 1 for Loran-C readings for each station).
All captured fishes, crabs, shrimps, and large invertebrates were placed in
labeled 19-L (5-gal) buckets containing a buffered solution of 5% formaldehyde and
seawater. In the laboratory, fishes and large invertebrates were rinsed in fresh
water, measured [total and standard lengths (rom)], and weighed (g). Crabs were
measured across the carapace just anterior to the tenth anterolateral spines.
Shrimps were identified, measured (tip of rostrum to end of telson), counted, and
weighed. For each trawling effort, a subsample of up to 50 individuals of a species
5
was measured and weighed. When more than 50 individuals of a species were captured,
the remainder was counted and weighed as a group.
Data Analysis
Benthic Invertebrates
The five benthic invertebrate replicates from each station allowed us to
calculate a mean number/m2 and a standard deviation for each species. Two community
structure indices were also calculated for each station.
1) Diversity was described by the Shannon-Wiener function (H) (Krebs 1978):
s
H = - LPilog2Pi i=1
where Pi - Xa/n (Xa is the number of individuals of a particular species in the
sample and n is the total number of individuals in the sample) and s = number of
species.
2) Equitability (E) measures the proportional abundances among the various species
in a sample (Krebs 1978):
where H - Shannon-Wiener function and s - number of species.
A paired t-test (Wilkinson 1989) was used to identify significant differences
between the number of taxa and invertebrate densities of the September 1990 data and
similar data from September 1984 (Stations TR1-T36), and October 1988 (T115-TS240).
Benthic invertebrate densities were log10 transformed before statistical analysis.
Fishes and Large Epibenthic Invertebrates
By using distance fished (calculated from Loran-C fixes), fishing width of the
trawl (5 m), and catch data, we estimated densities of fishes and large epibenthic
invertebrates [number/hectare (ha)]. A descriptive summary of each trawling effort
included a species list, the numbers and weights of fishes and epibenthic
invertebrates captured (total and by species), numbers/ha (total and by species),

7
Table 1.--Nurnber of taxa found off Tillamook Bay during five benthic invertebrate surveys.
Station IleRth Sep 84 Jan 85 Jul 85 Oct 88 Sep 90 (ft) (m)
TR1 60 18 59 47 * * 93 TR2 100 30 65 5S * * 115 TR3 60 18 49 38 * * 90 TR4 100 30 50 52 * * 131 Tll 60 18 52 39 36 * 104 T12 70 21 62 62 * 89 T13 80 24 74 46 60 * 116 T14 90 27 62 38 53 * 140 T15 100 30 67 46 57 * 114 T16 116 35 69 45 42 * 109 T21 66 20 63 28 33 * 103 T22 70 21 61 28 34 * 82 T23 80 24 86 42 37 * 117 T24 93 28 66 42 63 * 140 T25 100 30 6S 4S 52 * 146 T26 l1S 35 65 44 49 * 120 T31 60 18 47 37 44 * 79 T32 70 21 52 43 46 * 120 T33 77 23 39 49 48 * 105 T34 87 27 38 47 56 * 117 T35 97 30 41 49 49 *" 121 T36 111 34 66 52 42 * 122 T115 115 35 * * * 55 116 T120 120 37 * * * 46 125 T140 141 43 * * * -63 145 Tl60 160 49 * * * 44 163 T180 183 56 * * * 61 161 T200 204 62 * * * 67 159 T220 222 68 * * * 68 151 T240 246 75 * * * 58 153 TN200 200 61 * * * 77 147 TN240 242 74 * * * 92 170 TS200 207 63 * * * 70 137 TS240 246 75 * * * 58 173
Mean 59 43 48 63 126 S.D. 12 7 9 13 25
* Station not sampled during this survey.

9
In 1990, diversity (H) was highest at Station T31 (4.36) and lowest at
Station T25 (1.26) (Table 3). Interestingly, this corresponds to the stations
with the lowest and highest benthic invertebrate densities (Table 2). This
reflects how evenly the proportional abundances of the taxa were distributed
at each station, which in turn is reflected in the equitability (E) values
(Table 4). Station T31 had low densities, but the taxa present at this
station had relatively even proportional abundances, thus high diversity and
equitability, while Station T25 had high invertebrate densities, represented
by only a few taxa, resulting in low diversity and low equitability. Overall,
lower diversity (H) and equitability (E) occurred during the September 1990
survey than during any previous survey (Tables 3-4). Although we identified
more taxa during this survey than during any previous survey, only a few taxa
were abundant.
Polychaetes were the dominant invertebrates during September 1990,
composing 91% of the invertebrate density (Table 5). Three' species (Owenia
fusiformis, Spiophanes bombyx, and Prionospio lighti) made up 76% of the
polychaete densities. Other dominant species by major taxonomic category
included the molluscs Olivella spp., Olivella pycna, and Macoma spp.; the
cumaceans Diastylopsis dawsoni and Colurostylis occidentalis; the amphipods
Photis macinerneyi and Eohaustorius sencillusi and the echinoderm Dendraster
excentricus.
Fishes and Large Epibenthic Invertebrates
In September 1990, 48 fish and large epibenthic invertebrate taxa were
captured in 10 trawling efforts (Table 6, Appendix Table 2). Pacific sanddab,
Citharichthys sordidus, comprised 46% of the total catch for the survey (Table
6). Other numerically dominant species included northern crangon, Crangon
alaskensis; speckled sanddab, Citharichthys stigmaeusi and English sole,
Pleuronectes vetulus. Additional species, important by weight (few in number
but large in size), included spotted ratfish, Hydrolagus colliei; rex sole,
Errex zachirus; and sand sole, Psettichthys melanostictus.
The most taxa (24) were captured at Stations T110 and T180; the fewest
taxa (10) were captured at Station T220 (Table 7, Appendix Table 4). During
previous surveys, no more than 18 taxa/trawl were captured. Interestingly,
the stations with the previous lowest number of taxa/trawl (four at Stations

11
Table 4.--Equitability (E) of benthic invertebrates found off Tillamook Bay,
Oregon, during five benthic invertebrate surveys.
Station Degtb Sep 84 Jan 85 Jul 85 Oct 88 Sep 90 (ft) (m)
TRI 60 18 0.77 0.27 * * 0.39 TR2 100 30 0.15 0.14 * * 0.43 TR3 60 18 0.84 0.83 * * 0.65 TR4 100 30 0.13 0.13 * * 0.58 Tll 60 18 0.64 0.85 0.62 * 0.35 T12 70 21 0.25 0.34 * 0.34 T13 80 24 0.23 0.78 0.31 * 0.40 T14 90 27 0.20 0.78 0.30 * 0.46 TIS 100 30 0.14 0.23 0.18 * 0.42 T16 116 35 0.25 0.36 0.38 * 0.48 T21 66 20 0.75 0.66 0.77 * 0.41 T22 70 21 0.78 0.76 0.73 * 0.52 T23 80 24 0.42 0.85 0.51 * 0.57 T24 93 28 0.35 0.45 0.24 * 0.23 T25 100 30 0.12 0.79 0.33 * 0.18 T26 115 35 0.26 0.42 0.56 * 0.42 T31 60 18 0.77 0.79 0.75 * 0.69 T32 70 21 0.82 0.79 0.78 * 0.61 T33 77 23 0.84 0.73 0.79 * 0.59 T34 87 27 0.82 0 .. 64 0.53 * 0.58 T35 97 30 0.72 0.54 0.73 * 0.58 T36 111 34 0.34 0.71 0.68 * 0.55 T115 115 35 * * * 0.79 0.47 T120 120 37 * * * 0.80 0.46 Tl40 l41 43 * * * 0.77 0.39 T160 160 49 * * * 0.82 0.47 T180 183 56 * * * 0.82 0.43 T200 204 62 * * * 0.73 0.34 T220 222 68 * * * 0.72 0.35 T240 246 75 * * * 0.83 0.42 TN200 200 61 * * * 0.79 0.35 TN240 242 74 * * * 0.83 0.55 TS200 207 63 * * * 0.69 0.38 TS240 246 75 * * * 0.83 0.56
Mean 0.48 0.60 0.53 0.79 0.46 S.D. 0.29 0.25 0.21 0.05 0.12
* Station not sampled during this survey.

13
Table 6.--Catch summary for demersal fishes and large epibenthic invertebrates captured by 8-m trawl off Tillamook Bay, Oregon, during September 1990.
Total Total Number Weight (g) number weight per per
Taxon captured (g) hectare hectare
Spotted ratfishAI 20 6,457 10 3,087 Longfin smelt 1 10 <1 5 Whitebait smelt 15 114 7 54 Pacific tomcod 32 280 15 134 Tube-snout 7 19 3 9 Bay pipefish 1 1 <1 0 Shiner perch 8 78 4 37 Unidentified rockfish 2 13 1 6 Sablefish 2 348 1 166 Lingcod 21 668 10 319 Roughback sculpin 3 33 1 16 Red Irish lord 1 72 <1 34 Brown Irish lord 12 330 6 158 Spotfin sculpin 3 44 1 21 Pacific staghorn sculpin 5 290 2 139 Slim sculpin 28 65 13 31 Cabezon 1 51 <1 24 Unidentified sculpin 1 4 <1 2 Northern spearnose poacher 3 6 1 3 Warty poacher 3 6 1 3 Pricklebreast poacher 13 29 6 14 Spinycheek starsnout 2 6 1 3 Showy snailfish 10 20 5 10 Bathymasteridae 2 17 1 8 Pacific sanddab 1,205 19,918 576 9,521 Speckled sanddab 153 1,668 73 797 Petrale sole 7 435 3 208 Rex sole 97 5,286 46 2,527 Butter sole 11 1,254 5 599 Arrowtooth flounder 46 1,278 22 611 English sole 150 5,439 72 2,600 Sand sole 24 2,420 11 1,157 Dover sole 60 1,800 29 860 Dungeness crab 87 90 42 43 Pygmy rock crab 1 2 <1 1 Red rock crab 6 29 3 14 Furrowed rock crab 3 3 1 2 Longhorn decorator crab 2 1 1 1 Northern crangon 361 569 173 272 California bay shrimp 60 44 29 21 Blacktail bay shrimp 18 8 9 4 Smooth crangon 91 12 43 6 Stout coastal shrimp 21 5 10 3 Prawn 14 18 7 9 Sand star 10 801 5 383 Pacific sea star 4 444 2 212 Sunflower star 2 935 1 447 Sand dollar 7 461 3 220
-- -- Totals 2,636 51,885 1,255 24, 801
AI For scientific names see Appendix Table 2.

15
TIIO and T1SO during October 1986) had the most taxa during September 1990
(Table 7). There was no obvious relationship between depth and number of taxa
captured during the present survey.
Fish and large epibenthic invertebrate densities during September 1990
were highest at Station TS220 (S,476/ha) and lowest at Station Tl (S76/ha)
(Table 7). Station TS220 had the highest fish and epibenthic invertebrate
density reported from any of the five surveys (Table 7). Generally, 1990
trawl catch densities were similar to densities in September 1984.
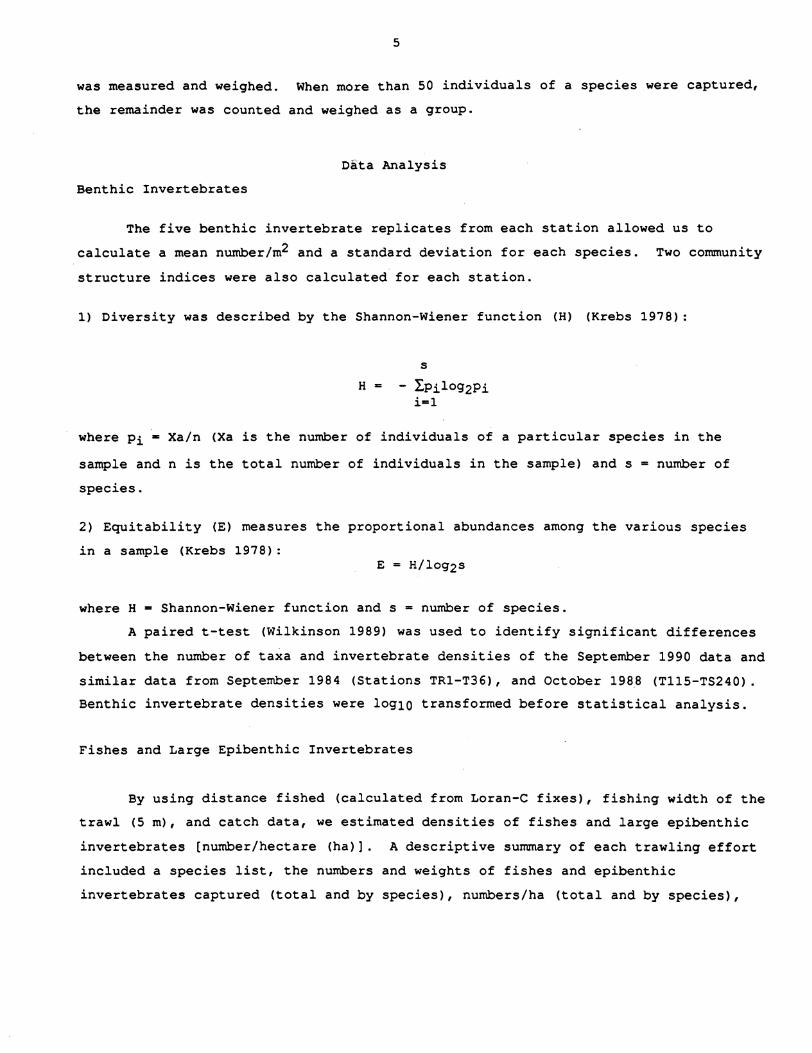
Length and carapace-width frequency distributions of some numerically
and commercially important fishes and Dungeness crab indicated that catches
for some species were almost all juveniles (Figs. 3-4). For example, lingcod,
Ophiodon elongatus, were probably age-lor age-2; Dover sole, Microstomus
pacificus, were primarily subyearlings and yearlings, and Dungeness crab were
all subyearlings (recently settled), while both juvenile and adult Pacific
sanddab, speckled sanddab, and rex sole were captured.
Trawl station diversity (H) in September 1990 was highest at Station
T110 (3.63) (Table 8). This was higher than any previpusly sampled Tillamook
trawl station and was due to the large number of taxa captured and the
relatively equal proportional abundances of the taxa (E = 0.79) (Table 8).
Lowest trawl station diversity during 1990 was at Station TS200 (1.76), and
this was reflected in the low equitability value (0.48). Although 13 taxa
were captured at Station TS200, 68% of the catch was composed of Pacific
sanddab (Appendix Table 4).
Sediments
Median grain size during this survey ranged from 2.90 phi (fine sand) to
4.0 phi (very fine sand), with all but six stations having a median grain size
of very fine sand (>3.0-4.0 phi) (Table 9). Overall, the median grain size
for the 34 stations sampled in September 1990 was slightly finer (mean = 3.1S
phi) than any of the previous surveys (Table 9). Similar to previous surveys,
the September 1990 survey revealed very little median grain size variation
between stations. In September 1990, median grain size was significantly finer
than similar stations in September 1984 (paired t-test, P < 0.05), but not
significantly different from October 1988 (paired t-test, P > 0.05).

18 Speckled sanddab
16 N =152
144 Lingcod ~ 12
CD Q; 3 N = 21 ~ 10
::::J~ Z 8::::J Z2 6
4
2
o III I II II II AUWJIIJAIJ.IJJJAI'II. ••• I "I11111111111111111111111o I I I I I I I I II II I I I II I I I II I I I I 'A "'~N'~ I 'I I II I I I I I I I II I I I I I 25 50 75 100 125 150 175 200 225 250 270 30025 50 75 100 125 150 175 200 225 250 270 300
Total length (mm)Total length (mm)
80 I-' -..I
70 9
8 Rex sole60 Pacific sanddab N =312 7
~50 N=303 Q; 6 .0E 40 E 5::::J ::::J
Z30 Z 4
3 20
2 10
o I11111 1-," ~N~~M~~N~~'~N~~~N~N"~~I ..11 ..111111111 o 'I I I II I. I I II I I I" I I I I I ~NI I ~N~'II'NlMYt'" ... I'NI f~~1 fl' "tit 25 50 75 100 125 150 175 200 225 250 270 300 25 50 75 100 125 150 175 200 225 250 270 300
Total length (mm) Total length (mm)
Figure 3.--Length-frequency distributions of lingcod, speckled sanddab, Pacific sanddab, and rex sole captured at 10 trawling stations off Tillamook Bay, Oregon, September 1990. Fish >300 rom long are included in the 296- to 300-mm size interval.

19
Table 9.--Median grain size (phi) found at benthic stations sampled during
five surveys off Tillamook Bay, Oregon.
Station Jlfllgtb Sep 84 Jan 85 Jul 85 Oct 88 Sep 90 (ft) (m)
TR1 60 18 3.00 3.10 * * 4.00TR2 100 30 3.10 3.20 * * 3.30TR3 60 18 3.10 2.90 * * 3.30TR4 100 30 3.10 3.00 * * 3.20T11 60 18 3.00 2.80 2.70 * 2.90T12 70 21 3.00 3.10 3.00 * 3.10T13 80 24 3.10 2.90 3.00 * 3.10T14 90 27 3.10 3.00 3.10 * 3.30T15 100 30 3.00 2.90 3.10 * 3.10T16 116 35 3.00 3.00 3.20 * 3.30T21 66 20 2.70 2.70 2.90 * 3.20T22 70 21 2.90 2.80 3.00 * 3.00T23 80 24 3.00 2.80 3.00 * 3.00T24 93 28 3.00 3.00 3.00 * 3.00T25 100 30 3.10 2.90 3.00 * 3.20T26 115 35 3.00 2.90 3.10 * 3.10T31 60 18 3.00 3.00 3.00 * 3.20T32 70 21 3.00 3.00 3.00 * 3.20T33 77 23 3.00 3.00 3.00 * 3.20T34 87 27 3.00 3.10 3.00 * 3.00T35 97 30 3.10 3.10 3.10 * 3.20T36 111 34 3.10 3.10 3.10 * 3.10T115 115 35 * * * 3.10 3.10T120 120 37 * * * 3.10 3.10T140 141 43 * * * 3.20 3.40T160 160 49 * * * 3.10 3.10T180 183 56 * * * 3.10 3.30 T200 204 62 * * * 3.10 3.10T220 222 68 * * * 3.10 3.30T240 246 75 * * * 3.10 3.20TN200 200 61 * * * 2.10 3.20TN240 242 74 * * * 3.10 3.00 TS200 207 63 * * * 3.10 3.10TS240 246 75 * * * 3.20 3.10
Mean 3.02 2.97 3.02 3.03 3.18 S.D. 0.09 0.12 0.10 0.30 0.18
* Station not sampled during this survey.
21
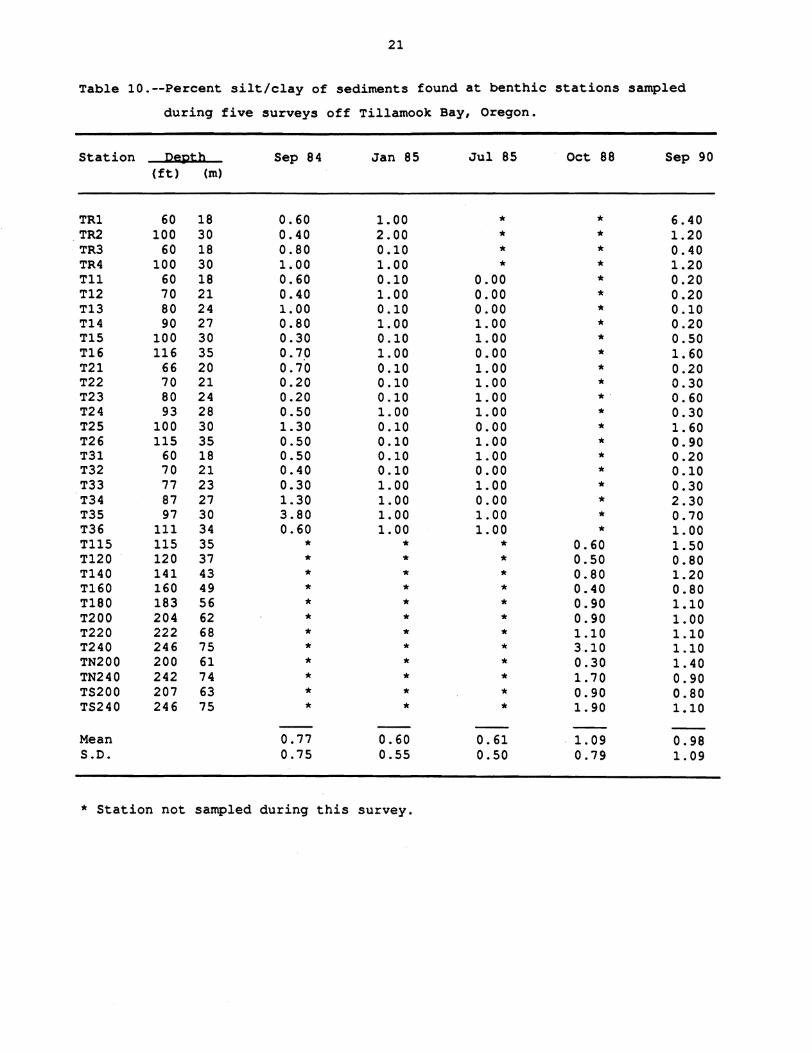
Table 10.--Percent silt/clay of sediments found at benthic stations sampled
during five surveys off Tillamook Bay, Oregon.
Station De12tb Sep 84 Jan 85 Jul 85 Oct 88 Sep 90 (ft) (m)
TR1 60 TR2 100 TR3 60 TR4 100 T11 60 T12 70 T13 80 Tl4 90 T15 100 T16 116 T21 66 T22 70 T23 80
18 0.60 30 0.40 18 0.80 30 1.00 18 0.60 21 0.40 24 1. 00 27 0.80 30 0.30 35 0.7,0 20 0.70 21 0.20 24 0.20
1. 00 2.00 0.10 1.00 0.10 1. 00 0.10 1.00 0.10 1.00 0.10 0.10 0.10
••••
0.00 0.00 0.00 1. 00 1. 00 0.00 1. 00 1. 00 1.00
• • • • • • • • • • • • ..
6.40 1.20 0.40 1.20 0.20 0.20 0.10 0.20 0.50 1. 60 0.20 0.300.60
T24 93 T25 100 T26 115 T31 60 T32 70 T33 77 T34 87 T35 97 T36 111 T115 115 T120 120 Tl40 141
28 0.50 30 1.30 35 0.50 18 0.50 21 0.40 23 0.30 27 1.30 30 3.80 34 0.60 35 • 37 * 43 •
1.00 0.10 0.10 0.10 0.10 1. 00 1. 00 1.00 1. 00
• •*
1. 00 0.00 1. 00 1. 00 0.00 1. 00 0.00 1. 00 1. 00
* * *
• • • • • • • • •
0.60 0.50 0.80
0.30 1. 60 0.90 0.20 0.10 0.30 2.30 0.70 1. 00 1.50 0.80 1.20
Tl60 160 T180 183
49 * 56 • * •
* *
0.40 0.90
0.80 1.10
T200 204 62 * * * 0.90 1. 00 T220 222 68 * * * 1.10 1.10 T240 246 75 * * * 3.10 1.10 TN200 200 TN240 242
61 * 74 *
* •
* *
0.30 1. 70
1.40 0.90
TS200 207 TS240 246
63 * 75 *
* *
* • 0.90 1. 90
0.80 1.10
Mean 0.77 0.60 0.61 1. 09 0.98 S.D. 0.75 0.55 0.50 0.79 1. 09
* Station not sampled during this survey.

23
The high benthic invertebrate densities (relative to other Oregon
coastal areas) at the shallow-water stations (TR1 through T36) during
September 1990 correspond closely to the September 1984 survey (Table 2). The
benthic invert~brate density at Station T25 (145,582/m2 in September 1990) is
the highest density reported for the Oregon/Washington coast. This station is
located in the interim ODMDS. Some of the lowest densities occurred at the
stations just south of the interim ODMDS (Stations T31, T32, T33, and T34) .
However, these densities are still higher than are typically found in similar
areas along the Oregon coast (Emmett et al. 1987).
At least twice the number of invertebrate taxa were reported from the
September 1990 survey than from previous surveys (Table 1, Appendix Table 2) .
In part, there appeared to be more species inhabiting the area off Tillamook
Bay in late 1990. The larger number of taxa identified in 1990 was also due
to identification of more taxa to species than occurred for previous surveys.
Nevertheless, many specimens in the 1990 collection could not be identified to
species, some of which we suspect may not yet be described in the scientific
literature.
Although benthic invertebrate densities from the September 1990 survey
varied widely, the sediment structure did not (Tables 6-8). This indicates
that different factors (biological and physical processes) are probably more
important in controlling benthic invertebrate densities.
During the October 1988 sampling, most of the trawls filled with
macroalgae and blades of Zostera spp. (Emmett et al. 1990), which may have
directly affected catch rates. In 1990, few macroalgae were collected in the
trawls and were not suspected of reducing trawl efficiencies. Fish and
epibenthic densities in September 1990 were much higher than October 1986
densities, but similar to September 1984. We believe the trawl data in this
report accurately describe the fish and epibenthic invertebrate community
offshore from Tillamook Bay.
Most of the fishes and Dungeness crabs captured during the September
1990 survey were juveniles, similar to previous findings. Whether the area
off Tillamook Bay is particularly important for some fish and crab species is
unknown, since most of the nearshore waters off Oregon and Washington have not
been surveyed.
25
ACKNOWLEDGMENTS
This research was supported in part by the COE, Portland District and
the U.S. Environmental Protection Agency, Region 10. We thank the COE,
Portland Divsion Materials Laboratory for perfo~ing the sediment analysis.
Special thanks go to the individuals who spent very long hours sorting
invertebrates: Amy Emmett, No~an Kujula, Toni Abajian, and David Molenaar.
We also thank the taxonomists who assisted with the invertebrate
identifications; Jamie Nielsen for amphipods, Susan Weeks for molluscs, and
Howard Jones and Larry Lovel for polychaetes.
27
Miller, D. R., R. L. Emmett, and R. J. McConnell.
1988. Benthic invertebrates and demersal fishes at an interim dredge-disposal
site off willapa Bay, Washington. Report to the U.S. Environmental Protection
Agency, Contract DW 13931463-01-0, 20 p. plus appendices. (Available from
Northwest Fisheries Science Center, 2725 Montlake Blvd. E., Seattle, WA
98112.)
Pequegnat, W. E., L. H. Pequegnat, P. Wilkinson, J. S. Young, and S. L. Kiessger.
1981. Procedural guide for designation surveys of ocean dredged material
disposal sites. Tech. Rep. EL-81-1, U.S. Army Corps of Engineers, Washington
D.C. 268 p. plus appendices.
Richardson, M. D., A. G. Carey, Jr., W. A. Colgate.
1977. Aquatic disposal field investigations, Columbia River disposal site,
Oregon; the effects of dredged material disposal on benthic assemblages. Tech.
Rept. 0-77-30 for the U.S. Army Corps of Engineers, Contract DACW57-75-C-0137
and DACW57-76-C-0092, 411 p. (Available from U.S. Army Engineers Waterways
Experiment Station, P.O. Box 631, Vicksburg, MS 39180.)
Wilkinson, L.
1989. SYSTAT: the system for statistics. SYSTAT, Inc. Evanston, IL. 638 p.
u.S. Environmental Protection Agency.
1991a. Draft environmental impact statement; Rogue Ocean Dredged Material
Disposal Site (ODHOS) designation. U.S. EPA, 1200 Sixth Ave., WD-128, Seattle,
WA 98405, 48 p. plus appendices.
U.S. Environmental Protection Agency.
1991b. Final environmental impact statement; Chetco Ocean Dredged Material
Disposal Site (ODHOS) designation. U.S. EPA, 1200 Sixth Ave., WD-128, Seattle,
WA 98405, 54 p. plus appendices.

29
Appendix Table 1.--Continued.
Station Depth Loran Readings (ft) (m) Beginning Ending
TRAWL STATIONS
T1 61 19 12378.8 28006.2 12376.7 28006.8 T4 91 28 12381.1 28005.3 12379.4 28005.7 T110 110 34 12380.2 28004.9 12378.5 28005.5 T180 180 55 12381.2 28001.7 12379.3 28002.1 T200 201 61 12382.0 28000.4 12380.2 28000.8 T220 217 66 12383.9 27998.9 12382.0 27999.1 TN200 198 60 12372.9 28001.7 12371. 4 28002.0 TN220 217 66 12379.1 27999.7 12377.3 27999.8 TS200 199 61 12393.9 27998.4 12391. 5 27998.9 TS220 222 68 12391. 5 27997.4 12392.5 27997.2

31
Appendix Table 2.--Continued.
Phyllodoce maculata Phyllodoce multipapillata
Hesionidae Gyptis spp. Hesionella mccullochae Heteropodarke heteromorpha Kefersteinia cirrata Microphthalmus spp. Microphthalmus sczelkowii Micropodarke dubia Ophiodromus pugettensis Parandalia fauveli Podarkeopsis glabrus
Syllidae Autolytus (-Proceraea) spp. Autolytus cornutus Exogone lourei Pionosyllis uraga Sphaerosyllis brandhorsti Streptosyllis latipalpa Syllis spp. Syllis hyperioni Typosyllis spp.
Nereidae Cheilonereis cyclurus Nereis spp. Nereis procera Nereis zonata Platynereis bicanaliculata
Nephtyidae Nephtys spp. Nephtys caeca Nephtys caecoides Nephtys ferruginea Nephtys longosetosa Nepthys punctata
Sphaerodoridae Sphaerodoropsis spaerulifer
Glyceridae Glycera spp. Glycera americana Glycera capitata Glycera convoluta Glycera tenuis
Goniadidae Glycinde spp. Glycinde armigera Glycinde picta Goniada brunnea Goniada maculata
Onuphidae Diopatra ornata Onuphis spp. Onuphis sp. (intermediates) Onuphis elegans Onuphis iridescens
33
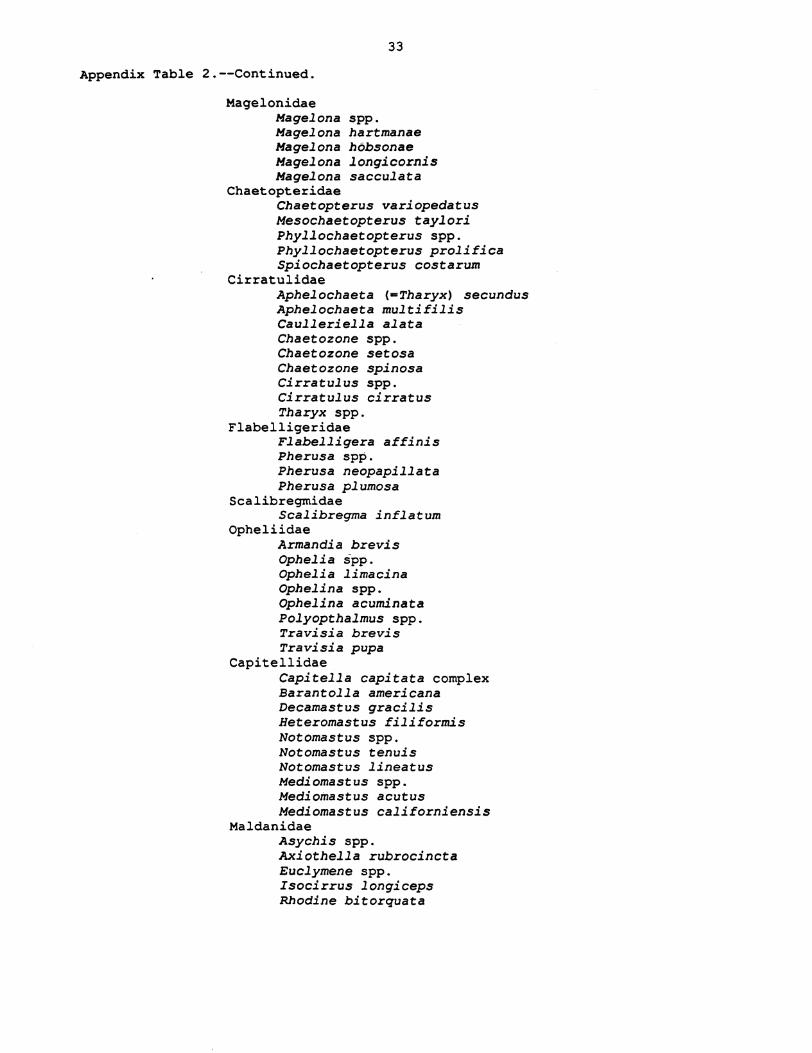
Appendix Table 2.--Continued.
Magelonidae Magelona spp. Magelona hartmanae Magelona h6bsonae Magelona longicornis Magelona sacculata
Chaetopteridae Chaetopterus variopedatus Mesochaetopterus taylori Phyllochaetopterus spp. Phyllochaetopterus prolifica Spiochaetopterus costarum
Cirratulidae Aphelochaeta (-Tharyx) secundus Aphelochaeta multifilis Caulleriella alata Chaetozone spp. Chaetozone setosa Chaetozone spinosa Cirratulus spp. Cirratulus cirratus Tharyx spp.
Flabelligeddae Flabelligera affinis Pherusa spp. Pherusa neopapillata Pherusa plumosa
Scalibregmidae Scalibregma inflatum
Opheliidae Armandia brevis Ophelia spp. Ophelia limacina Ophelina spp. Ophelina acuminata Polyopthalmus spp. Travisia brevis Travisia pupa
Capitellidae Capitella capitata complex Barantolla americana Decamastus gracilis Heteromastus filiformis Notomastus spp. Notomastus tenuis Notomastus lineatus Mediomastus spp. Mediomastus acutus Mediomastus californiensis
Maldanidae Asychis spp. Axiothella rubrocincta Euclymene spp. Isocirrus longiceps Rhodine bitorquata

35
Appendix Table 2.--Continued.
Bittium cf. subplanatum Epitonium
Epitonium indianorum Naticidae
Polinices spp. Muricidae Columbellidae
Amphissa columbiana Mi trella gouldi
Buccinidae Searlesia dira
Nassariidae Nassarius spp. Nassarius fossatus Nassarius mendicus
Olividae Olivella spp. Olivella baetica Olivella biplicata Olivella pycna
Turridae Kurtziella plumbea
Pyramidellidae Odostomia spp. Turbonilla spp.
Cephalaspidea Cylichnidae
Cylichna spp. Cylichna alba Cylichnella culcitella Scaphander willetti
Aglajidae Aglaja spp. Aglaja diomedeum
Gastropteridae Gastropteron pacificum
Diaphanidae Diaphana spp.
Clionidae Clione spp.
Nudibranchia Pelecypoda
Nuculidae Acila castrensis Nucula tenuis
Nuculanidae Yoldia scissurata
Mytilidae Modiolus spp.
Pectenidae Thyasiridae
Axinopsida serricata Montacutidae
Mysella tumida Cardiidae
Clinocardium spp.

37
Appendix Table 2.--Continued.
Neomysis rayii Pacifacanthomysis nephrophthalma
Cumacea Lampropidae
Hemilamprops spp. Hemilamprops californica Lamprops tomalesi
Leuconidae Leucon spp. Epileucon sp. A Eudorella pacifica
Oiastylidae Colurostylis occidentalis Diastylis spp. Diastylis abbotti Diastylopsis spp. Diastylopsis dawsoni Diastylopsis tenuis
Nannastacidae Campylaspis sp. 0 Cumella vulgaris
Tanaidacea Paratanaidae
Leptochelia dubia Leptognathia spp.
Isopoda Anthuridea
Haliophasma geminata Flabellifera
Bathycopea daltonae Exosphaeroma amplicauda Gnorimosphaeroma spp. Gnorimosphaeroma noblei Gnorimosphaeroma oregonensis
Idoteidae Edotea sublittoralis Idotea spp. Idotea fewkesi Synidotea spp. Synidotea angulata Synidotea bicuspida
Janiridae Ianiropsis spp. Ianiropsis kincaidi Ianiropsis kincaidi kincaidi
Munnidae Munnogonium waldronense
Amphipoda Gammaridea
Ampeliscidae Ampelisca spp. Ampelisca agassizi Ampelisca macrocephala Ampelisca careyi Haploops spp.

39
Appendix Table 2.--Continued.
Oedicerotidae Monoculodes spinipes Synchelidium shoemakeri Westwoodilla caecula
Phoxocephalidae Metaphoxus frequens Foxiphalus obtusidens Mandibulophoxus uncirostratu Rhepoxynius spp. Rhepoxynius abronius Rhepoxynius daboius Rhepoxynius lucubrans Rhepoxynius vigitegus Rhepoxynius menziesi Grandifoxus grandis Eobrolgus spinosus
Pleustidae Pleusmytes spp. Pleusmytes subglaber Parapleustes den
Podoceridae Duli chi a spp.
Stenothoidae Synopiidae
Tiron biocellata Hyperiidea
Hyperiidae Hyperoche spp. Hyperoche medusarium
Caprellidea Caprellidae
Decapoda Hippolytidae
Heptacarpus spp. Crangonidae
Crangon spp. Crangon alaskansis Lissocrangon stylirostris
Callianassidae Callianassa spp. Callianassa californiensis
Paguridae Pagurus spp. Pagurus armatus Pagurus setosa
Porcellanidae Brachyura
Majidae Pugettia spp.
Cancridae Cancer spp. Cancer gracilis Cancer magister
Grapsidae

41
Appendix Table 2.--Continued.
Echinodermata Asteroidea
Platyasterida Luidiidae
Luidia foliolata sand star Forcipulatida
Asteriidae Pisaster ochraceus Pacific sea star pycnopodia helianthoides sunflower star
Echinoidea Clypeasteroida
Dendrasteridae Dendraster excentricus sand dollar
Chordata Elasmobranchiomorphi
Chimaeriformes Chimaeridae
Hydrolagus colliei Osteichthyes
Salmoniformes
spotted ratfish
Osmeridae Allosmerus elongatus Spirinchus thaleichthys
whitebait smelt longfin smelt
Gadiformes Gadidae
Microgadus proximus Gasterosteiformes
Pacific tomcod
Gasterosteidae Aulorhynchus flavidus
Syngnathidae Syngnathus leptorhynchus
Perciformes
tube-snout
bay pipefish
Embiotocidae Cymatogaster aggregata
Bathymasteridae Scorpaeniformes
Scorpaenidae Anoplopomatidae
Anoplopoma fimbria Hexagrammidae
Ophiodon elongatus
shiner perch
unidentified rockfish
sablefish
lingcod Cottidae
Chitonotus pugetensis Hemilepidotus hemilepidotus Hemilepidotus spinosus Icelinus tenius Leptocottus armatus Radulinus asprellus Scorpaenichthys marmoratus
Agonidae Agonopsis vulsa Occella verrucosa Stellerina xyosterna
roughback sculpin red Irish lord brown Irish lord spotfin sculpin Pacific staghorn sculpin slim sculpin cabezon
northern spearnose poacher warty poacher pricklebreast poacher
Bathyagonus infraspinatus spinycheek starsnout
43
Appendix Table 3.--Sumrnaries of benthic invertebrate collections (by station)
off Tillamook Bay, Oregon, September 1990.
(Because of its length, this Appendix Table was not included in this report
but can be obtained by writing to the authors.)
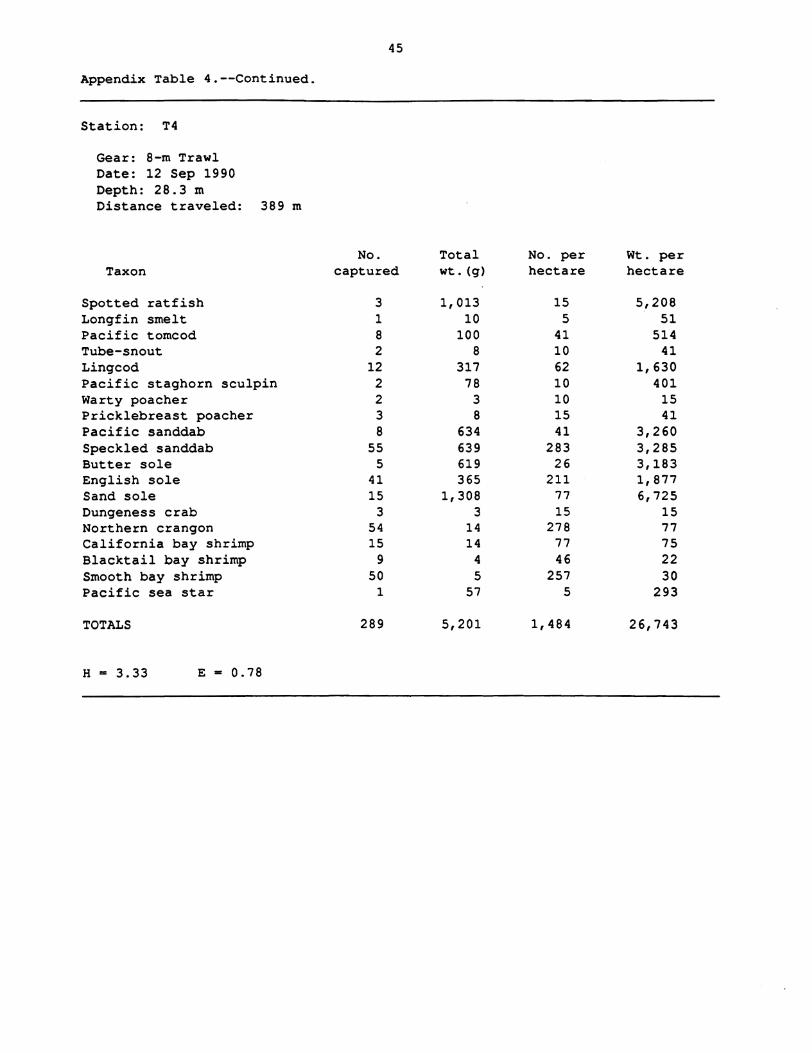
Appendix Table 4.--Continued.
Station: T4
Gear: 8-m Trawl Date: 12 Sep 1990 Depth: 28.3 m Distance traveled: 389 m
No. Total No. per Wt. per Taxon captured wt. (g) hectare hectare
Spotted ratfish 3 1,013 15 5,208 Longfin smelt 1 10 5 51 Pacific tomcod 8 100 41 514 Tube-snout 2 8 10 41 Lingcod 12 317 62 1,630 Pacific staghorn sculpin 2 78 10 401 Warty poacher 2 3 10 15 Prick1ebreast poacher 3 8 15 41 Pacific sanddab 8 634 41 3,260 Speckled sanddab 55 639 283 3,285 Butter sole 5 619 26 3,183 English sole 41 365 211 1,877 Sand sole 15 1,308 77 6,725 Dungeness crab 3 3 15 15 Northern crangon 54 14 278 77 California bay shrimp 15 14 77 75 Blacktai1 bay shrimp 9 4 46 22 Smooth bay shrimp 50 5 257 30 Pacific sea star 1 57 5 293
TOTALS 289 5,201 1,484 26,743
H ... 3.33 E 0.78
45

47
Appendix Table 4.--Continued.
Station: T180
Gear: 8-m Trawl Date: 13 Sep 1990 Depth: 54.3 m Distance traveled: 426 m
No. Total No. per Wt. per Taxon captured wt. (g) hectare hectare
Spotted ratfish 2 157 9 737 Pacific tomcod 4 50 19 235 Lingcod 1 33 5 155 Roughback sculpin 3 33 14 155 Brown Irish lord 2 9 9 42 Spotfin sculpin 3 44 14 207 Pacific staghorn sculpin 1 45 5 211 Northern spearnose poacher 2 4 9 19 Showy snailfish 2 4 9 19 Pacific sanddab 146 2,243 685 10,531 Speckled sanddab 7 277 33 1,300 Petrale sole 1 34 5 160 Rex sole 3 79 14 371 Arrowtooth flounder 3 146 14 685 English sole 14 488 66 2,291 Dover sole 1 29 5 136 Dungeness crab 17 20 80 94 Red rock crab 6 29 28 136 Longhorn decorator crab 1 <1 5 1 Northern crangon 13 4 61 21 Stout coast~l shrimp 6 3 28 14 Prawn 9 15 42 75 Sand star 1 63 5 296 Sand dollar 2 139 9 653
TOTALS 250 3,949 1,173 18,544
H 2.62 E = 0.57

Appendix Table 4.--Continued.
Station: T220
Gear: 8-m Trawl Date: 13 Sep 1990 Depth: 66.8 m Distance traveled: 444 m
No. Total No. per Wt. per Taxon captured wt. (g) hectare hectare
Spotted ratfish 1 82 5 369 Slim sculpin 3 8 14 36 Pacific sanddab 107 2,500 482 11,261 Petrale sole 2 78 9 351 Rex sole 9 494 41 2,225 Arrowtooth flounder 5 137 23 617 English sole 4 353 18 1590 Dover sole 6 170 27 766 Northern crangon 35 16 158 74 Sand star 1 66 5 297
TOTALS 173 3,904 782 17,586
H = 1. 82 E 0.55
49

Appendix Table 4.--Continued.
Station: TN220
Gear: 8-m Trawl Date: 13 Sep 1990 Depth: 66.8 m Distance traveled: 463 m
No. Total No. per Wt. per Taxon captured wt. (g) hectare hectare
Spotted ratfish 1 164 4 708 Slim sculpin 2 1 9 5 Spinycheek starsnout 1 4 4 17 Showy snailfish 3 3 13 13 Bathymasteridae 1 13 4 56 Pacific sanddab 63 1,560 272 6,739 Rex sole 14 747 60 3,227 Arrowtooth flounder 9 363 39 1,568 Dover sole 3 58 13 251 Dungeness crab 39 39 168 168 Furrowed rock crab 3 3 13 16 Northern crangon 24 11 104 51 California bay shrimp 1 <1 4 3 Stout coastal shrimp 8 1 35 7 Prawn 2 1 9 5
TOTALS 174 2,971 751 12,834
H ... 2.75 E - 0.70
51

Appendix Table 4.--Continued.
Station: TS220
Gear: 8-m Trawl Date: 12 Sep.1990 Depth: 68.6 m Distance traveled: 222 m
No. Total No. per Wt. per Taxon captured wt. (g) hectare hectare
Lingcod 2 118 18 1,063 Pacific staghorn sculpin 1 94 9 847 Slim sculpin 21 49 189 441 Spinycheek starsnout 1 2 9 18 ShOWY snailfish 3 11 27 99 Bathymasteridae 1 4 9 36 Pacific sanddab 377 3,880 3,396 34,955 Rex sole 28 1,618 252 14,577 Arrowtooth flounder 10 154 90 1,387 English sole 19 1,709 171 15,396 Dover sole 22 670 198 6,036 Pygmy rock crab 1 2 9 18 Longhorn decorator crab 1 0 9 8 Northern crangon 113 477 1,018 4,303 California bay shrimp 1 1 9 9 Stout coastal shrimp 4 0 36 4 Sand star 2 183 18 1,649 Sunflower star 1 357 9 3,216
TOTALS 608 9,330 5,476 84,062
H 1. 92 E == 0.46
53
Top Related