


Languages
Pages
Legal

BENEFITS AND OVERVIEW OF THE ELECTRONIC REPORTING TOOL
(ERT)
Paul BakerMACTEC

Overview
IntroductionEmissions Reporting Tool OverviewConclusions
2

Introduction
Test PlanTest ReportEmission Factor DevelopmentWhy ERT
3
What is ERT
Microsoft Access ApplicationMethods
Methods 1 through 4, 3A, 5, 6C, 7E, 10, 17, 25A, 26A, 29, 101, 101A, 201A, 202, CTM-039 & CTM-040
PollutantsFilterable PM, Condensable PM, PM10, PM2.5, CO, Chlorine, Chloride, HCl, Total Chloride, NOx, SO2, Metals (Sb, As, B, Be, Cd, Cr, Co, Cu, Pb, Mn, Hg, Ni, P, Se, Ag, Thand Zn), TOC (as C, CH4, C2H6, C3H8)
Electronic Test Report4
ERT Provides
Key informationCoordinationData qualityStandards
5
ERT Reduces
WorkloadRequired resourcesRedundancy
6
How ERT is used by the Source
Test planTest report
7
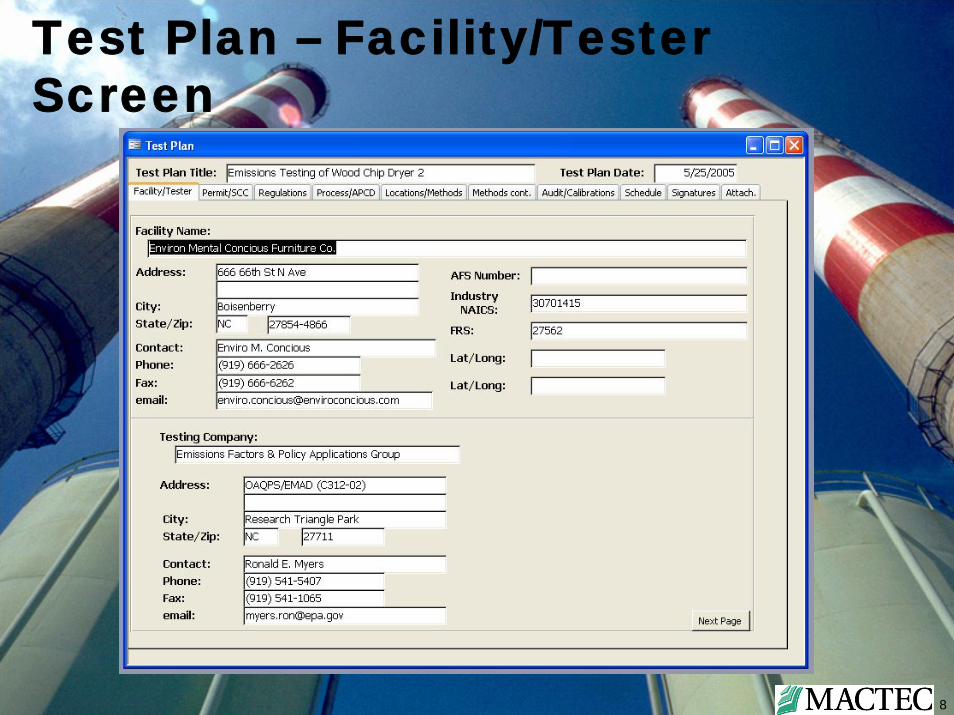
Test Plan – Facility/Tester Screen
8
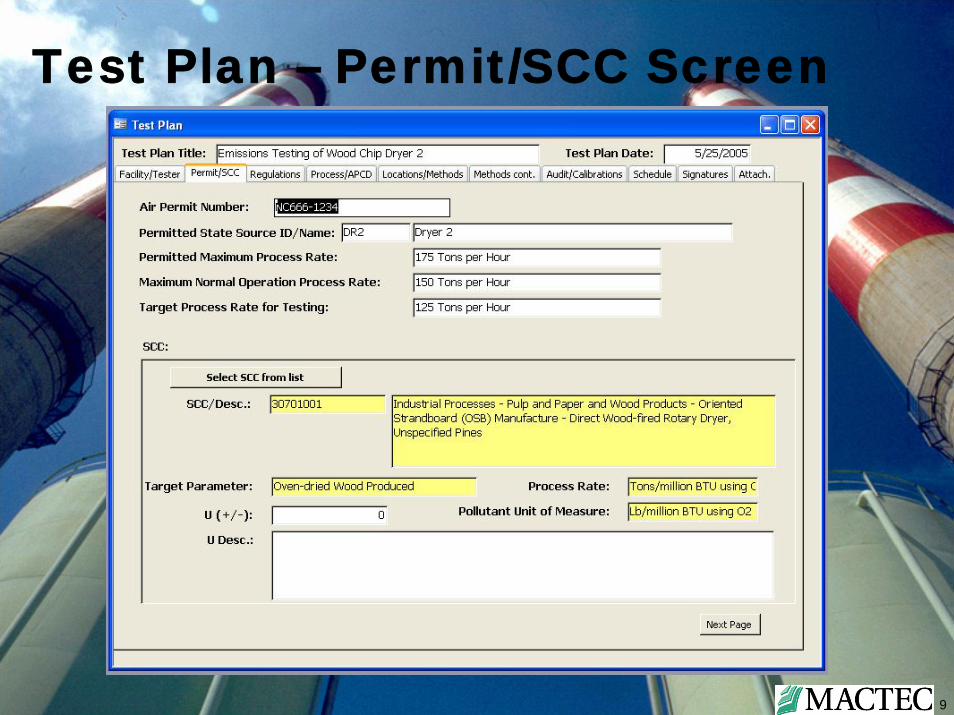
Test Plan – Permit/SCC Screen
9
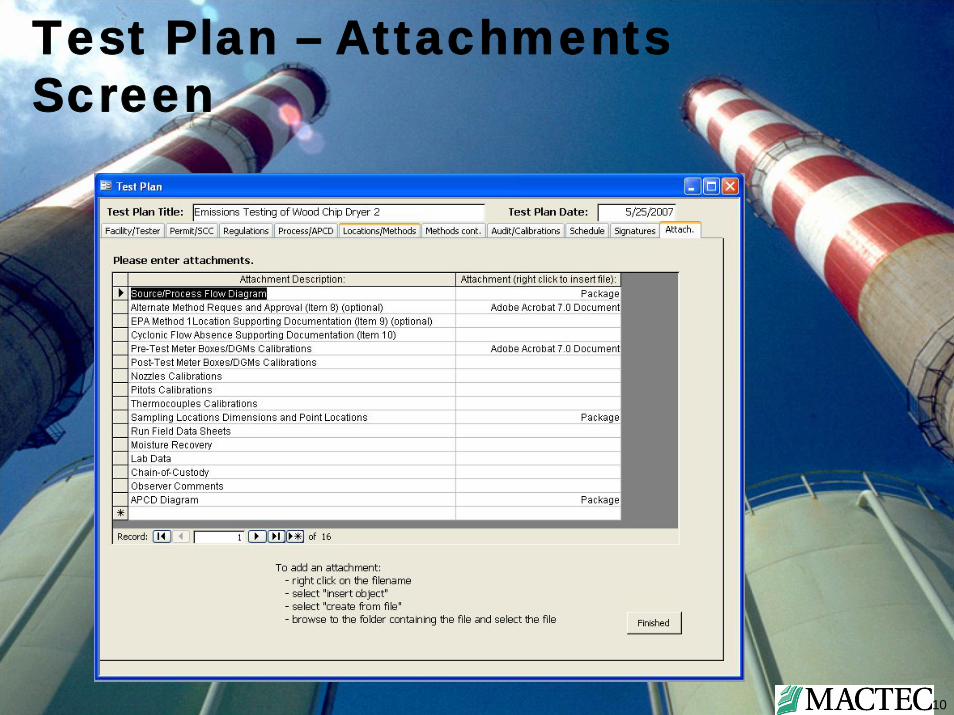
Test Plan – Attachments Screen
10
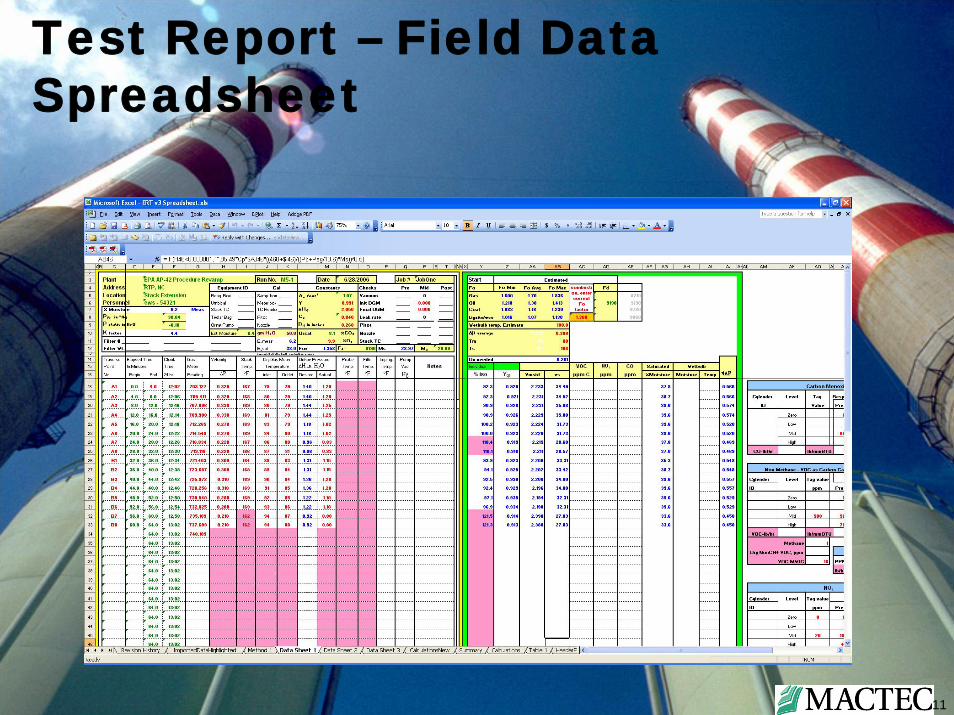
Test Report – Field Data Spreadsheet
11
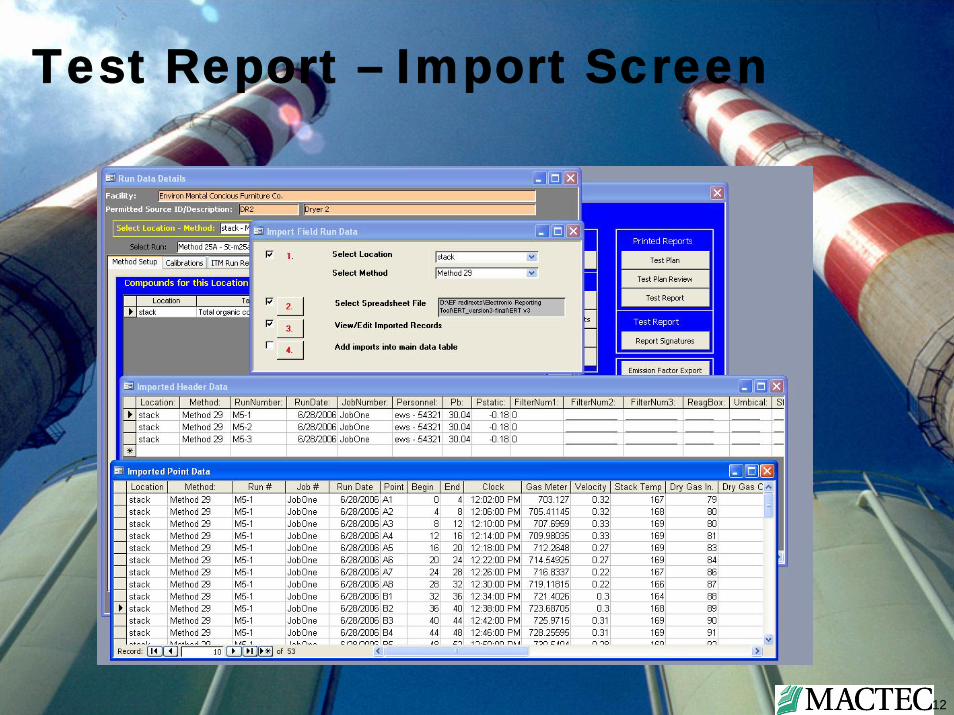
Test Report – Import Screen
12
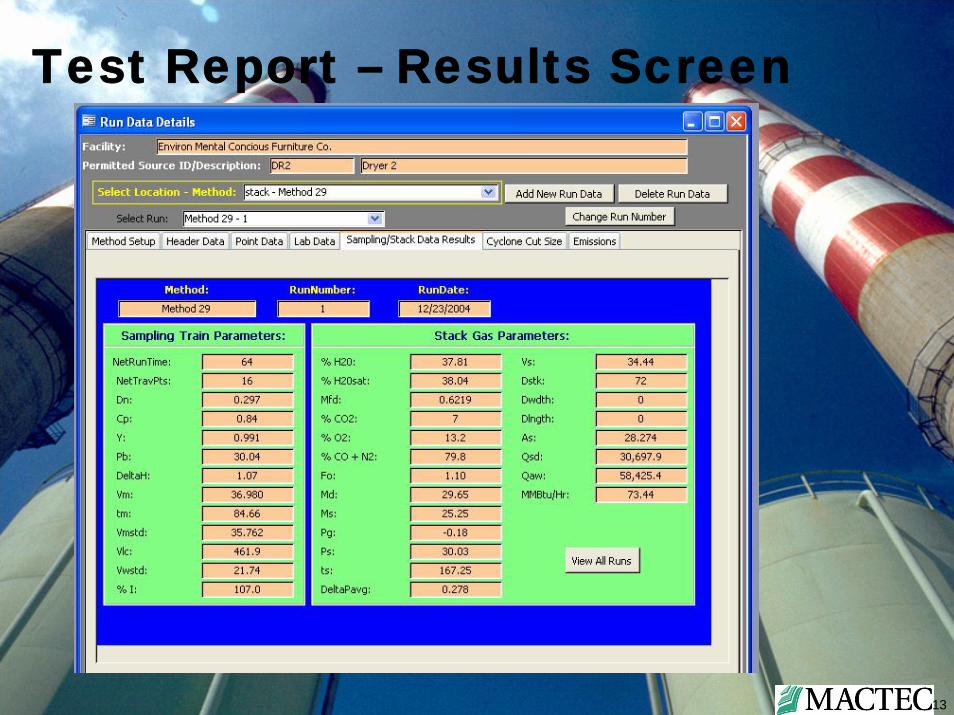
Test Report – Results Screen
13
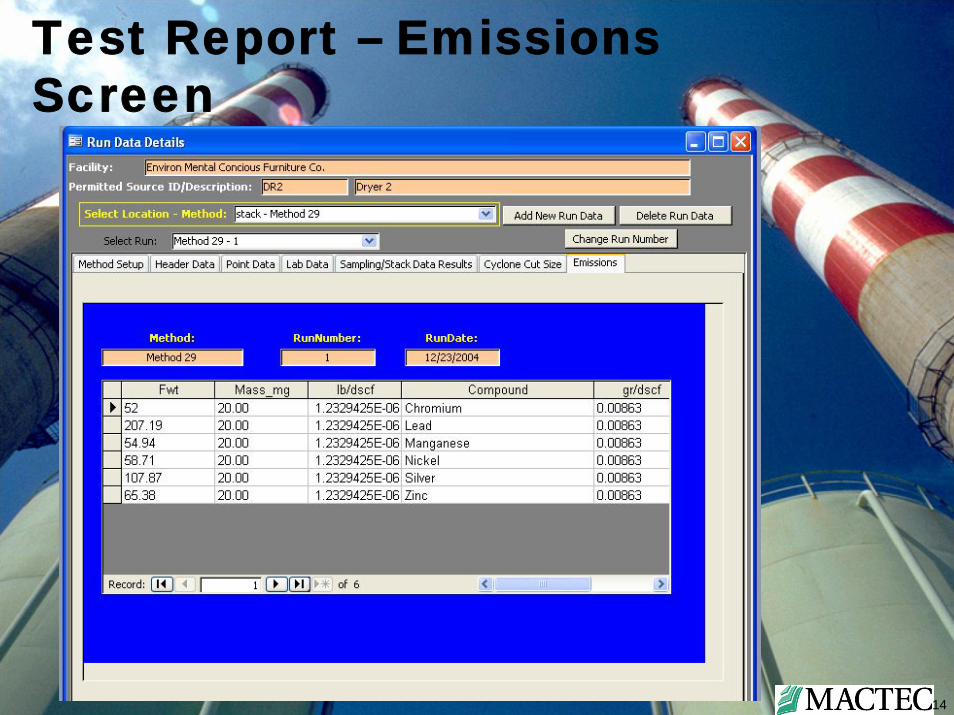
Test Report – Emissions Screen
14
How ERT is used by EPA
Test plan reviewTest reportData quality evaluation
15
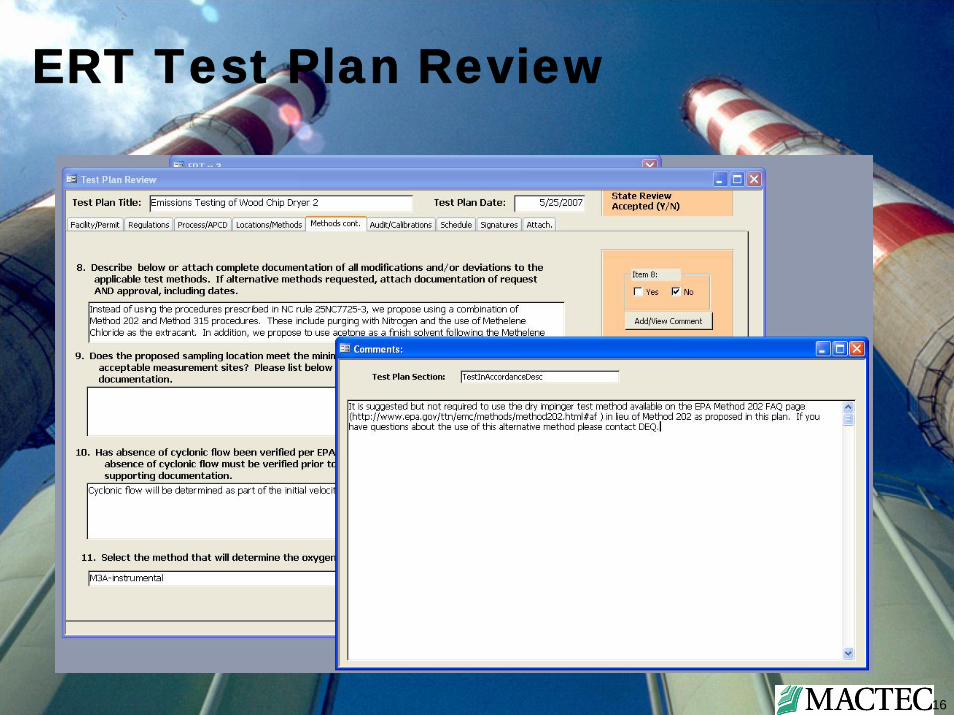
ERT Test Plan Review
16
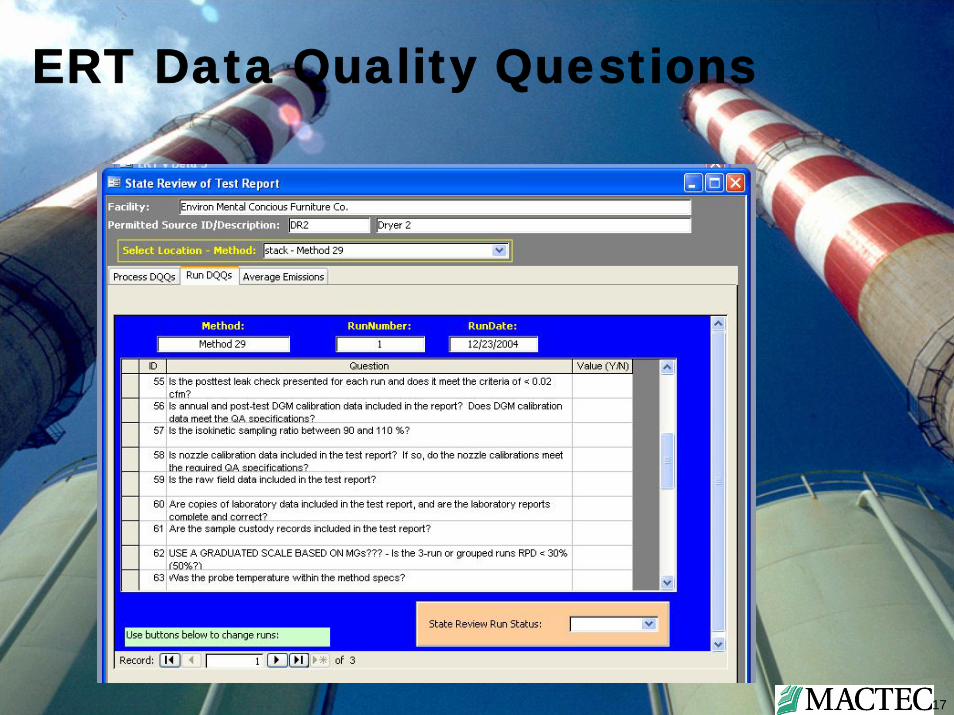
ERT Data Quality Questions
17
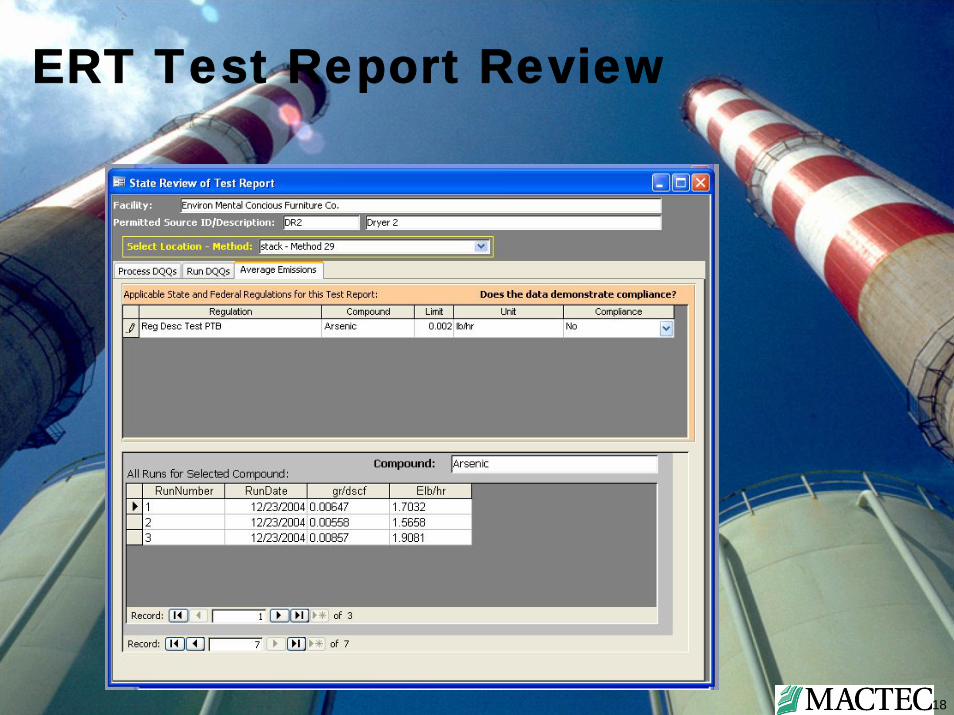
ERT Test Report Review
18
Source Benefits
Streamlined test plansStandard Report
19
States Benefits
Standard reportQ/AImproved emission factors
20
ERT Data Applications
WebFireNon-emission factor data flowLegacy systemsAIRS/AFSEmission inventory Emission standards dataState limits (non-Federal, SIP)Federal NSPS, MACT, NSR/PSD
21
Planned Improvements
ANPR electronic submission requirementsData definition standardsCDXCROMERRExpanded test methods
22

Conclusions
Paper replacementCritical dataCommunicationStandardsEfficientImproved emission factors
23
Top Related