


Languages
Pages
Legal

Tracking Study of Cambodian Garment Sector Workers
Affected by the Global Economic Crisis
Benchmarking Survey Report (Final)
Prepared By: Dr. Kang Chandararot
Ms. Liv Dannet Cambodia Institute of Development Study
March 2010
Benchmarking Report – Prepared by CIDS 2
Contents
Acknowledgements .............................................................................................................................. 5 Executive Summary.............................................................................................................................. 6 Part I: Overview ...................................................................................................................................26 1 Background ...................................................................................................................................26 2 Objectives.......................................................................................................................................27 3 Methodology..................................................................................................................................27
3.1 Definitions .............................................................................................................................................. 27 3.2 Sampling.................................................................................................................................................. 28 3.3 Implementation.................................................................................................................................... 30
Part II: Survey Findings.....................................................................................................................32 4 Profile of Workers.......................................................................................................................32 5 Situation of Employed Workers .............................................................................................33
5.1 Employment........................................................................................................................................... 33 5.2 New Hardships ..................................................................................................................................... 39 5.3 Coping Mechanisms & Livelihood Strategies .......................................................................... 43
6 Situation of Unemployed Workers........................................................................................45 6.1 Termination ........................................................................................................................................... 45 6.2 What are Retrenched Workers Doing Now?............................................................................ 54 6.3 New Hardships ..................................................................................................................................... 57 6.4 Coping Mechanisms & Livelihood Strategies .......................................................................... 58
7 Job Search Strategies..................................................................................................................61 7.1 Unemployed Workers Who Have Found New Job ................................................................ 61 7.2 Workers Looking For New Job....................................................................................................... 65 7.3 Re‐Training ............................................................................................................................................ 69
Part III: Conclusions and Recommendations ............................................................................72
Benchmarking Report – Prepared by CIDS 3
List of Figures Figure 1: Employed Workers by Type of Employment......................................................................... 35 Figure 2: Casual Workers by Starting Year of Employment ............................................................... 36 Figure 3: Employed Workers by Type of Contract.................................................................................. 37 Figure 4: Employed Workers by Duration of Fixed Duration Contracts ....................................... 38 Figure 5: Contract Duration of Workers Employed At Current Factory for Over 2 Years..... 38 Figure 6: New Hardships on Employed Workers.................................................................................... 40 Figure 7: Compared to 2008, any changes in your income from factory job? ............................ 41 Figure 8: Since Jan 2009, has your family sent another member to find income?.................... 45 Figure 9: Number of Months Since Termination from Garment Factory...................................... 46 Figure 10: Unemployed Workers by Length of Fixed Duration Contract ..................................... 48 Figure 11: If you had a fixed duration contract, were you terminated at the end of your contract?.................................................................................................................................................................... 48 Figure 12: Have you received lay‐off compensation from the factory?......................................... 50 Figure 13: Received Lay‐off Compensation by Type of Contract ..................................................... 51 Figure 14: Were you given advance notice of your termination? .................................................... 52 Figure 15: If you received advance notice, how many days prior to termination? .................. 53 Figure 16: What are Retrenched Workers Doing Now? ....................................................................... 55 Figure 17: Were you able to save money during your employment?............................................. 58 Figure 18: How are you coping with your new hardships? ................................................................ 59 Figure 19: How long did it take you to get a new job? (Weeks)........................................................ 61 Figure 20: Who helped you find this new job? ......................................................................................... 62 Figure 21: Did you have to do training for the new job?...................................................................... 63 Figure 22: Compared to your previous factory job, is your income at the new job higher, lower or the same?................................................................................................................................................ 63 Figure 23: What kind of job do you want in the long term? ............................................................... 64 Figure 24: How long have you been unemployed?................................................................................. 65 Figure 25: Who is helping you find a new job?......................................................................................... 66 Figure 26: Would you consider re‐training for a new job? ................................................................. 69 List of Tables Table 1: Sample Size............................................................................................................................................. 28 Table 2: Sampling Methodology...................................................................................................................... 28 Table 3: Targeted versus Achieved Number of Operating Factories .............................................. 29 Table 4: Targeted versus Achieved Number of Unemployed Workers by District................... 30 Table 5: Unemployed Workers by Home Province................................................................................. 31 Table 6: Personal Profile of Workers Surveyed ....................................................................................... 32 Table 7: Household Situation of Workers Surveyed .............................................................................. 33 Table 8: Employed Workers by Type of Factory ..................................................................................... 33 Table 9: Benefits by Category of Employment.......................................................................................... 35 Table 10: Type of Employment by Type of Factory................................................................................ 36 Table 11: Employed Workers without Contracts by Type of Employment ................................. 39 Table 12: “I don’t have enough money to spend on …”......................................................................... 42 Table 13: Change in Type of Factory of Workers Retrenched from Previous Garment Job in 2009 ............................................................................................................................................................................ 42
Benchmarking Report – Prepared by CIDS 4
Table 14: Change in Type of Employment of Workers Retrenched From Previous Garment Job in 2009 ............................................................................................................................................................... 43 Table 15: What have you done to cope with these problems at the factory?.............................. 44 Table 16: Reason for Termination ................................................................................................................. 46 Table 17: Unemployed Workers by Type of Employment .................................................................. 47 Table 18: Unemployed Workers by Type of Contract ........................................................................... 47 Table 19: Compensation for Termination by Contract Type.............................................................. 49 Table 20: Member of Trade Union vs. Compensation Pay................................................................... 50 Table 21: What the Law Says on Notice of Termination ...................................................................... 52 Table 22: Member of Trade Union vs. Advance Notice ......................................................................... 53 Table 23: For those who have found a new job in a different sector than garment, which sector? ........................................................................................................................................................................ 56 Table 24: For current jobseekers, which sector are you looking for a new job? ....................... 56 Table 25: If you are currently in training, what activity?..................................................................... 57 Table 26: If you borrowed money, from whom? ..................................................................................... 59 Table 27: What were some challenges in finding a new job?............................................................. 62 Table 28: If this is not the job you want in the long term, what job do you want? ................... 65 Table 29: What are challenges in finding a new job?............................................................................. 67 Table 30: If you don’t find a job, what will you do?................................................................................ 67 Table 31: Comparison of Unemployed Workers Who Have Found New Job vs. Looking for New Job...................................................................................................................................................................... 68 Table 32: If you want to train in another sector, what subject?........................................................ 70 Table 33: What conditions would enable you to join a training program?.................................. 70 Table 34: Why are you not interested in re‐training? ........................................................................... 71 Table 35: Summary of New Hardships and Coping Mechanisms of Workers............................. 72 Table 36: Summary of Critical Issues and Recommendations........................................................... 79
Benchmarking Report – Prepared by CIDS 5
Acknowledgements First and foremost, I would like to thank all 2000 interviewees for sharing with us your valuable stories and time, especially to employed workers who allowed us to interview them in the evenings after a long day at work. In this regard, I would also like to thank our Fieldwork Coordinator, Mr. In Chanthol, and all the enumerators for their commitment to the work, which often entailed working late hours to search for and interview workers. Special thanks to Mr. Kim Chan Samnang, Mr. Din Sam Ath and Mr. Thach Chanpanha. Without your efficient and strong trade union networks, it would have been impossible to reach the target sample of 2000 workers. Thanks also to all the staff at CIDS for their work and assistance throughout the research process. Last but not least, I would to extend my gratitude to the International Labor Organization (ILO) and to the United Nations Development Fund (UNDP) for initiating and contributing to the financing of this important project. In particularly, thank you Ms. Anne Ziebarth at Better Factories Cambodia, and Dr. Sukti Dasgupta and Mr. David Williams at the ILO‐SRO Office in Bangkok for your cooperation and constructive feedbacks throughout the study. Sincerely, Kang Chandararot
Benchmarking Report – Prepared by CIDS 6
Executive Summary PART I: OVERVIEW 1. Background
In early 2009, an ILO‐commissioned rapid assessment in Cambodia identified the garment sector as the most vulnerable to the impacts of the global economic downturn. To understand the financial and human impact of the global economic downturn on the garment sector, specifically on workers, the ILO and UNDP are collaborating with the Cambodia Institute of Development Study (CIDS) on a comprehensive six‐month tracking survey of 2000 workers. 2. Objectives
This project will track a group of 2000 garment factory workers – both recently laid‐off and vulnerable to being laid‐off – over a period of six months, specifically monitoring i) new hardships faced by workers and her/his household, ii) coping mechanisms, iii) job searching strategies and iv) what firms are doing to mitigate the adverse impacts of the crisis on their workforce. The project consists of an initial benchmarking survey to collect baseline data on the current situation, followed by two tracking surveys in 3‐month intervals. This specific report pertains to the benchmarking survey conducted from September 2009‐December 2009. 3. Methodology
3.1. Definitions
There are two study subjects in this project: employed and unemployed workers. Employed workers refer to workers currently employed in the garment industry, including workers who may have experienced retrenchment but have found a new job in the garment sector, as well as workers who are employed at factories that are temporarily closed due to economic hardships. Unemployed workers refer to workers who have been retrenched from the garment industry since January 1, 2009 and remain unemployed from the garment sector. This may include retrenched workers who have found a new job in other sectors.
3.2. Sampling
A total of 2000 workers will be tracked in this study – 1200 employed and 800 unemployed workers – in Phnom Penh and surrounding suburban areas, where the vast majority of Cambodia’s garment factories are clustered.
Benchmarking Report – Prepared by CIDS 7
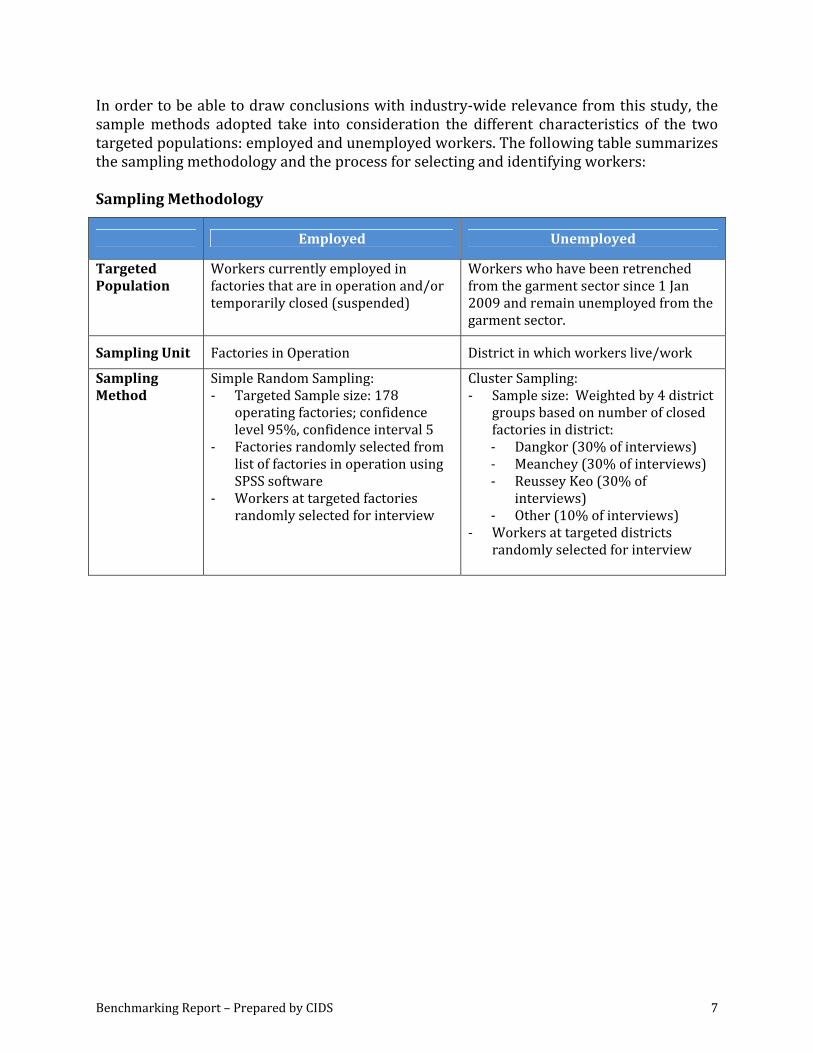
In order to be able to draw conclusions with industry‐wide relevance from this study, the sample methods adopted take into consideration the different characteristics of the two targeted populations: employed and unemployed workers. The following table summarizes the sampling methodology and the process for selecting and identifying workers: Sampling Methodology
Employed Unemployed
Targeted Population
Workers currently employed in factories that are in operation and/or temporarily closed (suspended)
Workers who have been retrenched from the garment sector since 1 Jan 2009 and remain unemployed from the garment sector.
Sampling Unit Factories in Operation District in which workers live/work
Sampling Method
Simple Random Sampling: ‐ Targeted Sample size: 178
operating factories; confidence level 95%, confidence interval 5
‐ Factories randomly selected from list of factories in operation using SPSS software
‐ Workers at targeted factories randomly selected for interview
Cluster Sampling: ‐ Sample size: Weighted by 4 district
groups based on number of closed factories in district: ‐ Dangkor (30% of interviews) ‐ Meanchey (30% of interviews) ‐ Reussey Keo (30% of
interviews) ‐ Other (10% of interviews)
‐ Workers at targeted districts randomly selected for interview
Benchmarking Report – Prepared by CIDS 8
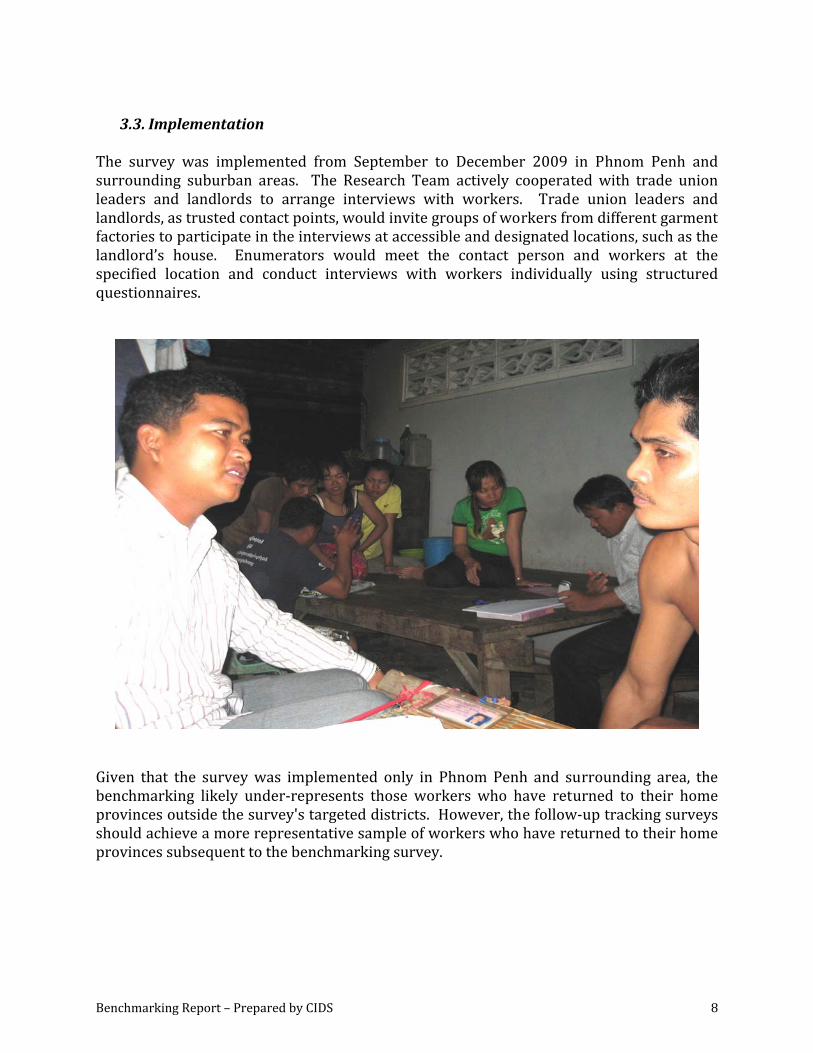
3.3. Implementation
The survey was implemented from September to December 2009 in Phnom Penh and surrounding suburban areas. The Research Team actively cooperated with trade union leaders and landlords to arrange interviews with workers. Trade union leaders and landlords, as trusted contact points, would invite groups of workers from different garment factories to participate in the interviews at accessible and designated locations, such as the landlord’s house. Enumerators would meet the contact person and workers at the specified location and conduct interviews with workers individually using structured questionnaires.
Given that the survey was implemented only in Phnom Penh and surrounding area, the benchmarking likely under‐represents those workers who have returned to their home provinces outside the survey's targeted districts. However, the follow‐up tracking surveys should achieve a more representative sample of workers who have returned to their home provinces subsequent to the benchmarking survey.
Benchmarking Report – Prepared by CIDS 9
PART II: SURVEY FINDINGS
4. Profile of Workers
There are no major distinctions in the personal profile of employed and unemployed workers surveyed. Among the 2000 workers surveyed, 90% are female. The majority of workers are single (68% for employed, 60% for unemployed). Most workers are around 23‐25 years of age. Almost all of the 2000 garment workers surveyed (94%) have no more than a 9th grade education, and 95% of them are migrants, typically from Kampong Cham, Prey Veng, Svay Rieng, Kampong Thom and Kandal provinces. Similarly, their household situation is relatively the same. Eight out of ten workers surveyed are income earners. On average, workers are obligated to help financially support 3 other family members in addition to themselves.
5. Situation of Employed Workers
5.1. Employment
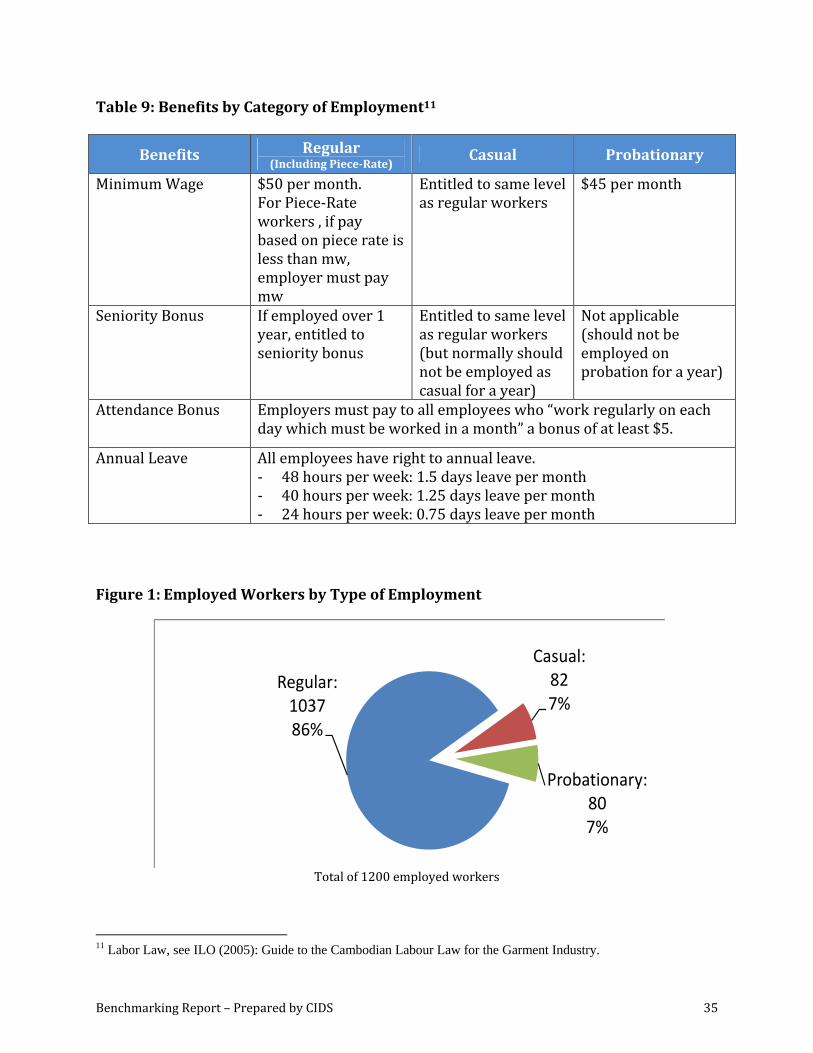
The 1200 employed workers surveyed come from 199 operating garment, textile and footwear factories located in Phnom Penh and surrounding suburban areas, of which 120 are exporting factories and 79 are non‐exporting factories, which are typically subcontractors of exporting factories.1 Sixty‐seven percent of employed workers surveyed are from exporting factories, and 33% are from non‐exporting factories. On average, interviewees have been employed in the garment industry for 4 years. Even so, 31% of workers interviewed just started working at their current factory in 2009. Among the 1200 employed workers surveyed, 49% previously worked at a different garment factory, and 27% of those workers were retrenched during 2009. The majority of employed workers surveyed (86.4%) are currently regular workers, while 6.9% are casual workers and 6.7% are probationary. Nonexporting factories have a higher percentage of casual and probationary workers than exporting factories. The data also shows that some workers are employed as casual workers long term, though normally they should be hired only short term. Of the 82 casual workers surveyed, 26% have been employed as a temp for over 1 year. Similarly, some workers have been on probation longer than the legal limit of 3 months. Among the 80 probationary workers surveyed, the average length of probation is 5 months. Ten percent of them have been probationary for over 12 months. Sixty‐five percent of employed workers surveyed have employment contracts, while 35% are working without. Within the group of workers who replied they have no contract are
1 In order to export, factories must register with the Ministry of Commerce (MOC). Therefore, this study defines exporting factories as those listed in the MOC registry, and non-exporting factories as those not listed in the MOC registry.
Benchmarking Report – Prepared by CIDS 10
workers who are not sure if they have a contract. Based on the experience of ILO‐Better Factories Cambodia monitors, many workers are unaware that they have employment contracts. It is likely, therefore, that more than 65% of employed workers have contracts. Of the 784 workers who are certain they have a contract, 69% have fixed duration contracts (FDC) and 31% have undetermined duration contracts (UDC). Almost all of the workers with FDC (98%) have duration of less than 1 year. For those working without a contract, 85% of them are regular workers, while 6% are casual workers and 8% are on probation. Workers in this group who are not aware that they have an employment contract most likely would be employed under an UDC. The majority of these workers (54%) have worked with the same employer for over 2 years. By type of factory, 65% are working at exporting factories and 35% are working at non‐exporting factories. The Arbitration Council finds that FDC may be renewed only if the total length of the employment relationship does not exceed 2 years. If the total period of the contract is more than 2 years then the contract will automatically become an UDC. The survey finds that some long term employees are still working under a shortterm FDC. 33% of workers who have been employed at the same factory for over 2 years have contract duration of 1 year or less. Thirty‐one percent of those employed at exporting factories for over 2 years have a short term contract of 1 year or less, compared with 39% at non‐exporting factories.
5.2. New Hardships
During the interview, workers were asked to list all the hardships they have encountered since January 1, 2009 at their workplace. Workers were specifically asked to compare the situation in 2009 with that in 2008. The majority of employed workers (53% of 1037 workers who were employed in the garment industry in 2008) have experienced reduced overtime. The consequence of this is a reduction of effective income, which is the most severe hardship experienced by workers. In addition to reduced overtime, many have also seen their regular working hours cut in various forms. More than one‐quarter (29%) of employed workers who worked in the garment industry in 2008 have encountered compulsory paid leave, while 15% stated that they have gone through work suspensions. Six percent have experienced a shorter work week, 4% have faced compulsory unpaid leave and 4% have less regular working hours. Some workers (45%) reported that it is more difficult to ask for days off now compared to before. This could reflect the fact that due to layoffs, employers have less flexibility and find it harder to adjust their production process to accommodate workers taking time off.
Benchmarking Report – Prepared by CIDS 11
Many workers (39%) also feel that the safety and health services at the factory have deteriorated since January 2009. Some complaints include fewer functional bathrooms in the factory; worse ventilation; and less medicine disbursed at the factory’s clinic. Some workers also reported delays in salary payments (10%) and less or no bonuses (6%) in 2009. These changes reflect firms’ reaction to the economic downturn. The most severe impact of these factory‐level changes due to the global crisis is on the income of workers; 45% of the 1037 workers experienced a decline in their income in 2009, earning $17 less each month, on average. There is also an increase in the number of workers who feel that they do not have enough money to cover essential basic needs today compared to one year ago, which is a reflection of the declining income. More than half of the workers surveyed (55%) have difficulties covering their food expense today; only 28% felt this way one year ago. Similarly, more workers feel that they lack money to finance their children’s education, transportation and health care today than one year ago. A majority of workers (58%) feel that they do not have enough money to send home today, compared to 43% one year ago. Another effect of the reduction in income is on savings. In the event that they are laid‐off, the majority of garment workers do not have any savings. About three‐quarters of employed workers interviewed said they are not able to save any money from their current job, while only about one‐quarter have some savings.
5.2.1. Employed Workers Retrenched From Previous Garment Factory in 2009 Eleven percent of the 1200 employed workers interviewed were retrenched from their previous garment factory job in 2009. 67% of these workers were previously employed at exporting factories and 33% at non‐exporting factories. Thirtyfour percent of the workers who use to work at an exporting factory are now working at a nonexporting factory. Given that non‐exporting factories are not monitored, it is likely that labor compliance and working conditions are low. Some of these workers are in a worse employment position now than at their previous job. 81% were employed as regular workers at their previous job; compared with only 63% at the current job. The relatively lower figure is due to the fact that many of the workers are currently probationary. However, 11% of workers who were regular workers at their previous job are now casual workers at their new job. Workers are working fewer hours at their new garment job. At their previous job, workers worked 60 hours per week, including overtime, on average. Now, most of them are working 56.5 hours. While there are no data to compare salary levels between old and new garment job, the fall in working hours indicates a fall in income for these workers.
Benchmarking Report – Prepared by CIDS 12
These findings suggest that although some garment workers are able to get another job in the garment sector after being retrenched, the employment conditions may be worse than before in terms of type of employment, income, and possibly working conditions.
5.3. Coping Mechanisms & Livelihood Strategies
5.3.1. Coping with Problems at the Factory
Many workers (48.5%) stated that they have sought help from their trade union to deal with the new hardships at the factory such as less overtime, deterioration of safety and health, late payment of salary, and difficulties in asking for annual leave. Amongst the 1200 employed workers interviewed, 59% are members of a trade union, of which 46% said they have received advice and counseling from their trade union (such as on taking leave) and 2% received financial support. Many workers (23%) have sought help from their group monitors regarding problems at their factory. Ten percent stated that they do not know what to do, while 5% said they will solve their problems by themselves. Twelve workers are looking for a new job with better pay at a different factory. One person said that if the problems do not ease, she will return to her hometown.
5.3.2. Coping with Decline in Income
For most workers, their ultimate reason for entering the garment sector workforce is to earn cash income for their family. If this mission fails, their family will call them back home. In face of declining income, workers have cut back spending on their own basic needs to cover remittances home. At the household level, the findings indicate that the decline in garment workers’ income has produced an added worker effect, in which household are sending another member of the family to find additional income (14.3% of employed interviewees). In almost all cases, the added worker is a female sibling, around the age of 16‐28 years old. Eight out of ten added workers aim to get a job in the garment sector.
6. Situation of Unemployed Workers
6.1. Termination
The 800 unemployed workers surveyed come from 172 factories located in Phnom Penh and surrounding suburban areas, of which 100 factories are exporting factories and 72 are non‐exporting factories. The majority of unemployed workers (83%) come from exporting factories, and 16% are from non‐exporting factories. The majority of the workers surveyed (58% of 800 unemployed) were recently retrenched from the factory, 1 month ago or less. Among the 800 unemployed, 21% were retrenched 2‐3 months ago, 11% were terminated 4‐6 months ago, and a few of them have been unemployed for longer than 6 months. These figures highlight that unemployed garment
Benchmarking Report – Prepared by CIDS 13
workers have a very short period of time for job‐seeking; if they cannot find a new job in 1‐2 months, they must return to their home province. Most of the workers lost their jobs because the factory closed (47%) or they were laid‐off because of less work at the factory (42%). 72 workers (or 9%) voluntarily resigned from the factory because of less overtime and consequently, lower income, which was not sufficient to cover their financial needs.
At their most recent previous job, most unemployed workers were hired as regular employees (75%), 22% were casual workers, and 4% were probationary. Among the 654 unemployed workers asked, 60% of them had employment contracts (54% with fixed duration contracts and 6% with undetermined duration contracts), while 40% were working without one. Seven people did not know if they had an employment contract. However, as explained above, it is likely that a significant number of the workers who said they had no contract were confused about the concept, and they had a contract without realizing it. In general, unemployed workers had short contracts; 76% of those with FDCs had contracts of less than or equal to 6 months. Seventy‐six percent of them were terminated before the end of their contract, while 21% were terminated at the end of their contract and 3% did not know. One important aspect of the survey is to collect data on the termination process, and to get a better picture of the compliance of employers with legal requirements. There are two key aspects of the termination process: 1) compensation and 2) notice of termination. According to the Cambodian Labor Law, workers with fixed duration contracts are entitled to severance payment upon termination and those with undetermined duration contracts are entitled to lay‐off compensation. Only 34% of the 800 unemployed workers received compensation from their employers related to their termination, while 66% did not get any compensation (Figure 12). Among the 527 workers who did not get payment, 525 of them were legally entitled to receive it; 2 workers were not entitled because they worked under an UDC for less than 6 months. A higher percentage of workers who were employed at exporting factories received layoff compensation than those at nonexporting factories, 36% compared to 27% respectively. The data also indicates that trade union members are more likely to receive compensation than nonmembers. Thirty‐nine percent of trade union members were compensated for their termination, compared with 28% of non‐members.
The Cambodian Labor Law also states that employers must give employees sufficient advance notice prior to termination, with the exception of cases of serious misconduct. The survey finds that over threequarters of the unemployed workers who were legally
Benchmarking Report – Prepared by CIDS 14
entitled to receive advance notice from their employers did not get a notice.2 Workers at exporting factories are more likely to get prior notice than those in nonexporting factories: 21% compared to 17%. Twenty‐one percent of trade union members got prior notice of termination compared to 20% of non‐members. Workers who received advanced notice on their termination usually received layoff compensation from their employers, compared to workers who did not get advance notice. Among the 165 workers who got advanced notice3, 54% received lay‐off compensation from their employer. On the other hand, only 28% of workers who were terminated without notice were provided lay‐off compensation. With most workers terminated without any advance notice and/or lay‐off compensation, it is thus no surprise that 63% of the 800 unemployed workers surveyed feel that they were not treated fairly by management during their termination. More than half of the 800 unemployed workers (57%) were members of a trade union. Sixtysix percent (or 304 workers) received assistance from their trade union. The primary action taken by trade unions to help laid off workers was to organize strikes to solve the problems mentioned above (90%). Besides this, some members received financial support (7 people), help finding a new job (3 people), assistance finding training (1 person), and legal advice (15 people).
6.2. What are Retrenched Workers Doing Now?
In the sample of 2000 garment workers, 958 workers have been retrenched at least once in 2009 (800 unemployed workers and 158 currently employed workers who were laid‐off from their previous garment factory job in 2009). Data from this baseline survey provides us with some indication on what retrenched workers are doing now.
2 Based on the law, 698 of the 800 unemployed workers have the right to an advance notice from their employers; 102 workers are not qualified because they worked under a FDC for 6 months or less 3 Of the 165 workers who received advance notice, employers were not obligated to give notice to 24 workers because they worked for 6 months of less with a FDC.
Benchmarking Report – Prepared by CIDS 15
What are Retrenched Workers Doing Now?
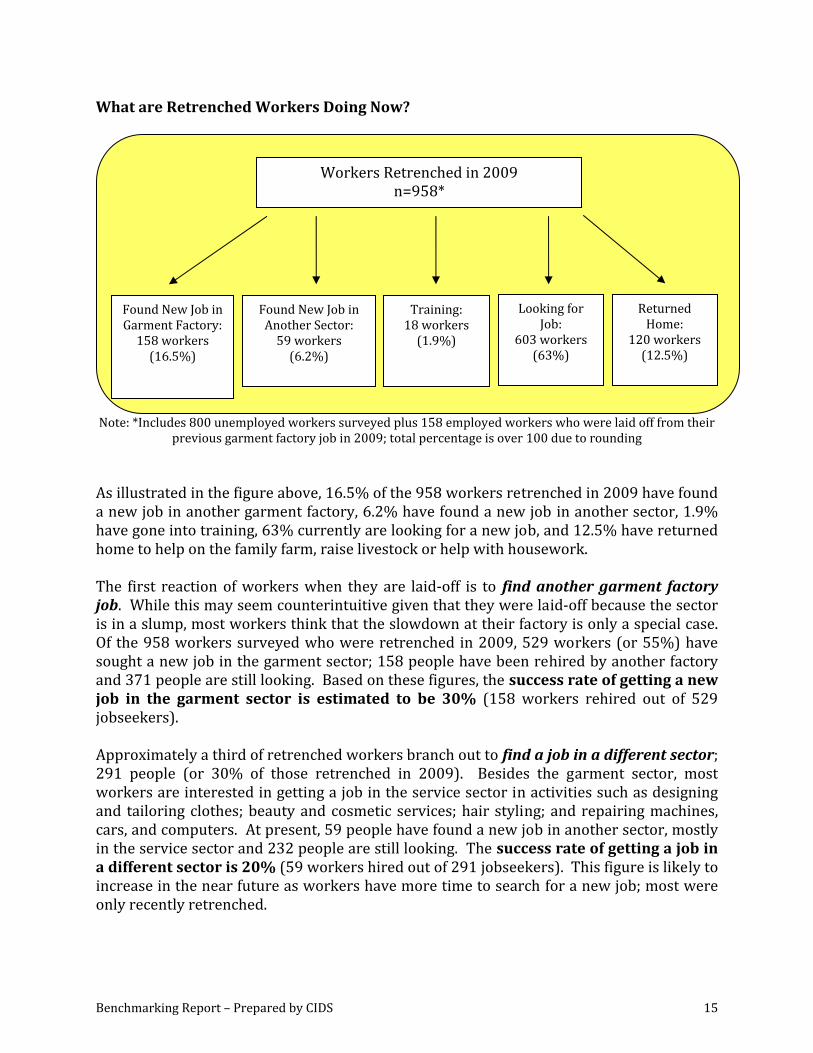
Note: *Includes 800 unemployed workers surveyed plus 158 employed workers who were laid off from their
previous garment factory job in 2009; total percentage is over 100 due to rounding As illustrated in the figure above, 16.5% of the 958 workers retrenched in 2009 have found a new job in another garment factory, 6.2% have found a new job in another sector, 1.9% have gone into training, 63% currently are looking for a new job, and 12.5% have returned home to help on the family farm, raise livestock or help with housework. The first reaction of workers when they are laid‐off is to find another garment factory job. While this may seem counterintuitive given that they were laid‐off because the sector is in a slump, most workers think that the slowdown at their factory is only a special case. Of the 958 workers surveyed who were retrenched in 2009, 529 workers (or 55%) have sought a new job in the garment sector; 158 people have been rehired by another factory and 371 people are still looking. Based on these figures, the success rate of getting a new job in the garment sector is estimated to be 30% (158 workers rehired out of 529 jobseekers). Approximately a third of retrenched workers branch out to find a job in a different sector; 291 people (or 30% of those retrenched in 2009). Besides the garment sector, most workers are interested in getting a job in the service sector in activities such as designing and tailoring clothes; beauty and cosmetic services; hair styling; and repairing machines, cars, and computers. At present, 59 people have found a new job in another sector, mostly in the service sector and 232 people are still looking. The success rate of getting a job in a different sector is 20% (59 workers hired out of 291 jobseekers). This figure is likely to increase in the near future as workers have more time to search for a new job; most were only recently retrenched.
Workers Retrenched in 2009 n=958*
Found New Job in Garment Factory: 158 workers (16.5%)
Found New Job in Another Sector: 59 workers (6.2%)
Training:18 workers (1.9%)
Looking for Job:
603 workers (63%)
Returned Home:
120 workers (12.5%)
Benchmarking Report – Prepared by CIDS 16
Half of the 59 workers who have found new jobs outside the garment sector are working in the service sector in activities such as clothing retail; sewing for a private tailor shops; and various informal activities such as selling vegetables, selling desserts, or driving a tuk‐tuk. Fourteen of the surveyed workers have returned to work on the farm; this figure will likely increase in the near future as 77% of workers currently looking for a job say they will return home if they cannot find a job in the next month or so. Eight workers have entered the entertainment sector, 3 in beer promotion and 5 in massage.4 Eighteen unemployed workers are currently enrolled in a training program. Most of them are learning to design clothes (11 people), or taking courses on cosmetics and beauty treatments (5 people). One person is upgrading her sewing skills by learning to operate a two‐needle machine and one person is learning Korean language. Of the 18 retrenched workers in training, 13 of them are studying at private shops, 3 at a government training facility and 2 at a private training facility. Fourteen workers paid for the training (ranging from $30 to $250 per course), and 4 of them received it at no cost. To pay for their training, most of the workers used their savings (7 workers), used their lay‐off compensation (3 workers), borrowed from family (3 workers) and 1 worker sold some of her assets. After finishing their training, 78% (14 of the 18 workers in training) said they will start their own business. Two workers said they would return to work in a garment factory, 1 said she will look for work at a cosmetic shop and 1 worker plans to migrate to work in South Korea.
6.3. New Hardships
As a result of their termination, unemployed workers have encountered a number of new hardships as follows:
No advance notice: For 77% of unemployed workers, their lay‐off came as a surprise, because their employers did not give them any advance notice prior to termination. Workers were unprepared for unemployment.
No compensation for termination: In addition to the shock of unemployment and loss in income, 66% of the 800 workers did not receive lay‐off compensation from their employer.5
No savings: Seven out of ten unemployed workers do not have any savings to help them get through the unemployment period.
4 In selecting unemployed workers, the survey team randomly selected workers and did not target a specific type of occupation. Thus, these figures on workers entering the entertainment sector are comparatively lower that that found in the UNIAP study that came out in June 2009, which specifically surveyed workers in the entertainment sector. 5 3 of the 800 unemployed workers were not legally entitled to compensation pay because they worked with an UDC for 6 months of less.
Benchmarking Report – Prepared by CIDS 17
Some workers retrenched twice in 2009: 85 workers or 11% of 800 unemployed workers surveyed were retrenched at least two times in 2009. After their first lay‐off, most of these workers were able to find a new job in another garment factory within 1 month of their termination. They were employed at their most recent job for about 4 months on average, and then retrenched again.
Less income at new job: 59 out of the 800 unemployed workers have found new jobs outside of the garment sector. However, 62.7% of them are earning less income at their new job compared to their previous garment factory job, on average about $24 less per month.
6.4. Coping Mechanisms & Livelihood Strategies This section presents the survey findings on coping mechanisms and livelihood strategies of unemployed workers, as it pertains to the 662 unemployed workers who are still in Phnom Penh but are working in a different sector (59 people) or currently looking for a job (603 people), and does not include those who have returned home or those presently in training. Some ways that unemployed workers are coping with the new hardships are the following:
Borrow money: Most workers are covering their cash shortfall by borrowing money (277 people or 42%). They usually borrow from their family (39%) or friends (39%). Some workers have borrowed from a private money lender (12%), their landlord (4%), a bank (2%), and other sources.
Help from family or spouse: In addition, some workers are getting support from their family and relatives in the form of food and housing (215 people or 33%). Some of those who are married are currently being supported by their spouse’s income (125 people, 19%).
Use own savings: Two hundred people were able to accumulate some savings during their previous employment. Among the 200 people, 75 people have already used up all of their savings, 115 have used some of it, and 10 people have not touched their savings yet.
Use layoff compensation pay from factory: 273 people received lay‐off compensation. Of those that received compensation, 102 workers have used this money to finance their living costs during the job‐seeking period.
Family sent another member to find work: To cope with the loss of remittances, 72 households (11% of 662 workers) have sent another family member to find work. The added worker is typically a sister around 18‐26 years old. The majority of these added workers (88%) are looking for or have found a job in the garment sector.
Side job: Some workers (38 people) have picked up a temporary side job to earn daily income such as selling perfume, running tuk‐tuks, providing tailoring, nail manicuring or other services.
Benchmarking Report – Prepared by CIDS 18
Other coping mechanisms: Nine people said they have reduced spending on basic needs. Seven workers say they are occasionally called to work by a factory as floating workers, which allows them to earn some daily income.
7. Job Searching Strategies
7.1. Unemployed Workers Who Have Found New Job
Most of the 59 people who have found a new job, did so in less than 2 weeks (57.6%). The majority said they found the job on their own (32 people). Some workers relied on their friends (15 people), and family (9 people). Only 1 person referred to a newspaper for information on job vacancy. The main challenge they faced during the job‐seeking period was lack of money to finance their living expenses. The majority of these 59 workers (62.7%) are earning less income at their new job compared to their previous garment factory job, while 32% are earning more. Those earning lower pay are working as assistants at tailor shops, retail clerks, teachers, taxi drivers, housemaids, farmers, and beer promoters. On average, their income has fallen by $24 per month. Those earning higher pay, about $50 higher per month on average, are working as skilled tailors, masseuses, beer promoters, waiters, and hair stylists. In terms of working hours (regular and overtime), 46% said they are working less at their new job, 36% more, and 18% the same. Six out of ten of them feel that the working conditions at the new workplace are better than at the factory, in regards to stress level, safety, health, or other factors, while 32% feel they are worse and 7% think they are the same. While the new job is not as favorable as their previous factory job in many cases, the majority (61%) are glad to be working. For the majority of workers who have found a new job, their current job is only a transitional one. Among the 59 workers, 48 of them (81%) said they do not want this job in the long term, while 11 people want to stay in this job. Workers who want a different job aspire to design/tailor clothes, open a small business, cosmetics and beauty services, or other.
7.2. Workers Looking For New Job
Most of the 603 unemployed workers currently looking for a new job were recently retrenched (62% have been unemployed for 1 month or less), though there are some job‐seekers who have been unemployed for over 6 months (8%). Given that the survey covered only Phnom Penh and surrounding suburban areas, the data does not fully capture the situation of the long‐term unemployed. When asked how they are looking for a new job, 58% said they are searching on their own. Many are also relying on referrals from their friends (56%) and family (14%). Eight people are searching in newspaper classifieds, 6 people have asked for assistance from trade unions and 5 people through NGOs.
Benchmarking Report – Prepared by CIDS 19
The main challenge workers face in finding a new job is the lack of money to finance their living costs (58%). Another problem mentioned by unemployed workers is that garment factories are not hiring at the moment (or in other words, there is a shortage of labor demand, 13%), and even in factories that are hiring, the process is more difficult than before because there are too many applicants (3.8%). Some workers (10%) complained that they are hampered by their lack of skills or experience. On average, unemployed workers said they will continue to search for a new job for up to 1.5 months, although the majority cannot stay longer than 1 month. In the event that they cannot find a new job, 77% of them will return home to help on the family farm. Thirty‐five workers are considering opening a small business at home. Twenty‐five people plan to enroll in a training program to increase their skills, such as in designing clothes and fixing machines. Some workers said they will find a side income‐generating activity (17 people) such as weaving handicrafts, or take a temporary job at a construction site (10 people). Ten women say they will exit the labor market and stay home to take care of their children. Twenty‐two workers said they don’t know what they will do. Overall, there appears to be no distinction between the profile and skill level of unemployed workers who have found a new job versus those currently looking. The education level of both groups is fairly the same, no more than 9th grade. There are no particular differences in terms of vocational skills. Both groups have approximately 2 years of work experience in the garment industry, and are 25 years of age on average. Their family obligations are also similar. Both categories have to support 3 other family members on average. The majority are single and are not the head of the household. Workers who have found a new job spent 4.7 weeks on average to get the job. Most workers currently looking for new employment have not yet reached that point, and were only retrenched over the past 1 month or less (62% of 603 job‐seekers).
7.3. ReTraining
The majority of the 662 unemployed workers (which includes 59 people who have found a new job outside the garment sector and 603 people looking for a new job) said they would consider re‐training for a new job, especially in a different sector (498 people or 75%) and also in the garment sector (94 people, 14%). Ten percent said they are not interested in training. Of the 498 people considering training in a new sector, 48% of them are interested in learning how to design clothes, 22% in cosmetics, and 13% in hair styling. Other skills unemployed workers are interested in include fixing motors and machines, operating small businesses, cooking, computer work, and foreign languages. More than half of the people (56% of 592 people considering re‐training) said that they can only participate if the training course is short, preferably 6 months or less. Accommodation is also an important condition; 51% said they will need accommodation.
Benchmarking Report – Prepared by CIDS 20
Other conditions that will enable retrenched workers to partake in training include: guaranteed job after training (32%), free course (20%), implementable skills (11%), transportation (4%), and flexible hours so they can work part‐time (3%). The main reason that the 69 unemployed people were not interested in re‐training is that they have no time because they need to support their families (68%). Ten people said their family and/or spouse would not allow them to participate. Other reasons mentioned include: being too old, having no one to take care of their children, just having started a new business, lacking money for training, and not wanting to undergo training. PART III: CONCLUSIONS AND RECOMMENDATIONS
In the following, we list the critical issues uncovered from this survey and the possible recommendations for government, trade unions and development partners to mitigate the impact of the global financial and economic crisis on workers.
(1) DECLINING INCOMES OF EMPLOYED WORKERS
Issue: Employers have responded to the fall in orders by reducing overtime, cutting back working hours, making it more difficult to take annual leave, cutting back on safety and health services at the factory, paying wages behind schedule, and reducing or eliminating bonuses. The consequence of these changes is a decline in income of workers. The fall in income has made it more difficult for workers to cover their basic needs, send remittances home to support their family and save money for emergencies (such as unemployment).
Recommendations:
Government ‐ Provide temporary income support to garment workers ‐ Provide temporary subsidies on rent, transportation and/or other critical basic needs
of workers Trade Unions ‐ Disseminate information to workers on available social programs offered by
government and NGOs that can ease financial pressures of workers, such as healthcare programs
Development Partners ‐ Provision of social programs that can help minimize workers’ expenses on basic needs
such as healthcare and food programs
Benchmarking Report – Prepared by CIDS 21
(2) FACTORIES ENCOUNTERING CASH FLOW PROBLEMS
Issue: Paying wages behind schedule, reducing or eliminating bonuses, cutting back on health services at the factory are some indicators that factories are encountering cash flow problems. Ultimately, these problems hit workers the most.
Recommendations: Government ‐ Assess credit needs of factories and feasibility of providing favorable lending conditions
to factories with short term cash flow problems ‐ Help factories minimize production costs (other than wages) via subsidies on electricity
and utilities, tax exemptions, and transportation ‐ As a strategy to reduce the industry’s vulnerability to economic shocks in the future, it
is necessary to have concerted efforts and policies to increase the competitive advantage of the garment industry through skills improvement (re‐training programs), productivity enhancement, and market diversification. One possibility is to establish a fund to help employers address the needed structural adjustments of the textile and clothing industry.
Development Partners ‐ Projects to increase the competitive advantage of the garment industry through skills
improvement (re‐training programs), productivity enhancement, and market diversification to reduce the industry’s vulnerability to economic shocks in the future
(3) LOW COMPLIANCE TO LEGAL TERMINATION PROCESS
Issue: Only 34% of unemployed workers legally entitled to compensation payment received it, and only 20% received advance notice of their termination. From this study, it is unclear whether this low level of compliance is a matter of factories being unaware of the legal obligations for mass layoffs or unwillingness to comply with the law.
Recommendations:
Government ‐ Awareness building for both employers and employees on legal requirements related to
mass layoff, compensation pay, advance notice, etc, so they are aware of rights and responsibilities.
‐ Monitor the compliance of factories ‐ Require factories to set up a precautionary fund specifically for lay‐off compensation
pay. Government should closely monitor these funds and all information should be made public to give workers a sense of security.
Benchmarking Report – Prepared by CIDS 22
‐ Set up an “early warning system” to monitor potential factory closure. For example, require factories to disclose their financial situation regularly with financial statements, volume of orders, etc.
Trade Unions ‐ Monitor the situation at their factories for potential lay‐offs or closure, opportunities to
dialogue with management, and availability of funds for lay‐off compensation. ‐ Engage in consultations with management when faced with lay‐offs. ‐ Inform workers on their rights such as advance notice and lay‐off compensation pay Development Partners
Help ensure that unions are aware of their rights and responsibilities in the context of mass lay‐offs, terminations and closures.
Help to ensure that factories are aware of their legal obligations, especially on consultation requirements, lay‐off compensation, and advance notice.
Enhance the capacity of unions to engage with employers in a meaningful way when they are confronted with lay‐offs.
Enhance the capacity of unions to monitor potential layoffs and factory closures BFC to continue monitoring working conditions at factories and when possible, refer workers and trade union leaders to available sources of assistance when they are faced with lay‐offs or factory closure
(4) WORKERS EMPLOYED AT NONEXPORTING FACTORIES LESS LIKELY TO GET ENTITLEMENTS
Issue: Workers employed at non‐exporting factories are less likely to receive compensation pay and advance notice. In addition, fewer workers at non‐exporting factories are members of a trade union – 45% compared to 63% of workers employed at exporting factories – meaning that they have no representative to negotiate or bargain with employers. One important finding from this survey is that members of trade unions are more likely to get their entitlements than non‐members.
Recommendations:
Government ‐ Monitor the working conditions, economic situation, and legal compliance at non‐
exporting garment factories. Trade Unions ‐ Work with government and development partners to monitor the situation in non‐
exporting factories through existing trade union networks Development Partners ‐ BFC to expand monitoring efforts in non‐exporting factories
Benchmarking Report – Prepared by CIDS 23
(5) LACK OF MONEY TO FINANCE JOBSEEKING PERIOD FORCING SOME WORKERS TO TAKE JOBS WITH LOWER INCOMES AND LESS FAVORABLE WORKING CONDITIONS
Issue: As this survey reveals, the majority of workers have no savings and few received compensation payment from their employers. Their limited financial resources do not allow for a prolonged job search and therefore, limit their job choices. The financial and time pressures have forced some workers to take jobs with lower incomes and less favorable working conditions. This benchmarking survey finds that 63% of workers who have found a new job in a different sector are earning less income at their new job, while some of the workers who have been rehired in the garment sector are encountering lower income due to fewer working hours and less favorable employment conditions (from a regular worker to casual worker).
Recommendations: Government ‐ Credit for unemployed workers to cover job‐seeking period ‐ Establish social safety nets such as an Unemployment Fund or Insurance Trade Unions ‐ Credit for members to cover job‐seeking period (6) LOW PROSPECTS OF FINDING AND GETTING A NEW JOB
Issue: The success rate of getting job in garment factory is 30%; for jobs in different sectors it is 20%. This could explain why the first reaction of retrenched workers is to look for new jobs in the garment sector. While the chances of getting a job in the garment sector are higher than in other sectors, the survey finds that the jobs tend to be short term. Unemployed workers who were laid‐off twice in 2009, worked at their new job for only 4 months before getting laid off again. Furthermore, most retrenched workers look for a new job on their own, which highlights the lack of employment services in Cambodia and low public awareness of the services currently available.
Recommendations: Government ‐ Develop services of the National Employment Agency (NEA) and increase public
awareness of its services. The NEA was approved by the National Training Board in January of 2008, with the objective to serve as a one‐stop shop to match workers seeking jobs with employers seeking new staff.
‐ Assess the current status and performance of the NEA, outreach, info dissemination channels, areas of improvement and address them.
‐ Establish a national scheme of active labour market policies, e.g. effective public employment services and labor market info systems, organize job fairs
Benchmarking Report – Prepared by CIDS 24
‐ Establish a National Employment Fund to undertake emergency job creation through public works programs, which can also include development of social infrastructure such as community centers, schools
Trade Unions ‐ Increase the capacity of trade unions to provide employment services such as
disseminating employment information to unemployed workers. According to the survey findings, many workers currently turn to their trade union for assistance when they are terminated. However, the primary action taken by trade unions to help laid off workers is to organize strikes. It is possible to increase the efficiency of this existing network by increasing the capacity of trade unions to provide other services.
Development Partners ‐ Assess the current status and performance of the NEA, identify areas of improvement
and work with government to address them. ‐ Assess the types of assistance sought and received by workers, identify areas for
improvement, and work with government and TU to address them. ‐ Work with trade unions to enhance their capacity to provide assistance to workers who
approach them for help. For example, train local unions to gather employment information within their factories and feed it up to the federation level, and work with the federation level unions to enhance their capacity to feed information back down to the local unions.
(7) RETRAINING TO GAIN NEW OR IMPROVED SKILLS
Issue: A majority of unemployed workers stated that they would consider re‐training both for the garment sector and other occupations. For females, most are interested in getting new skills in designing clothes and beauty services (cosmetics and hair styling), while the majority of males are interested in learning how to repair air conditioners, mobile phones, and motorcycles. Most respondents stated that in order for them to attend such courses, though, they would need an allowance for accommodation or transportation, so as to ease the financial pressure at home. On average, workers prefer the idea of a short course of three months or less. Workers also requested training programs to have flexible time schedules so they can work part‐time. Some workers aspire to open their own business after gaining the new skill, and thus, propose that the training programs be linked with credit opportunities. However, the determining factor to enroll in training for most workers is the chance of getting a job afterwards. Where this is considered high, the demand for enrolment will also be high.
Benchmarking Report – Prepared by CIDS 25
Recommendations: Government ‐ Review and improve skills development and training policies and systems in the
country ‐ Increase public awareness on available training programs ‐ Organize industry specific skills development training of those who need some
additional/new training in collaboration with employers ‐ Provide credit for business start up with favorable lending conditions Trade Unions ‐ Disseminate information on training programs to workers ‐ Disseminate information on credit opportunities to workers Development Partners ‐ Organize industry specific skills development training of those who need some
additional/new training in collaboration with employers ‐ Support re‐training programs to make sure workers have skills to take on jobs in other
sectors. ‐ Increase public awareness on training programs ‐ Provide training on developing small businesses for unemployed and underemployed
workers who are interested in it ‐ Facilitate access to credit
Benchmarking Report – Prepared by CIDS 26
Part I: Overview
1 Background In early 2009, an ILO‐commissioned rapid assessment in Cambodia identified the garment sector as the most vulnerable to the impacts of the global economic downturn, because of its high reliance on export markets, especially the United States, and its dependency on foreign direct investment as a source of capital. The assessment predicted that the sector would contract in 2009 to the tune of 3 percent and shed 19,000 jobs. These figures have already been surpassed due to further recent contractions in export orders. Garment exports dropped 21.6% during the first 9 months of 2009.6 Between October 2008 and 2009, 70 exporting garment factories have shut down and approximately 70,000 jobs have been lost7. As the numbers of unemployed have mounted, the Cambodian government and development partners have expressed concerns about the impact of the global economic downturn on the welfare of laid‐off garment sector workers. With garment workers already often considered vulnerable to economic hardship even in good economic times, there are strong indications now that Cambodia’s economic slide has placed increased pressures on the ability of these workers to meet basic needs for food, healthcare, housing, and their children’s education. To understand the impact the global economic downturn is having on the garment sector and its mostly female workforce, the ILO and UNDP are collaborating with the Cambodia Institute of Development Study (CIDS) on a comprehensive six‐month tracking survey of 2000 workers. The survey will gather information on a range of thematic areas related to the economic crisis, including socio‐economic hardships, livelihood strategies and coping mechanisms, job searching strategies, and response measures taken by affected firms. Importantly, this data will also be used to develop empirically‐driven policy recommendations aimed at alleviating short term hardships, boosting skills and employability, and strengthening social protection –both in terms of access and quality‐ for garment sector workers. The study will also form part of a broader ILO research effort covering both industry and firm‐level analyses, the results of which will be presented in a comprehensive synthesis report in the third quarter of 2010.
6 Ministry of Commerce 7 Ministry of Commerce
Benchmarking Report – Prepared by CIDS 27
2 Objectives This project will track a group of 2000 garment factory workers – including employed workers and those recently laid‐off and vulnerable to being laid‐off – over a period of six months, so as to develop a clearer picture of what is actually happening at the individual and family level, especially to gain insight on:
‐ New hardships faced by workers ‐ Coping mechanisms of workers and her/his household ‐ Job searching strategies ‐ What firms are doing to mitigate the adverse impacts of the crisis on their
workforce The project consists of an initial benchmarking survey to collect baseline data on the current situation, followed by two tracking surveys in 3‐month intervals. This specific report pertains to the benchmarking survey conducted from September 2009‐December 2009.
3 Methodology
3.1 Definitions There are two study subjects in this project: employed and unemployed workers. We define these terms below. Employed workers refer to workers currently employed in the garment industry. This includes workers who may have experienced retrenchment but who have found a new job in the garment sector. It also includes workers who are employed at factories that are temporarily closed due to economic hardships but expect to recommence their production in the near future. Unemployed workers refer to workers who have been retrenched from the garment industry since January 1, 2009 and who remain unemployed from the garment sector. This may include retrenched workers who have found a new job in other sectors. It includes not only workers who were laid‐off due to factory closure, but also those who were terminated due to factory downsizing as well as workers who resigned voluntarily because of a decrease in salary due to factors such as no overtime and shorter work weeks.
Benchmarking Report – Prepared by CIDS 28
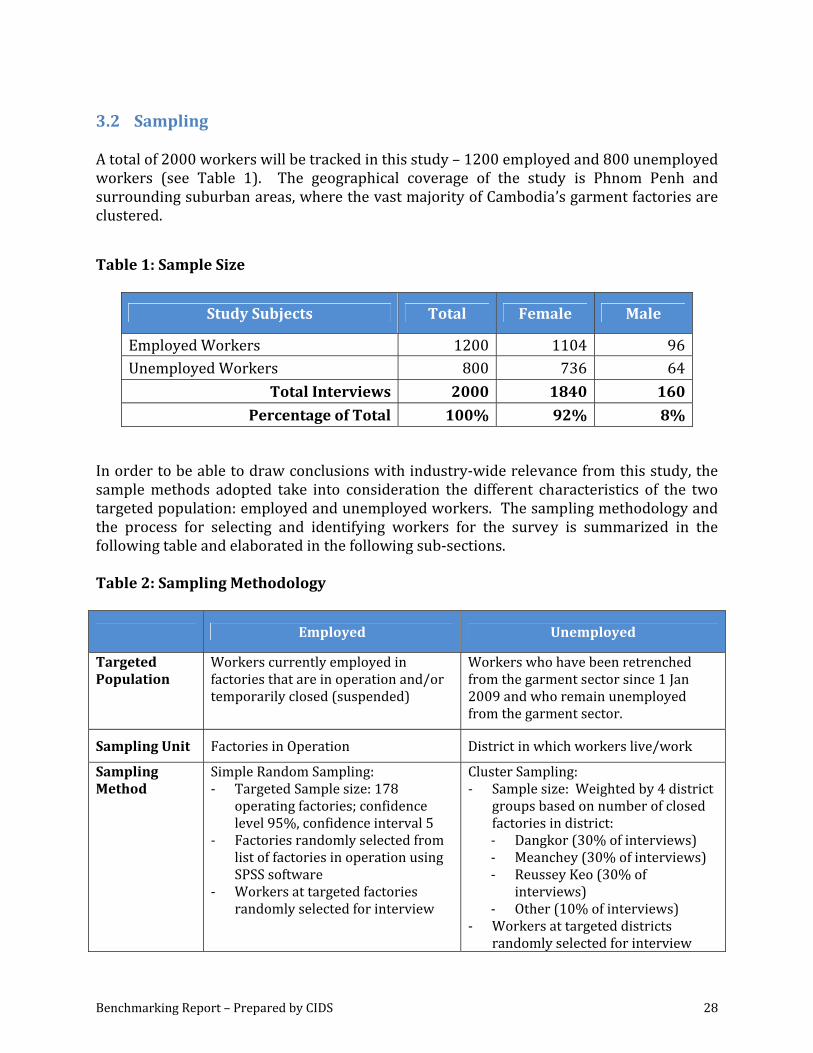
3.2 Sampling A total of 2000 workers will be tracked in this study – 1200 employed and 800 unemployed workers (see Table 1). The geographical coverage of the study is Phnom Penh and surrounding suburban areas, where the vast majority of Cambodia’s garment factories are clustered. Table 1: Sample Size
Study Subjects Total Female Male
Employed Workers 1200 1104 96Unemployed Workers 800 736 64
Total Interviews 2000 1840 160
Percentage of Total 100% 92% 8% In order to be able to draw conclusions with industry‐wide relevance from this study, the sample methods adopted take into consideration the different characteristics of the two targeted population: employed and unemployed workers. The sampling methodology and the process for selecting and identifying workers for the survey is summarized in the following table and elaborated in the following sub‐sections. Table 2: Sampling Methodology
Employed Unemployed
Targeted Population
Workers currently employed in factories that are in operation and/or temporarily closed (suspended)
Workers who have been retrenched from the garment sector since 1 Jan 2009 and who remain unemployed from the garment sector.
Sampling Unit Factories in Operation District in which workers live/work
Sampling Method
Simple Random Sampling: ‐ Targeted Sample size: 178
operating factories; confidence level 95%, confidence interval 5
‐ Factories randomly selected from list of factories in operation using SPSS software
‐ Workers at targeted factories randomly selected for interview
Cluster Sampling: ‐ Sample size: Weighted by 4 district
groups based on number of closed factories in district: ‐ Dangkor (30% of interviews) ‐ Meanchey (30% of interviews) ‐ Reussey Keo (30% of
interviews) ‐ Other (10% of interviews)
‐ Workers at targeted districts randomly selected for interview

Benchmarking Report – Prepared by CIDS 29
3.2.1 Sampling Methodology for Employed Workers For employed workers, we are interested in getting data that can provide a representative picture of what is happening to workers in garment, textile and footwear factories (henceforth referred to as just garment factories) that are currently in operation, which includes those effectively in operation and those undergoing temporary suspensions due to the economic situation but expected to recommence production in the near future (within 2 months). Therefore, the sampling unit is the number of factories in operation, which should include both exporting and non‐exporting factories. Ministry of Labor and Vocational Training data shows 332 exporting and non‐exporting factories in operation during 2009. Based on this population size, confidence level of 95% and confidence interval of 5, a representative sample size to capture the situation of employed workers in the garment industry is 178 factories. Table 3: Targeted versus Achieved Number of Operating Factories
Targeted Achieved
Number of Operating Factories 178 199
3.2.2 Sampling Methodology for Unemployed Workers In selecting the sampling methodology for unemployed workers, we need to take into consideration the feasibility of implementation. Unlike employed workers, we cannot plan our sampling procedure based on the number of closed factories because we want to include in the sample not only workers who were retrenched due to factory closure, but also due to factory downsizing and voluntary resignation because of lower income resulting primarily from less/no overtime and shorter work weeks. The survey ensures the representativeness of the unemployed population by focusing on the districts in which workers live. Workers generally live in the same district as their workplace, usually in walking distance to reduce cost. Sampling based on district would give us a broad coverage area, and therefore, higher chances of finding unemployed workers randomly. In addition, this method avoids bias in terms of workers’ new occupations in restaurants, the entertainment sector, and other places of employment. Taking account of these considerations, we employed a cluster sampling method, which is weighted by the percentage of closed factories in the district. Data from both the Ministry of Commerce and Ministry of Labor and Vocational Training shows that 90% of closed factories are located in 3 main districts: Dangkor, Meanchey, and Reussey Keo districts. In
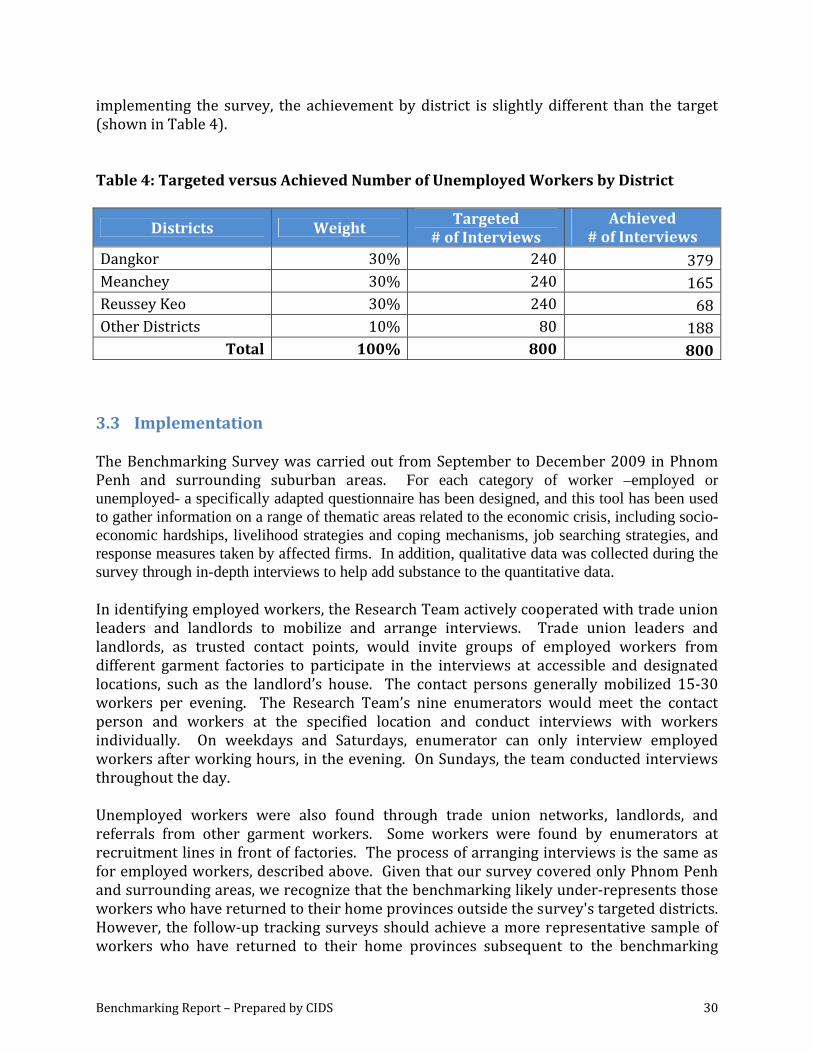
Benchmarking Report – Prepared by CIDS 30
implementing the survey, the achievement by district is slightly different than the target (shown in Table 4). Table 4: Targeted versus Achieved Number of Unemployed Workers by District
Districts Weight Targeted
# of Interviews Achieved
# of Interviews Dangkor 30% 240 379Meanchey 30% 240 165Reussey Keo 30% 240 68Other Districts 10% 80 188
Total 100% 800 800
3.3 Implementation The Benchmarking Survey was carried out from September to December 2009 in Phnom Penh and surrounding suburban areas. For each category of worker –employed or unemployed- a specifically adapted questionnaire has been designed, and this tool has been used to gather information on a range of thematic areas related to the economic crisis, including socio-economic hardships, livelihood strategies and coping mechanisms, job searching strategies, and response measures taken by affected firms. In addition, qualitative data was collected during the survey through in-depth interviews to help add substance to the quantitative data. In identifying employed workers, the Research Team actively cooperated with trade union leaders and landlords to mobilize and arrange interviews. Trade union leaders and landlords, as trusted contact points, would invite groups of employed workers from different garment factories to participate in the interviews at accessible and designated locations, such as the landlord’s house. The contact persons generally mobilized 15‐30 workers per evening. The Research Team’s nine enumerators would meet the contact person and workers at the specified location and conduct interviews with workers individually. On weekdays and Saturdays, enumerator can only interview employed workers after working hours, in the evening. On Sundays, the team conducted interviews throughout the day. Unemployed workers were also found through trade union networks, landlords, and referrals from other garment workers. Some workers were found by enumerators at recruitment lines in front of factories. The process of arranging interviews is the same as for employed workers, described above. Given that our survey covered only Phnom Penh and surrounding areas, we recognize that the benchmarking likely under‐represents those workers who have returned to their home provinces outside the survey's targeted districts. However, the follow‐up tracking surveys should achieve a more representative sample of workers who have returned to their home provinces subsequent to the benchmarking
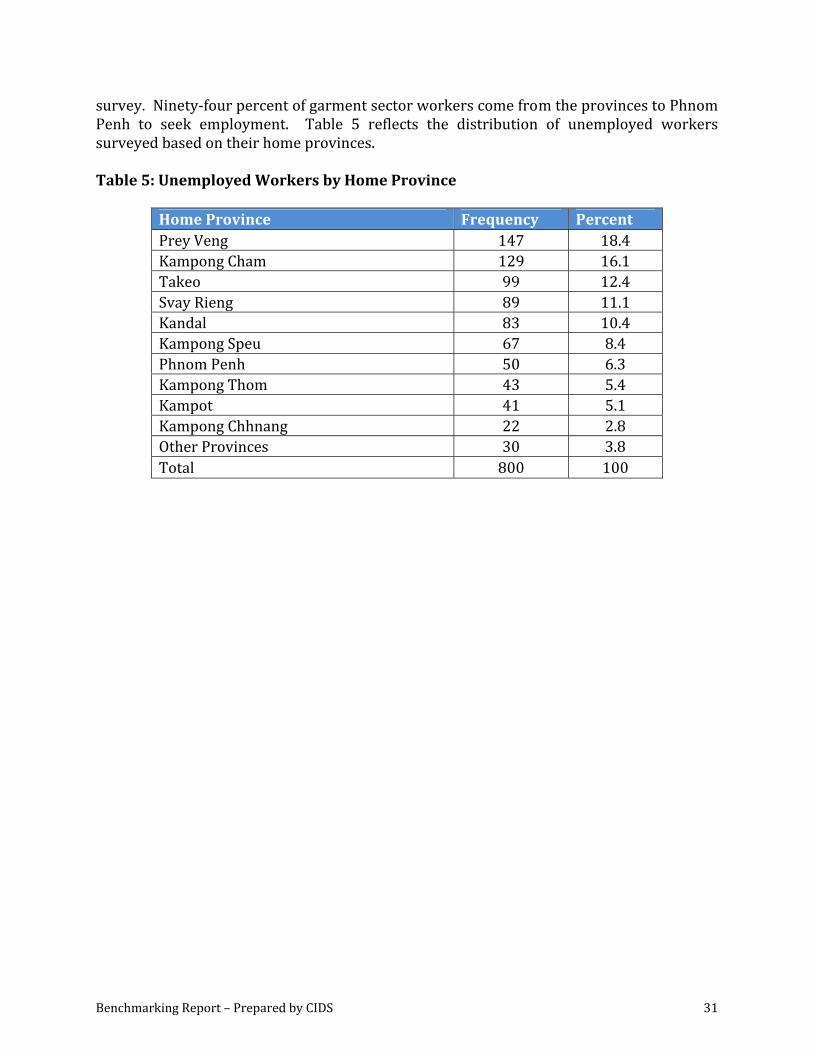
Benchmarking Report – Prepared by CIDS 31
survey. Ninety‐four percent of garment sector workers come from the provinces to Phnom Penh to seek employment. Table 5 reflects the distribution of unemployed workers surveyed based on their home provinces. Table 5: Unemployed Workers by Home Province
Home Province Frequency Percent Prey Veng 147 18.4 Kampong Cham 129 16.1 Takeo 99 12.4 Svay Rieng 89 11.1 Kandal 83 10.4 Kampong Speu 67 8.4 Phnom Penh 50 6.3 Kampong Thom 43 5.4 Kampot 41 5.1 Kampong Chhnang 22 2.8 Other Provinces 30 3.8 Total 800 100
Benchmarking Report – Prepared by CIDS 32
Part II: Survey Findings This part of the report presents the findings of the Benchmarking Survey conducted in September‐December 2009. It highlights the baseline situation of workers, including new hardships they are facing since the unfolding of the global crisis, coping mechanisms and job searching strategies. In the process, the data also reveals how firms are responding to the crisis. We start first with the general profile of workers surveyed (both employed and unemployed), followed by findings on employed workers, and then unemployed workers.
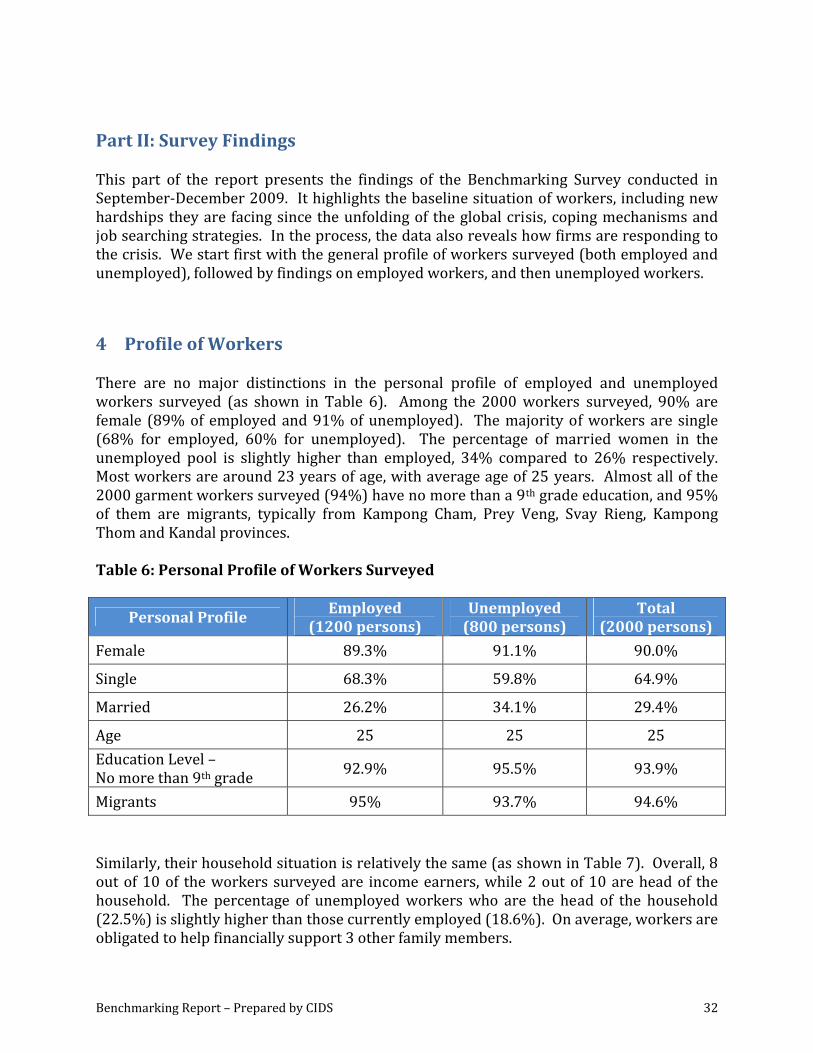
4 Profile of Workers There are no major distinctions in the personal profile of employed and unemployed workers surveyed (as shown in Table 6). Among the 2000 workers surveyed, 90% are female (89% of employed and 91% of unemployed). The majority of workers are single (68% for employed, 60% for unemployed). The percentage of married women in the unemployed pool is slightly higher than employed, 34% compared to 26% respectively. Most workers are around 23 years of age, with average age of 25 years. Almost all of the 2000 garment workers surveyed (94%) have no more than a 9th grade education, and 95% of them are migrants, typically from Kampong Cham, Prey Veng, Svay Rieng, Kampong Thom and Kandal provinces. Table 6: Personal Profile of Workers Surveyed
Personal Profile Employed
(1200 persons) Unemployed (800 persons)
Total (2000 persons)
Female 89.3% 91.1% 90.0%
Single 68.3% 59.8% 64.9%
Married 26.2% 34.1% 29.4%
Age 25 25 25 Education Level – No more than 9th grade 92.9% 95.5% 93.9%
Migrants 95% 93.7% 94.6% Similarly, their household situation is relatively the same (as shown in Table 7). Overall, 8 out of 10 of the workers surveyed are income earners, while 2 out of 10 are head of the household. The percentage of unemployed workers who are the head of the household (22.5%) is slightly higher than those currently employed (18.6%). On average, workers are obligated to help financially support 3 other family members.
Benchmarking Report – Prepared by CIDS 33
Table 7: Household Situation of Workers Surveyed
Household Situation Employed
(1200 persons) Unemployed (800 persons)
Total (2000 persons)
Income Earners 81% 77.5% 79.8%
Head of Household 18.6% 22.5% 20.2%
Family Members (including interviewee) 4 4 4
5 Situation of Employed Workers
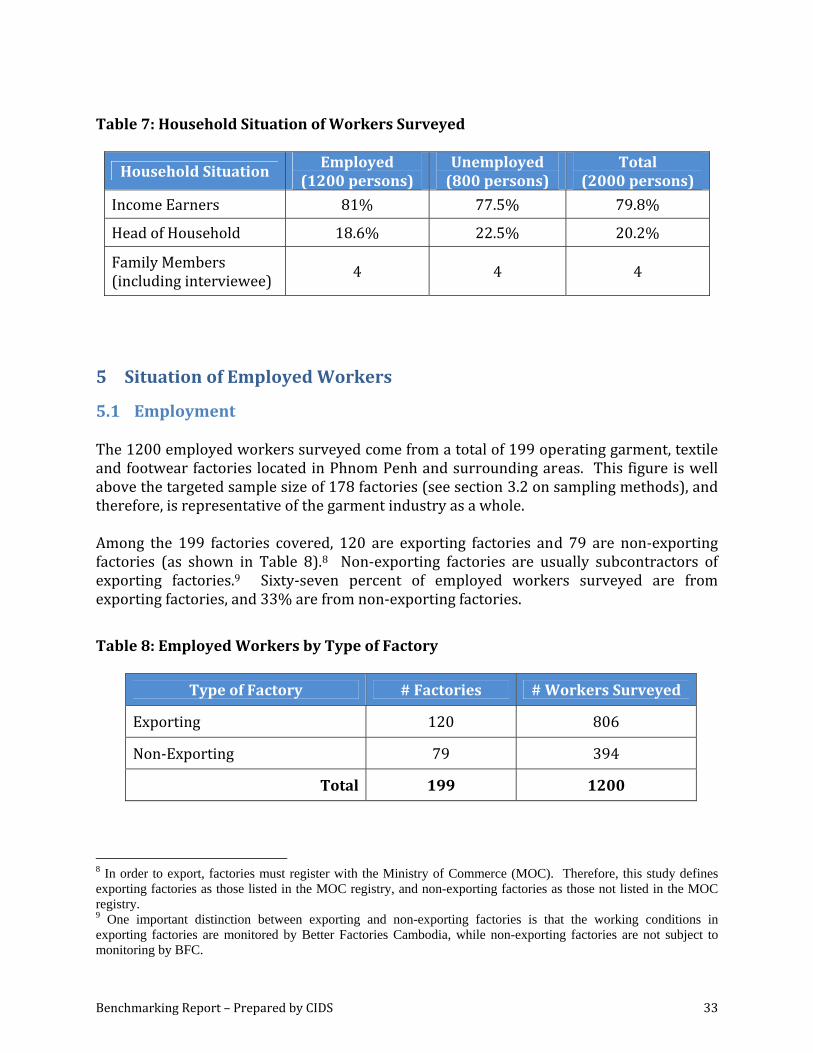
5.1 Employment The 1200 employed workers surveyed come from a total of 199 operating garment, textile and footwear factories located in Phnom Penh and surrounding areas. This figure is well above the targeted sample size of 178 factories (see section 3.2 on sampling methods), and therefore, is representative of the garment industry as a whole. Among the 199 factories covered, 120 are exporting factories and 79 are non‐exporting factories (as shown in Table 8).8 Non‐exporting factories are usually subcontractors of exporting factories.9 Sixty‐seven percent of employed workers surveyed are from exporting factories, and 33% are from non‐exporting factories.
Table 8: Employed Workers by Type of Factory
Type of Factory # Factories # Workers Surveyed
Exporting 120 806
Non‐Exporting 79 394
Total 199 1200
8 In order to export, factories must register with the Ministry of Commerce (MOC). Therefore, this study defines exporting factories as those listed in the MOC registry, and non-exporting factories as those not listed in the MOC registry. 9 One important distinction between exporting and non-exporting factories is that the working conditions in exporting factories are monitored by Better Factories Cambodia, while non-exporting factories are not subject to monitoring by BFC.
Benchmarking Report – Prepared by CIDS 34
On average, interviewees have been employed in the garment industry for 4 years. Even so, 31% of workers interviewed just started working at their current factory in 2009. Among the 1200 employed workers surveyed, 49% previously worked at a different garment factory, and 27% of those workers were retrenched in 2009. Most workers were rehired at a different garment factory within 1‐2 months after their termination, though many found a new job immediately after their retrenchment. During the interviews, workers were also asked about their category of employment. According to the Labour Law, there are three main categories of employment in the garment industry: 10 ‐ Regular Worker: Regular workers include full‐time, part‐time and piece‐rate workers.
There are two types of employment contracts for regular workers: fixed duration contracts (FDCs) and undetermined duration contracts (UDCs). A contract is a FDC if it is written, is not longer than 2 years and has a precise starting and ending date. Otherwise, it is an UDC.
‐ Casual Worker: Casual employees are those who i) perform specific work that has to be completed within a short period, or ii) perform work temporarily, intermittently or seasonally. They also may be called floating or temporary employees. Casual workers have the same rights as regular employees (i.e. annual leave, sick leave, public holidays, bonuses and other benefits). However, casual workers’ benefits may be reduced if they work less than full time.
‐ Probationary Worker: Employers can hire workers on probation for up to 3 months in
order to evaluate their skills and attitude. For non‐specialized workers, the maximum probationary period is 1 month; 2 months for specialized workers (i.e. sewers); and 3 months for regular employees.
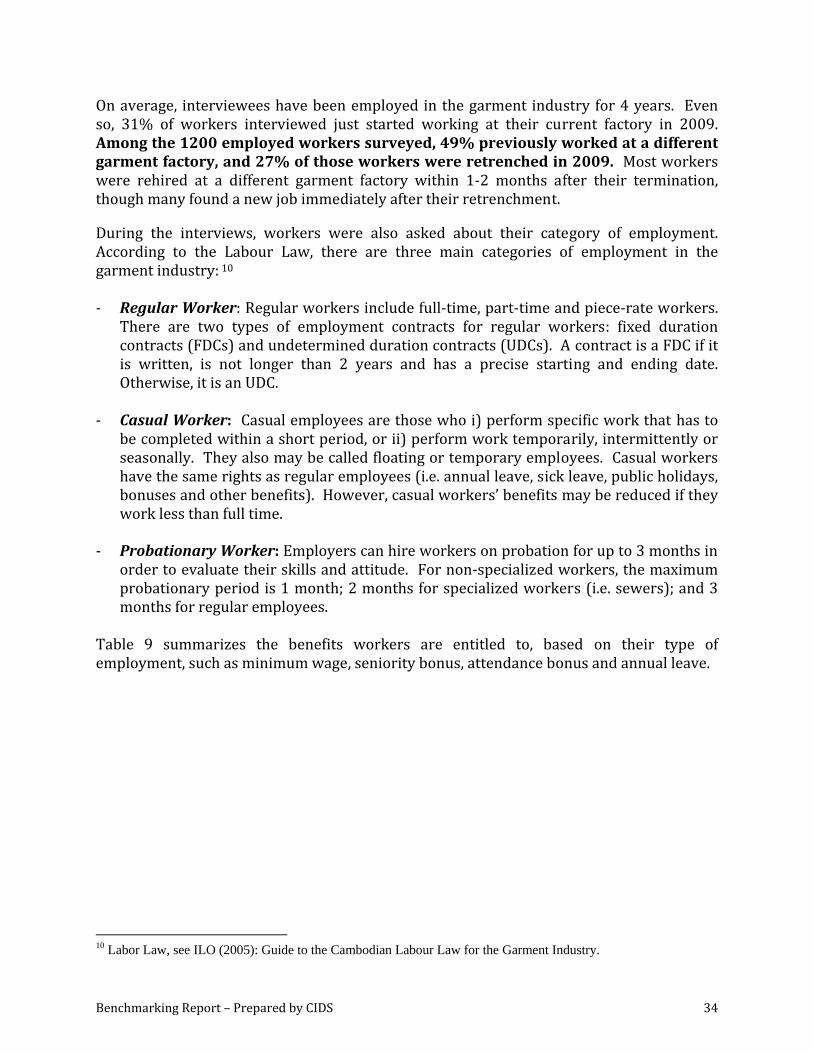
Table 9 summarizes the benefits workers are entitled to, based on their type of employment, such as minimum wage, seniority bonus, attendance bonus and annual leave.
10 Labor Law, see ILO (2005): Guide to the Cambodian Labour Law for the Garment Industry.
Benchmarking Report – Prepared by CIDS 35
Table 9: Benefits by Category of Employment11
Benefits Regular (Including PieceRate) Casual Probationary
Minimum Wage $50 per month. For Piece‐Rate workers , if pay based on piece rate is less than mw, employer must pay mw
Entitled to same level as regular workers
$45 per month
Seniority Bonus If employed over 1 year, entitled to seniority bonus
Entitled to same level as regular workers (but normally should not be employed as casual for a year)
Not applicable (should not be employed on probation for a year)
Attendance Bonus Employers must pay to all employees who “work regularly on each day which must be worked in a month” a bonus of at least $5.
Annual Leave All employees have right to annual leave. ‐ 48 hours per week: 1.5 days leave per month ‐ 40 hours per week: 1.25 days leave per month ‐ 24 hours per week: 0.75 days leave per month
Figure 1: Employed Workers by Type of Employment
Regular: 103786%
Casual:827%
Probationary:807%
Total of 1200 employed workers
11 Labor Law, see ILO (2005): Guide to the Cambodian Labour Law for the Garment Industry.
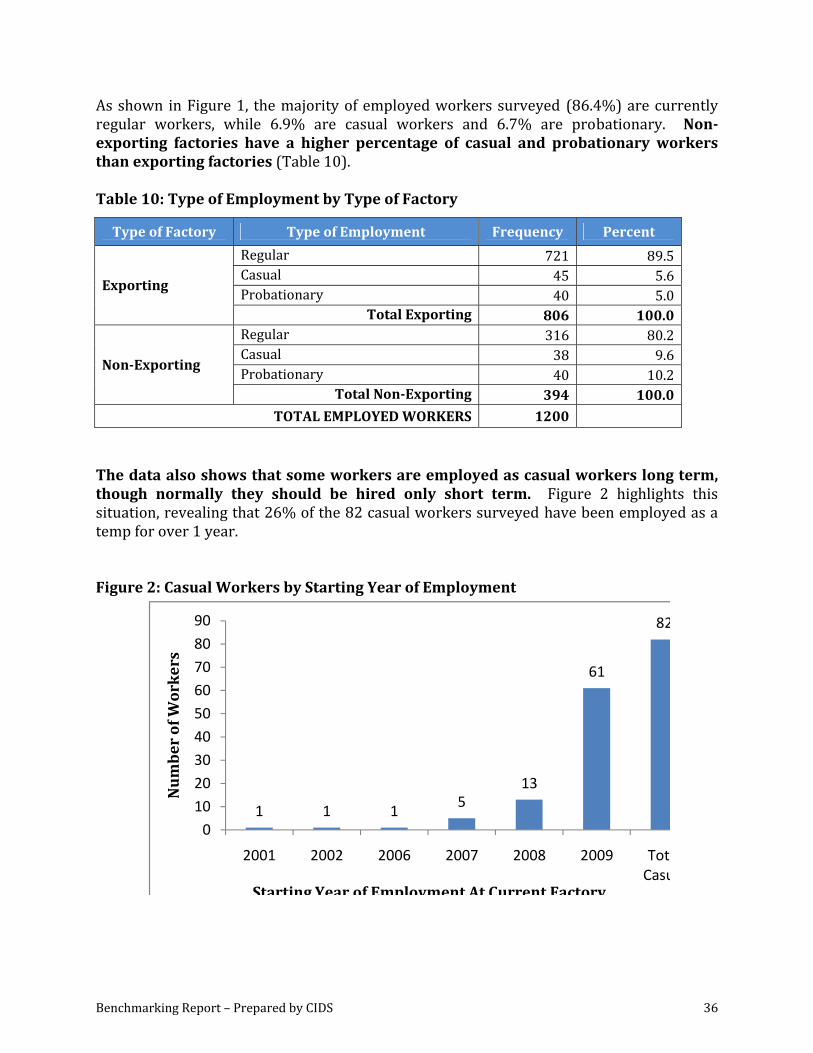
Benchmarking Report – Prepared by CIDS 36
As shown in Figure 1, the majority of employed workers surveyed (86.4%) are currently regular workers, while 6.9% are casual workers and 6.7% are probationary. Nonexporting factories have a higher percentage of casual and probationary workers than exporting factories (Table 10). Table 10: Type of Employment by Type of Factory
Type of Factory Type of Employment Frequency Percent
Regular 721 89.5 Casual 45 5.6 Probationary 40 5.0
Exporting
Total Exporting 806 100.0 Regular 316 80.2 Casual 38 9.6 Probationary 40 10.2
NonExporting
Total NonExporting 394 100.0 TOTAL EMPLOYED WORKERS 1200
The data also shows that some workers are employed as casual workers long term, though normally they should be hired only short term. Figure 2 highlights this situation, revealing that 26% of the 82 casual workers surveyed have been employed as a temp for over 1 year. Figure 2: Casual Workers by Starting Year of Employment
1 1 1 513
61
82
0
10
20
30
40
50
60
70
80
90
2001 2002 2006 2007 2008 2009 TotCasu
Number of W
orkers
Starting Year of Employment At Current Factory
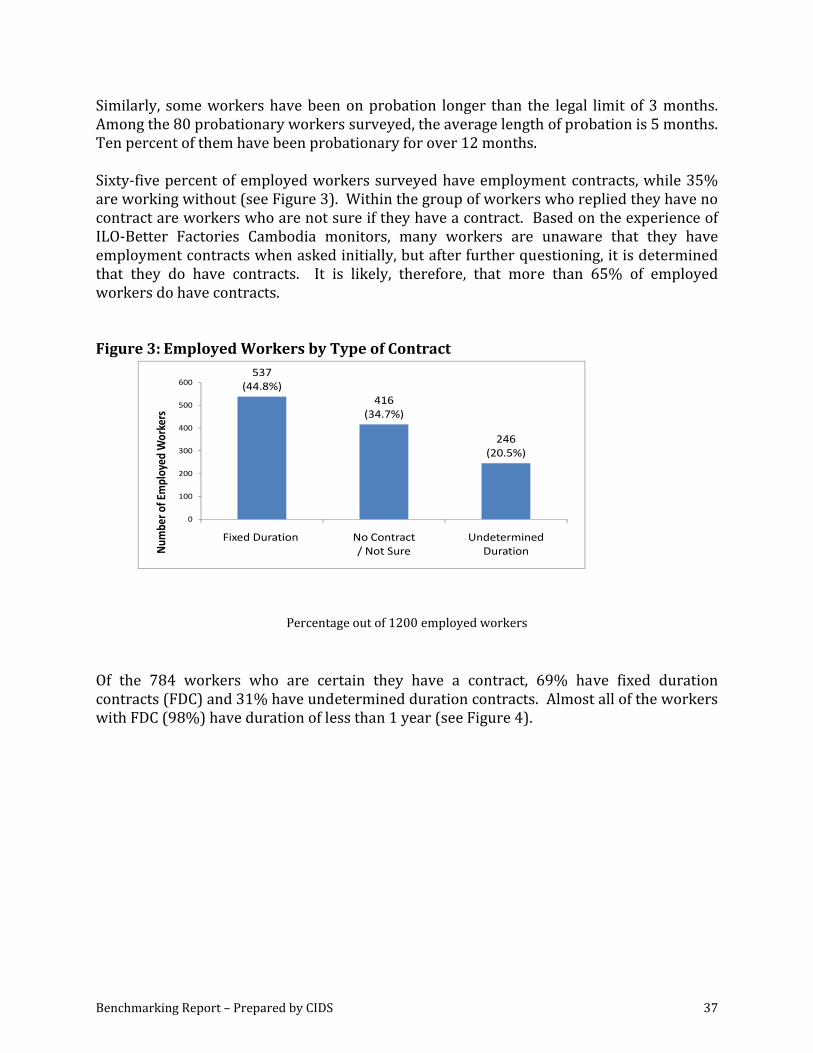
Benchmarking Report – Prepared by CIDS 37
Similarly, some workers have been on probation longer than the legal limit of 3 months. Among the 80 probationary workers surveyed, the average length of probation is 5 months. Ten percent of them have been probationary for over 12 months. Sixty‐five percent of employed workers surveyed have employment contracts, while 35% are working without (see Figure 3). Within the group of workers who replied they have no contract are workers who are not sure if they have a contract. Based on the experience of ILO‐Better Factories Cambodia monitors, many workers are unaware that they have employment contracts when asked initially, but after further questioning, it is determined that they do have contracts. It is likely, therefore, that more than 65% of employed workers do have contracts. Figure 3: Employed Workers by Type of Contract
537(44.8%)
416(34.7%)
246(20.5%)
0
100
200
300
400
500
600
Fixed Duration No Contract / Not Sure
Undetermined DurationN
umbe
r of E
mployed
Workers
Percentage out of 1200 employed workers
Of the 784 workers who are certain they have a contract, 69% have fixed duration contracts (FDC) and 31% have undetermined duration contracts. Almost all of the workers with FDC (98%) have duration of less than 1 year (see Figure 4).
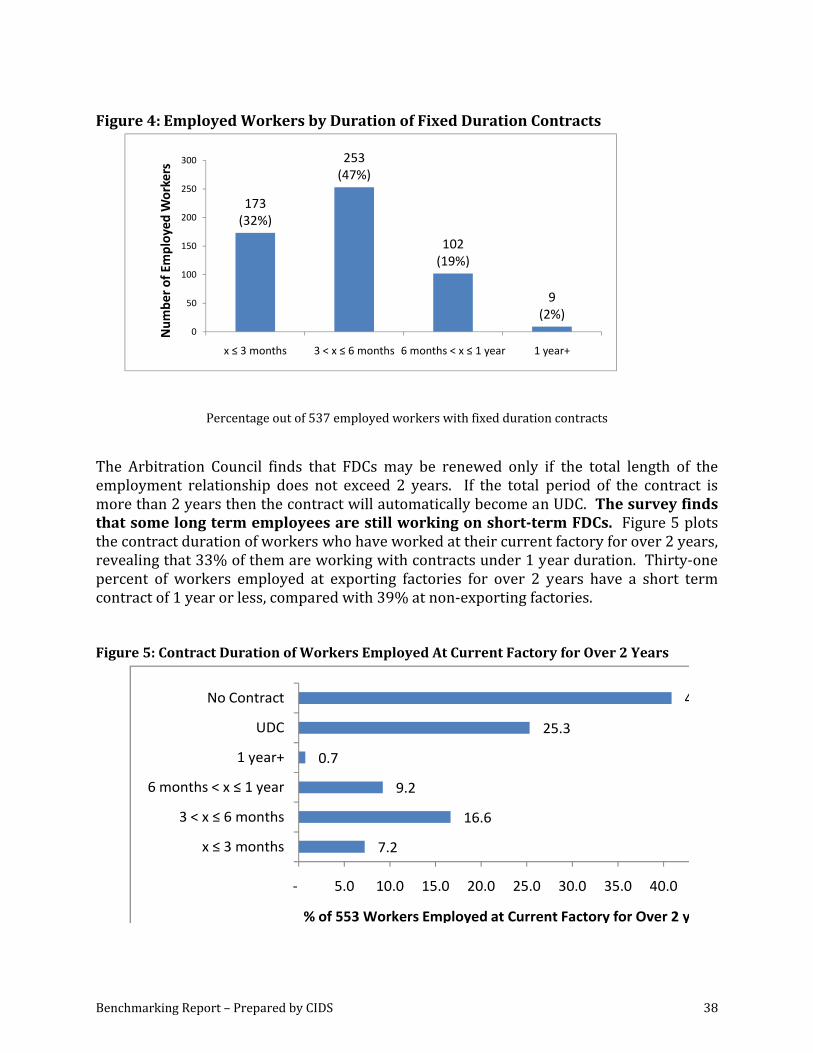
Benchmarking Report – Prepared by CIDS 38
Figure 4: Employed Workers by Duration of Fixed Duration Contracts
173(32%)
253(47%)
102(19%)
9(2%)
0
50
100
150
200
250
300
x ≤ 3 months 3 < x ≤ 6 months 6 months < x ≤ 1 year 1 year+
Num
ber o
f Employed
Workers
Percentage out of 537 employed workers with fixed duration contracts
The Arbitration Council finds that FDCs may be renewed only if the total length of the employment relationship does not exceed 2 years. If the total period of the contract is more than 2 years then the contract will automatically become an UDC. The survey finds that some long term employees are still working on shortterm FDCs. Figure 5 plots the contract duration of workers who have worked at their current factory for over 2 years, revealing that 33% of them are working with contracts under 1 year duration. Thirty‐one percent of workers employed at exporting factories for over 2 years have a short term contract of 1 year or less, compared with 39% at non‐exporting factories. Figure 5: Contract Duration of Workers Employed At Current Factory for Over 2 Years
7.2
16.6
9.2
0.7
25.3
4
‐ 5.0 10.0 15.0 20.0 25.0 30.0 35.0 40.0
x ≤ 3 months
3 < x ≤ 6 months
6 months < x ≤ 1 year
1 year+
UDC
No Contract
% of 553 Workers Employed at Current Factory for Over 2 y
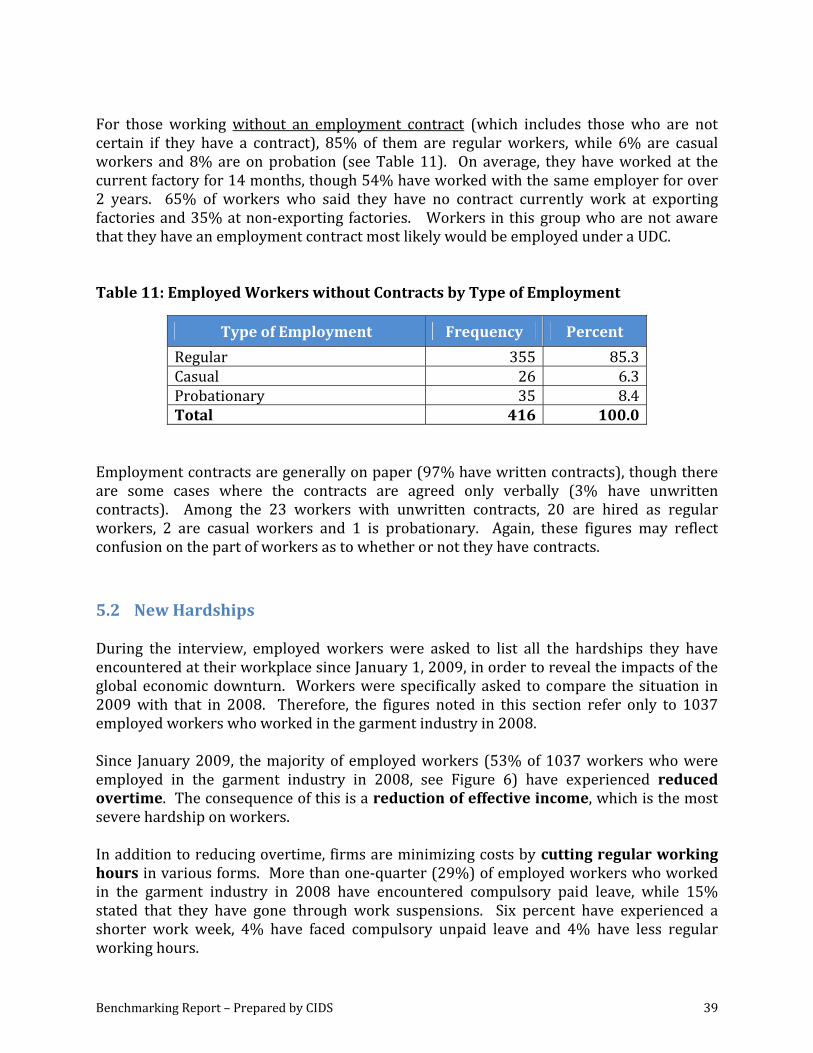
Benchmarking Report – Prepared by CIDS 39
For those working without an employment contract (which includes those who are not certain if they have a contract), 85% of them are regular workers, while 6% are casual workers and 8% are on probation (see Table 11). On average, they have worked at the current factory for 14 months, though 54% have worked with the same employer for over 2 years. 65% of workers who said they have no contract currently work at exporting factories and 35% at non‐exporting factories. Workers in this group who are not aware that they have an employment contract most likely would be employed under a UDC. Table 11: Employed Workers without Contracts by Type of Employment
Type of Employment Frequency Percent
Regular 355 85.3 Casual 26 6.3 Probationary 35 8.4 Total 416 100.0
Employment contracts are generally on paper (97% have written contracts), though there are some cases where the contracts are agreed only verbally (3% have unwritten contracts). Among the 23 workers with unwritten contracts, 20 are hired as regular workers, 2 are casual workers and 1 is probationary. Again, these figures may reflect confusion on the part of workers as to whether or not they have contracts.
5.2 New Hardships During the interview, employed workers were asked to list all the hardships they have encountered at their workplace since January 1, 2009, in order to reveal the impacts of the global economic downturn. Workers were specifically asked to compare the situation in 2009 with that in 2008. Therefore, the figures noted in this section refer only to 1037 employed workers who worked in the garment industry in 2008. Since January 2009, the majority of employed workers (53% of 1037 workers who were employed in the garment industry in 2008, see Figure 6) have experienced reduced overtime. The consequence of this is a reduction of effective income, which is the most severe hardship on workers. In addition to reducing overtime, firms are minimizing costs by cutting regular working hours in various forms. More than one‐quarter (29%) of employed workers who worked in the garment industry in 2008 have encountered compulsory paid leave, while 15% stated that they have gone through work suspensions. Six percent have experienced a shorter work week, 4% have faced compulsory unpaid leave and 4% have less regular working hours.
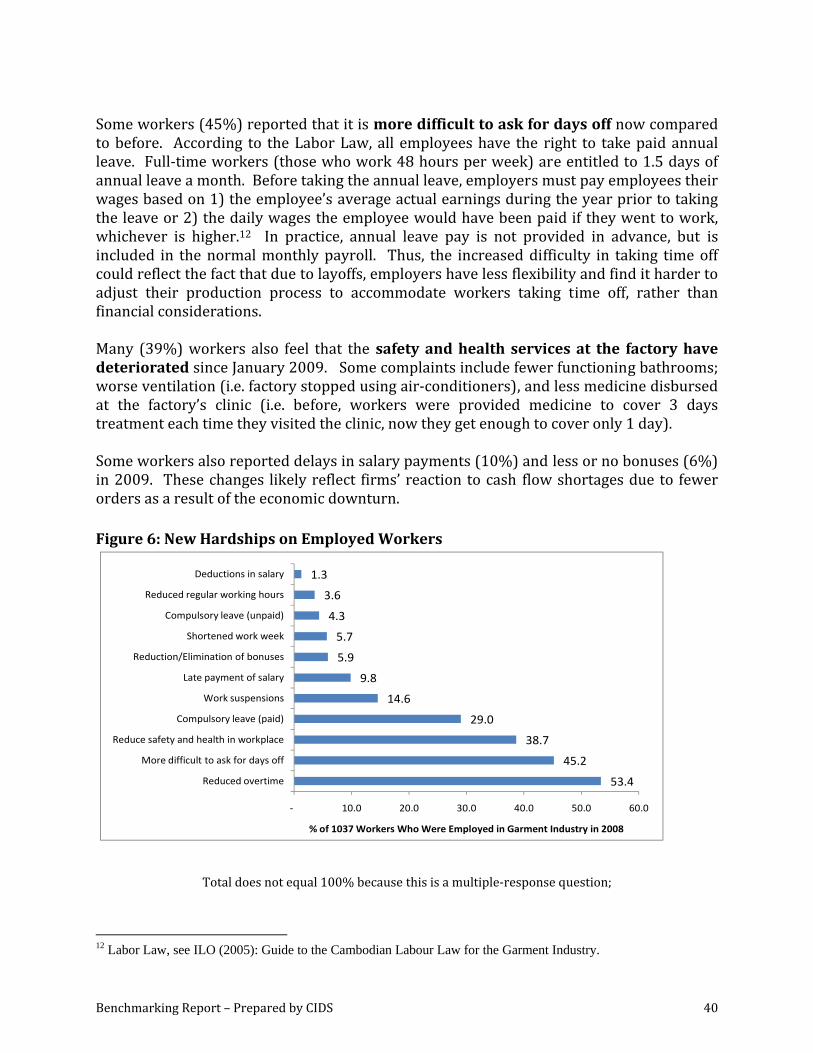
Benchmarking Report – Prepared by CIDS 40
Some workers (45%) reported that it is more difficult to ask for days off now compared to before. According to the Labor Law, all employees have the right to take paid annual leave. Full‐time workers (those who work 48 hours per week) are entitled to 1.5 days of annual leave a month. Before taking the annual leave, employers must pay employees their wages based on 1) the employee’s average actual earnings during the year prior to taking the leave or 2) the daily wages the employee would have been paid if they went to work, whichever is higher.12 In practice, annual leave pay is not provided in advance, but is included in the normal monthly payroll. Thus, the increased difficulty in taking time off could reflect the fact that due to layoffs, employers have less flexibility and find it harder to adjust their production process to accommodate workers taking time off, rather than financial considerations. Many (39%) workers also feel that the safety and health services at the factory have deteriorated since January 2009. Some complaints include fewer functioning bathrooms; worse ventilation (i.e. factory stopped using air‐conditioners), and less medicine disbursed at the factory’s clinic (i.e. before, workers were provided medicine to cover 3 days treatment each time they visited the clinic, now they get enough to cover only 1 day). Some workers also reported delays in salary payments (10%) and less or no bonuses (6%) in 2009. These changes likely reflect firms’ reaction to cash flow shortages due to fewer orders as a result of the economic downturn.
Figure 6: New Hardships on Employed Workers
53.4
45.2
38.7
29.0
14.6
9.8
5.9
5.7
4.3
3.6
1.3
‐ 10.0 20.0 30.0 40.0 50.0 60.0
Reduced overtime
More difficult to ask for days off
Reduce safety and health in workplace
Compulsory leave (paid)
Work suspensions
Late payment of salary
Reduction/Elimination of bonuses
Shortened work week
Compulsory leave (unpaid)
Reduced regular working hours
Deductions in salary
% of 1037 Workers Who Were Employed in Garment Industry in 2008
Total does not equal 100% because this is a multiple‐response question;
12 Labor Law, see ILO (2005): Guide to the Cambodian Labour Law for the Garment Industry.
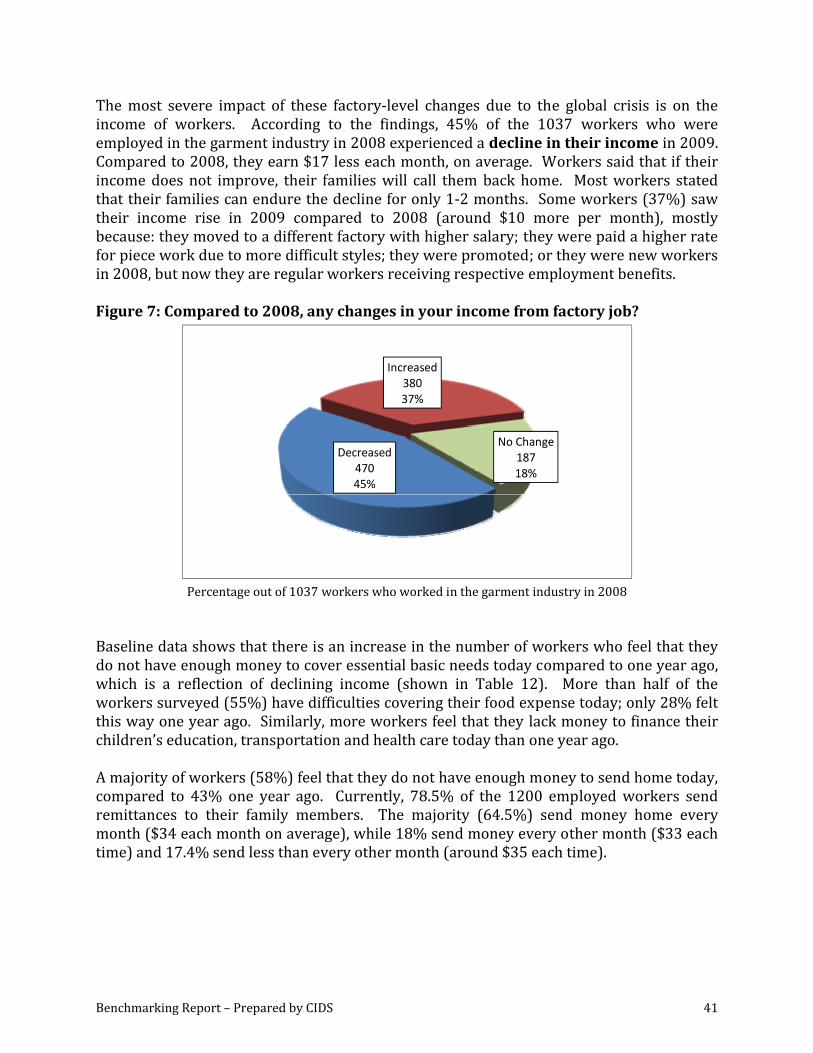
Benchmarking Report – Prepared by CIDS 41
The most severe impact of these factory‐level changes due to the global crisis is on the income of workers. According to the findings, 45% of the 1037 workers who were employed in the garment industry in 2008 experienced a decline in their income in 2009. Compared to 2008, they earn $17 less each month, on average. Workers said that if their income does not improve, their families will call them back home. Most workers stated that their families can endure the decline for only 1‐2 months. Some workers (37%) saw their income rise in 2009 compared to 2008 (around $10 more per month), mostly because: they moved to a different factory with higher salary; they were paid a higher rate for piece work due to more difficult styles; they were promoted; or they were new workers in 2008, but now they are regular workers receiving respective employment benefits. Figure 7: Compared to 2008, any changes in your income from factory job?
Decreased47045%
Increased38037%
No Change18718%
Percentage out of 1037 workers who worked in the garment industry in 2008
Baseline data shows that there is an increase in the number of workers who feel that they do not have enough money to cover essential basic needs today compared to one year ago, which is a reflection of declining income (shown in Table 12). More than half of the workers surveyed (55%) have difficulties covering their food expense today; only 28% felt this way one year ago. Similarly, more workers feel that they lack money to finance their children’s education, transportation and health care today than one year ago. A majority of workers (58%) feel that they do not have enough money to send home today, compared to 43% one year ago. Currently, 78.5% of the 1200 employed workers send remittances to their family members. The majority (64.5%) send money home every month ($34 each month on average), while 18% send money every other month ($33 each time) and 17.4% send less than every other month (around $35 each time).
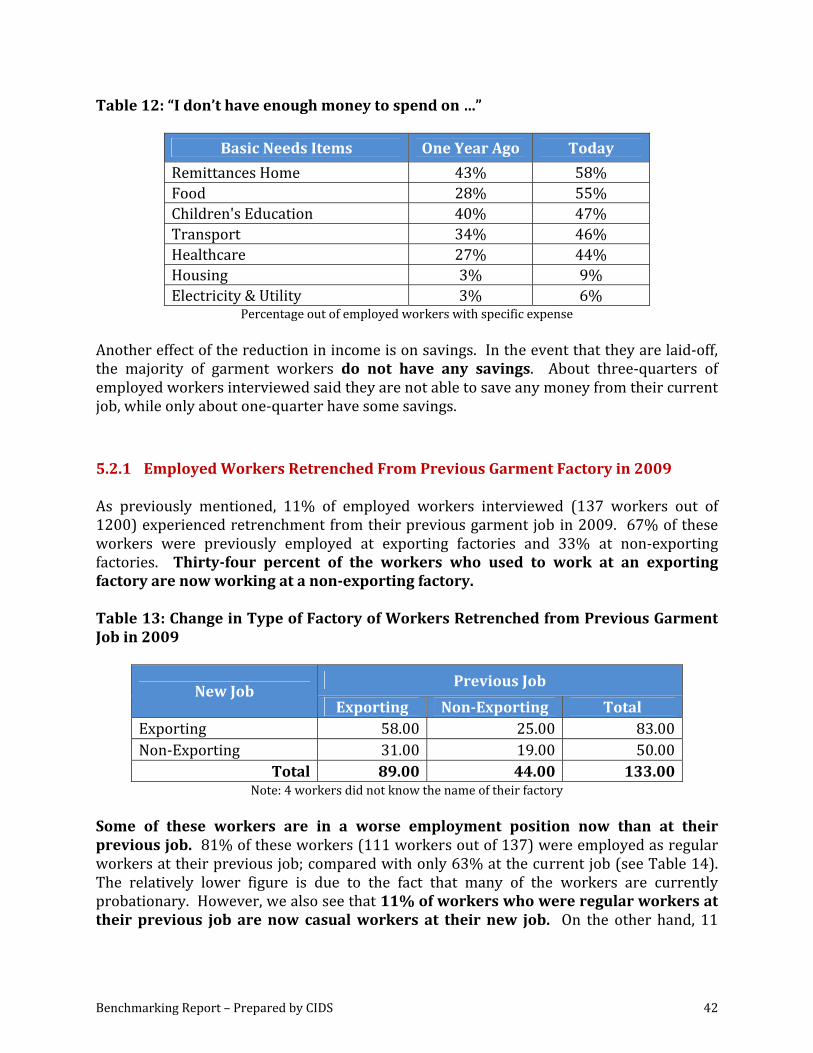
Benchmarking Report – Prepared by CIDS 42
Table 12: “I don’t have enough money to spend on …”
Basic Needs Items One Year Ago Today
Remittances Home 43% 58% Food 28% 55% Children's Education 40% 47% Transport 34% 46% Healthcare 27% 44% Housing 3% 9% Electricity & Utility 3% 6%
Percentage out of employed workers with specific expense Another effect of the reduction in income is on savings. In the event that they are laid‐off, the majority of garment workers do not have any savings. About three‐quarters of employed workers interviewed said they are not able to save any money from their current job, while only about one‐quarter have some savings.
5.2.1 Employed Workers Retrenched From Previous Garment Factory in 2009 As previously mentioned, 11% of employed workers interviewed (137 workers out of 1200) experienced retrenchment from their previous garment job in 2009. 67% of these workers were previously employed at exporting factories and 33% at non‐exporting factories. Thirtyfour percent of the workers who used to work at an exporting factory are now working at a nonexporting factory. Table 13: Change in Type of Factory of Workers Retrenched from Previous Garment Job in 2009
Previous Job New Job
Exporting NonExporting Total Exporting 58.00 25.00 83.00Non‐Exporting 31.00 19.00 50.00
Total 89.00 44.00 133.00 Note: 4 workers did not know the name of their factory
Some of these workers are in a worse employment position now than at their previous job. 81% of these workers (111 workers out of 137) were employed as regular workers at their previous job; compared with only 63% at the current job (see Table 14). The relatively lower figure is due to the fact that many of the workers are currently probationary. However, we also see that 11% of workers who were regular workers at their previous job are now casual workers at their new job. On the other hand, 11
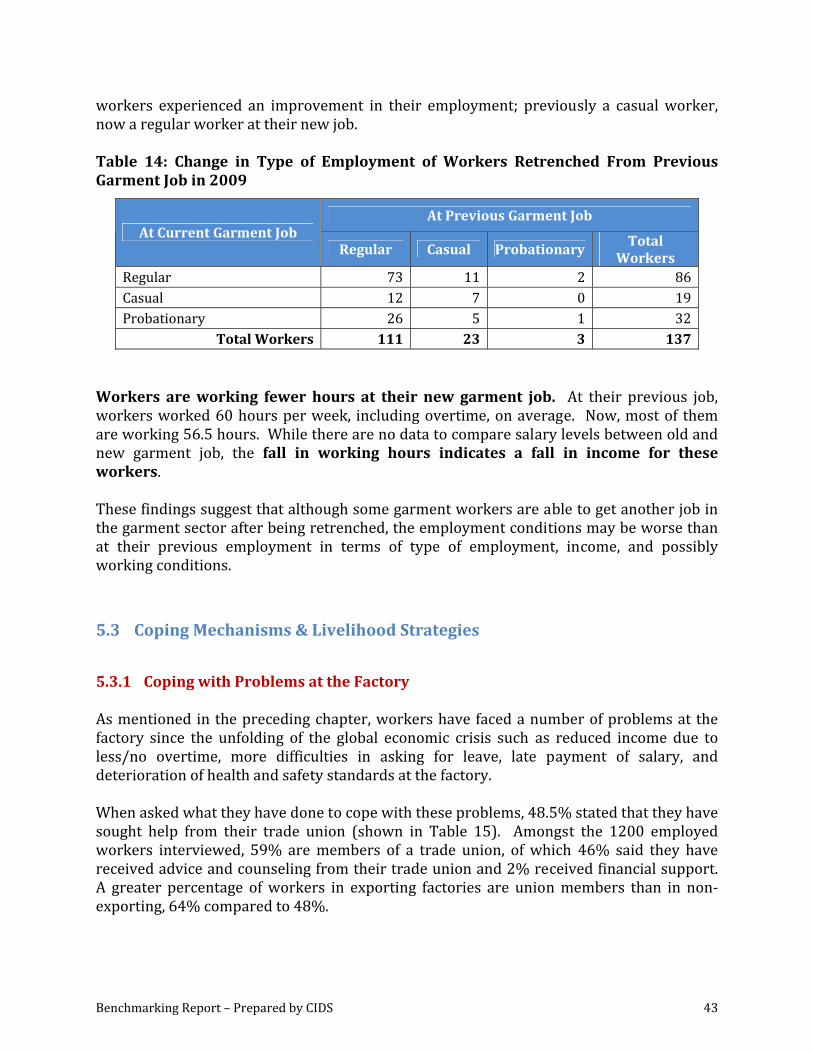
Benchmarking Report – Prepared by CIDS 43
workers experienced an improvement in their employment; previously a casual worker, now a regular worker at their new job. Table 14: Change in Type of Employment of Workers Retrenched From Previous Garment Job in 2009
At Previous Garment Job At Current Garment Job
Regular Casual Probationary Total
Workers Regular 73 11 2 86Casual 12 7 0 19Probationary 26 5 1 32
Total Workers 111 23 3 137 Workers are working fewer hours at their new garment job. At their previous job, workers worked 60 hours per week, including overtime, on average. Now, most of them are working 56.5 hours. While there are no data to compare salary levels between old and new garment job, the fall in working hours indicates a fall in income for these workers. These findings suggest that although some garment workers are able to get another job in the garment sector after being retrenched, the employment conditions may be worse than at their previous employment in terms of type of employment, income, and possibly working conditions.
5.3 Coping Mechanisms & Livelihood Strategies
5.3.1 Coping with Problems at the Factory As mentioned in the preceding chapter, workers have faced a number of problems at the factory since the unfolding of the global economic crisis such as reduced income due to less/no overtime, more difficulties in asking for leave, late payment of salary, and deterioration of health and safety standards at the factory. When asked what they have done to cope with these problems, 48.5% stated that they have sought help from their trade union (shown in Table 15). Amongst the 1200 employed workers interviewed, 59% are members of a trade union, of which 46% said they have received advice and counseling from their trade union and 2% received financial support. A greater percentage of workers in exporting factories are union members than in non‐exporting, 64% compared to 48%.
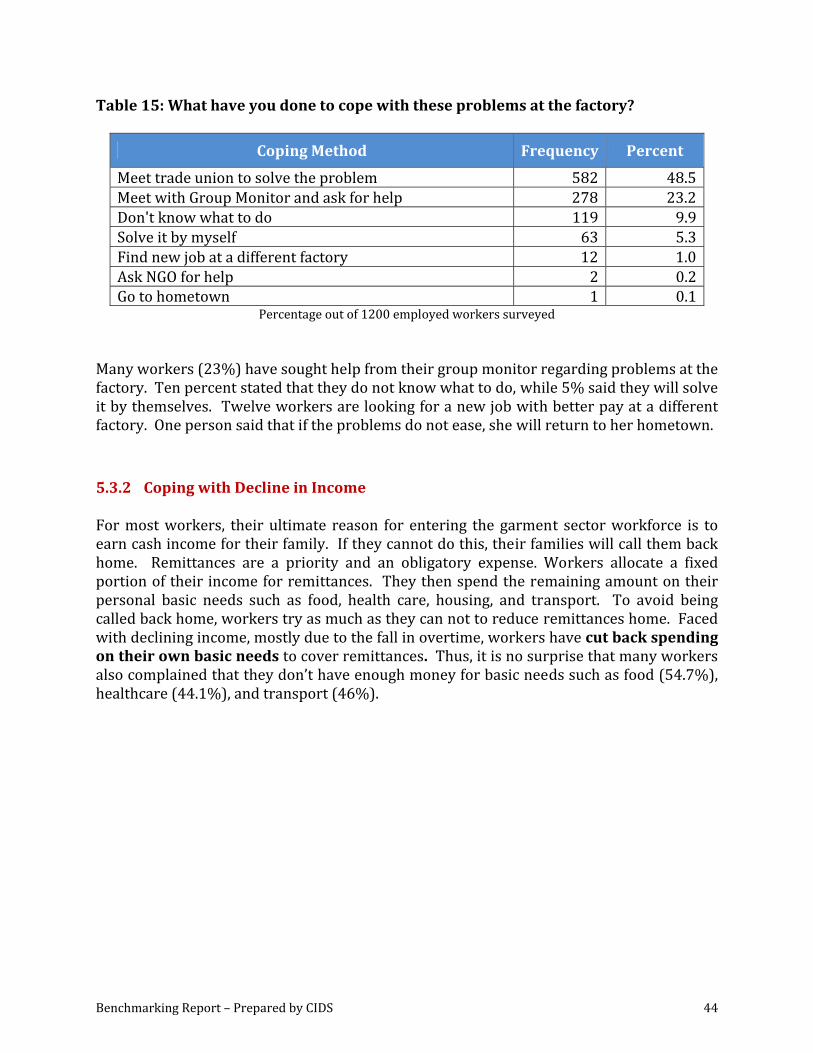
Benchmarking Report – Prepared by CIDS 44
Table 15: What have you done to cope with these problems at the factory?
Coping Method Frequency Percent
Meet trade union to solve the problem 582 48.5Meet with Group Monitor and ask for help 278 23.2Don't know what to do 119 9.9Solve it by myself 63 5.3Find new job at a different factory 12 1.0Ask NGO for help 2 0.2Go to hometown 1 0.1
Percentage out of 1200 employed workers surveyed Many workers (23%) have sought help from their group monitor regarding problems at the factory. Ten percent stated that they do not know what to do, while 5% said they will solve it by themselves. Twelve workers are looking for a new job with better pay at a different factory. One person said that if the problems do not ease, she will return to her hometown.
5.3.2 Coping with Decline in Income For most workers, their ultimate reason for entering the garment sector workforce is to earn cash income for their family. If they cannot do this, their families will call them back home. Remittances are a priority and an obligatory expense. Workers allocate a fixed portion of their income for remittances. They then spend the remaining amount on their personal basic needs such as food, health care, housing, and transport. To avoid being called back home, workers try as much as they can not to reduce remittances home. Faced with declining income, mostly due to the fall in overtime, workers have cut back spending on their own basic needs to cover remittances. Thus, it is no surprise that many workers also complained that they don’t have enough money for basic needs such as food (54.7%), healthcare (44.1%), and transport (46%).
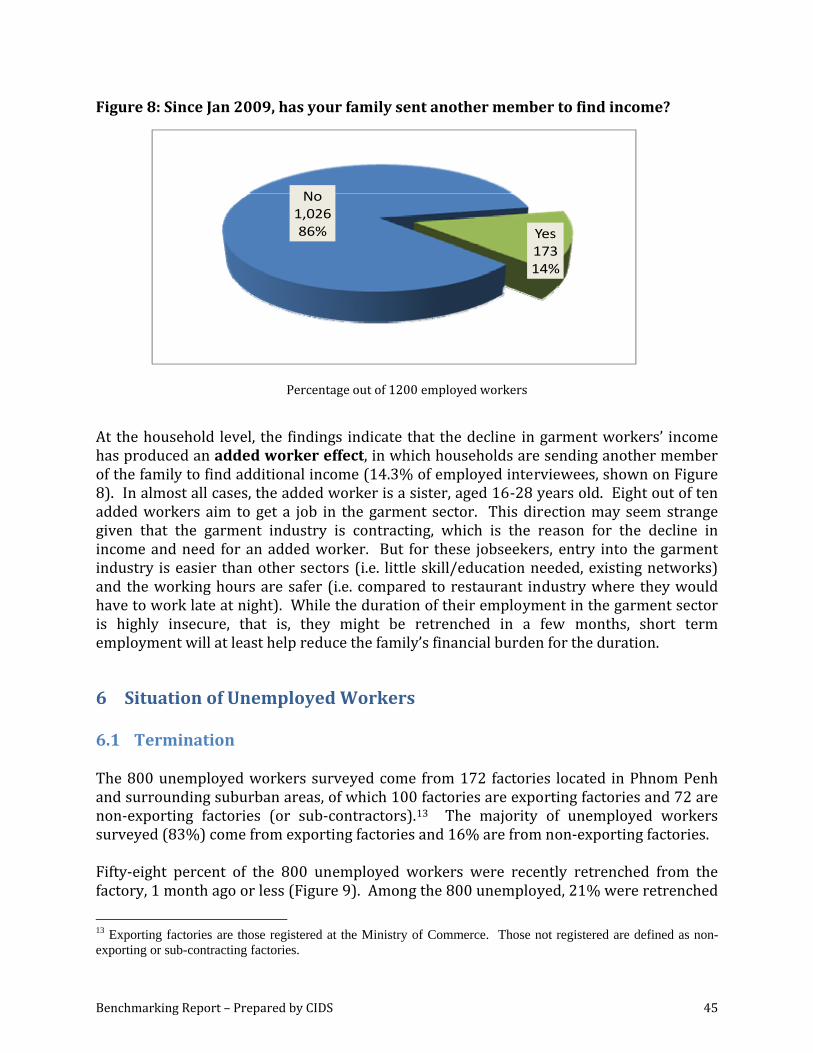
Benchmarking Report – Prepared by CIDS 45
Figure 8: Since Jan 2009, has your family sent another member to find income?
Yes17314%
No1,02686%
Percentage out of 1200 employed workers
At the household level, the findings indicate that the decline in garment workers’ income has produced an added worker effect, in which households are sending another member of the family to find additional income (14.3% of employed interviewees, shown on Figure 8). In almost all cases, the added worker is a sister, aged 16‐28 years old. Eight out of ten added workers aim to get a job in the garment sector. This direction may seem strange given that the garment industry is contracting, which is the reason for the decline in income and need for an added worker. But for these jobseekers, entry into the garment industry is easier than other sectors (i.e. little skill/education needed, existing networks) and the working hours are safer (i.e. compared to restaurant industry where they would have to work late at night). While the duration of their employment in the garment sector is highly insecure, that is, they might be retrenched in a few months, short term employment will at least help reduce the family’s financial burden for the duration.
6 Situation of Unemployed Workers
6.1 Termination The 800 unemployed workers surveyed come from 172 factories located in Phnom Penh and surrounding suburban areas, of which 100 factories are exporting factories and 72 are non‐exporting factories (or sub‐contractors).13 The majority of unemployed workers surveyed (83%) come from exporting factories and 16% are from non‐exporting factories. Fifty‐eight percent of the 800 unemployed workers were recently retrenched from the factory, 1 month ago or less (Figure 9). Among the 800 unemployed, 21% were retrenched
13 Exporting factories are those registered at the Ministry of Commerce. Those not registered are defined as non-exporting or sub-contracting factories.
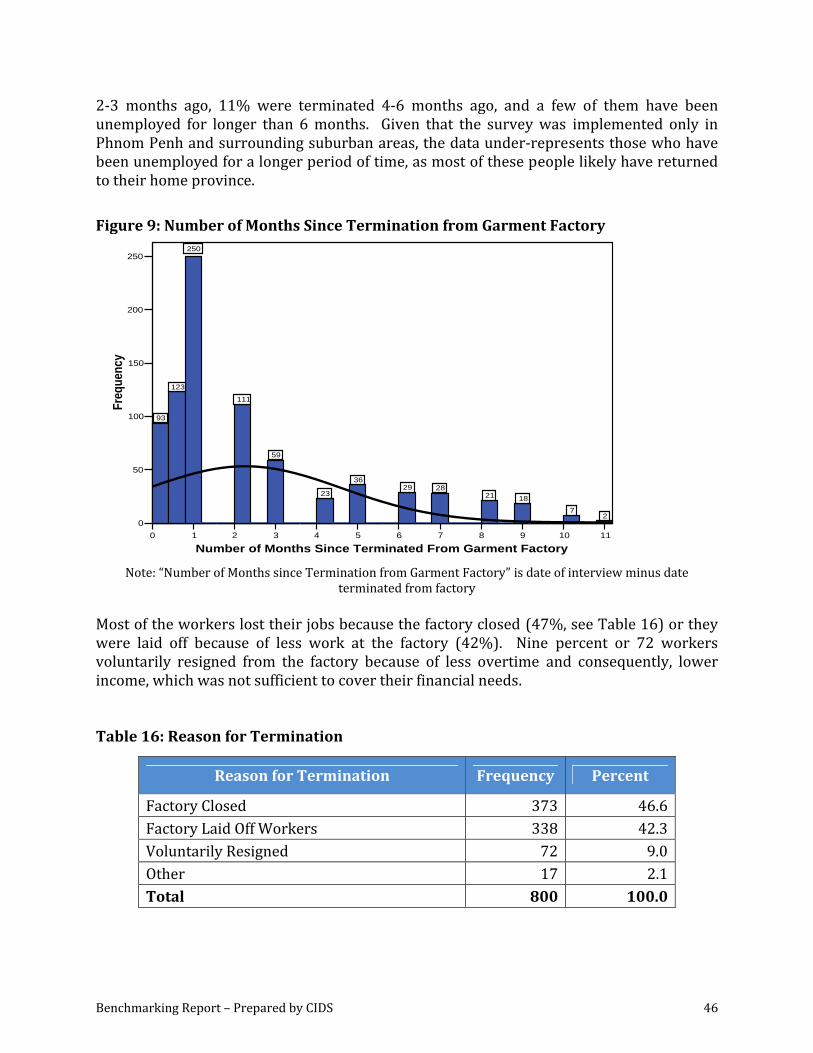
Benchmarking Report – Prepared by CIDS 46
2‐3 months ago, 11% were terminated 4‐6 months ago, and a few of them have been unemployed for longer than 6 months. Given that the survey was implemented only in Phnom Penh and surrounding suburban areas, the data under‐represents those who have been unemployed for a longer period of time, as most of these people likely have returned to their home province. Figure 9: Number of Months Since Termination from Garment Factory
0 1 2 3 4 5 6 7 8 9 10 11
Number of Months Since Terminated From Garment Factory
0
50
100
150
200
250
Freq
uenc
y
93
123
250
111
59
23
3629 28
21 18
72
Note: “Number of Months since Termination from Garment Factory” is date of interview minus date
terminated from factory Most of the workers lost their jobs because the factory closed (47%, see Table 16) or they were laid off because of less work at the factory (42%). Nine percent or 72 workers voluntarily resigned from the factory because of less overtime and consequently, lower income, which was not sufficient to cover their financial needs. Table 16: Reason for Termination
Reason for Termination Frequency Percent
Factory Closed 373 46.6 Factory Laid Off Workers 338 42.3 Voluntarily Resigned 72 9.0 Other 17 2.1 Total 800 100.0
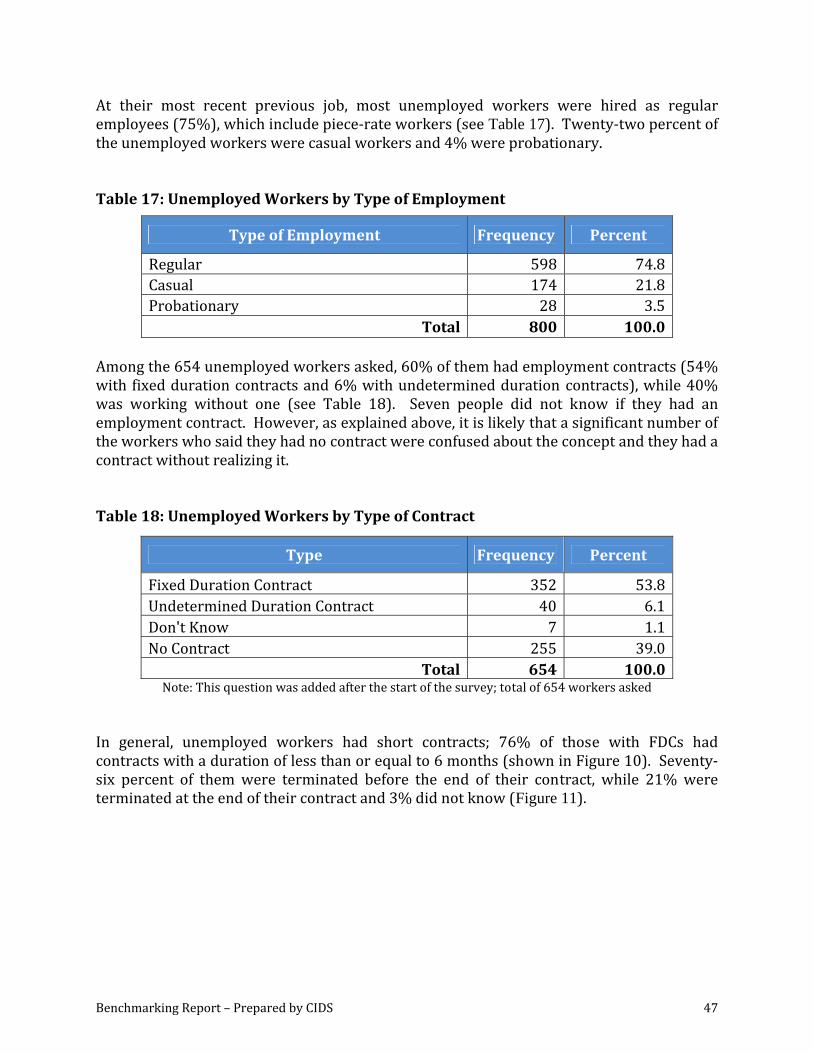
Benchmarking Report – Prepared by CIDS 47
At their most recent previous job, most unemployed workers were hired as regular employees (75%), which include piece‐rate workers (see Table 17). Twenty‐two percent of the unemployed workers were casual workers and 4% were probationary. Table 17: Unemployed Workers by Type of Employment
Type of Employment Frequency Percent
Regular 598 74.8Casual 174 21.8Probationary 28 3.5
Total 800 100.0 Among the 654 unemployed workers asked, 60% of them had employment contracts (54% with fixed duration contracts and 6% with undetermined duration contracts), while 40% was working without one (see Table 18). Seven people did not know if they had an employment contract. However, as explained above, it is likely that a significant number of the workers who said they had no contract were confused about the concept and they had a contract without realizing it. Table 18: Unemployed Workers by Type of Contract
Type Frequency Percent
Fixed Duration Contract 352 53.8Undetermined Duration Contract 40 6.1Don't Know 7 1.1No Contract 255 39.0
Total 654 100.0 Note: This question was added after the start of the survey; total of 654 workers asked
In general, unemployed workers had short contracts; 76% of those with FDCs had contracts with a duration of less than or equal to 6 months (shown in Figure 10). Seventy‐six percent of them were terminated before the end of their contract, while 21% were terminated at the end of their contract and 3% did not know (Figure 11).
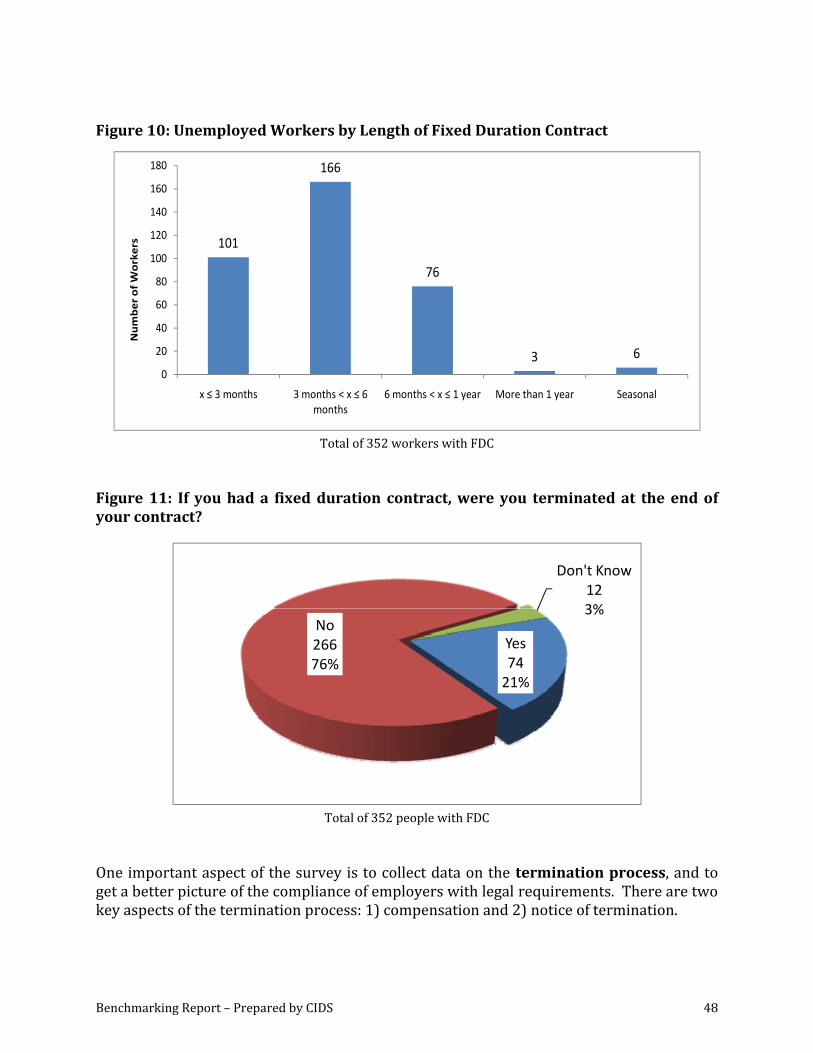
Benchmarking Report – Prepared by CIDS 48
Figure 10: Unemployed Workers by Length of Fixed Duration Contract
101
166
76
3 60
20
40
60
80
100
120
140
160
180
x ≤ 3 months 3 months < x ≤ 6 months
6 months < x ≤ 1 year More than 1 year Seasonal
Number of Workers
Total of 352 workers with FDC
Figure 11: If you had a fixed duration contract, were you terminated at the end of your contract?
Yes7421%
No26676%
Don't Know123%
Total of 352 people with FDC
One important aspect of the survey is to collect data on the termination process, and to get a better picture of the compliance of employers with legal requirements. There are two key aspects of the termination process: 1) compensation and 2) notice of termination.
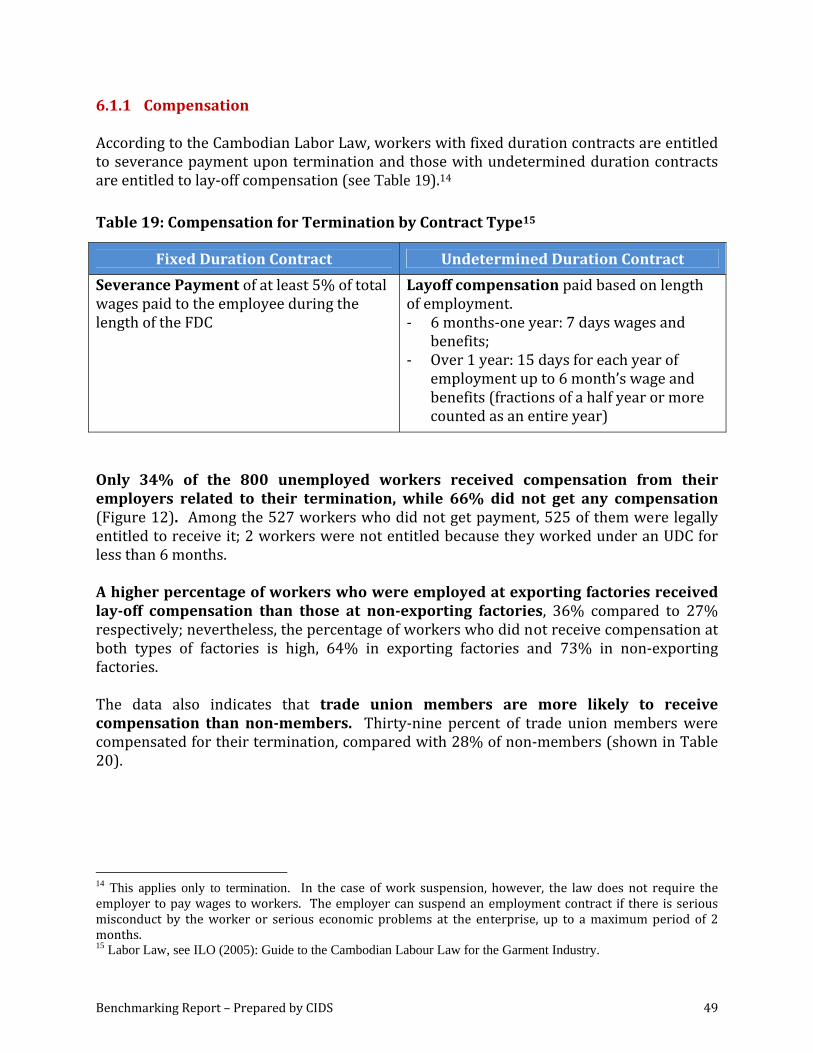
Benchmarking Report – Prepared by CIDS 49
6.1.1 Compensation According to the Cambodian Labor Law, workers with fixed duration contracts are entitled to severance payment upon termination and those with undetermined duration contracts are entitled to lay‐off compensation (see Table 19).14
Table 19: Compensation for Termination by Contract Type15
Fixed Duration Contract Undetermined Duration Contract
Severance Payment of at least 5% of total wages paid to the employee during the length of the FDC
Layoff compensation paid based on length of employment. ‐ 6 months‐one year: 7 days wages and
benefits; ‐ Over 1 year: 15 days for each year of
employment up to 6 month’s wage and benefits (fractions of a half year or more counted as an entire year)
Only 34% of the 800 unemployed workers received compensation from their employers related to their termination, while 66% did not get any compensation (Figure 12). Among the 527 workers who did not get payment, 525 of them were legally entitled to receive it; 2 workers were not entitled because they worked under an UDC for less than 6 months. A higher percentage of workers who were employed at exporting factories received layoff compensation than those at nonexporting factories, 36% compared to 27% respectively; nevertheless, the percentage of workers who did not receive compensation at both types of factories is high, 64% in exporting factories and 73% in non‐exporting factories. The data also indicates that trade union members are more likely to receive compensation than nonmembers. Thirty‐nine percent of trade union members were compensated for their termination, compared with 28% of non‐members (shown in Table 20).
14 This applies only to termination. In the case of work suspension, however, the law does not require the employer to pay wages to workers. The employer can suspend an employment contract if there is serious misconduct by the worker or serious economic problems at the enterprise, up to a maximum period of 2 months. 15 Labor Law, see ILO (2005): Guide to the Cambodian Labour Law for the Garment Industry.
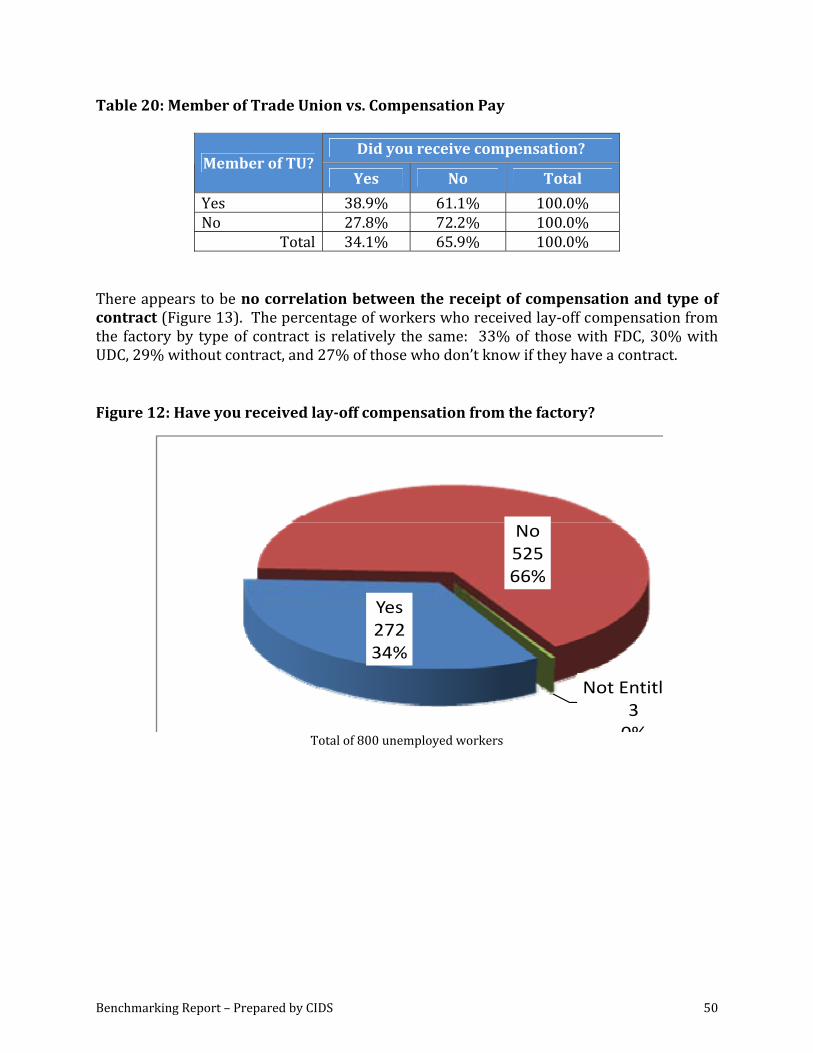
Benchmarking Report – Prepared by CIDS 50
Table 20: Member of Trade Union vs. Compensation Pay
Did you receive compensation? Member of TU?
Yes No Total
Yes 38.9% 61.1% 100.0% No 27.8% 72.2% 100.0%
Total 34.1% 65.9% 100.0% There appears to be no correlation between the receipt of compensation and type of contract (Figure 13). The percentage of workers who received lay‐off compensation from the factory by type of contract is relatively the same: 33% of those with FDC, 30% with UDC, 29% without contract, and 27% of those who don’t know if they have a contract.
Figure 12: Have you received layoff compensation from the factory?
Yes 27234%
No52566%
Not Entitl30%
Total of 800 unemployed workers
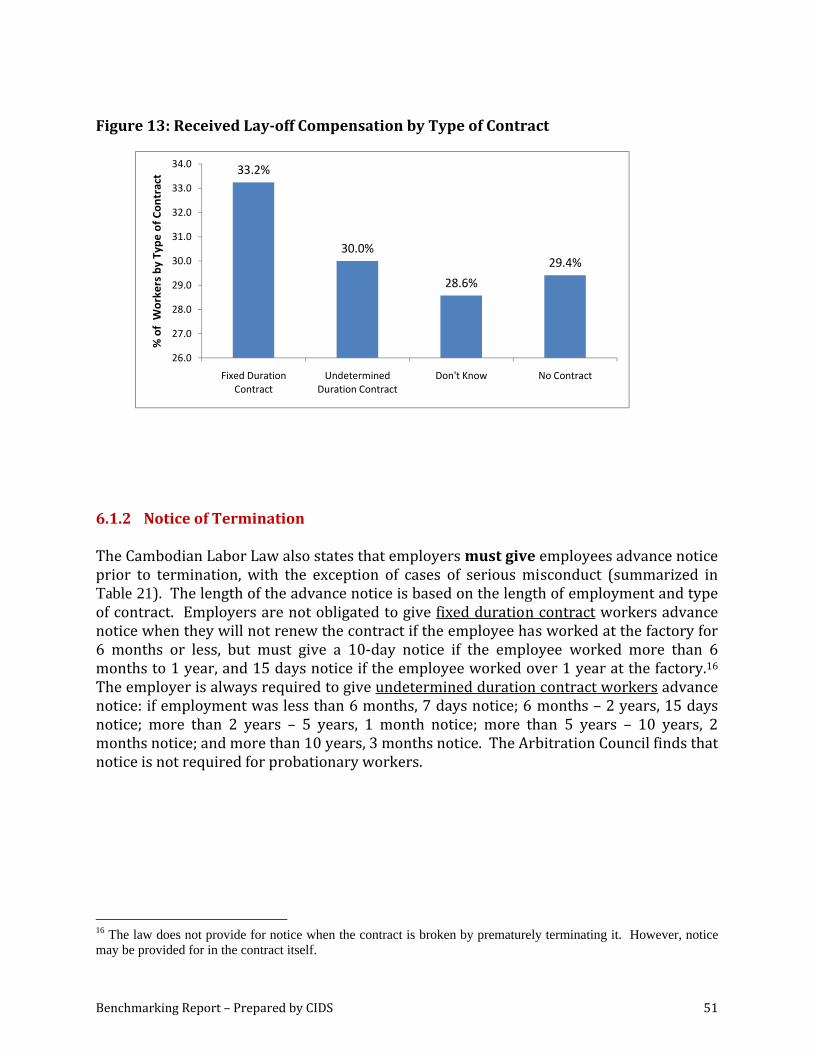
Benchmarking Report – Prepared by CIDS 51
Figure 13: Received Layoff Compensation by Type of Contract
33.2%
30.0%
28.6%
29.4%
26.0
27.0
28.0
29.0
30.0
31.0
32.0
33.0
34.0
Fixed Duration Contract
Undetermined Duration Contract
Don't Know No Contract
% of Workers by Type
of C
ontract
6.1.2 Notice of Termination The Cambodian Labor Law also states that employers must give employees advance notice prior to termination, with the exception of cases of serious misconduct (summarized in Table 21). The length of the advance notice is based on the length of employment and type of contract. Employers are not obligated to give fixed duration contract workers advance notice when they will not renew the contract if the employee has worked at the factory for 6 months or less, but must give a 10‐day notice if the employee worked more than 6 months to 1 year, and 15 days notice if the employee worked over 1 year at the factory.16 The employer is always required to give undetermined duration contract workers advance notice: if employment was less than 6 months, 7 days notice; 6 months – 2 years, 15 days notice; more than 2 years – 5 years, 1 month notice; more than 5 years – 10 years, 2 months notice; and more than 10 years, 3 months notice. The Arbitration Council finds that notice is not required for probationary workers.
16 The law does not provide for notice when the contract is broken by prematurely terminating it. However, notice may be provided for in the contract itself.
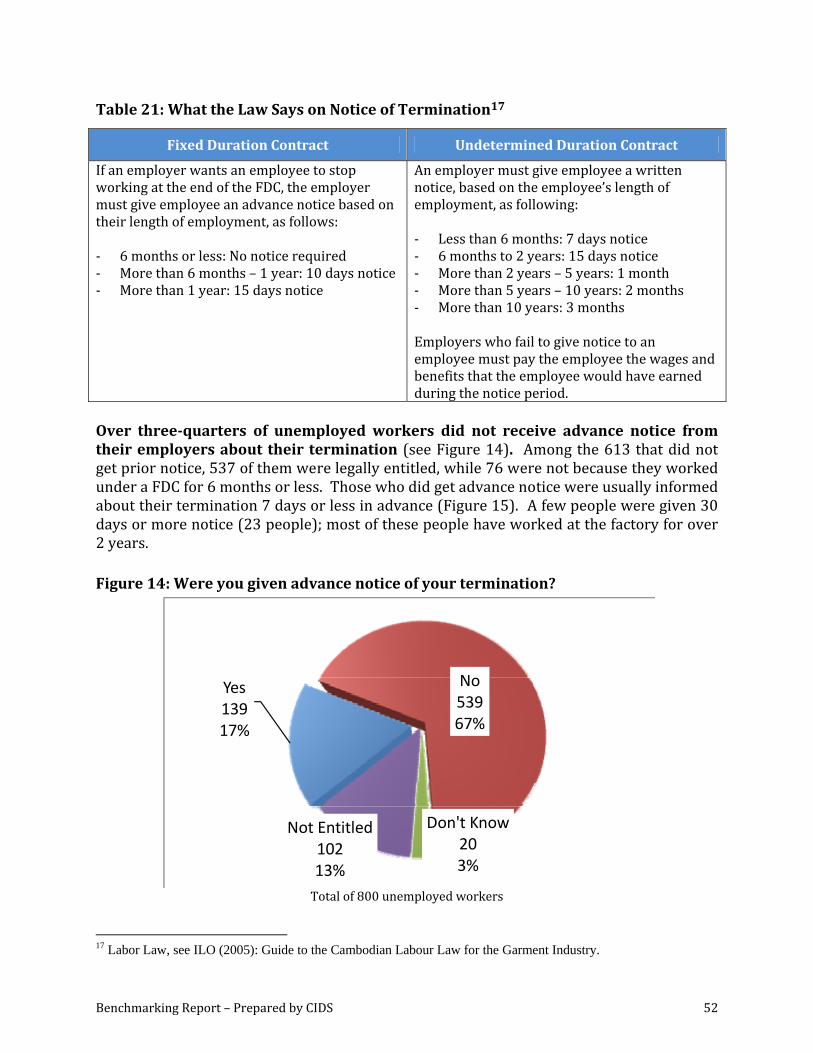
Benchmarking Report – Prepared by CIDS 52
Table 21: What the Law Says on Notice of Termination17
Fixed Duration Contract Undetermined Duration Contract
If an employer wants an employee to stop working at the end of the FDC, the employer must give employee an advance notice based on their length of employment, as follows: ‐ 6 months or less: No notice required ‐ More than 6 months – 1 year: 10 days notice ‐ More than 1 year: 15 days notice
An employer must give employee a written notice, based on the employee’s length of employment, as following: ‐ Less than 6 months: 7 days notice ‐ 6 months to 2 years: 15 days notice ‐ More than 2 years – 5 years: 1 month ‐ More than 5 years – 10 years: 2 months ‐ More than 10 years: 3 months Employers who fail to give notice to an employee must pay the employee the wages and benefits that the employee would have earned during the notice period.
Over threequarters of unemployed workers did not receive advance notice from their employers about their termination (see Figure 14). Among the 613 that did not get prior notice, 537 of them were legally entitled, while 76 were not because they worked under a FDC for 6 months or less. Those who did get advance notice were usually informed about their termination 7 days or less in advance (Figure 15). A few people were given 30 days or more notice (23 people); most of these people have worked at the factory for over 2 years.
Figure 14: Were you given advance notice of your termination?
Yes 13917%
No53967%
Don't Know203%
Not Entitled10213%
Total of 800 unemployed workers
17 Labor Law, see ILO (2005): Guide to the Cambodian Labour Law for the Garment Industry.
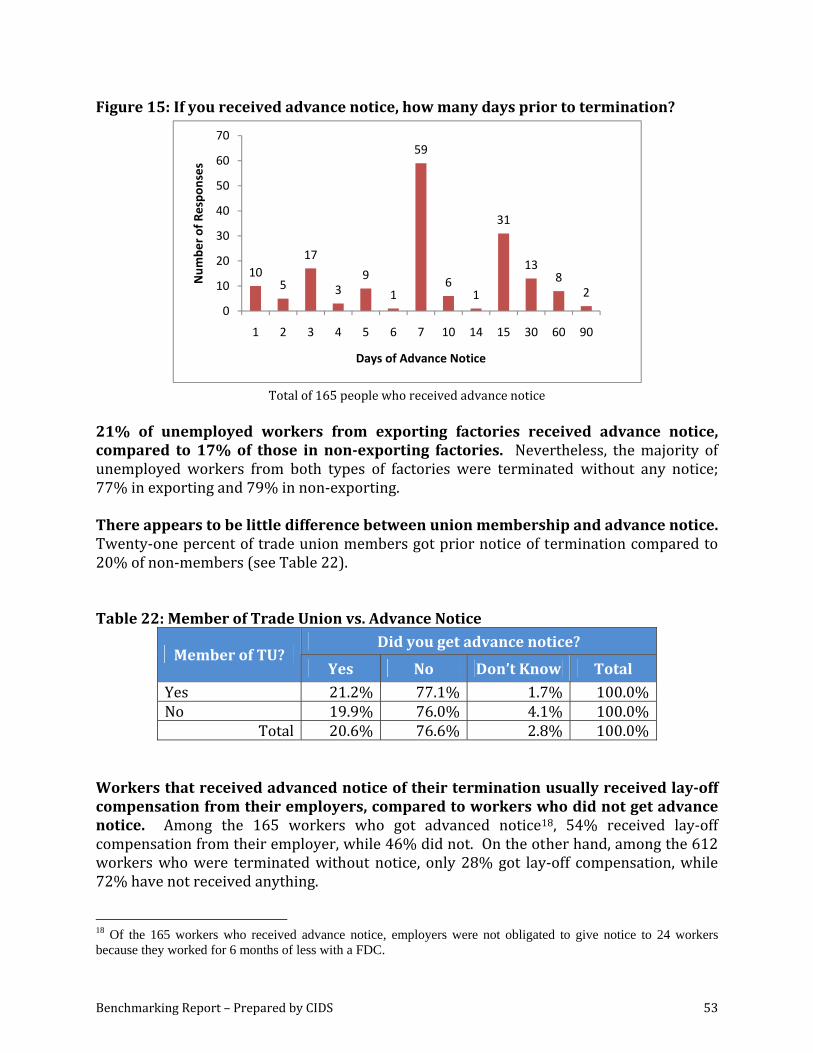
Benchmarking Report – Prepared by CIDS 53
Figure 15: If you received advance notice, how many days prior to termination?
105
17
39
1
59
61
31
138
20
10
20
30
40
50
60
70
1 2 3 4 5 6 7 10 14 15 30 60 90
Num
ber o
f Respo
nses
Days of Advance Notice
Total of 165 people who received advance notice
21% of unemployed workers from exporting factories received advance notice, compared to 17% of those in nonexporting factories. Nevertheless, the majority of unemployed workers from both types of factories were terminated without any notice; 77% in exporting and 79% in non‐exporting. There appears to be little difference between union membership and advance notice. Twenty‐one percent of trade union members got prior notice of termination compared to 20% of non‐members (see Table 22). Table 22: Member of Trade Union vs. Advance Notice
Did you get advance notice? Member of TU?
Yes No Don’t Know Total Yes 21.2% 77.1% 1.7% 100.0% No 19.9% 76.0% 4.1% 100.0%
Total 20.6% 76.6% 2.8% 100.0% Workers that received advanced notice of their termination usually received layoff compensation from their employers, compared to workers who did not get advance notice. Among the 165 workers who got advanced notice18, 54% received lay‐off compensation from their employer, while 46% did not. On the other hand, among the 612 workers who were terminated without notice, only 28% got lay‐off compensation, while 72% have not received anything.
18 Of the 165 workers who received advance notice, employers were not obligated to give notice to 24 workers because they worked for 6 months of less with a FDC.
Benchmarking Report – Prepared by CIDS 54
With most workers terminated without any advance notice and/or without lay‐off compensation, it is thus no surprise that 63% of the 800 unemployed workers surveyed feel that they were not treated fairly by management during their termination. Almost all of the 800 unemployed workers (93%) stated that other workers were terminated from the factory at the same time as them. In most of these cases (54% of 745 workers), workers said that management did not consult with workers, union leaders or shop stewards about the terminations, while 38% of workers said management did consult and inform. More than half of the 800 unemployed workers (57% or 458 workers) were members of a trade union. Sixty‐six percent of trade union members (304 workers) received assistance from their union. The primary action taken by trade unions to help laid off workers was to organize strikes to solve the problems mentioned above (90% of 304 workers). Besides this, some members received financial support (7 people), help finding a new job (3 people), assistance finding training (1 person), and legal advice (15 people).
6.2 What are Retrenched Workers Doing Now? In the sample of 2000 garment workers, 958 workers have been retrenched at least once in 2009 (800 unemployed workers and 158 currently employed workers who were laid‐off from their previous garment factory job in 2009). Data from this baseline survey provides us with some indication on what retrenched workers are doing (illustrated in Figure 16). Amongst the 958 workers who encountered retrenchment in 2009, 16.5% have found a new job in another garment factory, 6.2% have found a new job in another sector, and 1.9% have gone into training. The majority are looking for a new job (63%), while 12.5% have returned to their hometown to help on the family farm, raise livestock or help with housework. The category of “returned home” also includes workers who plan to return home as soon as they get their lay‐off compensation pay from the factory.
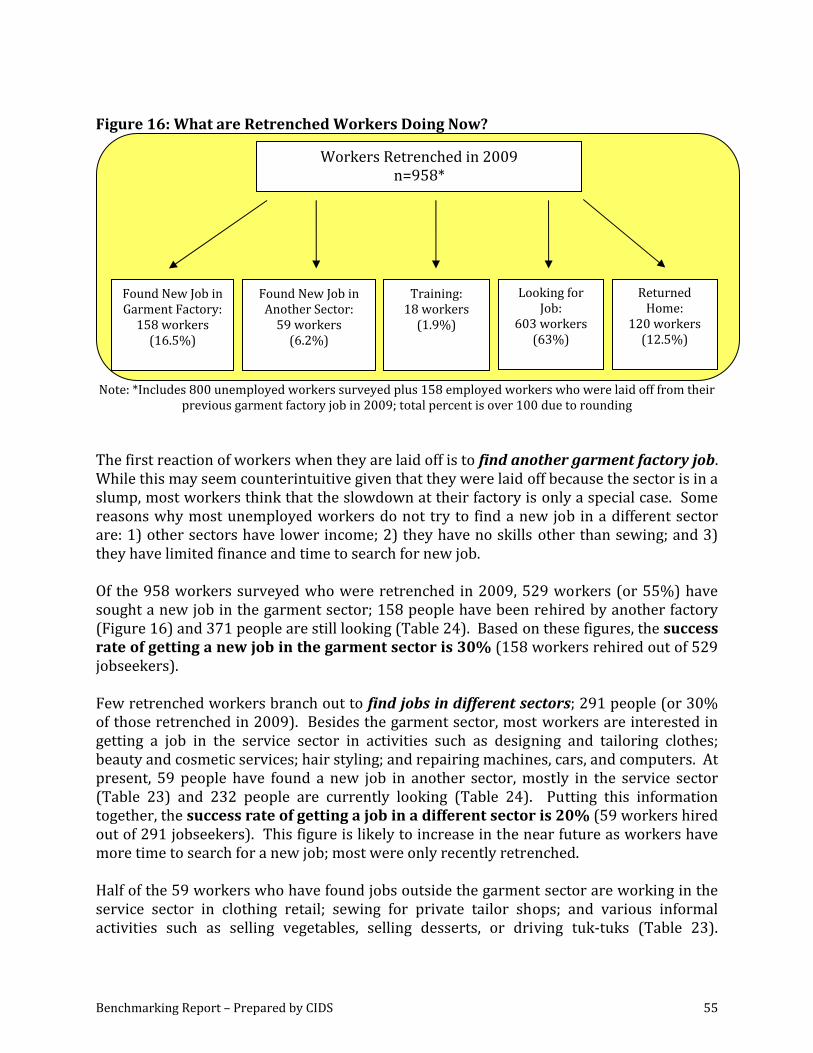
Benchmarking Report – Prepared by CIDS 55
Figure 16: What are Retrenched Workers Doing Now?
Note: *Includes 800 unemployed workers surveyed plus 158 employed workers who were laid off from their
previous garment factory job in 2009; total percent is over 100 due to rounding The first reaction of workers when they are laid off is to find another garment factory job. While this may seem counterintuitive given that they were laid off because the sector is in a slump, most workers think that the slowdown at their factory is only a special case. Some reasons why most unemployed workers do not try to find a new job in a different sector are: 1) other sectors have lower income; 2) they have no skills other than sewing; and 3) they have limited finance and time to search for new job. Of the 958 workers surveyed who were retrenched in 2009, 529 workers (or 55%) have sought a new job in the garment sector; 158 people have been rehired by another factory (Figure 16) and 371 people are still looking (Table 24). Based on these figures, the success rate of getting a new job in the garment sector is 30% (158 workers rehired out of 529 jobseekers). Few retrenched workers branch out to find jobs in different sectors; 291 people (or 30% of those retrenched in 2009). Besides the garment sector, most workers are interested in getting a job in the service sector in activities such as designing and tailoring clothes; beauty and cosmetic services; hair styling; and repairing machines, cars, and computers. At present, 59 people have found a new job in another sector, mostly in the service sector (Table 23) and 232 people are currently looking (Table 24). Putting this information together, the success rate of getting a job in a different sector is 20% (59 workers hired out of 291 jobseekers). This figure is likely to increase in the near future as workers have more time to search for a new job; most were only recently retrenched. Half of the 59 workers who have found jobs outside the garment sector are working in the service sector in clothing retail; sewing for private tailor shops; and various informal activities such as selling vegetables, selling desserts, or driving tuk‐tuks (Table 23).
Workers Retrenched in 2009 n=958*
Found New Job in Garment Factory: 158 workers (16.5%)
Found New Job in Another Sector: 59 workers (6.2%)
Training:18 workers (1.9%)
Looking for Job:
603 workers (63%)
Returned Home:
120 workers (12.5%)
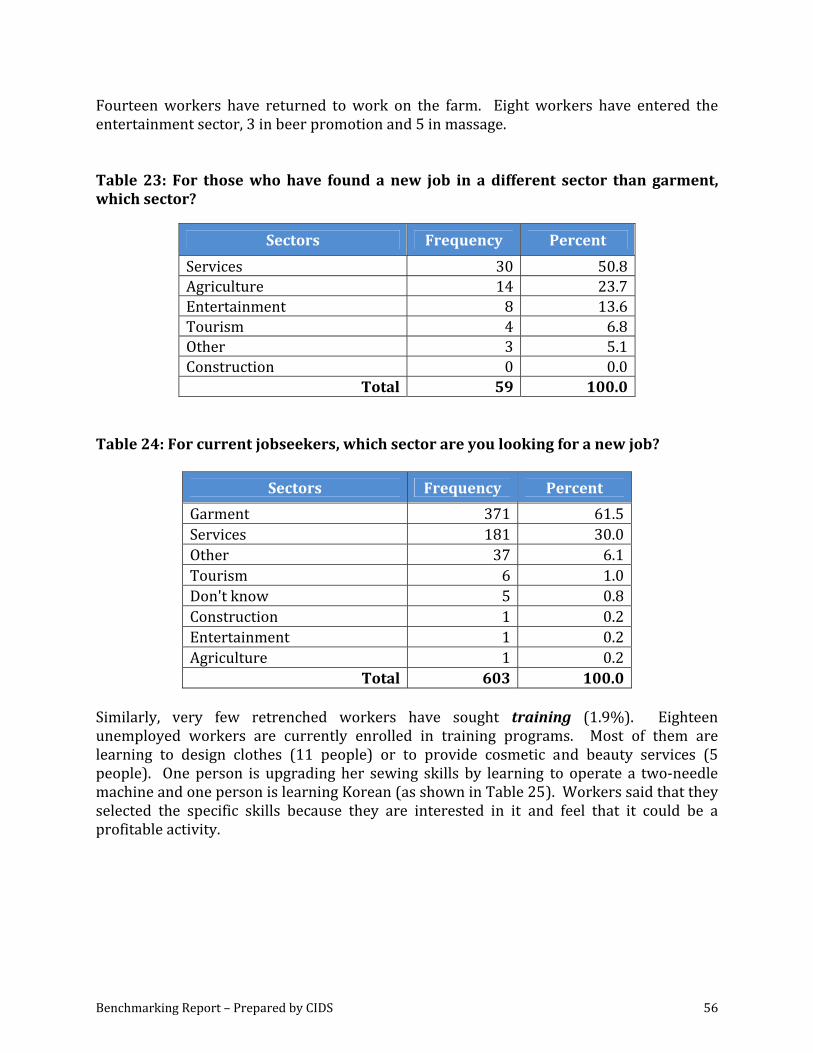
Benchmarking Report – Prepared by CIDS 56
Fourteen workers have returned to work on the farm. Eight workers have entered the entertainment sector, 3 in beer promotion and 5 in massage. Table 23: For those who have found a new job in a different sector than garment, which sector?
Sectors Frequency Percent
Services 30 50.8 Agriculture 14 23.7 Entertainment 8 13.6 Tourism 4 6.8 Other 3 5.1 Construction 0 0.0
Total 59 100.0
Table 24: For current jobseekers, which sector are you looking for a new job?
Sectors Frequency Percent
Garment 371 61.5 Services 181 30.0 Other 37 6.1 Tourism 6 1.0 Don't know 5 0.8 Construction 1 0.2 Entertainment 1 0.2 Agriculture 1 0.2
Total 603 100.0 Similarly, very few retrenched workers have sought training (1.9%). Eighteen unemployed workers are currently enrolled in training programs. Most of them are learning to design clothes (11 people) or to provide cosmetic and beauty services (5 people). One person is upgrading her sewing skills by learning to operate a two‐needle machine and one person is learning Korean (as shown in Table 25). Workers said that they selected the specific skills because they are interested in it and feel that it could be a profitable activity.
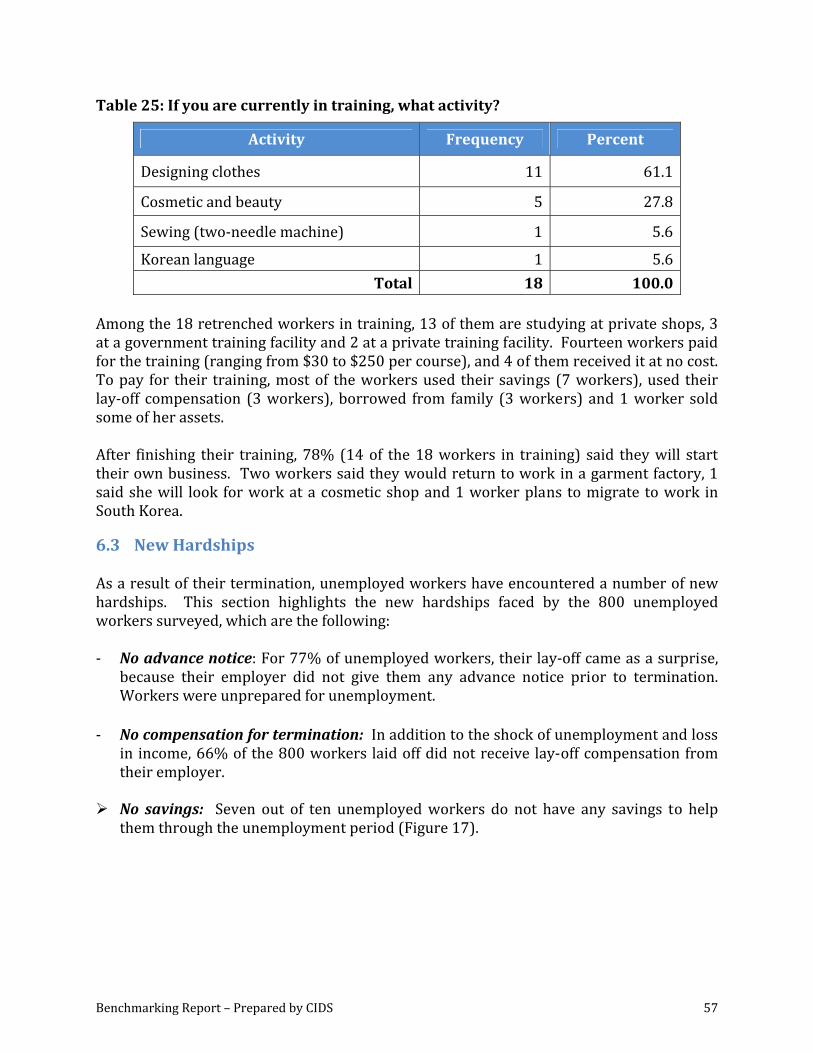
Benchmarking Report – Prepared by CIDS 57
Table 25: If you are currently in training, what activity?
Activity Frequency Percent
Designing clothes 11 61.1
Cosmetic and beauty 5 27.8
Sewing (two‐needle machine) 1 5.6
Korean language 1 5.6Total 18 100.0
Among the 18 retrenched workers in training, 13 of them are studying at private shops, 3 at a government training facility and 2 at a private training facility. Fourteen workers paid for the training (ranging from $30 to $250 per course), and 4 of them received it at no cost. To pay for their training, most of the workers used their savings (7 workers), used their lay‐off compensation (3 workers), borrowed from family (3 workers) and 1 worker sold some of her assets. After finishing their training, 78% (14 of the 18 workers in training) said they will start their own business. Two workers said they would return to work in a garment factory, 1 said she will look for work at a cosmetic shop and 1 worker plans to migrate to work in South Korea.
6.3 New Hardships As a result of their termination, unemployed workers have encountered a number of new hardships. This section highlights the new hardships faced by the 800 unemployed workers surveyed, which are the following: ‐ No advance notice: For 77% of unemployed workers, their lay‐off came as a surprise,
because their employer did not give them any advance notice prior to termination. Workers were unprepared for unemployment.
‐ No compensation for termination: In addition to the shock of unemployment and loss
in income, 66% of the 800 workers laid off did not receive lay‐off compensation from their employer.
No savings: Seven out of ten unemployed workers do not have any savings to help them through the unemployment period (Figure 17).
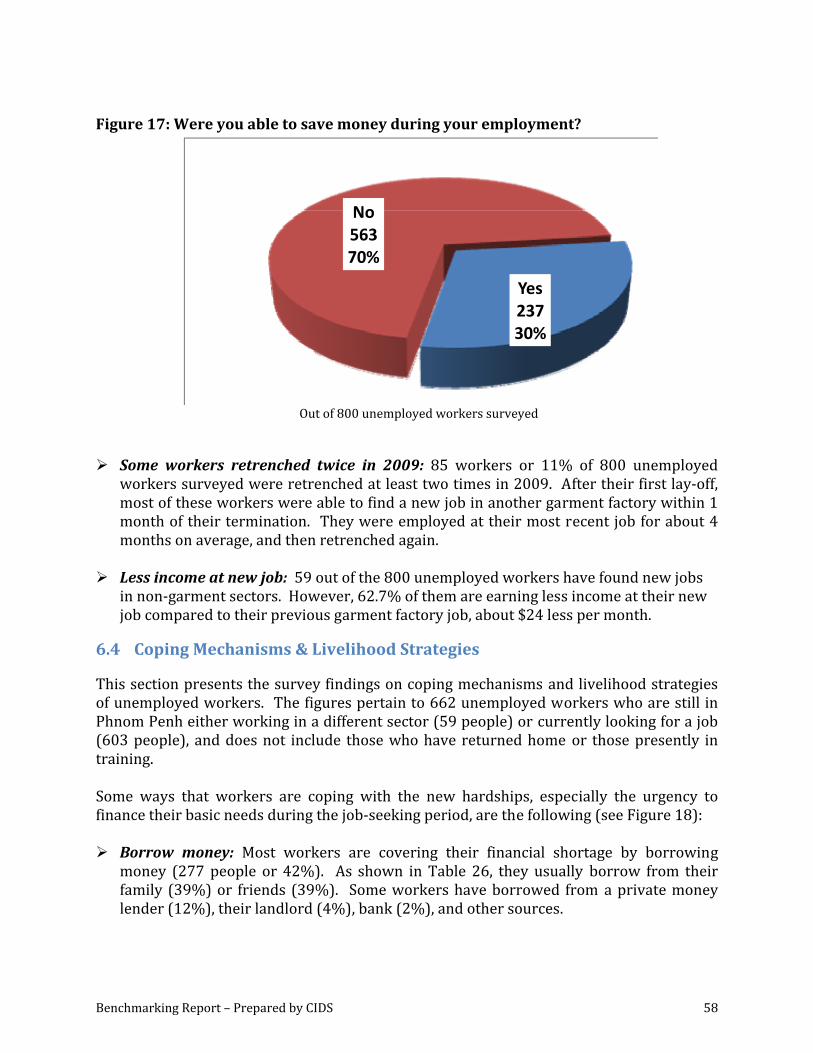
Benchmarking Report – Prepared by CIDS 58
Figure 17: Were you able to save money during your employment?
Yes23730%
No56370%
Out of 800 unemployed workers surveyed
Some workers retrenched twice in 2009: 85 workers or 11% of 800 unemployed workers surveyed were retrenched at least two times in 2009. After their first lay‐off, most of these workers were able to find a new job in another garment factory within 1 month of their termination. They were employed at their most recent job for about 4 months on average, and then retrenched again.
Less income at new job: 59 out of the 800 unemployed workers have found new jobs in non‐garment sectors. However, 62.7% of them are earning less income at their new job compared to their previous garment factory job, about $24 less per month.
6.4 Coping Mechanisms & Livelihood Strategies This section presents the survey findings on coping mechanisms and livelihood strategies of unemployed workers. The figures pertain to 662 unemployed workers who are still in Phnom Penh either working in a different sector (59 people) or currently looking for a job (603 people), and does not include those who have returned home or those presently in training. Some ways that workers are coping with the new hardships, especially the urgency to finance their basic needs during the job‐seeking period, are the following (see Figure 18):
Borrow money: Most workers are covering their financial shortage by borrowing money (277 people or 42%). As shown in Table 26, they usually borrow from their family (39%) or friends (39%). Some workers have borrowed from a private money lender (12%), their landlord (4%), bank (2%), and other sources.
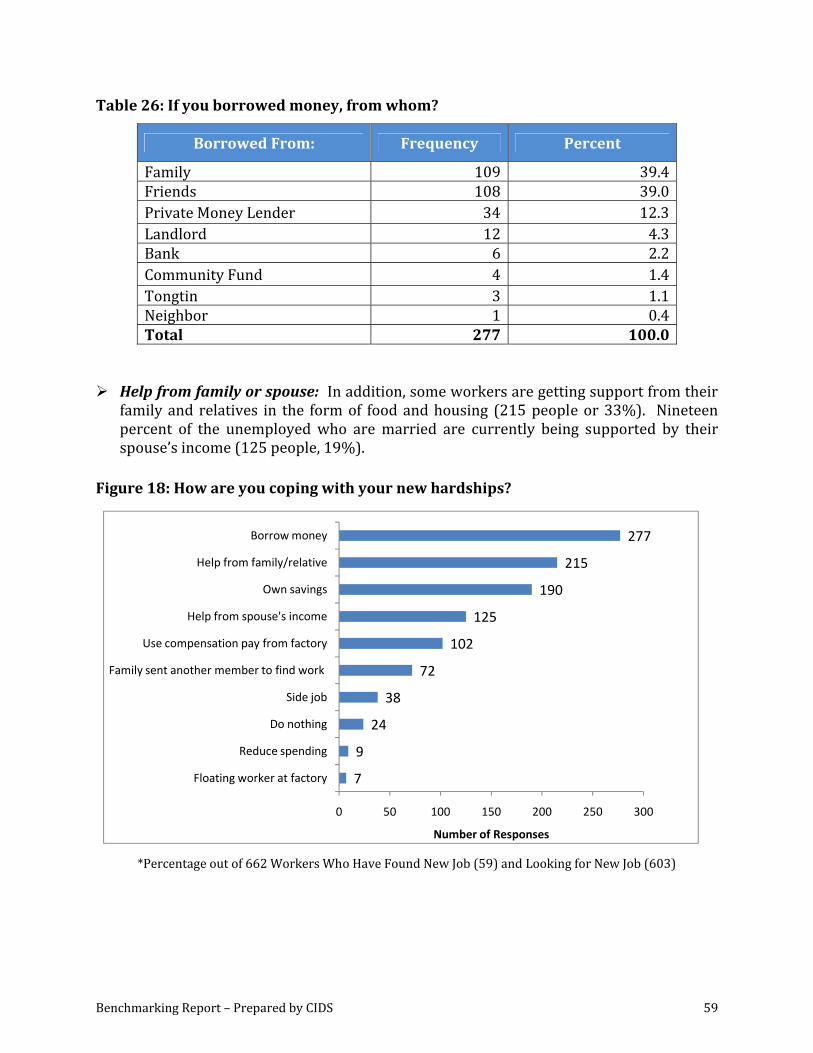
Benchmarking Report – Prepared by CIDS 59
Table 26: If you borrowed money, from whom?
Borrowed From: Frequency Percent
Family 109 39.4 Friends 108 39.0 Private Money Lender 34 12.3 Landlord 12 4.3 Bank 6 2.2 Community Fund 4 1.4 Tongtin 3 1.1 Neighbor 1 0.4 Total 277 100.0
Help from family or spouse: In addition, some workers are getting support from their family and relatives in the form of food and housing (215 people or 33%). Nineteen percent of the unemployed who are married are currently being supported by their spouse’s income (125 people, 19%).
Figure 18: How are you coping with your new hardships?
7
9
24
38
72
102
125
190
215
277
0 50 100 150 200 250 300
Floating worker at factory
Reduce spending
Do nothing
Side job
Family sent another member to find work
Use compensation pay from factory
Help from spouse's income
Own savings
Help from family/relative
Borrow money
Number of Responses
*Percentage out of 662 Workers Who Have Found New Job (59) and Looking for New Job (603)
Benchmarking Report – Prepared by CIDS 60
Use own savings: Two hundred of the 662 workers were able to accumulate some savings during their previous employment. Among the 200 workers, 75 have already used up all of their savings, 115 have used some of them, and 10 people have not touched their savings yet.
Use layoff compensation pay from factory: 273 of the 662 unemployed workers received lay‐off compensation. Of those that received compensation, 102 workers have used this money to help finance their living costs during the job‐seeking period.
Family sent another member to find work: To cope with the loss of remittances, 72 households (11% of 662 workers) have sent another family member to find work. The added worker is typically a sister around 18‐26 years old. The majority of these added workers (88%) are looking for or have found a job in the garment sector.
Side job: Some workers (38 people) have picked up a temporary side jobs to earn daily income selling perfume, running tuk‐tuks, or providing tailoring or nail manicure services.
Other coping mechanisms: Nine people said they have reduced spending on basic needs. Seven workers say they are occasionally called to work at a factory as floating workers, where they can earn some daily income.
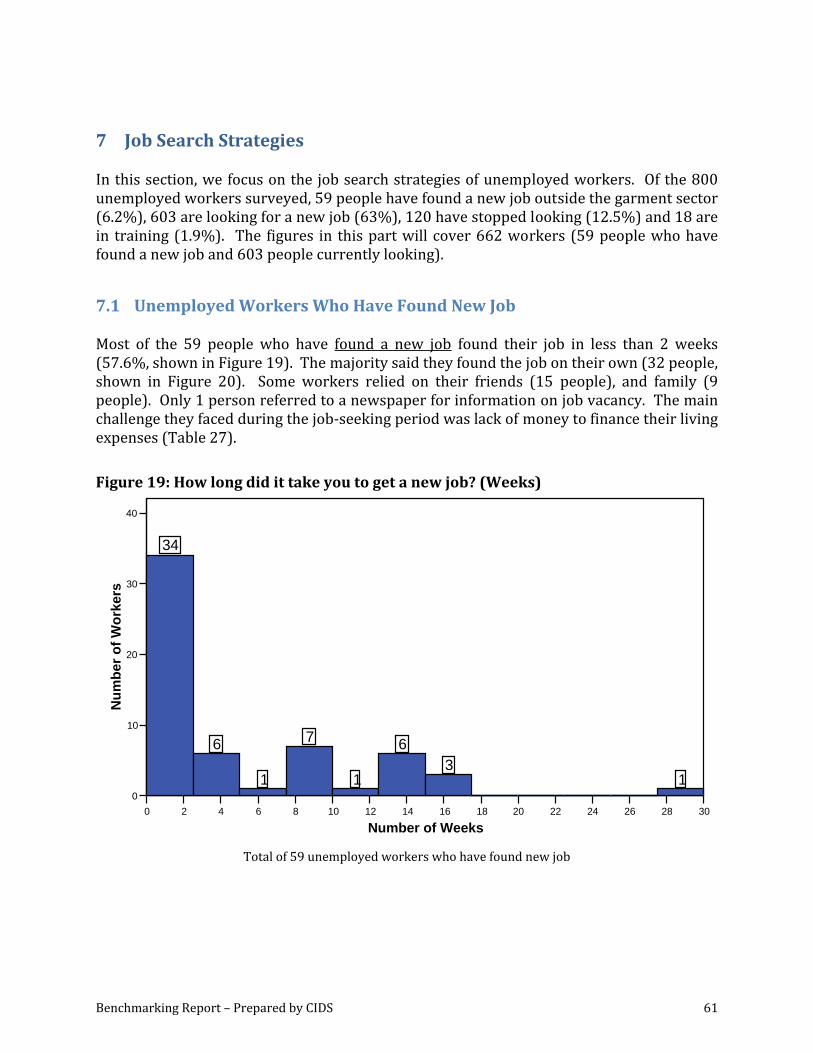
Benchmarking Report – Prepared by CIDS 61
7 Job Search Strategies
In this section, we focus on the job search strategies of unemployed workers. Of the 800 unemployed workers surveyed, 59 people have found a new job outside the garment sector (6.2%), 603 are looking for a new job (63%), 120 have stopped looking (12.5%) and 18 are in training (1.9%). The figures in this part will cover 662 workers (59 people who have found a new job and 603 people currently looking).
7.1 Unemployed Workers Who Have Found New Job Most of the 59 people who have found a new job found their job in less than 2 weeks (57.6%, shown in Figure 19). The majority said they found the job on their own (32 people, shown in Figure 20). Some workers relied on their friends (15 people), and family (9 people). Only 1 person referred to a newspaper for information on job vacancy. The main challenge they faced during the job‐seeking period was lack of money to finance their living expenses (Table 27). Figure 19: How long did it take you to get a new job? (Weeks)
0 2 4 6 8 10 12 14 16 18 20 22 24 26 28 30
Number of Weeks
0
10
20
30
40
Num
ber o
f Wor
kers
34
6
1
7
1
63
1
Total of 59 unemployed workers who have found new job
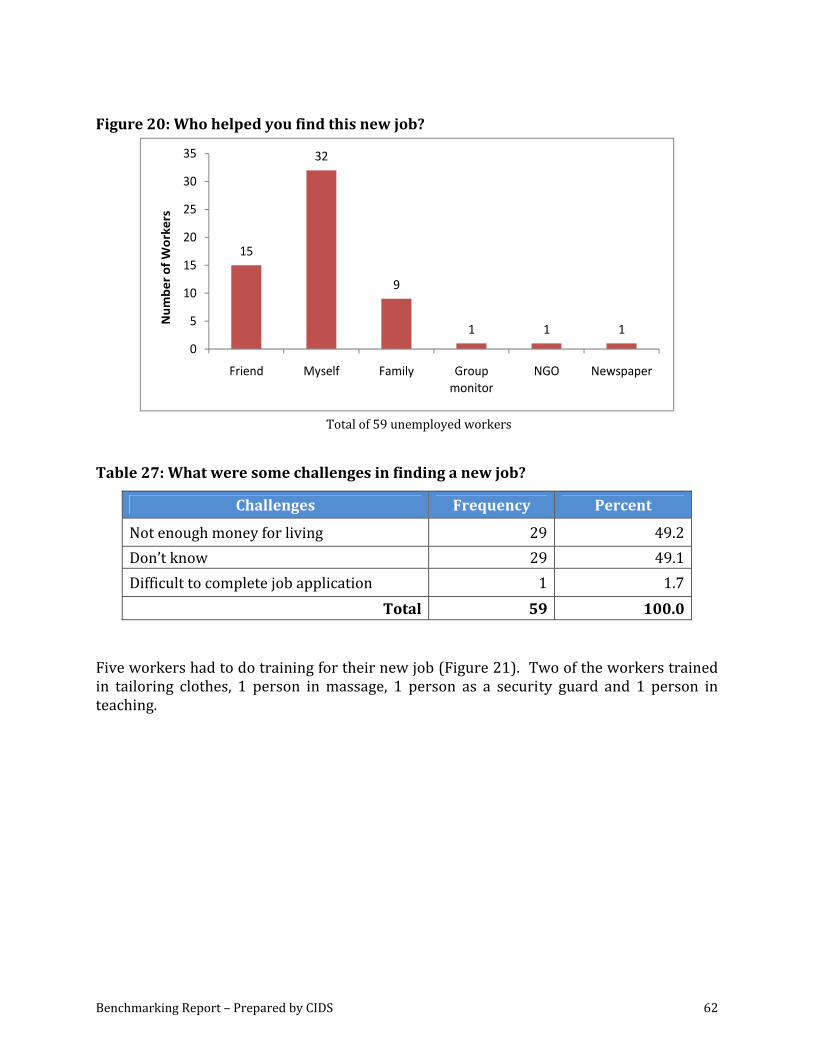
Benchmarking Report – Prepared by CIDS 62
Figure 20: Who helped you find this new job?
15
32
9
1 1 10
5
10
15
20
25
30
35
Friend Myself Family Group monitor
NGO Newspaper
Num
ber of W
orkers
Total of 59 unemployed workers
Table 27: What were some challenges in finding a new job?
Challenges Frequency Percent
Not enough money for living 29 49.2Don’t know 29 49.1Difficult to complete job application 1 1.7
Total 59 100.0 Five workers had to do training for their new job (Figure 21). Two of the workers trained in tailoring clothes, 1 person in massage, 1 person as a security guard and 1 person in teaching.
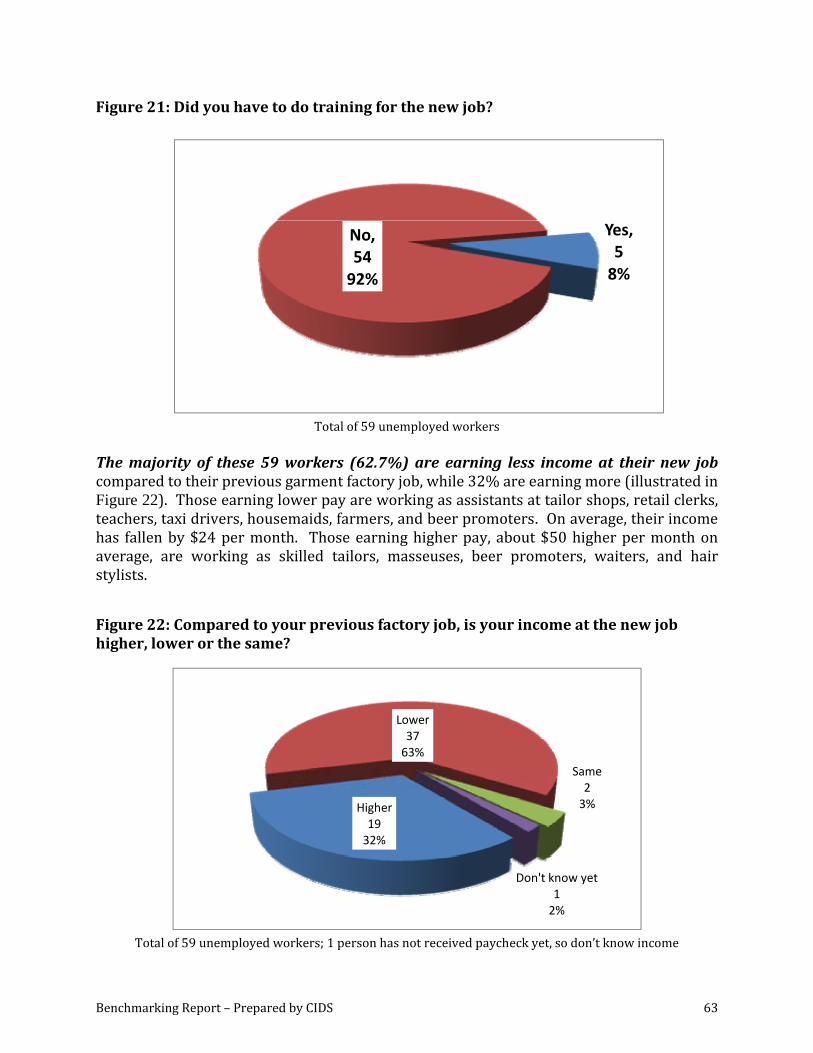
Benchmarking Report – Prepared by CIDS 63
Figure 21: Did you have to do training for the new job?
Yes,58%
No,5492%
Total of 59 unemployed workers
The majority of these 59 workers (62.7%) are earning less income at their new job compared to their previous garment factory job, while 32% are earning more (illustrated in Figure 22). Those earning lower pay are working as assistants at tailor shops, retail clerks, teachers, taxi drivers, housemaids, farmers, and beer promoters. On average, their income has fallen by $24 per month. Those earning higher pay, about $50 higher per month on average, are working as skilled tailors, masseuses, beer promoters, waiters, and hair stylists. Figure 22: Compared to your previous factory job, is your income at the new job higher, lower or the same?
Higher1932%
Lower3763%
Same23%
Don't know yet12%
Total of 59 unemployed workers; 1 person has not received paycheck yet, so don’t know income
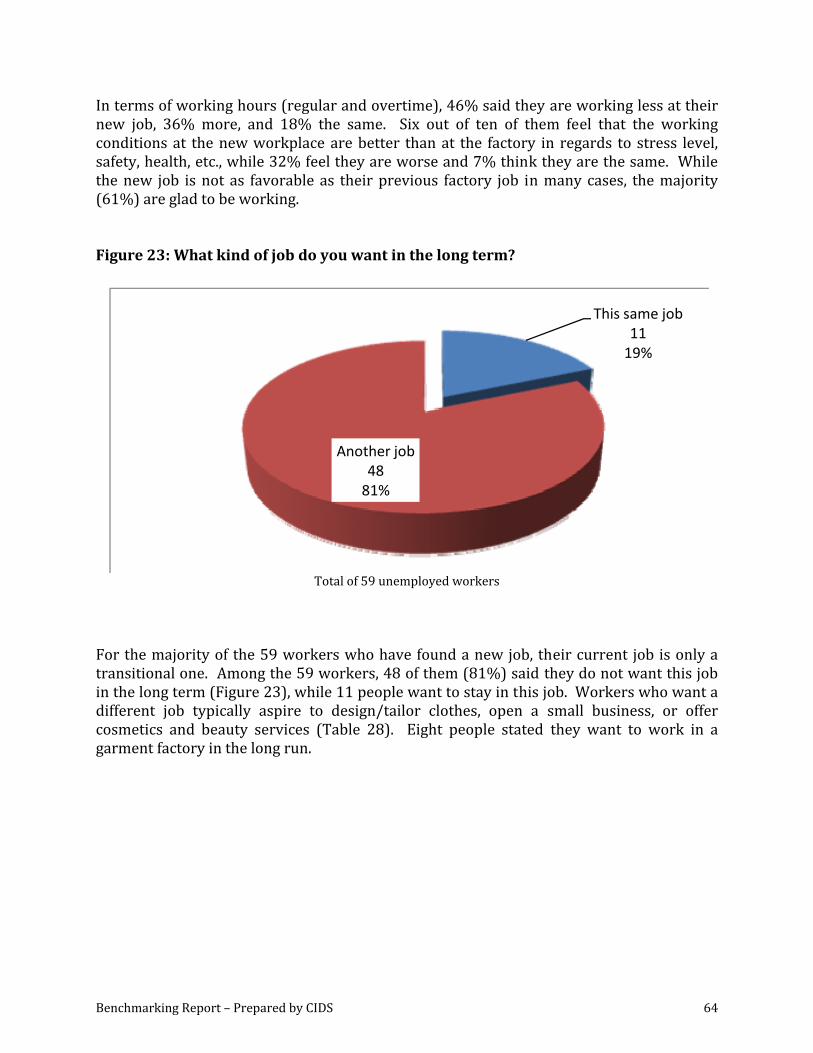
Benchmarking Report – Prepared by CIDS 64
In terms of working hours (regular and overtime), 46% said they are working less at their new job, 36% more, and 18% the same. Six out of ten of them feel that the working conditions at the new workplace are better than at the factory in regards to stress level, safety, health, etc., while 32% feel they are worse and 7% think they are the same. While the new job is not as favorable as their previous factory job in many cases, the majority (61%) are glad to be working. Figure 23: What kind of job do you want in the long term?
This same job1119%
Another job4881%
Total of 59 unemployed workers
For the majority of the 59 workers who have found a new job, their current job is only a transitional one. Among the 59 workers, 48 of them (81%) said they do not want this job in the long term (Figure 23), while 11 people want to stay in this job. Workers who want a different job typically aspire to design/tailor clothes, open a small business, or offer cosmetics and beauty services (Table 28). Eight people stated they want to work in a garment factory in the long run.
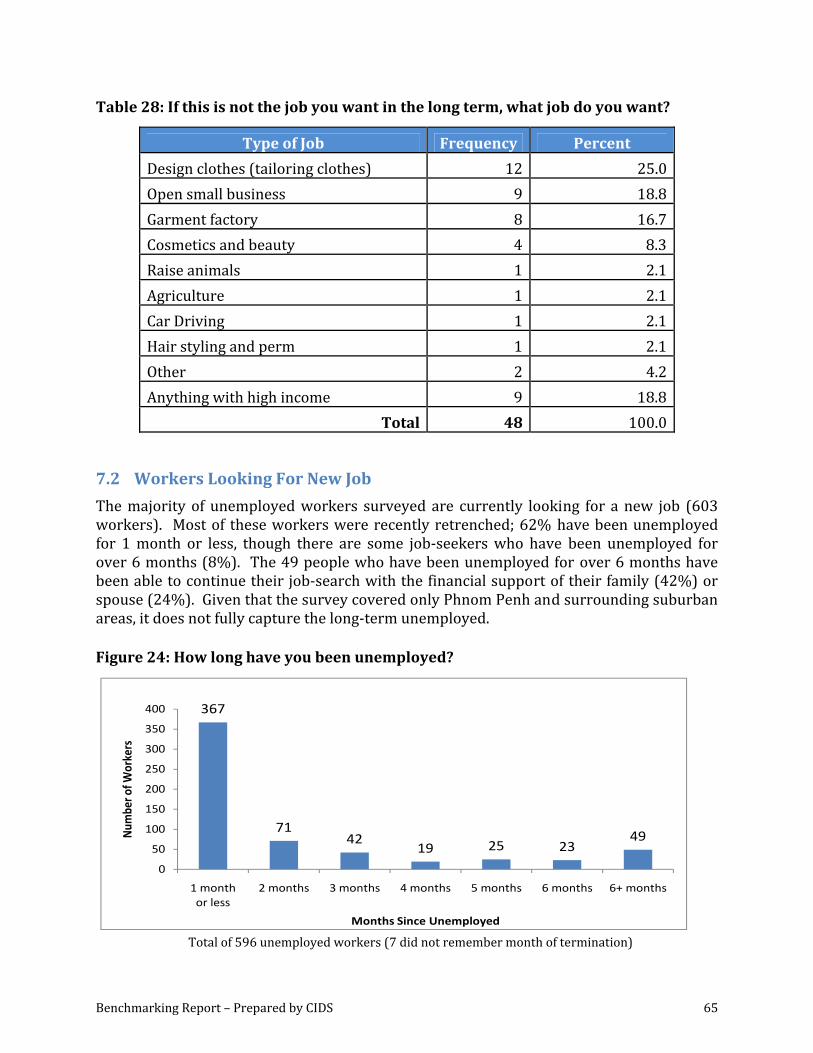
Benchmarking Report – Prepared by CIDS 65
Table 28: If this is not the job you want in the long term, what job do you want?
Type of Job Frequency Percent
Design clothes (tailoring clothes) 12 25.0 Open small business 9 18.8 Garment factory 8 16.7 Cosmetics and beauty 4 8.3 Raise animals 1 2.1 Agriculture 1 2.1 Car Driving 1 2.1 Hair styling and perm 1 2.1 Other 2 4.2 Anything with high income 9 18.8
Total 48 100.0
7.2 Workers Looking For New Job
The majority of unemployed workers surveyed are currently looking for a new job (603 workers). Most of these workers were recently retrenched; 62% have been unemployed for 1 month or less, though there are some job‐seekers who have been unemployed for over 6 months (8%). The 49 people who have been unemployed for over 6 months have been able to continue their job‐search with the financial support of their family (42%) or spouse (24%). Given that the survey covered only Phnom Penh and surrounding suburban areas, it does not fully capture the long‐term unemployed.
Figure 24: How long have you been unemployed?
367
7142
19 25 2349
0
50
100
150
200
250
300
350
400
1 month or less
2 months 3 months 4 months 5 months 6 months 6+ months
Num
ber o
f Workers
Months Since Unemployed
Total of 596 unemployed workers (7 did not remember month of termination)
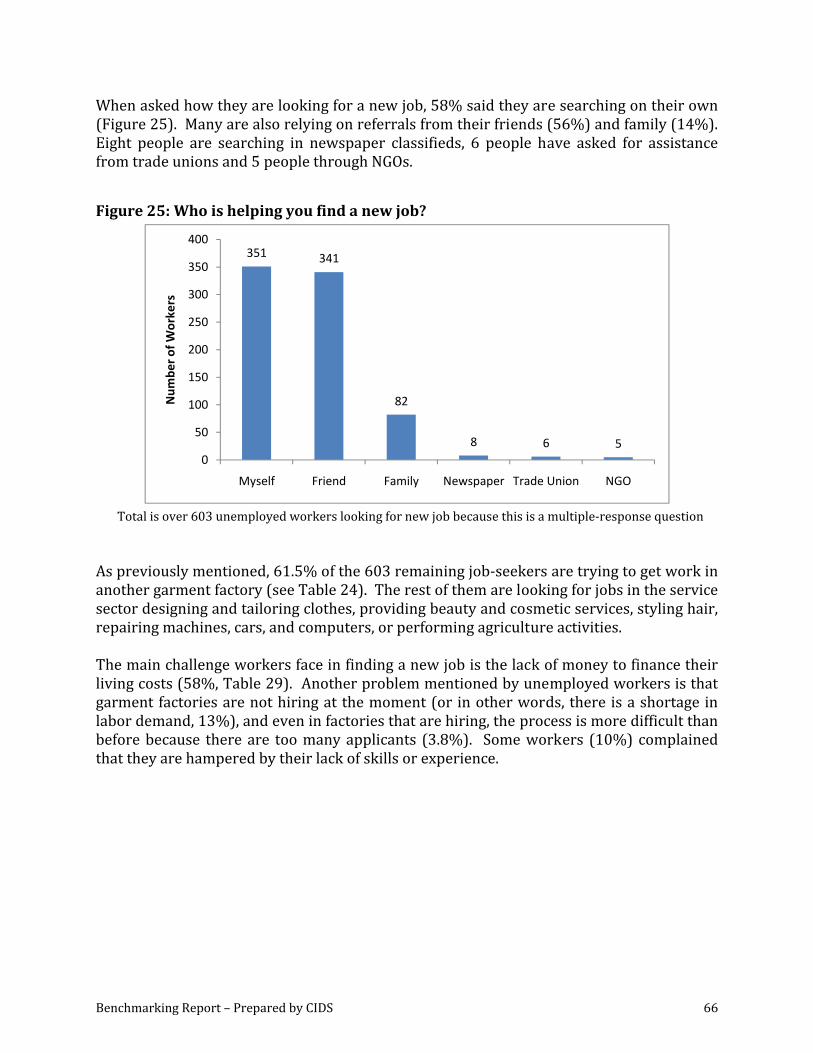
Benchmarking Report – Prepared by CIDS 66
When asked how they are looking for a new job, 58% said they are searching on their own (Figure 25). Many are also relying on referrals from their friends (56%) and family (14%). Eight people are searching in newspaper classifieds, 6 people have asked for assistance from trade unions and 5 people through NGOs. Figure 25: Who is helping you find a new job?
351 341
82
8 6 50
50
100
150
200
250
300
350
400
Myself Friend Family Newspaper Trade Union NGO
Num
ber o
f Workers
Total is over 603 unemployed workers looking for new job because this is a multiple‐response question
As previously mentioned, 61.5% of the 603 remaining job‐seekers are trying to get work in another garment factory (see Table 24). The rest of them are looking for jobs in the service sector designing and tailoring clothes, providing beauty and cosmetic services, styling hair, repairing machines, cars, and computers, or performing agriculture activities. The main challenge workers face in finding a new job is the lack of money to finance their living costs (58%, Table 29). Another problem mentioned by unemployed workers is that garment factories are not hiring at the moment (or in other words, there is a shortage in labor demand, 13%), and even in factories that are hiring, the process is more difficult than before because there are too many applicants (3.8%). Some workers (10%) complained that they are hampered by their lack of skills or experience.
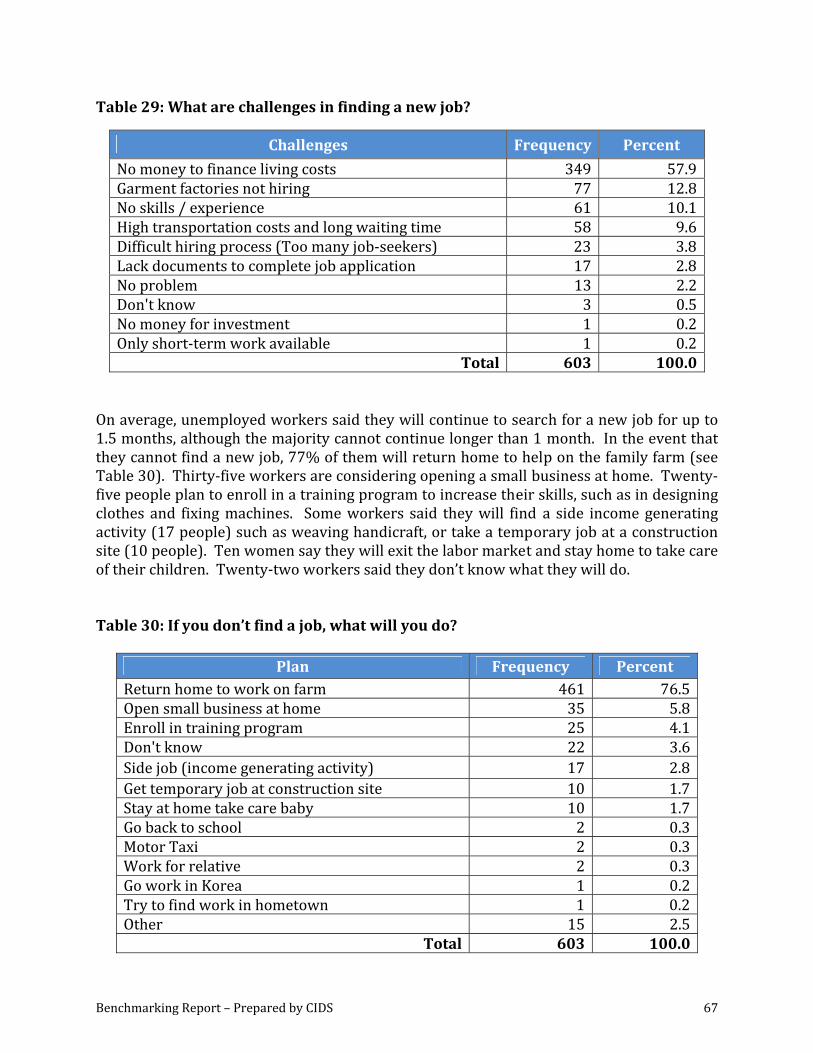
Benchmarking Report – Prepared by CIDS 67
Table 29: What are challenges in finding a new job?
Challenges Frequency Percent
No money to finance living costs 349 57.9Garment factories not hiring 77 12.8No skills / experience 61 10.1High transportation costs and long waiting time 58 9.6Difficult hiring process (Too many job‐seekers) 23 3.8Lack documents to complete job application 17 2.8No problem 13 2.2Don't know 3 0.5No money for investment 1 0.2Only short‐term work available 1 0.2
Total 603 100.0 On average, unemployed workers said they will continue to search for a new job for up to 1.5 months, although the majority cannot continue longer than 1 month. In the event that they cannot find a new job, 77% of them will return home to help on the family farm (see Table 30). Thirty‐five workers are considering opening a small business at home. Twenty‐five people plan to enroll in a training program to increase their skills, such as in designing clothes and fixing machines. Some workers said they will find a side income generating activity (17 people) such as weaving handicraft, or take a temporary job at a construction site (10 people). Ten women say they will exit the labor market and stay home to take care of their children. Twenty‐two workers said they don’t know what they will do. Table 30: If you don’t find a job, what will you do?
Plan Frequency Percent Return home to work on farm 461 76.5Open small business at home 35 5.8Enroll in training program 25 4.1Don't know 22 3.6Side job (income generating activity) 17 2.8Get temporary job at construction site 10 1.7Stay at home take care baby 10 1.7Go back to school 2 0.3Motor Taxi 2 0.3Work for relative 2 0.3Go work in Korea 1 0.2Try to find work in hometown 1 0.2Other 15 2.5
Total 603 100.0
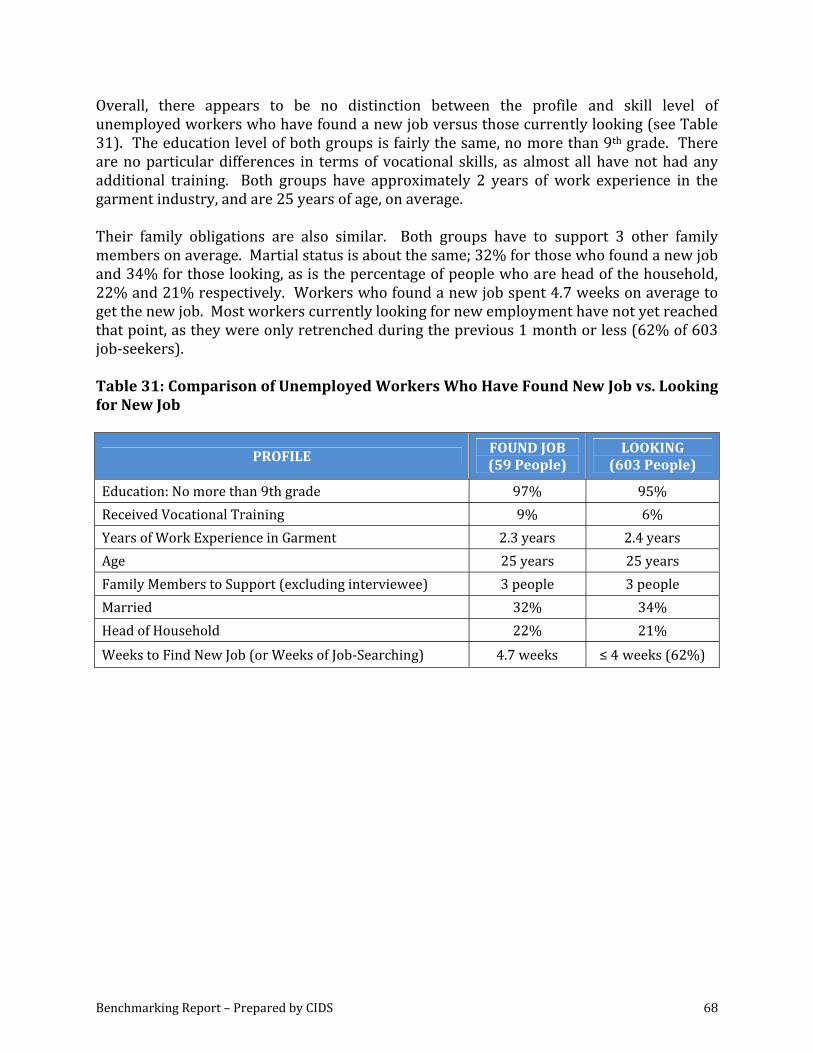
Benchmarking Report – Prepared by CIDS 68
Overall, there appears to be no distinction between the profile and skill level of unemployed workers who have found a new job versus those currently looking (see Table 31). The education level of both groups is fairly the same, no more than 9th grade. There are no particular differences in terms of vocational skills, as almost all have not had any additional training. Both groups have approximately 2 years of work experience in the garment industry, and are 25 years of age, on average. Their family obligations are also similar. Both groups have to support 3 other family members on average. Martial status is about the same; 32% for those who found a new job and 34% for those looking, as is the percentage of people who are head of the household, 22% and 21% respectively. Workers who found a new job spent 4.7 weeks on average to get the new job. Most workers currently looking for new employment have not yet reached that point, as they were only retrenched during the previous 1 month or less (62% of 603 job‐seekers). Table 31: Comparison of Unemployed Workers Who Have Found New Job vs. Looking for New Job
PROFILE FOUND JOB (59 People)
LOOKING (603 People)
Education: No more than 9th grade 97% 95% Received Vocational Training 9% 6% Years of Work Experience in Garment 2.3 years 2.4 years Age 25 years 25 years Family Members to Support (excluding interviewee) 3 people 3 people Married 32% 34% Head of Household 22% 21% Weeks to Find New Job (or Weeks of Job‐Searching) 4.7 weeks ≤ 4 weeks (62%)
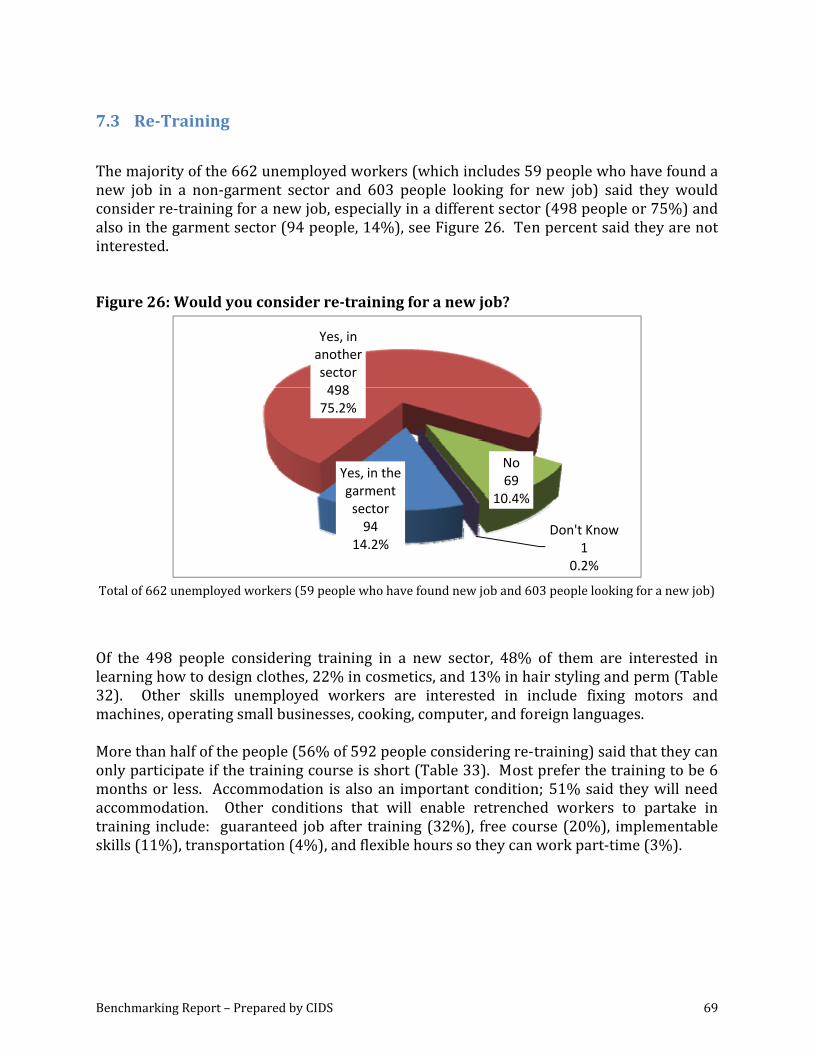
Benchmarking Report – Prepared by CIDS 69
7.3 ReTraining The majority of the 662 unemployed workers (which includes 59 people who have found a new job in a non‐garment sector and 603 people looking for new job) said they would consider re‐training for a new job, especially in a different sector (498 people or 75%) and also in the garment sector (94 people, 14%), see Figure 26. Ten percent said they are not interested. Figure 26: Would you consider retraining for a new job?
Yes, in the garment sector94
14.2%
Yes, in another sector49875.2%
No69
10.4%
Don't Know1
0.2%
Total of 662 unemployed workers (59 people who have found new job and 603 people looking for a new job) Of the 498 people considering training in a new sector, 48% of them are interested in learning how to design clothes, 22% in cosmetics, and 13% in hair styling and perm (Table 32). Other skills unemployed workers are interested in include fixing motors and machines, operating small businesses, cooking, computer, and foreign languages. More than half of the people (56% of 592 people considering re‐training) said that they can only participate if the training course is short (Table 33). Most prefer the training to be 6 months or less. Accommodation is also an important condition; 51% said they will need accommodation. Other conditions that will enable retrenched workers to partake in training include: guaranteed job after training (32%), free course (20%), implementable skills (11%), transportation (4%), and flexible hours so they can work part‐time (3%).
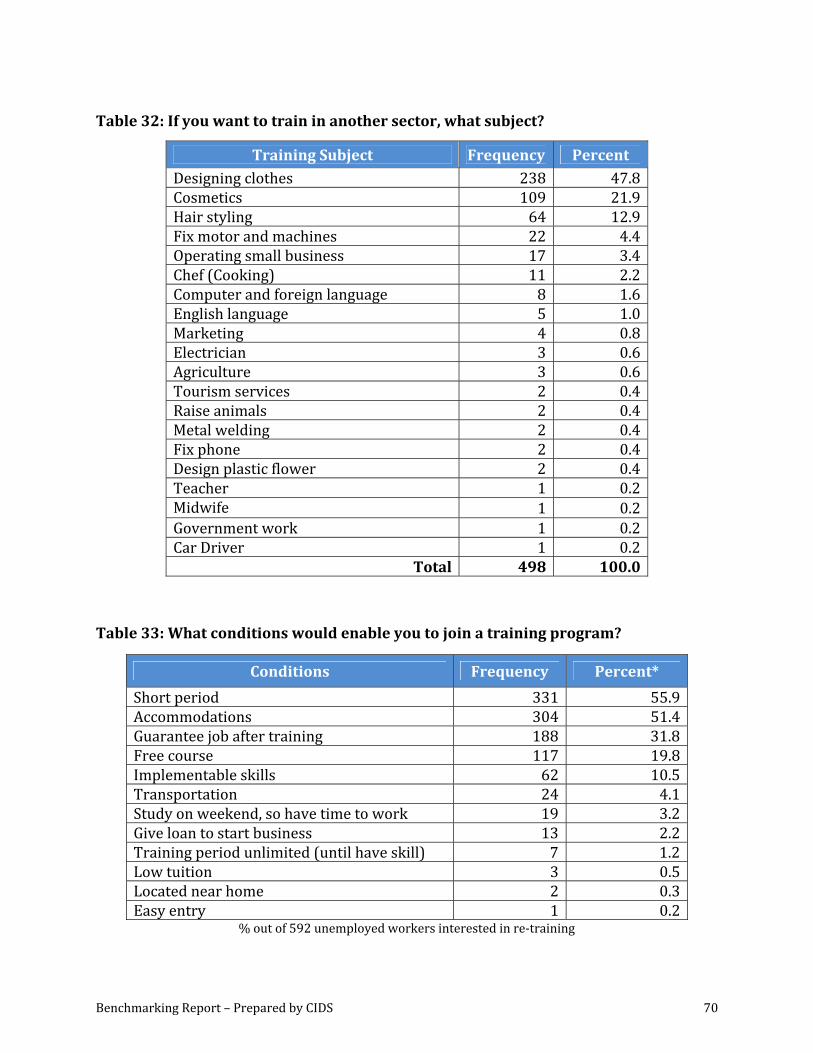
Benchmarking Report – Prepared by CIDS 70
Table 32: If you want to train in another sector, what subject?
Training Subject Frequency Percent Designing clothes 238 47.8 Cosmetics 109 21.9 Hair styling 64 12.9 Fix motor and machines 22 4.4 Operating small business 17 3.4 Chef (Cooking) 11 2.2 Computer and foreign language 8 1.6 English language 5 1.0 Marketing 4 0.8 Electrician 3 0.6 Agriculture 3 0.6 Tourism services 2 0.4 Raise animals 2 0.4 Metal welding 2 0.4 Fix phone 2 0.4 Design plastic flower 2 0.4 Teacher 1 0.2 Midwife 1 0.2 Government work 1 0.2 Car Driver 1 0.2
Total 498 100.0 Table 33: What conditions would enable you to join a training program?
Conditions Frequency Percent*
Short period 331 55.9Accommodations 304 51.4Guarantee job after training 188 31.8Free course 117 19.8Implementable skills 62 10.5Transportation 24 4.1Study on weekend, so have time to work 19 3.2Give loan to start business 13 2.2Training period unlimited (until have skill) 7 1.2Low tuition 3 0.5Located near home 2 0.3Easy entry 1 0.2
% out of 592 unemployed workers interested in re‐training
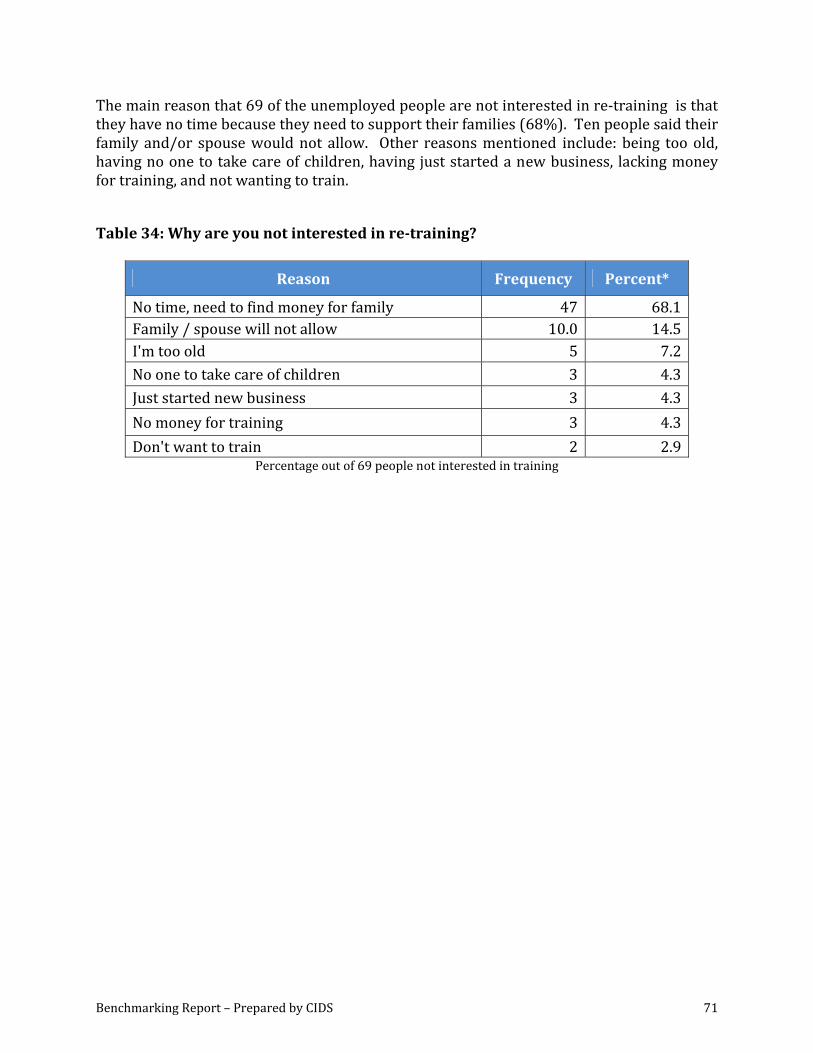
Benchmarking Report – Prepared by CIDS 71
The main reason that 69 of the unemployed people are not interested in re‐training is that they have no time because they need to support their families (68%). Ten people said their family and/or spouse would not allow. Other reasons mentioned include: being too old, having no one to take care of children, having just started a new business, lacking money for training, and not wanting to train. Table 34: Why are you not interested in retraining?
Reason Frequency Percent*
No time, need to find money for family 47 68.1Family / spouse will not allow 10.0 14.5I'm too old 5 7.2No one to take care of children 3 4.3Just started new business 3 4.3No money for training 3 4.3Don't want to train 2 2.9
Percentage out of 69 people not interested in training
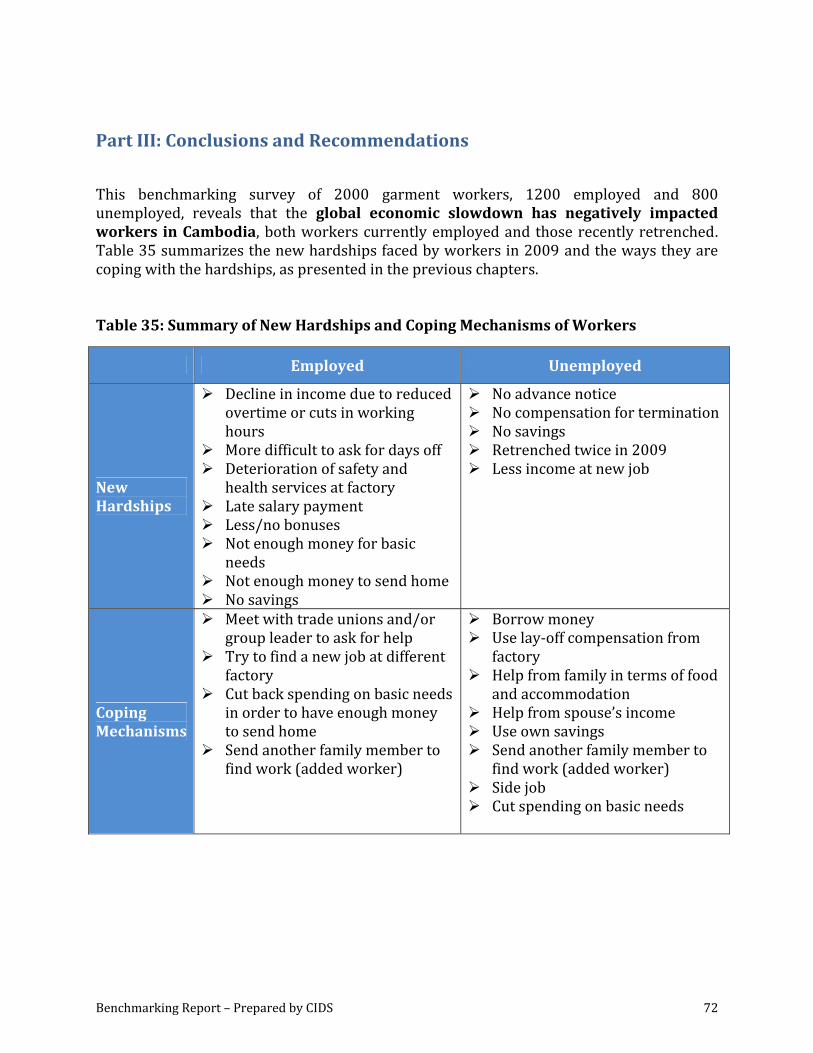
Benchmarking Report – Prepared by CIDS 72
Part III: Conclusions and Recommendations
This benchmarking survey of 2000 garment workers, 1200 employed and 800 unemployed, reveals that the global economic slowdown has negatively impacted workers in Cambodia, both workers currently employed and those recently retrenched. Table 35 summarizes the new hardships faced by workers in 2009 and the ways they are coping with the hardships, as presented in the previous chapters. Table 35: Summary of New Hardships and Coping Mechanisms of Workers
Employed Unemployed
New Hardships
Decline in income due to reduced overtime or cuts in working hours
More difficult to ask for days off Deterioration of safety and health services at factory
Late salary payment Less/no bonuses Not enough money for basic needs
Not enough money to send home No savings
No advance notice No compensation for termination No savings Retrenched twice in 2009 Less income at new job
Coping Mechanisms
Meet with trade unions and/or group leader to ask for help
Try to find a new job at different factory
Cut back spending on basic needs in order to have enough money to send home
Send another family member to find work (added worker)
Borrow money Use lay‐off compensation from factory
Help from family in terms of food and accommodation
Help from spouse’s income Use own savings Send another family member to find work (added worker)
Side job Cut spending on basic needs
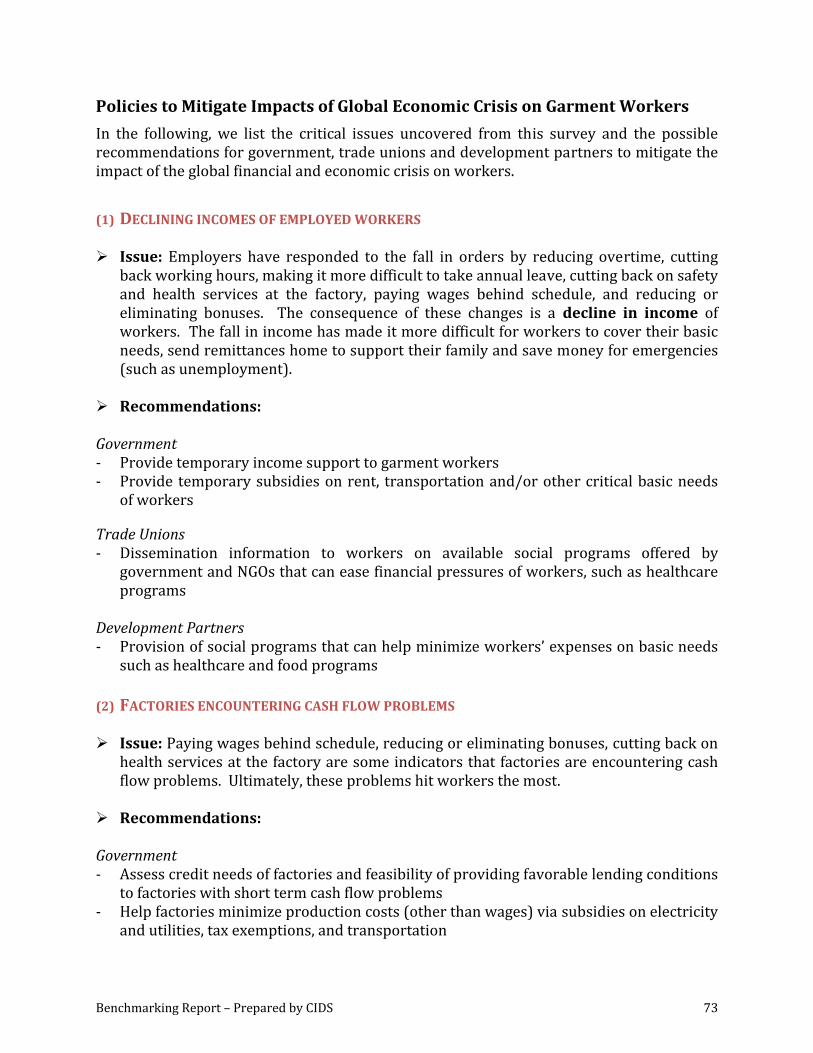
Benchmarking Report – Prepared by CIDS 73
Policies to Mitigate Impacts of Global Economic Crisis on Garment Workers
In the following, we list the critical issues uncovered from this survey and the possible recommendations for government, trade unions and development partners to mitigate the impact of the global financial and economic crisis on workers.
(1) DECLINING INCOMES OF EMPLOYED WORKERS
Issue: Employers have responded to the fall in orders by reducing overtime, cutting back working hours, making it more difficult to take annual leave, cutting back on safety and health services at the factory, paying wages behind schedule, and reducing or eliminating bonuses. The consequence of these changes is a decline in income of workers. The fall in income has made it more difficult for workers to cover their basic needs, send remittances home to support their family and save money for emergencies (such as unemployment).
Recommendations:
Government ‐ Provide temporary income support to garment workers ‐ Provide temporary subsidies on rent, transportation and/or other critical basic needs
of workers Trade Unions ‐ Dissemination information to workers on available social programs offered by
government and NGOs that can ease financial pressures of workers, such as healthcare programs
Development Partners ‐ Provision of social programs that can help minimize workers’ expenses on basic needs
such as healthcare and food programs
(2) FACTORIES ENCOUNTERING CASH FLOW PROBLEMS
Issue: Paying wages behind schedule, reducing or eliminating bonuses, cutting back on health services at the factory are some indicators that factories are encountering cash flow problems. Ultimately, these problems hit workers the most.
Recommendations: Government ‐ Assess credit needs of factories and feasibility of providing favorable lending conditions
to factories with short term cash flow problems ‐ Help factories minimize production costs (other than wages) via subsidies on electricity
and utilities, tax exemptions, and transportation
Benchmarking Report – Prepared by CIDS 74
‐ As a strategy to reduce the industry’s vulnerability to economic shocks in the future, it is necessary to have concerted efforts and policies to increase the competitive advantage of the garment industry through skills improvement (re‐training programs), productivity enhancement, and market diversification. One possibility is to establish a fund to help employers address the needed structural adjustments of the textile and clothing industry.
Development Partners ‐ Projects to increase the competitive advantage of the garment industry through skills
improvement (re‐training programs), productivity enhancement, and market diversification to reduce the industry’s vulnerability to economic shocks in the future
(3) LOW COMPLIANCE TO LEGAL TERMINATION PROCESS
Issue: Only 34% of unemployed workers legally entitled to compensation payment received it, and only 20% received advance notice of their termination. From this study, it is unclear whether this low level of compliance is a matter of factories’ lack of awareness of the legal obligations for mass layoffs, or their unwillingness to comply with the law.
Recommendations:
Government ‐ Awareness building for both employers and employees on legal requirements related to
mass layoff, compensation pay, advance notice, etc, so they are aware of rights and responsibilities.
‐ Monitor the compliance of factories ‐ Require factories to set up a precautionary fund specifically for lay‐off compensation
pay. Government should closely monitor these funds and all information should be made public to give workers a sense of security.
‐ Set up an “early warning system” to monitor potential factory closure. For example, require factories to disclose their financial situation regularly with financial statements, volume of orders, etc.
Trade Unions ‐ Monitor the situation at their factories for potential lay‐offs or closure, opportunities to
dialogue with management, and availability of funds for lay‐off compensation. ‐ Engage in consultations with management when faced with lay‐offs. ‐ Inform workers on their rights such as advance notice and lay‐off compensation pay Development Partners
Help ensure that unions are aware of their rights and responsibilities in the context of mass lay‐offs, terminations and closures.
Help to ensure that factories are aware of their legal obligations, especially on consultation requirements, lay‐off compensation, and advance notice.
Benchmarking Report – Prepared by CIDS 75
Enhance the capacity of unions to engage with employers in a meaningful way when they are confronted with lay‐offs.
Enhance the capacity of unions to monitor potential layoffs and factory closures BFC to continue monitoring working conditions at factories and when possible, refer workers and trade union leaders to available sources of assistance when they are faced with lay‐offs or factory closure
(4) WORKERS EMPLOYED AT NONEXPORTING FACTORIES LESS LIKELY TO GET ENTITLEMENTS
Issue: Workers employed at non‐exporting factories are less likely to receive compensation pay and advance notice. In addition, fewer workers at non‐exporting factories are members of a trade union – 45% compared to 63% of workers employed at exporting factories – meaning that they have no representative to negotiate or bargain with employers. One important finding from this survey is that members of trade unions are more likely to get their entitlements than non‐members.
Recommendations:
Government ‐ Monitor the working conditions, economic situation, and legal compliance in non‐
exporting garment factories. Trade Unions ‐ Work with government and development partners to monitor the situation in non‐
exporting factories through existing trade union networks Development Partners ‐ BFC to expand monitoring efforts in non‐exporting factories
(5) LACK OF MONEY TO FINANCE JOBSEEKING PERIOD FORCING SOME WORKERS TO TAKE JOBS
WITH LOWER INCOMES AND LESS FAVORABLE WORKING CONDITIONS
Issue: Given the limited social safety net programs in Cambodia, workers faced with unemployment have extreme difficulties to finance their basic living costs during the job‐seeking period. As this survey reveals, the majority of workers have no savings and few received compensation payment from their employers. Their limited financial resources do not allow for a prolonged job search and therefore, limit their job choices. The financial and time pressures have forced some workers to take jobs with lower incomes and less favorable working conditions. This benchmarking survey finds that 63% of workers who have found a new job in a different sector are earning less income at their new job, while some of the workers who have been rehired in the garment sector are encountering lower income due to fewer working hours and less favorable employment conditions (from a regular worker to casual worker).
Benchmarking Report – Prepared by CIDS 76
Recommendations:
Government ‐ Credit for unemployed workers to cover job‐seeking period ‐ Establish social safety nets such as an Unemployment Fund or Insurance Trade Unions ‐ Credit for members to cover job‐seeking period (6) LOW PROSPECTS OF FINDING AND GETTING A NEW JOB
Issue: The success rate of getting job in garment factory is 30%; for jobs in different sectors it is 20%. This could explain why the first reaction of retrenched workers is to look for new jobs in the garment sector. While the chances of getting a job in the garment sector are higher than in other sectors, the survey finds that the jobs tend to be short term. Unemployed workers who were laid‐off twice in 2009, worked at their new job for only 4 months before getting laid off again. Another important finding from this survey is that most retrenched workers look for a new job on their own, which highlights the lack of employment services in Cambodia and low public awareness of the services currently available.
Recommendations: Government ‐ Develop services of the National Employment Agency (NEA) and increase public
awareness of its services. The NEA was approved by the National Training Board in January of 2008, with the objective to serve as a one‐stop shop to match workers seeking jobs with employers seeking new staff. It provides information on labor market policies, training providers, etc. The NTB plans to set up 9 centers, which will share information across the country and for the first time, give access to the national labor market for everyone. The database can be accessed online at the JobShop Portal, which is currently under construction.
‐ Assess the current status and performance of the NEA, outreach, info dissemination channels, areas of improvement and address them.
‐ Establish a national scheme of active labour market policies, e.g. effective public employment services and labor market info systems, organize job fairs
‐ Establish a National Employment Fund to undertake emergency job creation through public works programs, which can also include development of social infrastructure such as community centres, schools
Benchmarking Report – Prepared by CIDS 77
Trade Unions ‐ Increase the capacity of trade unions to provide employment services such as
disseminating employment information to unemployed workers. According to the survey findings, many workers currently turn to their trade union for assistance when they are terminated. However, the primary action taken by trade unions to help laid off workers is to organize strikes. It is possible to increase the efficiency of this existing network by increasing the capacity of trade unions to provide other services. Possibly, local level unions could feed information up to their federations regarding job opportunities, and the federations could feed that information back down to the local unions when there are lay‐offs in their factories.
Development Partners ‐ Assess the current status and performance of the NEA, identify areas of improvement
and work with government to address them. ‐ Assess the types of assistance sought and received by workers, identify areas for
improvement, and work with government and TU to address them. ‐ Work with trade unions to enhance their capacity to provide assistance to workers who
approach them for help. For example, train local unions to gather employment information within their factories and feed it up to the federation level, and work with the federation level unions to enhance their capacity to feed information back down to the local unions.
(7) RETRAINING TO GAIN NEW OR IMPROVED SKILLS
Issue: A majority of unemployed workers stated that they would consider re‐training both for the garment sector and other occupations. For females, most are interested in getting new skills in designing clothes and beauty services (cosmetics and hair styling), while the majority of males are interested in learning how to repair air conditioners, mobile phones, and motorcycles. Most respondents stated that in order for them to attend such courses, though, they would need an allowance for accommodation or transportation to ease the financial pressure at home. On average, workers prefer the idea of a short course of three months or less. Workers also requested training programs to have flexible time schedules so they can work part‐time. Some workers aspire to open their own business after gaining the new skill, and thus, propose that the training programs be linked with credit opportunities. However, the determining factor to enroll in training for most workers is the chance of getting a job afterwards. Where this is considered high, the demand for enrolment will also be high.
Benchmarking Report – Prepared by CIDS 78
Recommendations:
Government ‐ Review and improve skills development and training policies and systems in the
country ‐ Increase public awareness on available training programs ‐ Organize industry specific skills development training of those who need some
additional/new training in collaboration with employers ‐ Provide credit for small business start up with favorable lending conditions Trade Unions ‐ Disseminate information on training programs to workers ‐ Disseminate information on credit opportunities to workers Development Partners ‐ Organize industry specific skills development training of those who need some
additional/new training in collaboration with employers ‐ Support re‐training programs to make sure workers have skills to take on jobs in other
sectors. ‐ Increase public awareness on training programs ‐ Provide training on developing small businesses for unemployed and underemployed
workers who are interested in it ‐ Facilitate access to credit
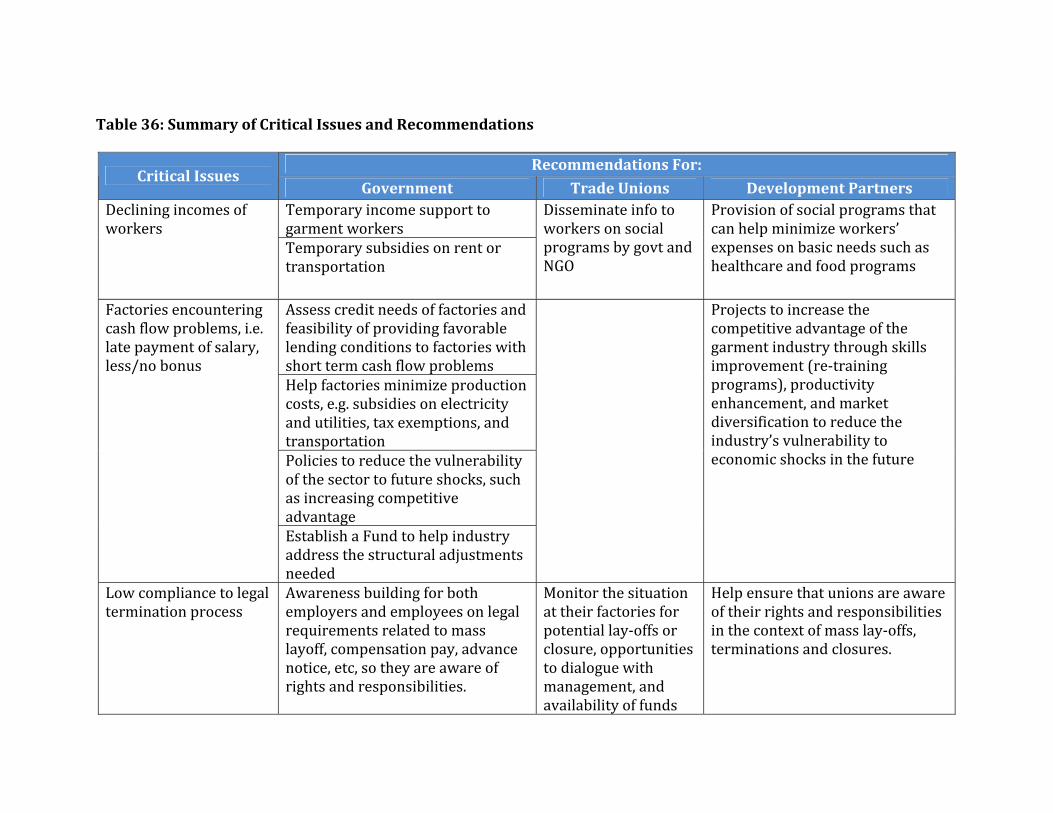
Table 36: Summary of Critical Issues and Recommendations
Recommendations For: Critical Issues
Government Trade Unions Development Partners Temporary income support to garment workers
Declining incomes of workers
Temporary subsidies on rent or transportation
Disseminate info to workers on social programs by govt and NGO
Provision of social programs that can help minimize workers’ expenses on basic needs such as healthcare and food programs
Assess credit needs of factories and feasibility of providing favorable lending conditions to factories with short term cash flow problems Help factories minimize production costs, e.g. subsidies on electricity and utilities, tax exemptions, and transportation Policies to reduce the vulnerability of the sector to future shocks, such as increasing competitive advantage
Factories encountering cash flow problems, i.e. late payment of salary, less/no bonus
Establish a Fund to help industry address the structural adjustments needed
Projects to increase the competitive advantage of the garment industry through skills improvement (re‐training programs), productivity enhancement, and market diversification to reduce the industry’s vulnerability to economic shocks in the future
Low compliance to legal termination process
Awareness building for both employers and employees on legal requirements related to mass layoff, compensation pay, advance notice, etc, so they are aware of rights and responsibilities.
Monitor the situation at their factories for potential lay‐offs or closure, opportunities to dialogue with management, and availability of funds
Help ensure that unions are aware of their rights and responsibilities in the context of mass lay‐offs, terminations and closures.

Benchmarking Report – Prepared by CIDS 80
Recommendations For: Critical Issues
Government Trade Unions Development Partners for lay‐off compensation.
Monitor the compliance of factories Engage in consultations with management when faced with lay‐offs.
Help to ensure that factories are aware of their legal obligations, especially on consultation requirements, lay‐off compensation, and advance notice.
Require factories to set up precautionary fund specifically for lay‐off compensation pay.
Inform workers on their rights such as advance notice and lay‐off compensation pay
Enhance the capacity of unions to engage with employers in a meaningful way when they are confronted with lay‐offs.
Set up “early warning system” to monitor potential factory closures, e.g. require factories to disclose their financial situation with financial statements regularly, volume of orders, etc
Enhance the capacity of unions to monitor potential mass layoffs and closures
BFC to continue monitoring working conditions at factories and when possible, refer workers and trade union leaders to available sources of assistance when they are faced with lay‐offs or factory closure
Workers employed at non‐exporting factories less likely to get entitlements
Monitor the working conditions, economic situation, and compliance in non‐exporting garment factories
Work with govt and DPs to monitor situation in non‐exporting factories
BFC to expand monitoring efforts to non‐exporting factories
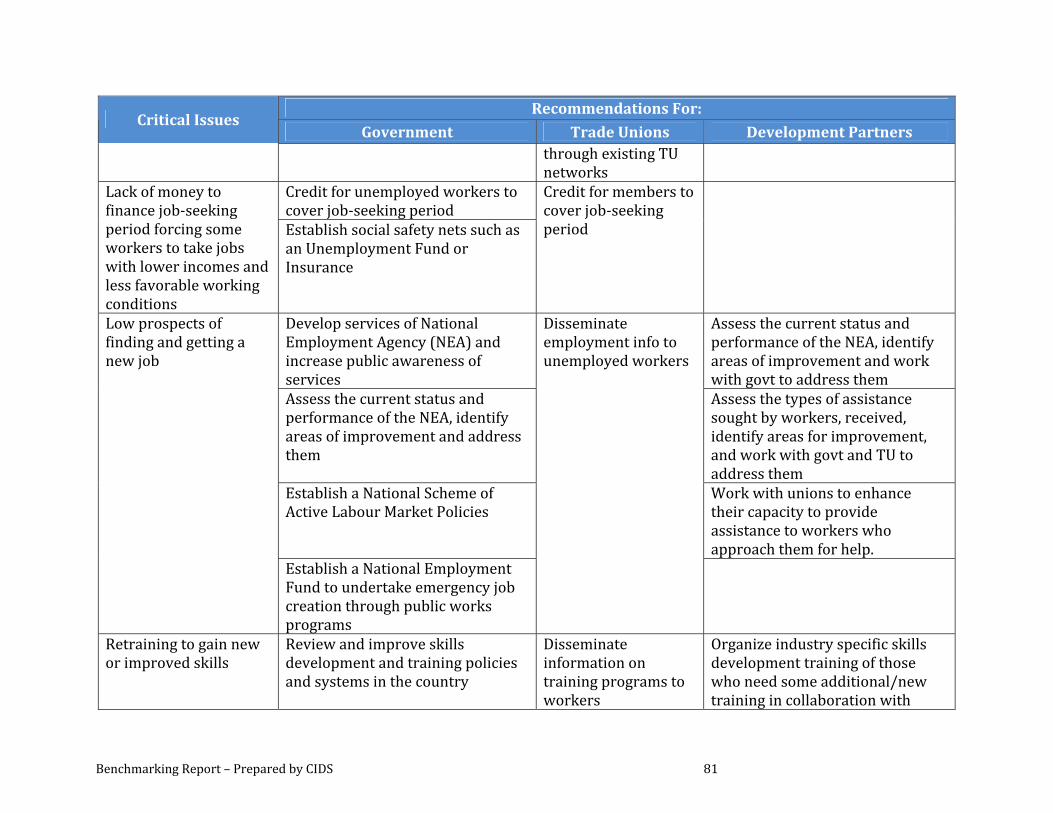
Benchmarking Report – Prepared by CIDS 81
Recommendations For: Critical Issues
Government Trade Unions Development Partners through existing TU
networks
Credit for unemployed workers to cover job‐seeking period
Lack of money to finance job‐seeking period forcing some workers to take jobs with lower incomes and less favorable working conditions
Establish social safety nets such as an Unemployment Fund or Insurance
Credit for members to cover job‐seeking period
Develop services of National Employment Agency (NEA) and increase public awareness of services
Assess the current status and performance of the NEA, identify areas of improvement and work with govt to address them
Assess the current status and performance of the NEA, identify areas of improvement and address them
Assess the types of assistance sought by workers, received, identify areas for improvement, and work with govt and TU to address them
Establish a National Scheme of Active Labour Market Policies
Work with unions to enhance their capacity to provide assistance to workers who approach them for help.
Low prospects of finding and getting a new job
Establish a National Employment Fund to undertake emergency job creation through public works programs
Disseminate employment info to unemployed workers
Retraining to gain new or improved skills
Review and improve skills development and training policies and systems in the country
Disseminate information on training programs to workers
Organize industry specific skills development training of those who need some additional/new training in collaboration with
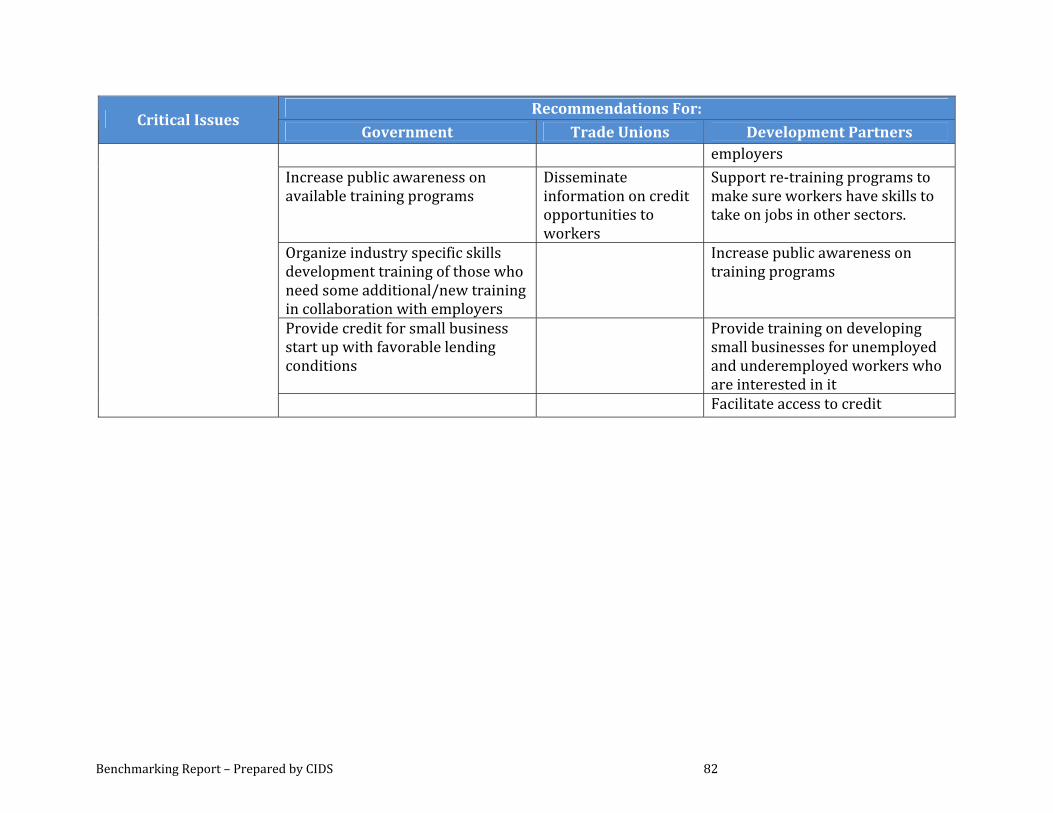
Benchmarking Report – Prepared by CIDS 82
Recommendations For: Critical Issues
Government Trade Unions Development Partners employers
Increase public awareness on available training programs
Disseminate information on credit opportunities to workers
Support re‐training programs to make sure workers have skills to take on jobs in other sectors.
Organize industry specific skills development training of those who need some additional/new training in collaboration with employers
Increase public awareness on training programs
Provide credit for small business start up with favorable lending conditions
Provide training on developing small businesses for unemployed and underemployed workers who are interested in it
Facilitate access to credit

Top Related