


Languages
Pages
Legal


Benchmarking Research
Project on Retail and Food
Services Sectors in Asia
(Republic of China, Japan, Malaysia, and Singapore)

First published in Japan
by Asian Productivity Organization
Leaf Square Hongo Building 2F
1-24-1 Hongo, Bunkyo-ku
Tokyo 113-0033, Japan
www.apo-tokyo.org
© 2014 Asian Productivity Organization
The views expressed in this publication do not necessarily reflect the official views of the Asian Productivity
Organization (APO) or any APO member.
All rights reserved. None of the contents of this publication may be used, reproduced, stored, or transferred in
any form or by any means for commercial purposes without prior written permission from the APO.
Abstract
This first APO Benchmarking Research Project, with a focus on the retail and food services
sectors, has paved the way for a comprehensive research on SMEs in Asia – to learn and
share best practices in the various business sectors and to enhance the competition and
productivity of Asian SMEs.
A tremendous amount of time and effort has been invested in order to collectively design,
develop and implement a structured benchmarking framework for conducting this research
project, as well as for follow-up studies in the various sectors of interest.
National experts from the Republic of China, Japan, Malaysia and Singapore, together with
the Chief Expert of the APO Benchmarking Research Project Team, have followed the
research process according to a rigorous 7-step benchmarking methodology that uses a
comprehensive performance metric table and a set of survey questionnaires, uniquely
developed for both the retail and food services sectors.
Respondents from small and medium enterprises (SMEs) have been extensively surveyed and
findings and conclusions drawn from their data as they relate specifically to the fields of
finance, customers, operations and human resources. Best practices have been observed and
recommended for future implementation by SMEs looking to improve/transform their
business models.
Using the insights and experiences gleaned from this first Benchmarking Research Project,
the hope is that follow-on project teams will be able to leverage the key learning points and
developmental work for use in their particular field. SMEs in the retail and food services
sectors could also consider the adoption and implementation of the recommendations
highlighted to enhance the business performance and growth of their companies in the years
ahead.

Benchmarking Research Project on Retail and Food Services Sectors in Asia
Asian Productivity Organization 1
INTRODUCTION 3
1.1 Background 3
1.2 Objectives 5
1.3 Scope 5
1.4 Methodology 5
1.5 Overview of Report 11
KEY FINDINGS OF RETAIL SECTOR IN REPUBLIC OF CHINA 12
2.1 Introduction and Overview of the Retail Sector in the Republic of China 12
2.2 Profiles of Participating Retail Companies (Republic of China) 18
2.3 Key Performances of Participating Retail Companies (Republic of China) 19
2.4 Financial Perspective Information of the Retail Companies 19
2.5 Customer Perspective Information of the Retail Companies 20
2.6 Operational Perspective Information of the Retail Companies 23
2.7 Human Resource Perspective Information of the Retail Companies 25
KEY FINDINGS OF RETAIL SECTOR IN JAPAN 29
3.1 Introduction and Overview of the Retail Sector in Japan 29
3.2 Profiles of Participating Retail Companies (Japan) 30
3.3 Key Performances of Participating Retail Companies (Japan) 31
KEY FINDINGS OF RETAIL SECTOR IN MALAYSIA 43
4.1 Introduction and Overview of the Retail Sector in Malaysia 43
4.2 Profiles of Participating Retail Companies (Malaysia) 43
4.3 Key Performances of Participating Retail Companies (Malaysia) 45
KEY FINDINGS OF RETAIL SECTOR IN SINGAPORE 46
5.1 Introduction and Overview of the Retail Sector in Singapore 46
5.2 Profiles of Participating Retail Companies (Singapore) 46
5.3 Key Performances of Participating Retail Companies 46
KEY FINDINGS OF FOOD SERVICES SECTOR IN REPUBLIC OF CHINA 49

Benchmarking Research Project on Retail and Food Services Sectors in Asia
Asian Productivity Organization 2
6.1 Introduction and Overview of the Food Services Sector in Republic of China 49
6.2 Profiles of Participating Food Services Companies (Republic of China) 58
6.3 Key Performances of Participating Food Services Companies (Republic of China) 59
KEY FINDINGS OF FOOD SERVICES SECTOR IN JAPAN 68
7.1 Introduction and Overview of the Food Services Sector in Japan 68
7.2 Profiles of Participating Food Services Companies (Japan) 69
7.3 Key Performances of the Participating Retail Companies (Japan) 70
KEY FINDINGS OF FOOD SERVICES SECTOR IN MALAYSIA 81
8.1 Introduction and Overview of the Food Services Sector in Malaysia 81
8.2 Profiles of Participating Food Services Companies (Malaysia) 81
8.3 Key Performances of the participating Food Services Companies (Malaysia) 82
KEY FINDINGS OF FOOD SERVICES SECTOR IN SINGAPORE 84
9.1 Introduction and Overview of the Food Services Sector in Singapore 84
9.2 Profiles of Participating Food Services Companies (Singapore) 84
9.3 Key Performances of Participating Food Services Companies (Singapore) 85
BEST PRACTICES 87
RECOMMENDATIONS 92
CONCLUSION 95

Benchmarking Research Project on Retail and Food Services Sectors in Asia
Asian Productivity Organization 3
Introduction
1.1 Background
The SMEs in the service sector continue to play an increasingly important role in Asian
economies in terms of their contributions to gross domestic product and employment; they
remain the core engines for productivity and economic growth. The APO recognizes the
importance of monitoring the progress of SME performance in the service sector and
facilitating the sharing of best practices among SMEs within the APO member economies.
For the purposes of this study, benchmarking is understood as a continuous process of self-
assessment and initiation of actions to close gaps, surpass the best performers, and retain a
competitive edge. To pursue continuous improvement, it is essential that SMEs not only
share useful reference data and information – to allow comparison of performance – but also
learn from the achievements and results obtained from the benchmarking exercise.
In July 2012, a study meeting was held in Singapore to discuss the mechanics of making
cross-country comparisons of productivity performance of SMEs, in the retail and food
services sectors. The meeting identified a set of comparable, cross-country indicators for
SME business performance assessment. Based on this set of indicators and the methodology
agreed in the study meeting, research was commissioned to collect data, information and best
practices by a team of national experts under the direction and guidance of the chief expert.
In October 2012, The Benchmarking Research Project on Retail and Food Services began in
earnest.

Benchmarking Research Project on Retail and Food Services Sectors in Asia
Asian Productivity Organization 4
Figure 1: Study meeting in Singapore (July 2012)
The research team comprised of national experts from four countries – Dr. Eugene Lin from
the China Productivity Centre (Republic of China); Ms. Kaori Yoshida from Ensemble, Ltd
(Japan); Mr. Mohamad Sahril from Malaysia Productivity Corporation (Malaysia); Ms. Loo
Ya Lee from SPRING Singapore (Singapore) – who worked alongside the Chief Expert, Mr.
George Wong, from Hoclink Systems & Services Pte Ltd (Singapore).
Figure 2: Members of the research team
The project was expertly managed and coordinated by Ms. Yasuko Asano, Programme

Benchmarking Research Project on Retail and Food Services Sectors in Asia
Asian Productivity Organization 5
Officer, Research and Planning Department, Asian Productivity Organisation (APO).
1.2 Objectives
The two stated objectives of The Benchmarking Research Project are as follows:
I. To collect data and information as per the questionnaire(s) and as articulated during the
study meeting – for cross-country assessment of productivity performance of SMEs in the
retail and food and services.
II. To compile the data and information in order to generate a targeted research report, and to
provide best practice cases.
1.3 Scope
The scope of this research project includes:
I. Benchmarking key business performance indicators for monitoring productivity for the
retail and food service subsector.
II. Data collection for the questionnaire(s), information and best practice suggestions for
comparative analyses of productivity performance of SMEs in retail and food services. This
information will be used for benchmarking assessment.
1.4 Methodology
After establishing the general survey approach, the research project adopted a 7-phase
methodology:
Phase 1: Planning and Preparation
A coordination study meeting was organized (22–24 July 2012) in Singapore to bring the
various experts from the participating countries together to plan the research project. Ms.

Benchmarking Research Project on Retail and Food Services Sectors in Asia
Asian Productivity Organization 6
Yasuko Asano (APO Programme Officer, Research and Planning Department) and Mr.
George Wong (Chief Expert) facilitated the study meeting.
At the start of the study meeting, the research team members were introduced to the
approach, concept and methodology to be adopted for this project. A project milestone was
developed for the Benchmarking Research Project and endorsed by the project team during
the planning phase.
Thereafter, the research team adopted a 7-step benchmarking framework as shown in the
figure below:
Figure 3: The 7-Step Benchmarking Framework
The above 7-step benchmarking framework enables the SMEs in both the retail and food
services sectors first to share their organization performances and best practices, followed by
action planning and implementation, in order to achieve greater competitiveness and business
growth for their companies.
Benchmarking Research Project on Retail and Food Services Sectors in Asia
Asian Productivity Organization 7
Prior to action planning and implementation for improvement, the framework’s first five
steps allow the SMEs to review any existing key processes needing improvement, review
their existing performance measures and results, share and learn from the other participating
SMEs and determine their relative results status and best practices. During these five steps,
there will be useful discoveries and insights that will enable them to proceed forward and
perform action planning and implementation that will encourage superior performances in the
years ahead.
As such, the 7-step benchmarking framework provides a systematic, continuous process for
the SMEs to adapt learnings and insights from best business performers for continuous and
breakthrough improvements in their companies.
Phase 2: Formulation of Performance Metrics (Key Performance Indicators) for the Retail
and Food Services Sectors
To facilitate a common basis for comparison and benchmarking of the data among the
participating countries, the Table of Performance Metrics was formulated and agreed. After
much discussion, it was agreed that a comprehensive scorecard of performance metrics would
be useful for nurturing and developing the enterprises in a holistic manner.
Performance metrics were formulated for both the retail and food services sectors and they
were organized according to four perspectives; financial, customers, operational and people.
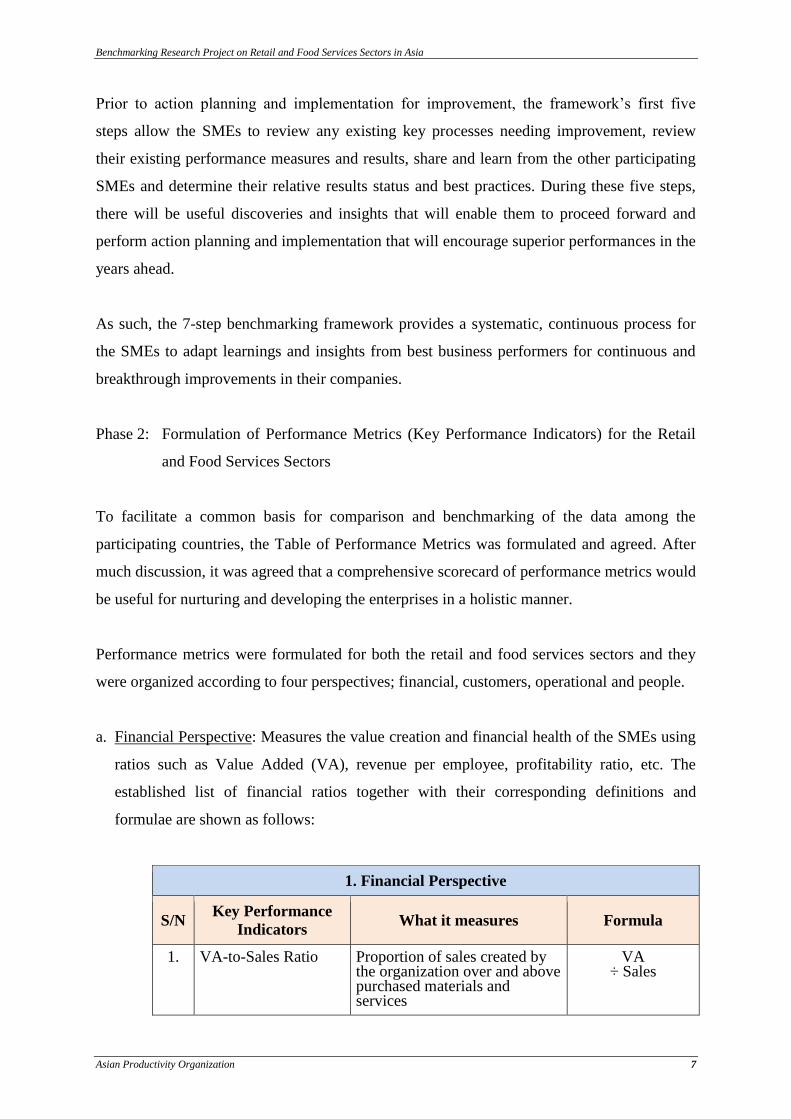
a. Financial Perspective: Measures the value creation and financial health of the SMEs using
ratios such as Value Added (VA), revenue per employee, profitability ratio, etc. The
established list of financial ratios together with their corresponding definitions and
formulae are shown as follows:
1. Financial Perspective
S/N Key Performance
Indicators What it measures Formula
1. VA-to-Sales Ratio Proportion of sales created by the organization over and above purchased materials and services
VA ÷ Sales

Benchmarking Research Project on Retail and Food Services Sectors in Asia
Asian Productivity Organization 8
2. Labor Cost Competitiveness
Efficiency and effectiveness of the organization in term of its labor cost
VA ÷ Labor Cost
3. Working Capital Ratio
Operating liquidity and short-term financial health
Current Asset – Current Liability
4. Profit Margin Proportion of sales left to the organization after deducting all costs
EBITDA ÷ Sales
b. Customer Perspective: Measures the service performance and customer satisfaction in
each of the customer segments such as customer satisfaction and customer loyalty. The
established list of customer perspective ratios together with their corresponding definitions
and formulae are shown as follows:
2. Customer Perspective
S/N Key Performance
Indicators What it measures Formula
5. Customer Satisfaction Index (CSI)
The degree that products and services supplied by a company meet or surpass customer requirements and expectations
Rating Score by Customer ÷
Maximum Rating Score Possible
6. Compliments to Complaint Ratio
The customer service level that will enhance customer retention and customer loyalty
Compliments/ Complaints Ratio
7. Number of customers per staff
Effectiveness and efficiency of marketing strategy
Number of Customers
÷ Staff
8. Sales per Staff (FTE) Efficiency and effectiveness of marketing strategy
Sales ÷ Number of Staff (FTE)
9. Customer Conversion Rate
The total number of customers acquired to the total number of prospects
Number of Sales Transactions ÷
Number of People who entered the
Store
10. Sales per Customer Which product or service line produces the most sales per customer and therefore which customer relationships are the most important
Sales ÷ Number of Customers (using sales transactions
as a proxy)
c. Operational Perspective: Measures the effectiveness and efficiency (productivity level and
growth) of key processes such as service delivery responses, utilization of facilities and
assets, etc. The established list of operational ratios together with their corresponding

Benchmarking Research Project on Retail and Food Services Sectors in Asia
Asian Productivity Organization 9
definitions and formulae are shown as follows:
3. Operational Perspective
S/N Key Performance
Indicators What it measures Formula
11. Tables Utilization Efficiency and effectiveness of fixed assets in the generation of sales
Table Turns ÷ Operating hours
12. Sales per Seat Efficiency and effectiveness of fixed assets in the generation of sales
Sales ÷ Number of Seats
13. Labor Productivity Efficiency and effectiveness of employees in the generation of value added
VA ÷ Number of Staff
14. Annual Inventory Turns (number of turns per year)
Effectiveness in inventory management of the materials used e.g. efficient buying practices, inventory cost and quality (obsolescence level)
Cost of goods sold ÷ Average Inventory
15. Labor Cost to Sales Ratio (%)
Efficiency and effectiveness of the operational strategy and management of staff
Labor Cost ÷ Sales
16. Sales per Floor Areas (Sq. Ft.) used
Efficiency and effectiveness of floor areas used in the generation of sales
Sales ÷ Floor Areas (Sq. Ft.)
17. Sales per Fixed Assets (dollar of capital)
Efficiency and effectiveness of fixed assets in the generation of sales
Sales ÷ Fixed Assets
d. People Perspective: Measures the competency and morale of staff to support the business
operations such as training hours per employees and employee satisfaction index. The
established list of financial ratios together with their corresponding definitions and
formulae are shown as follows:
4. Human Resource Perspective
S/N Key Performance
Indicators What it measures Formula
18. Training hours per staff
Learning and development emphases of the organization to enhance competencies of staff
Training Hours ÷ Number of Staff
19. Training Expenditures per staff
Learning and development emphases of the organization to enhance competencies of staff
Training Cost ÷ Staff

Benchmarking Research Project on Retail and Food Services Sectors in Asia
Asian Productivity Organization 10
20. Staff Turnover Rate The retention rate of staff and the overall staff satisfaction level
Number of staff resigned ÷ Total number of staff
21. Absenteeism Rate The engagement and morale of staff
Number of Absenteeism ÷
Total number of Staff
In order to ensure uniform interpretation and understanding of the various performance
metrics, definitions and formulae were established for each of them. As the retail and food
services sectors differ slightly in their key operations, some of the operational indicators had
to be different.
The Table of Performance Metrics (Key Performance Indicators) for both the retail and food
services sectors can be found in Appendix A.
Phase 3: Development of Questionnaires and Explanatory Notes
After the Table of Performance Metrics had been developed, a comprehensive set of
questionnaires was developed for the data collection/survey exercises based on the following
four types of questioning techniques:
Open-ended questions
Multiple-choice questions
Scaled-choice questions
Forced-choice questions
The set of questionnaire templates for both the retail and food services sectors can be found at
the Appendix B (retail sector) and Appendix C (food services sector).
Phase 4: Data Collection
To facilitate the ease of data collection, guidelines were established for the national experts
from the participating countries to execute their respective data collection process.
Thereafter, it was incumbent on these national experts to execute the data collection process
Benchmarking Research Project on Retail and Food Services Sectors in Asia
Asian Productivity Organization 11
in their identified organizations for benchmarking purposes. The targeted participating
companies were briefed on the approach and objectives of the benchmarking study:
Familiarization briefings and workshops for the companies
Data collection according to the key performance indicators template and the
questionnaires
Data computation and validation
Phase 5: Analysis of the Findings
Upon completion of the survey and questionnaire exercises, the national experts compiled
and validated the data that they were able to collect from the participating companies in the
sub-sectors of each of the retail and food services sectors.
Data was analyzed as far as possible according to the respective sub-sectors.
Phase 6: Compilation of Best Practices identified
To facilitate follow-on-improvement implementation by the companies, numerous best
practices from the retail and food services sectors were identified and documented.
Phase 7: Final Report compilation
Upon the receipt of the data and information received from each of the participating
countries, the respective findings were reviewed, compared and analyzed to draw out the key
recommendations and best practices for this Benchmarking Research Project on cross-
country assessment of productivity performance of SMEs in the retail and food services
sectors.
1.5 Overview of Report
The report comprises four main parts: Part I (Introduction), Part II (Key Findings of Retail
Sector), Part III (Key Findings of Food Services Sector), and Part IV (Conclusion).
Benchmarking Research Project on Retail and Food Services Sectors in Asia
Asian Productivity Organization 12
Key Findings of Retail Sector in Republic of China
2.1 Introduction and Overview of the Retail Sector in the Republic of China
I. Definition and Scope of Retail Sale in Non-Specialized Stores
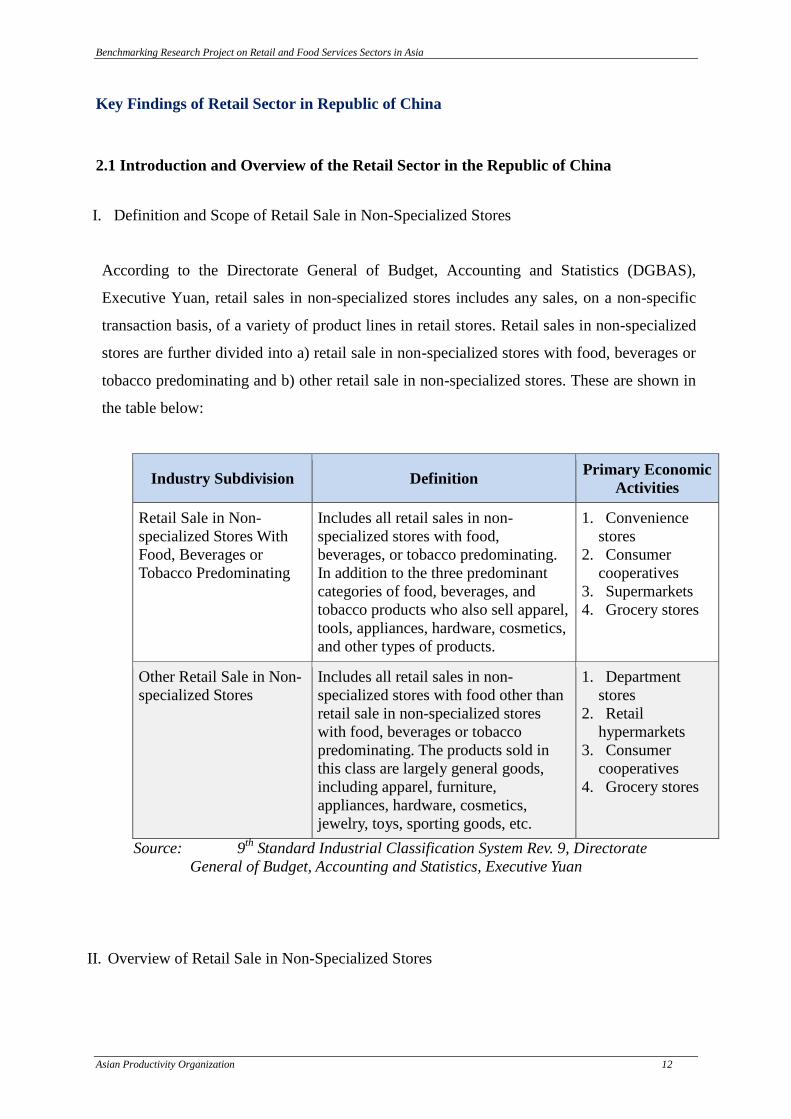
According to the Directorate General of Budget, Accounting and Statistics (DGBAS),
Executive Yuan, retail sales in non-specialized stores includes any sales, on a non-specific
transaction basis, of a variety of product lines in retail stores. Retail sales in non-specialized
stores are further divided into a) retail sale in non-specialized stores with food, beverages or
tobacco predominating and b) other retail sale in non-specialized stores. These are shown in
the table below:
Industry Subdivision Definition Primary Economic
Activities
Retail Sale in Non-
specialized Stores With
Food, Beverages or
Tobacco Predominating
Includes all retail sales in non-
specialized stores with food,
beverages, or tobacco predominating.
In addition to the three predominant
categories of food, beverages, and
tobacco products who also sell apparel,
tools, appliances, hardware, cosmetics,
and other types of products.
1. Convenience
stores
2. Consumer
cooperatives
3. Supermarkets
4. Grocery stores
Other Retail Sale in Non-
specialized Stores
Includes all retail sales in non-
specialized stores with food other than
retail sale in non-specialized stores
with food, beverages or tobacco
predominating. The products sold in
this class are largely general goods,
including apparel, furniture,
appliances, hardware, cosmetics,
jewelry, toys, sporting goods, etc.
1. Department
stores
2. Retail
hypermarkets
3. Consumer
cooperatives
4. Grocery stores
Source: 9th
Standard Industrial Classification System Rev. 9, Directorate
General of Budget, Accounting and Statistics, Executive Yuan
II. Overview of Retail Sale in Non-Specialized Stores

Benchmarking Research Project on Retail and Food Services Sectors in Asia
Asian Productivity Organization 13
With the ROC’s consumers increasingly putting value on quality of life, a number of
consumer industries have flourished. In addition to a variety of international clothing brands
setting up stores in the ROC, and various food industry businesses opening in new locations,
the development of department stores in the ROC is noteworthy. The ROC’s early
department stores primarily operated on a model of cosmetics, apparel, and household
appliance sales combined with a food court. With the constant changes of the marketplace,
department stores are now emphasizing their uniqueness and more fashionable integrated
designs. Based on the idea that a flow of visitors (potential customers) means a flow of cash
(purchases), many department stores are now closely linked to transportation/transfer stations
to attract more customers. In order to make themselves stand out, department stores have also
introduced well-known international brands give them advantage. Due to aggressive market
competition, each department store must continually advance new ideas and seek out unique
features in order to set itself apart from the others.
With the ROC’s supermarkets and convenience store chains continuing to expand into new
locations, there is a high degree of overlap in businesses’ trade areas. Competition is
increasingly intense, making it necessary for businesses to bring out their distinctive features
in order to win customer loyalty. In addition, the difference in product types between
channels is becoming increasingly narrow. Supermarket operators are introducing fresh-
brewed coffee and expanding their hot foods sections, while convenience stores are
expanding in size and adding more perishable items. All these development and changing
trends clearly indicate that competition between retail channels is intensifying and becoming
more aggressive.
To understand the situation faced by the industry, an analysis of the status of the development
of retail sale in non-specialized stores in the areas of revenue, business units and employment
were discussed:
a. Revenue
The Ministry of Economic Affairs’ (MOEA) Wholesale, Retail, and Food Services Business
Activities Statistics Survey indicates that the growth in sales of chain convenience stores was
near zero in 2009, while growth in annual revenue was 8.63% in 2010 relative to 2009.

Benchmarking Research Project on Retail and Food Services Sectors in Asia
Asian Productivity Organization 14
Revenue for department stores in 2010 was valued at NT$251.093 billion, representing
growth of 5.08% over 2009, ranking second in terms of growth. Revenue for retail
hypermarkets saw major growth of 4.06% over 2009. The rate of revenue growth for
supermarkets in 2010 was somewhat lower than for the other three types of operations, at
0.8%.
Looking at the rate of growth in revenue for each type of operation, one can see that the
growth rate in department store sales has been highly volatile. With the change in the
economic outlook in 2008, revenue growth slid to -1.07%, while the recovery of consumption
in 2009 led growth to jump to 3.18%. By 2010, the revenue growth rate was second only to
that of chain convenience stores, ranking department stores second in retail sales in non-
specialized stores.
As for the other types of operations, due to rapid expansion in the number of locations and
the launching of a variety of sales promotions as well as decreased price sensitivity among
consumers, the revenue of chain convenience stores grew by 8.66% in 2010, ranking them
first in retail sales in non-specialized stores. The trends of revenue growth among
supermarkets and retail hypermarkets were essentially the same, with growth slipping in
2009, and experiencing weaker recovery in 2010 relative to the other types of operations.
Table 1: Overview of Industry Revenue for Retail Non-specialized Stores
2008 2009 2010 2011
Retail Sale in
Non-
specialized
Stores
Total Value
(New Taiwan Dollars,
Millions)
836,838 856,025 916,802 978,645
Average Growth Rate (%)
2.35 2.29 7.10 6.75
Department
Stores
Total Value
(New Taiwan Dollars,
Millions)
224,784 231,924 251,093 270,186
Growth Rate (%) -1.07 3.18 8.26 7.60
Supermarkets
Total Value
(New Taiwan Dollars,
Millions)
121,201 126,665 133,393 143,087
Benchmarking Research Project on Retail and Food Services Sectors in Asia
Asian Productivity Organization 15
2008 2009 2010 2011
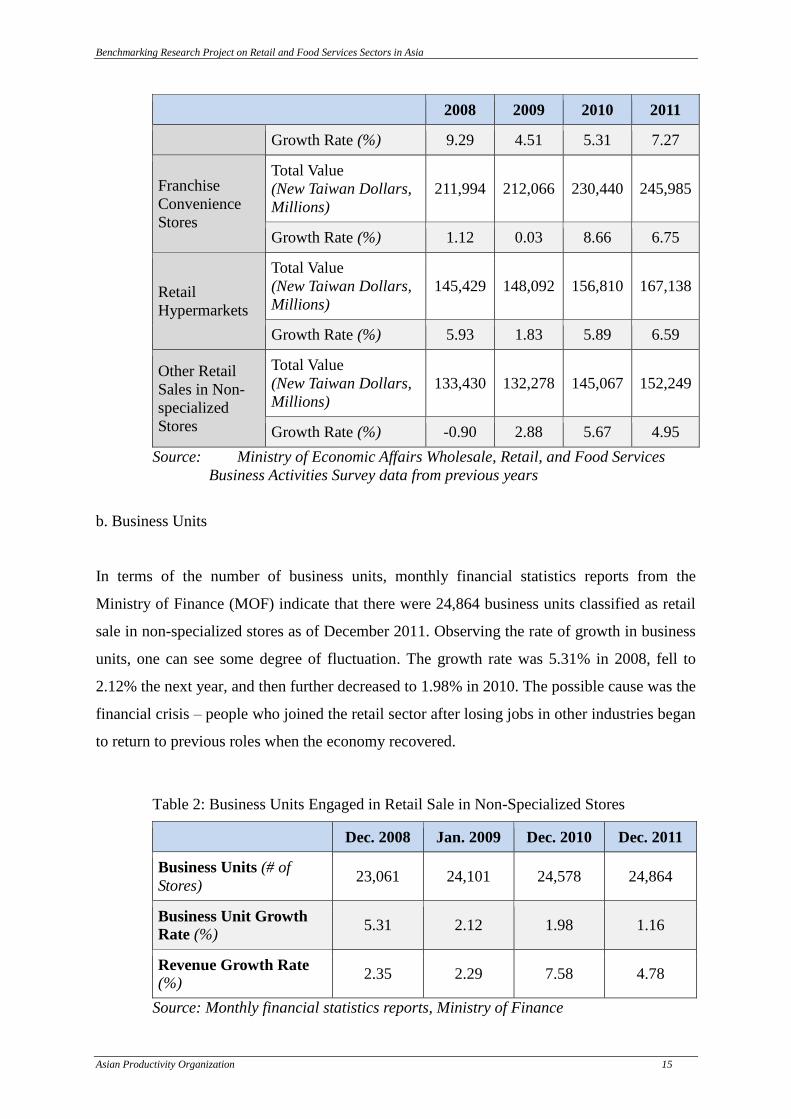
Growth Rate (%) 9.29 4.51 5.31 7.27
Franchise
Convenience
Stores
Total Value
(New Taiwan Dollars,
Millions)
211,994 212,066 230,440 245,985
Growth Rate (%) 1.12 0.03 8.66 6.75
Retail
Hypermarkets
Total Value
(New Taiwan Dollars,
Millions)
145,429 148,092 156,810 167,138
Growth Rate (%) 5.93 1.83 5.89 6.59
Other Retail
Sales in Non-
specialized
Stores
Total Value
(New Taiwan Dollars,
Millions)
133,430 132,278 145,067 152,249
Growth Rate (%) -0.90 2.88 5.67 4.95
Source: Ministry of Economic Affairs Wholesale, Retail, and Food Services
Business Activities Survey data from previous years
b. b. Business Units
In terms of the number of business units, monthly financial statistics reports from the
Ministry of Finance (MOF) indicate that there were 24,864 business units classified as retail
sale in non-specialized stores as of December 2011. Observing the rate of growth in business
units, one can see some degree of fluctuation. The growth rate was 5.31% in 2008, fell to
2.12% the next year, and then further decreased to 1.98% in 2010. The possible cause was the
financial crisis – people who joined the retail sector after losing jobs in other industries began
to return to previous roles when the economy recovered.
Table 2: Business Units Engaged in Retail Sale in Non-Specialized Stores
Dec. 2008 Jan. 2009 Dec. 2010 Dec. 2011
Business Units (# of
Stores) 23,061 24,101 24,578 24,864
Business Unit Growth
Rate (%) 5.31 2.12 1.98 1.16
Revenue Growth Rate (%)
2.35 2.29 7.58 4.78
Source: Monthly financial statistics reports, Ministry of Finance

Benchmarking Research Project on Retail and Food Services Sectors in Asia
Asian Productivity Organization 16
c. Employment
137,721 people were employed in retail sales in non-specialized stores in 2011, of whom
73,988 were male and 63,733 were female. With the recovery of the economy in 2011, retail
businesses actively expanded and needed more people, thus resulting in a 2.37% growth in
the number of people employed in 2011.
By dividing the annual revenue figures by the number of people employed, the average
revenue generated per person employed can be computed. In 2011, each person employed
generated average revenue of NT$7.11 million. With the exception of 2008, when the
financial tsunami led to a decline from the preceding year, the average revenue generated per
person has grown steadily each year. In 2010, the rapid growth in revenues from retail sales
in non-specialized stores led the average revenue per person to increase to 8.44%.
Table 3: Number of People Employed in Retail Sales in Non-Specialized
2008 2009 2010 2011
People Employed (Male) 72,505 74,502 73,110 73,988
People Employed (Female) 63,687 61,825 61,423 63,733
People Employed (Total) 136,192 136,327 134,533 137,721
Growth in People Employed
(Total) (%) 1.86 0.10 -1.32 2.37
Growth in People Employed
(Male) (%) 0.90 2.75 -1.87 1.20
Growth in People Employed
(Female) (%) 2.97 -2.92 -0.65 3.76
Source: Price index time series data, Directorate General of Budget,
Accounting and Statistics, Executive Yuan
Table 4: Average Revenue per Person Employed in Retail Sales
2008 2009 2010 2011
Revenue (New Taiwan Dollars, Millions) 836,83
8
856,02
5
916,80
2
978,64
5
Business Units 23,061 24,101 24,578 24,647

Benchmarking Research Project on Retail and Food Services Sectors in Asia
Asian Productivity Organization 17
Persons Employed (Total) 136,19
2
136,32
7
134,53
3
137,72
1
Average Revenue per Business Unit 35.46 35.52 37.30 39.71
Average Revenue per Person Employed 6.14 6.28 6.81 7.11
Growth in Average Revenue per Business
Unit (%) -1.82 0.17 5.01 6.45
Growth in Average Revenue per Person
Employed (%) -1.93 2.28 8.44 4.41
Sources: Wholesale, Retail, and Food Services Business Activities Statistics Survey,
MOEA; monthly financial statistics reports, MOF; Salary and productivity
time series data, DGBAS.
The average revenue generated per business unit in 2011 was NT$39.71 million. The growth
rate has fluctuated significantly in recent years, decreasing substantially in 2008, followed by
minimal growth in 2009 and more substantial growth in 2010. By comparing the growth rates
in average revenue per business unit with the average revenue per person employed, it was
noted that the degree of fluctuation in the growth rate of average revenue per person
employed was greater than that of average revenue per business unit regardless of economic
conditions.
The average salary for employees in retail sales in non-specialized stores was NT$38,206,
with the average being $38,646 for males and $37,765 for females. Salary increases were
influenced by the recovery of economic conditions in 2010, which saw the average salaries
increasing at a rate of 3.10%.
Table 5: Average Salaries in Retail Sales in Non-Specialized Stores
2008 2009 2010 2011
Average Salary (Male) (New Taiwan
Dollars) 34,452 35,191 36,205 38,646
Average Salary (Female) (New Taiwan
Dollars) 34,281 34,726 35,914 37,765
Average Salary (Combined) (New
Taiwan Dollars) 34,373 34,975 36,060 38,206
Average Salary Growth Rate
(Combined) (%) 1.24 1.75 3.10 5.95

Benchmarking Research Project on Retail and Food Services Sectors in Asia
Asian Productivity Organization 18
2008 2009 2010 2011
Average Salary Growth Rate (Male)
(%) 0.49 2.15 2.88 6.74
Average Salary Growth Rate (Female)
(%) 2.14 1.30 3.42 5.51
Sources: Wholesale, Retail, and Food Services Business Activities Statistics Survey,
MOEA; monthly financial statistics reports, MOF; Salary and productivity
time series data, DGBAS.
2.2 Profiles of Participating Retail Companies (Republic of China)
Most of the respondents in this survey of the retail service sectors were from department
stores and chain convenience stores. 14 responses were received from department stores and
187 from chain convenience stores, giving a total of 201 responses. The background of these
retail companies are as follows:
I. Year Incorporated
All of the department store respondents have been established for at least 15 years, with the
longest, founded 45 years ago. For the convenience store respondents, all have been
established for over 14 years, with the longest being established 26 years ago.
II. Type of Businesses
The main types of business of the respondents were from the ‘Private Limited’ and ‘Public
Listed’.
III. Operation Hours
All of the department store respondents polled, opened their stores from 11am to 10:30pm
while most of the convenience stores were opened from 9am to 10pm, with some operating
24 hours a day.
IV. Number of Stores (Directly Managed and Franchised)
All of the department store respondents have at least one outlet, while all of the convenience
store respondents have over 40 branches.

Benchmarking Research Project on Retail and Food Services Sectors in Asia
Asian Productivity Organization 19
V. Business Types
The business type of the respondents in this survey was mainly ‘supermarkets, convenience
stores, hardware general goods stores’ as well as ‘department stores and shopping malls’.
2.3 Key Performances of Participating Retail Companies (Republic of China)
Data from the survey, conducted through questionnaires, was collected from the respondents
in the retail sector over three years and consolidated.
2.4 Financial Perspective Information of the Retail Companies
Data collected from the survey indicated that the three years, 2010–2012, saw a growth trend
in the gross sales revenues of department stores, supermarkets and convenience stores.
Enterprises in each industry have established footholds in particular area of trade, and this
critical mass has led to increasing sales revenues. Numerous favorable factors are cited:
growing niches in international districts; remodeling facilities and sales spaces; Economic
Cooperation Framework Agreement (ECFA) with China; rapid increase of mainland Chinese
visitors to Taiwan; recovery of the employment market; and many other factors, each leading
to the continued increase in the total output value of the industry.
Table 6: Average Figures of 14 Respondents from the Departmental Stores Subdivision
Unit: NT$100 million 2010 2011 2012
Annual Sales Revenues 424.75 455 500.5
Cost of Goods Sold (COGS) 84.95 100.1 110.11
Total Labor Costs 42.48 54.6 60.06
Fixed Assets at Net Book Value 42.48 50.05 55.06
Operating Profit/Loss after Tax 84.95 91 100.1
Interest Incurred from Loans and Hire Purchase 8.5 9.1 11
Depreciation from Buildings, Equipment and
Machinery, etc. 21.2 22.7 25

Benchmarking Research Project on Retail and Food Services Sectors in Asia
Asian Productivity Organization 20
Taxes (Income Tax, Property Tax, etc.) 63.7 68.25 75.08
Earnings Before Interest, Tax, Depreciation and
Amortization (EBITDA) 169.85 172.85 200.18
Current Asset 284.5 304.85 335.3
Current Liability 93.89 100.6 110
Table 7: Average Figures of the 187 Respondents from the Convenience Stores Subdivision
Unit: NT$100 million 2010 2011 2012
Annual Sales Revenues 148.27 222.4 296.5
Cost of Goods Sold (COGS) 22.24 35.58 47.44
Total Labor Costs 11.86 20.02 26.69
Fixed Assets at Net Book Value 22.24 35.58 47.44
Operating Profit/Loss after Tax 59.31 88.96 118.6
Interest Incurred from Loans and Hire Purchase 2.96 4.4 5.93
Depreciation from Buildings, Equipment and
Machinery, etc. 7.41 11.12 14.82
Taxes (Income Tax, Property Tax, etc.) 22.24 33.36 44.47
Earnings Before Interest, Tax, Depreciation and
Amortization (EBITDA) 88.96 133.44 177.89
Current Asset 99.34 149.1 198.65
Current Liability 32.78 49.17 65.55
2.5 Customer Perspective Information of the Retail Companies
Over the three years 2010–2012, the following information was gathered from 201
respondents:
I. Customer Service/Feedback System
Between the years of 2010 – 2012, 95.34% of the total of 201 respondents acknowledged that
they had customer feedback mechanisms in place - via the customer service system - to make
it convenient for customers to complain or make suggestions whenever they are dissatisfied
with their products/services. Customer feedback was also taken as an important reference for
the education and training of frontline service personnel.
Benchmarking Research Project on Retail and Food Services Sectors in Asia
Asian Productivity Organization 21
II. Channel for Customer complaints
79.03% of customers complained to on-site assistants/managers, while 13.01% complained
using the customer service hotlines. 7.96% complained through websites and/or customer
service mailboxes.
III. Recording of Customer Complaints/Feedback (Verbal or Written)
98.07% of enterprises recorded customer complaints in their customer service management
systems, which captured the time of the complaints, the content, the handling of the
complaints and follow-up status situation. Between 2010 and 2012, the average number of
customer complaints received was 150, 100 and 90 respectively. All of the questionnaire
respondents have an official channel and mechanism in place to allow management to action
the customer complaints and deal with the suggestions received.
IV. Recording of Customer Compliments
All of the respondents collected and recorded customer feedback. Customer satisfaction
surveys were conducted and enterprise official websites were used to collect customer
feedback. The average annual numbers of compliments received from customers increased
over the years – 200, 350 and 400 respectively.
V. System to record and track the number of customers in outlet(s)
All the respondents have a system to record the number of customers through their Point-of-
Sales (POS) systems using wireless infrared technology in their outlet(s). In the years
surveyed there was an increasing trend of number of customers - from around 7.3 million
customers in 2010, 8 million customers in 2011 and 8.5 million customers in 2012.
VI. Customer Satisfaction Surveys and Factors used
All of the respondents carried out customer satisfaction surveys over the years in question.
The Average Customers Satisfaction Index (CSI) was 88.7, 90.2 and 90.8 respectively from
Benchmarking Research Project on Retail and Food Services Sectors in Asia
Asian Productivity Organization 22
2010–2012. The six common factors used in computing the CSI are:
a. Customer Expectations
b. Perceived Quality
c. Perceived Value
d. Customer Satisfaction
e. Customer Complaint
f. Customer Loyalty
For departmental stores, the greatest difficulties in implementing front-line service were:
Small number of employees at self-operated counters and information desks
Counter service staff in the store are managed by outside companies
Difficulties in managing outsourced security and cleaning staff
For example, a Taiwanese department store gained business advantage by organizing a
mystery shopper group to conduct in-store, inter-city inspections of front-line service staff
three times a month. This served as an important initiative and reference for improving the
quality of service. One of the respondents from the above-mentioned department store
disclosed that “Service is to put oneself as a consumer and thinking about consumers
empathetically. Service therefore is not just about the attitude of front-line service staff, but
also includes a safe, comfortable and fashionable environment as well as the promotion of
cultural events.”
Supermarkets stress ‘convenience’ and ‘one-stop shopping’ experiences to meet the needs
and expectation of their customers. Due to the hectic and busy modern lifestyle, several
critical success factors (KSFs) are implied in this:
Convenience and fast service
Location – closeness to home
Parking facilities and ease of parking
Easy access to ready-made, ready-to-eat food, etc.
In response to these growing consumer demands and trends, larger stores have expanded into
populated communities in diffused, scaled-down form. Small and medium-sized stores have
expanded the types of products they carry to provide customers with more diversified
services. They also focus on price appeals, sales promotions, member point discounts,
Benchmarking Research Project on Retail and Food Services Sectors in Asia
Asian Productivity Organization 23
merchandise redemptions and other added values in order to attract and retain customers.
Chain convenience stores, in addition to actively expanding into untapped business districts,
have also reorganized by enlarging and modernizing their existing business areas for
customers to select goods, eat and relax as well as providing a complete array of service
functions. With these efforts, larger-scale stores have had a chance of developing into food
and beverage shops to satisfy the immense consumer demand for food services.
The current survey indicates that the majority of the operators of department stores,
supermarkets, and chain convenience stores conducted customer satisfaction surveys. They
also established various channels for customers to provide feedback and complaints using
information technology (IT) to systematically manage and follow-up on the customer
complaints and feedback received.
2.6 Operational Perspective Information of the Retail Companies
The following information was gathered over three years (2010–2012):
I. Total Areas (sq. ft.) occupied by the companies
The average area occupied by the respondents gradually increased over the three years,
from 313,130 sq. ft. (2010) to 315,870 sq. ft. (2011) to 316,690 sq. ft. (2012). The
percentage of average selling space over the total space also increased from 81.19% to
83.32% and to 90.49%.
II. Key Success Factors (KSFs) for the companies
There were six KSFs highlighted by the respondents that were important for their business
growth and to stay competitive:
Good Customer Service (82.25% of respondents)
Strong Brand Recognition (77.9% of the respondents)
Effective Control of Operating Cost and Good Value (70.02% of the respondents)
Benchmarking Research Project on Retail and Food Services Sectors in Asia
Asian Productivity Organization 24
Expanded Business Scale to achieve Stock Purchase Advantages (61.57%)
Ability to satisfy Customized Requirements (52.31% of the respondents)
Transportation/Parking Convenience (42.15% of the respondents)
III. Applications of IT systems (Technology) to enhance Productivity
a. All of the respondents used IT Systems to enhance their competitiveness
b. 90.48% had POS systems, credit card/bank card payment systems, inventory systems,
purchasing systems and personnel shift management systems;
c. 81.07% used internet sales and an Enterprise Resource Planning (ERP) system.
Over the three years surveyed, there has been a steady increase in the average IT systems
expenditures and facility capital expenditures from 5.12 million, 5.89 million and 5.93
million for the former and from 15.98 million, 17.80 million and 20.24 million for the latter.
The use of IT to assist the management in re-engineering of business processes has proven to
be one of the most efficient strategic methods available for companies. For the customer
service systems in particular, the acquisition, analysis, and application of real-time
information became the most important factor in improving the management systems and
processes. In addition, the development of numerous IT applications enabled the businesses
to provide a higher quality of customer service.
With regard to department stores, information systems have been used to assist operators in
creating customer databases to better understand their customers’ consumption habits and to
plan relevant sales events, products and services to better meet the needs of specific groups of
customers. With online shopping and the e-commerce market forecasted to break the NT$500
billion mark this year (2013), Taiwan’s e-commerce operators have started to attach greater
importance to the overall appearance of their websites as well as increased security. Many of
them chose to cooperate with densely distributed 24-hour chain convenience stores to provide
online shoppers with more convenient and secure payment channels and merchandise pick-up
locations.
Benchmarking Research Project on Retail and Food Services Sectors in Asia
Asian Productivity Organization 25
The survey also indicated that the majority of department stores, supermarkets and chain
convenience store operators were already using POS systems and rapid report systems to
perform multiple tasks such as i) tracking business data, consumer trends and product sales,
ii) performing procurement, sales and inventory management, iii) enabling operational
departments and management to obtain the information quickly and accurately. They also
worked closely with banks issuing credit cards or to introduce co-branded cards for
customers to enjoy discounts and other benefits.
2.7 Human Resource Perspective Information of the Retail Companies
Over the three years (2010–2012), the following information was gathered from 201
respondents:
I. Increased Number of Full-time Employees
All of the respondents had experienced an increase in the average number of full-time
employees from 2010–2012, i.e. from 2,985 employees, 3,104 employees and 3,450
employees respectively.
II. Increased Length of Weekly Working Time
The average length of weekly working time of full-time employees from 2010–2012 was 56,
58 and 62 hours respectively.
III. Increased Part-time Employees or Work-Cum-Study Students
95% of the respondents employed part-time workers or ‘work-cum-study student’ employees.
The average number of these types of employees from 2010–2012 was 245, 284 and 278
respectively. The average length of weekly working time was 32, 42 and 45 hours
respectively.
IV. Employee Turnover Rates

Benchmarking Research Project on Retail and Food Services Sectors in Asia
Asian Productivity Organization 26
It was noted that all of the respondents carried out employee turnover surveys. The employee
turnover rates for full-time employees tended towards an increase between the years 2010–
2012 (15%, 12% and 18%). The turnover rates for part-time employees remained marginally
more stable over the same period (21%, 19% and 18.5%).
V. Education and Training
All of the respondents carried out employee education and training using actual lessons and
online teaching approaches. The average number of training hours received by employees
from 2010–2012 was reported to be 47 hours, 53 hours and 51 hours per employee
respectively.
VI. On-the-Job Training (OJT)
All of the respondents had implemented OJT for their employees. Training Plans were
developed after employee competency requirements were known and understood.
VII. Incentive Mechanisms
All of the respondents had an employee incentive system in place via the profit sharing and
performance bonus mechanisms. The Variable Pay as a percentage of Salary had increased
over the three years from 2010–2012 (12 %, 15 % and 19 %). Only 15 % of respondents had
adopted non-financial mechanisms for their staff, such as company promotion systems and
public commendations, as employee incentives systems.
VIII. Employee Absenteeism Rates
All of the respondents had determined their employee absenteeism rate. There was a
decreasing average rate from 2010–2012 (from 3.5%, 2.7% to 1.7%). This was a positive
trend observed.
Two factors in the employment of department store employees were noted:
Benchmarking Research Project on Retail and Food Services Sectors in Asia
Asian Productivity Organization 27
Long business hours
Many different shifts
In order to better serve a broad segment of customers, the store operating hours generally
need to be longer. This made it necessary for a system of different work shifts to satisfy the
need for manpower to serve the heavier customer traffic on weekends and national holidays.
In terms of the division of manpower, there were different categories of staff such as:
Business management staff on each floor to manage each counter and level
Sales and service staff at each counter
Administrative support staff (telephone receptionists, accounting and human resources
staff)
Part-time employees, such as the additional sales staff, service staff, cashiers, and other
front-line staff members hired during department store anniversary celebrations or other
events.
In terms of the average age of employees, the largest percentage of employees was in the 30–
35 year group and most of them were female.
Chain convenience store businesses comprised both regular chain stores and franchise stores.
Regular chain stores operated directly by the parent companies, who had regional consultants,
regional heads, regional supervisors and other people specifically responsible for conveying
company information and sales promotion between the parent company and its retail stores.
Areas of responsibilities were categorized by regions, which include advising the franchise
stores.
Generally, retail store staff members go to the parent company to receive their training on
service quality, etc., in accordance with the required training hours stipulated by the parent
companies for the different categories of employees. In order to ensure store service quality,
each staff member was generally required to receive an average of 20–40 hours of training
annually, on a monthly basis for store managers and a quarterly basis for store staff.
For franchise stores, the franchise owners take full responsibility for hiring staff while
Benchmarking Research Project on Retail and Food Services Sectors in Asia
Asian Productivity Organization 28
training was largely supported by the parent company. There was no special requirement
regarding the qualifications or skills of store staff, nor any preferred educational level or
training background. The basic requirements are to have graduated from senior or vocational
high school and to have a concept of service.
Medium and large businesses provided new employees with about 30–50 hours of pre-
employment training, while those working received about 20–30 hours through OJT. The
training content mainly related to the respective retail store’s business operations and the
specific knowledge and skills it required. Different training was also arranged for store staff
(such as the trainee store manager) based on their work performance and the knowledge and
skills that they required.
For supermarkets, recruitment of full-time employees was more challenging. As such, most
supermarket employees were part-timers. Large or chain-operated supermarkets have a
greater flexibility and space in terms of controlling costs as well as management and
utilization of manpower, which allowed them to maintain a certain level of standards and
profits. Training primarily covered the cashiering processes, handling of customer
complaints, product purchasing, sales, and inventory management. In terms of promotions,
experience and good performance were the key requirements for lower-level employees to be
promoted to the management positions.
Data from the current survey indicated that most businesses conducted OJT for their
employees and they had put in place established employee performance incentive systems.
Benchmarking Research Project on Retail and Food Services Sectors in Asia
Asian Productivity Organization 29
Key Findings of Retail Sector in Japan
3.1 Introduction and Overview of the Retail Sector in Japan
There are many SMEs throughout Japan; yet the majority of them are found in Tokyo’s
metropolitan and urban areas where the population is concentrated. In these areas, the variety
of SME businesses is rather wide.
Today, the majority of businesses in Japan, including retail sector businesses, tend to take the
form of a limited company. Old-fashioned small-scale one-man businesses still exist but their
number is small as they are usually disadvantaged in lending and capital investments. Such
one-man businesses often do not report financial accounting of their businesses and thus are
not included in these research samples.
The samples do not include department stores, GMS, convenience stores or home electrical
appliance stores as, in metropolitan areas, the majority of these businesses (90%) tend to be
monopolized by five mega-scale companies. In the case of Japan, due to prolonged recession,
it is difficult for SMEs to survive on their own, and hence they tend to become franchised
outlets under large franchisers, who manage their entire operations. In Japan, franchisers do
not usually allow franchisees to respond to any business surveys.
The number of retail outlets is varied and dependent on the size of the companies. Given that
staffing and management costs tend to be high for Japanese retail businesses, those retail
businesses handling low-margin products have no choice but to merged into large-scale
companies and/or develop many stores. There is no way for them to survive, particularly in
the current Japanese economy, under such a prolonged recession.
It should be noted that in Japan, the condition of outlets owned by the same company can
vary depending on the type of commercial establishment they are in. Generally speaking
specialized shops close their operations between 8pm and 9pm, while small-scale
supermarkets close between 10pm and 11pm. Supermarkets with high turnovers recently
began operating 24-hours a day.
Benchmarking Research Project on Retail and Food Services Sectors in Asia
Asian Productivity Organization 30
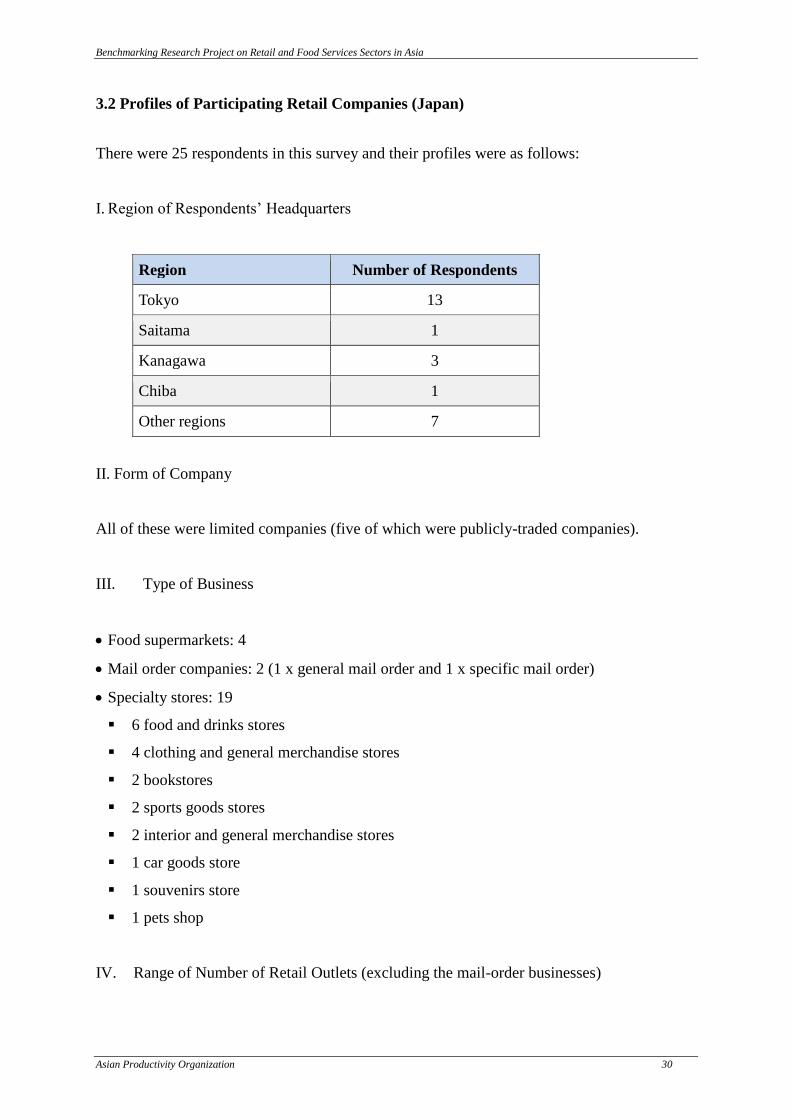
3.2 Profiles of Participating Retail Companies (Japan)
There were 25 respondents in this survey and their profiles were as follows:
I. Region of Respondents’ Headquarters
Region Number of Respondents
Tokyo 13
Saitama 1
Kanagawa 3
Chiba 1
Other regions 7
II. Form of Company
All of these were limited companies (five of which were publicly-traded companies).
III. Type of Business
Food supermarkets: 4
Mail order companies: 2 (1 x general mail order and 1 x specific mail order)
Specialty stores: 19
6 food and drinks stores
4 clothing and general merchandise stores
2 bookstores
2 sports goods stores
2 interior and general merchandise stores
1 car goods store
1 souvenirs store
1 pets shop
IV. Range of Number of Retail Outlets (excluding the mail-order businesses)

Benchmarking Research Project on Retail and Food Services Sectors in Asia
Asian Productivity Organization 31
Food supermarkets: 7–76 retail outlets
Special shops: 1 (souvenirs shop) to 372 retail outlets (books)
V. Business Hours (except for mail-order businesses)
Food supermarkets: 10am–10pm
Special shops: 10am–8pm
3.3 Key Performances of Participating Retail Companies (Japan)
The following data was collected from respondents in the retail sector over three years.
I. Financial Perspective Information of the Retail Companies
Table 8: Average Figures of 25 Respondents from Retail Sector
Unit: million JPY 2010 2011 2012
Annual Sales Revenues 3,911 –
107,490
4,049 –
110,241
4,128 –
113,900
Cost of Goods Sold (COGS) 1,204 –
91,072
1,240 –
91,627
1,210 –
90,220
Total Labor Costs 112 –
2,150
105 –
2,490
120 –
2,510
Fixed Assets at Net Book Value 981 –
18,087
1,056 –
18,368
1,100 –
18,368
Operating Profit/Loss after Tax 12 – 891 10 – 921 9 – 920
Interest Incurred from Loans and Hire
Purchase 0 – 5,308 0 – 4,512 0 – 4,100
Depreciation from Buildings, Equipment and
Machinery, etc.
21 –
1,324
22 –
1,366
22 –
1,350
Taxes (Income Tax, Property Tax, etc.) 3 – 754 2 –850 2 – 862
Current Liability 15,750 16,348 16,000
From the data collected, the following analysis was made:
a. Sales

Benchmarking Research Project on Retail and Food Services Sectors in Asia
Asian Productivity Organization 32
Many of the retail SMEs in metropolitan areas throughout Japan that were subject to this
research were not heavily impacted by the East Japan Earthquake or yen appreciation. Many
SMEs in the sector maintained the same level of sales (or even had increased sales) after
these events. For those who had diminished sales, the impact was very minimal – reduced by
a few percentage points only.
b. Sales Ratio to Cost of Goods Sold (COGS)
This ratio tends to range between 65–85% against COGS. The rate was higher for retail
shops that handle fresh foods items (they tend to incur higher losses) and outlets that handle
generic goods (i.e. not specialty items). Additional contributing factors to this higher COGS
ratio include a hostile economic environment where deflation accelerated the commodity
prices, and intensified competition amongst similar shops.
c. Total Labor Cost Ratio to COGS
The ratio ranges between 2–3%. This tends to be lower for the retail sector as the manpower
cost is not as high as it is in other sectors, such as manufacturing and general trading sectors.
Another factor for the low ratio of manpower cost to COGS for the retail sector was the high
number of part-time workers in this sector in Japan.
d. Changes in Net Tangible Asset over the three years
There was no drastic change in net tangible assets in the respondents’ companies over the
past three years. None of the respondents expanded or diminished their businesses to any
great degree. Even those SMEs with increased numbers of outlets did not invest in property,
but instead rented premises for their new outlets. Moreover, those retail SMEs located in the
Tohoku area, which were affected by the 3.11 earthquake, did not see changes in their net
tangible assets, mainly because they did not have their own financial assets in the region.
e. Sales Ratio to Operating Profit/Loss After Tax

Benchmarking Research Project on Retail and Food Services Sectors in Asia
Asian Productivity Organization 33
This national sales ratio to operating profit ranges between 1–5%, while the majority of
respondent SMEs recorded around 2%. This result was due to the fact that corporate tax rates
are high in Japan, as well as the high proportion of sales management and labor costs.
Henceforth, Japanese retail businesses are not considered high profit-making.
f. Current Liability Analysis
In Japan, SMEs are not mandated to disclose any information regarding their liabilities,
therefore this was one of the more challenging areas to research. There were responses from
seven companies, out of which two operated on a ‘pay as you go’ basis. On the flipside, those
with liabilities tended to depend on indirect financing, i.e. borrowing from banks rather than
direct financing (through stocks and bonds etc.). They borrowed from banks that offered low
interest rates – on average the interest rates ranged between 1%–4%.
g. Rate of Depreciations
According to collected data, the average rate of depreciation was less than 1% of total sales.
h. Other financial indicators
In Japan, the corporate tax rate is 30% of profit. This tends to be higher than other countries,
although there are special tax reductions (to 22%) if taxable earnings are less than 8 million
JPY. However, many retail SMEs taxation rates remain less than 1% of total sales due to high
COGS, as well as expensive sales management costs and other indirect costs involved.
II. Customer Perspective Information of the Retail Companies
a. Customer Service/Feedback System
Many Japanese retail shops have introduced the Point Card System (this works by allowing
people to accumulate points through purchases, and then using their points for discounts on
services). Often the Point Card System is referred to as the Frequent Shoppers Program,
which provides preferential and special treatment for frequent shoppers. 76% of companies
surveyed had been using this system for more than three years.
Benchmarking Research Project on Retail and Food Services Sectors in Asia
Asian Productivity Organization 34
Many respondents used public relation (PR) activities, such as advertisements, to attract
customers.
One of the respondents had introduced a new customer service concept - delivery services.
More food and daily goods supermarkets have started offering this service due to the aging
population in Japan.
Major retailers also introduced online shopping avenues to predominantly serve elderly
customers who face difficulties shopping by themselves. However, most of the respondent
retail SMEs do not yet have capacity to offer this service.
One of the respondents (a mail-order venture) joined up with the ‘T Point Card’ in 2012,
which allows businesses from different industries to share in the same points scheme.
Most of the respondents followed up and monitored customer complaints or requests received
from customers in a highly analogue manner, e.g. through emails or verbal sharing at
meetings (80% of the respondents). Many respondents reported that once they had received
complaints or requests, they would then improve their services accordingly. Thereafter, their
respective Operation Chiefs will follow-up and check that improvements have been made.
However, when it comes to serious complaints (e.g. accidents or any matters related to
hazardous situations), 48% of the respondents say that they would explicitly publicize the
information gathered, as food safety problems are considered very important and are of
interest to the wider community and the public.
b. Channel for Customers’ complaints
72% of the respondents managed and received complaints either via emails or through their
company’s homepage. Only 28% reported that they usually received complaints by
telephone. There were some respondents who systematically and openly avail themselves to
face-to-face complaints from customers. Generally, the respondents do not dictate to their
customers as to how they should express their complaints. They let the customers decide the
route to take to air their grievances.
Benchmarking Research Project on Retail and Food Services Sectors in Asia
Asian Productivity Organization 35
c. Recording of Customers’ Complaints/Feedback (Verbal or Written)
The majority of respondents do not keep a record of the number of complaints received but
they do review and screen complaints based on their degree of importance.
For the respondents who do keep records of complaints, they have a designated person in
charge of reviewing the complaints, and then compiling and recording the complaints data.
It can be inferred from the respondents’ feedback that the majority of complaints received
from customers tended to be product related. Complaints about how customers were treated
at the retail shops were in the minority. In Japan, complaints tend towards the concrete
(specific requests and complaints about products and goods that can be directly responded to)
rather than more subjective, behavioral complaints about the attitude of service providers.
Examples of common complaints received were:
i. Safety of the products (e.g. expiration dates of food items and injuries caused by
products)
ii. Defects or deficiency of products (e.g. defects in sewing of clothing items, quantitative
deficiency)
iii. Availability of product choices and selection
iv. Customer services (e.g. delay in delivery, bad-mannered employees, etc.)
d. Recording of Customers’ Compliments
None of the respondents recorded compliments. The reason behind this is possibly cultural;
that many Japanese retail companies do not understand the criteria of the term ‘compliment’.
Since good service is expected and always delivered to Japanese customers, it is rare for
customers to give compliments to salespersons at shops. In general, the feeling was that
silence was a sign of satisfaction.
e. System to record and track the number of customers in outlet(s)
All respondents reported that they had captured the number of customers as well as the
amount of shopping done via the POS System. They all had a good grasp of the customers

Benchmarking Research Project on Retail and Food Services Sectors in Asia
Asian Productivity Organization 36
who actually shopped but they were not fully aware of the number of customers who came
into retail shops but did not make any purchases.
Overall, the data showed that there was a small increase in the number of customers who
came into the respondent retail outlets and spent money over the past three years.
Nevertheless, average spending per customer is trending downwards. As a result, the majority
of the respondents had either the same or only a slight increase in total sales over the past
three years.
Average number of customers by different type of retail outlets was as follows:
i. Food Supermarkets: 1,500 - 2,000 persons per day
ii. Specialized shops: 80 persons per day (e.g. non-daily goods shops such as golf shops)
iii. Bookshops: 500 persons per day
f. Customer Satisfaction Surveys and Factors Used 48% of respondents conducted in-
store customer satisfaction surveys using questionnaires. However, none of them quantified
or had a calculated CSI. In Japan, many retail businesses tend to conduct customer
satisfaction surveys with the sole purpose of gaining qualitative information about customers’
feelings. However, they were hesitant to quantify this data.
III. Operational Perspective Information of the Retail Companies
a. KSFs for the companies
There are four KSFs highlighted by the respondents that were important for business growth
and to be competitive:
i. Good quality product according to customers’ requirements (40%)
ii. Good customer service (24%)
iii. Value for money (12%)
iv. Scale of operations e.g. multiple stores and locations (8%)
b. Applications of IT Systems (Technology) to enhance Productivity
The extent of technology applications among the respondents to increase their
Benchmarking Research Project on Retail and Food Services Sectors in Asia
Asian Productivity Organization 37
competitiveness were as follows:
i. 96% used the POS system
ii. 84% used the credit card system
iii. 60% used Point Card system (requires system management)
iv. 28% used mail-order system
v. 80% used inventory management system
vi. 20% used anti-shoplifting sensors (retailers, including bookshops)
Major investments in IT, accompanying capital investment, had been already completed
before 2010 in all of the sample companies, and they were basically expenditures for
maintenance and upgrading of software. Most retail companies in Japan, besides the larger
ones and the finance sector, do not spend much on IT. Retail SMEs tend to be slow in
adopting new IT systems in comparison to larger retailers. For example, self-register systems
were a popular IT innovation for large-scale retail shops and were widely introduced by
GMSs several years ago. However, there were hardly any SME supermarkets that introduced
the system. However it is worth noting that mail-order companies have recently made an
investment in IT innovation as the catalogue-based mail order business has moved towards
the IT-based shopping concept.
Although a minor case, there was one respondent company (a retailer focused on fresh food
items) who invested approximately 40 million JPY for IT software to strengthen their
marketing support system and customer management system, as well as to develop an
English homepage.
c. Capital Investments other than for IT
In Japan, the size and capacity of SMEs are quite varied, and therefore, averaging the data of
various SMEs is not necessarily a good indicator of a general trend. Also, when analyzing the
tendency and size of capital investment, we should be mindful that it comprises investments
for both tangible and intangible assets, and hence, the range of capital investment may also
widely vary. Generally speaking, investment size was larger for those retailers who had
established new outlets or developed new businesses.
Although the earthquake imposed unexpected capital investments, despite government

Benchmarking Research Project on Retail and Food Services Sectors in Asia
Asian Productivity Organization 38
subsidies, the general trend for capital investment for SMEs in the retail sector is diminishing.
IV. Human Resource Perspective Information of the Retail Companies
a. Number of Permanent Employees and their Working Hours
In general, there seem to be no drastic changes in the number of permanent employees over
the three years reviewed. The small increase in number could be attributed to the increase in
number of outlets. It was evident that the burden on permanent employees had gradually
become bigger due to the current trend towards labor cost reduction, as well as for ensuring
staff mobility by utilizing more part-time staff. Many retail shops in Japan tend to go for
labor force reduction, in particular reducing direct concierge services.
Table 9: Range of Number of Permanent Employees
2010 2011 2012
Specialized
Shops
Larger
Retailers
Specialized
Shops
Larger
Retailers
Specialized
Shops
Larger
Retailers
32 – 804 36 – 798 42 – 805
In Japan, the retail sector is one where working hours are longer than other sectors. This is
because the non-business days have been reduced, while at the same time the number of
employees has not been increased.
The working hours (per week) of permanent employees are tabulated as follows:
FY 2010: average 45.5 hours/week
FY 2011: average 47.8 hours/week
FY 2012: average 48.2 hours/week
b. Number and Working Hours of Part-Time Employees
Amongst the respondents of retail shops which specialize in food, supermarkets employed the
largest number of part-time employees while retail businesses such as mail-order companies

Benchmarking Research Project on Retail and Food Services Sectors in Asia
Asian Productivity Organization 39
had smaller numbers of part-time staff. Where the latter employed full-time employees, they
were mainly administrative or office-based. These full time employees were likely to be
temporary staff who were either directly or indirectly hired by the companies. They usually
worked for call centers in mail-order companies. It should be noted that in Japan, these
temporary workers are categorized as non-proper employees.
Benchmarking Research Project on Retail and Food Services Sectors in Asia
Asian Productivity Organization 40
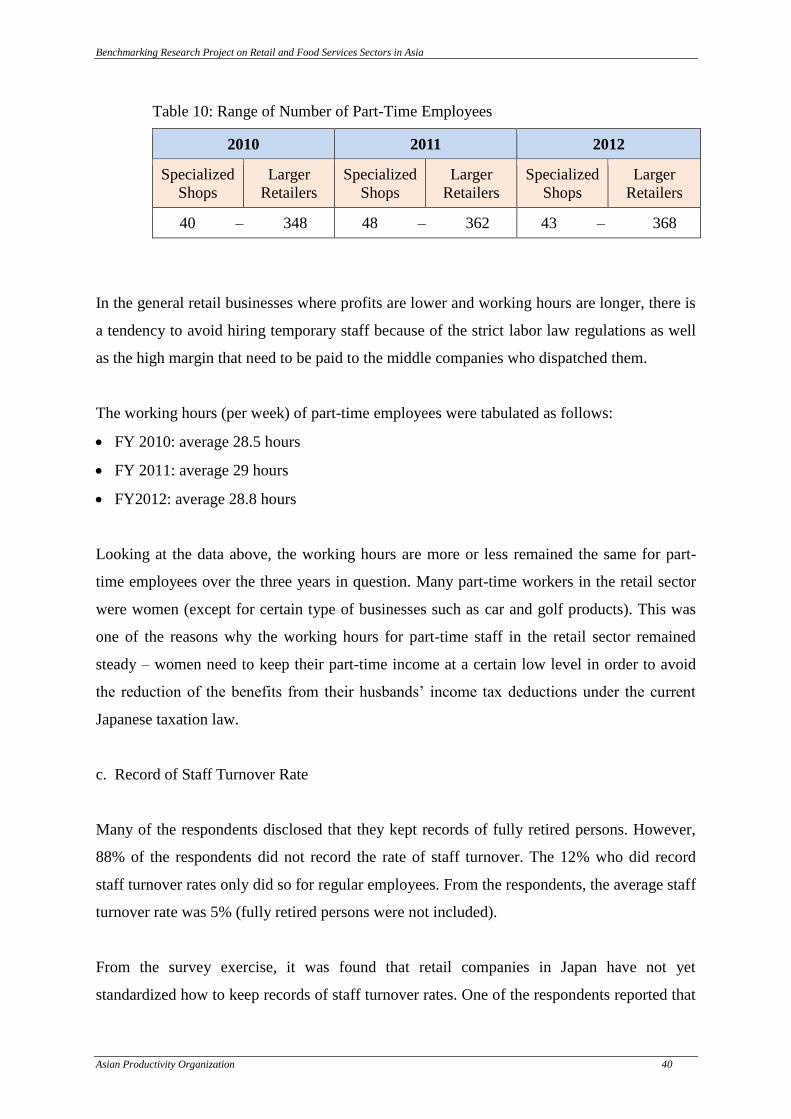
Table 10: Range of Number of Part-Time Employees
2010 2011 2012
Specialized
Shops
Larger
Retailers
Specialized
Shops
Larger
Retailers
Specialized
Shops
Larger
Retailers
40 – 348 48 – 362 43 – 368
In the general retail businesses where profits are lower and working hours are longer, there is
a tendency to avoid hiring temporary staff because of the strict labor law regulations as well
as the high margin that need to be paid to the middle companies who dispatched them.
The working hours (per week) of part-time employees were tabulated as follows:
FY 2010: average 28.5 hours
FY 2011: average 29 hours
FY2012: average 28.8 hours
Looking at the data above, the working hours are more or less remained the same for part-
time employees over the three years in question. Many part-time workers in the retail sector
were women (except for certain type of businesses such as car and golf products). This was
one of the reasons why the working hours for part-time staff in the retail sector remained
steady – women need to keep their part-time income at a certain low level in order to avoid
the reduction of the benefits from their husbands’ income tax deductions under the current
Japanese taxation law.
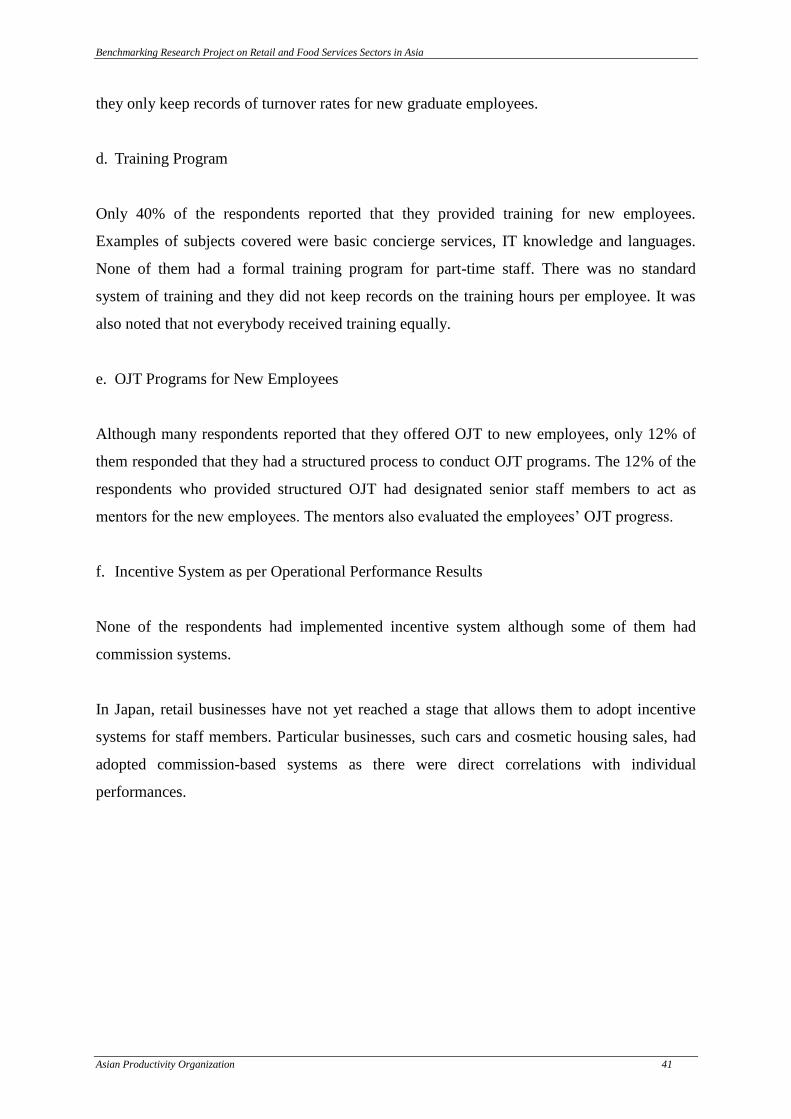
c. Record of Staff Turnover Rate
Many of the respondents disclosed that they kept records of fully retired persons. However,
88% of the respondents did not record the rate of staff turnover. The 12% who did record
staff turnover rates only did so for regular employees. From the respondents, the average staff
turnover rate was 5% (fully retired persons were not included).
From the survey exercise, it was found that retail companies in Japan have not yet
standardized how to keep records of staff turnover rates. One of the respondents reported that
Benchmarking Research Project on Retail and Food Services Sectors in Asia
Asian Productivity Organization 41
they only keep records of turnover rates for new graduate employees.
d. Training Program
Only 40% of the respondents reported that they provided training for new employees.
Examples of subjects covered were basic concierge services, IT knowledge and languages.
None of them had a formal training program for part-time staff. There was no standard
system of training and they did not keep records on the training hours per employee. It was
also noted that not everybody received training equally.
e. OJT Programs for New Employees
Although many respondents reported that they offered OJT to new employees, only 12% of
them responded that they had a structured process to conduct OJT programs. The 12% of the
respondents who provided structured OJT had designated senior staff members to act as
mentors for the new employees. The mentors also evaluated the employees’ OJT progress.
f. Incentive System as per Operational Performance Results
None of the respondents had implemented incentive system although some of them had
commission systems.
In Japan, retail businesses have not yet reached a stage that allows them to adopt incentive
systems for staff members. Particular businesses, such cars and cosmetic housing sales, had
adopted commission-based systems as there were direct correlations with individual
performances.

Benchmarking Research Project on Retail and Food Services Sectors in Asia
Asian Productivity Organization 42
g. Non-Cash Incentive System
Only 20% of the respondents had adopted some form of non-cash incentive systems, such as
rewards for perfect attendance, which was generally considered unrelated to sales
performance. Such non-cash rewards were given out in the form of company travels, special
paid leaves and so forth.
h. Absenteeism Levels
None of the respondents kept records of absenteeism levels as a standardized indicator. Some
respondents collected the data for calculating employees’ salaries.

Benchmarking Research Project on Retail and Food Services Sectors in Asia
Asian Productivity Organization 43
Key Findings of Retail Sector in Malaysia
4.1 Introduction and Overview of the Retail Sector in Malaysia
The retail industry in Malaysia is growing. With the increased number of hypermarkets in the
country, it opens up opportunities for SMEs to increase their participation and contribution to
the country’s national income. Though competition has gotten tougher, players of the
industry have become more innovative with the introduction of new initiatives for developing
their products and services, which eventually contributes to higher growth of the economy.
4.2 Profiles of Participating Retail Companies (Malaysia)
There were nineteen SMEs involved in the research study. Thirteen (13) were sole
proprietors, four (4) were in partnership arrangements, and the remaining two (2) were
private limited companies.
The business types of these SMEs are shown in the following table:

Benchmarking Research Project on Retail and Food Services Sectors in Asia
Asian Productivity Organization 44
Table 11: Type of Retail SMEs
Type of Business Retail Divisions
Sole Proprietor 13 Supermarkets, Mini-marts, Convenience Stores and
Provision Shops 1
Partnership 4 Department Stores, Hypermarkets and Other Non-
Specialized Stores -
Private Limited 2 Food, Beverages and Tobacco Products 3
Public Listed - Motor Vehicles, Parts and Accessories 1
Automotive Fuel 1
Computers, Peripheral Units, Software,
Telecommunications, Audio and Equipment 4
Textiles, Hardware, Paints, Glass, Electrical Household
Appliances, Furniture, Lighting Equipment and Other
Household Articles
6
Books, Newspapers, Stationery, Music and Video
Recordings 2
Sporting Equipment, Games and Toys -
Clothing, Footwear and Leather Articles 2
Pharmaceutical and Medical Goods, Cosmetic and Toilet
Articles 2
Jewelry, Costume Jewelry, Watches and Clocks -
Handicrafts and Fancy Goods, Flowers, Plants and Pets 2
Optical and Photographic Goods -
Other New Goods, Second-Hand Goods 1
Retail Sale via Mail-Order Houses or via Internet and
Other Retail Sale not in Stores 1

Benchmarking Research Project on Retail and Food Services Sectors in Asia
Asian Productivity Organization 45
4.3 Key Performances of Participating Retail Companies (Malaysia)
The key performances of the participating companies were reviewed using the four key
perspectives: financial, customers, operational and human resources.
I. Financial Perspective Information from the Retail Companies
In this research study, the following four financial indicators were used: VA-to-sales ratio,
labor cost competitiveness, working capital ratio and profit margin.
It was noted that the VA-to-sales ratio, which refers to the proportion of sales created by the
organization over and above purchased materials and services was on an average 0.49.
As for the efficiency and effectiveness of the organization in terms of its labor costs, a
relatively high score of 8.71 had been recorded based on the data from seventeen SMEs.
The average profit margin that was computed from the respondents was 23%.
II. Customer Perspective Information of the Retail Companies
For the customer satisfaction index, it was noted that a high score of 0.86 was experienced by
the respondents. This signified the good effort made by the respondents in servicing their
customers.
III. Human Resource Perspective Information of the Retail Companies
From the survey study, it was noted that a small number of the respondents had taken the
proactive initiative of providing training for their employees to enhance their knowledge and
skill competencies. However, as previously mentioned, only some of the respondents actually
measured and recorded the training hours per employee.
Benchmarking Research Project on Retail and Food Services Sectors in Asia
Asian Productivity Organization 46
Key Findings of Retail Sector in Singapore
5.1 Introduction and Overview of the Retail Sector in Singapore
The retail1 sector comprised 19,300 establishments and employed more than 112,000
workers2. The productivity level of the retail sector, measured by value added per worker,
was S$44,000.
There are six (6) key sub-sectors under the retail sector:
Fashion and sporting goods
Supermarket and convenience stores
Furniture and household
Jewelry and timepiece
Department stores
Consumer electronics
5.2 Profiles of Participating Retail Companies (Singapore)
A total of 19 SMEs from the retail sector participated in the benchmarking study. The
average annual sales turnover of these retail participants was S$23.7 million.
Data on key productivity indicators were collected from the companies, and more in-depth
interviews were conducted with a select group of companies to identify productivity best
practices. As not all companies measured all of the indicators identified for the cross-country
assessment in the same manner, the analysis focused mainly on financial indicators.
5.3 Key Performances of Participating Retail Companies
1 Retail cluster refers to retail trade excluding motor vehicles and petrol stations as well as hawkers and stall- holders
2 Source: Department of Statistics, 2010, excludes motor vehicles and petrol stations
Benchmarking Research Project on Retail and Food Services Sectors in Asia
Asian Productivity Organization 47
I. Financial Perspective Information of the Retail Companies
The respondents, who were mostly SMEs, focused mainly on the typical financial indicators
(e.g. sales revenue, costs and profits) instead of productivity indicators. Productivity was not
‘top of the agenda’ for businesses, and most of the companies did not understand how to
measure, use and keep track of productivity indicators (e.g. VA) per worker. For the majority
of companies, increasing and expanding new stores/outlets was their preferred way to grow
sales revenues. The companies were generally weak in converting sales to VA, which
indicated scope for the companies to better control their costs and to optimize the use of their
resources. The top three expenses for companies in the retail sector were (1) cost of goods
sold; (2) labor costs; and (3) rental cost.
II. Customer Perspective Information of the Retail Companies
Many companies in the retail sector do not have clear definitions or consistent business
models to support their business concepts. Most of them offered products that were rather
similar to their competitors. Some companies were able to differentiate their concepts from
their competitors, but the concept or value proposition was not applied consistently within the
company. Similarly, most retail SMEs do not have clear ideas regarding the positioning of
their concepts.
Local companies, especially the bigger ones, have put in place systems to collect customer
feedback and complaints. Some of them conducted customer satisfaction surveys and mystery
shopping. However, most companies do not make good use of the information collected to
improve their operations, product offerings and pricing. Most companies review outgoing
costs and competitors’ charges to compute their prices rather than looking at what customers
are willing to pay.
Benchmarking Research Project on Retail and Food Services Sectors in Asia
Asian Productivity Organization 48
III. Operational Perspective Information for the Retail Companies
The respondents and companies in the retail sector in Singapore relied heavily on manual
labor in their operations. The use of basic systems and technology in their businesses was
relatively low.
Many of the retail companies continued to rely on time-intensive and manual ordering
processes for product replenishment. They were also weak in managing their space
productively. Their store sizes might be either too large or too small to optimize the ratio of
‘sales per square foot’.
IV. Human Resource Perspective Information for the Retail Companies
The companies that have participated in the study have put in place basic human resource
management systems to recruit, train and compensate their employees. However, these same
sectors have not made much use of part-timers and deployed their manpower effectively to
meet the demand fluctuations of their businesses. The incentive structures tend to be tied
solely to sales performance, with weak alignment to business strategies and areas such as
teamwork.

Benchmarking Research Project on Retail and Food Services Sectors in Asia
Asian Productivity Organization 49
Key Findings of Food Services Sector in Republic of China
6.1 Introduction and Overview of the Food Services Sector in Republic of China
I. Definition and Scope of Food and Beverage Services Sector
According to the definition of the Standard Industrial Classification System of the DGBAS,
the food and beverage service activities ‘include all businesses engaged in food and beverage
serving activities providing prepared food and drinks for on-premise or immediate
consumption.’ Under the food and beverage service activities division are the groups of
restaurants, beverage service activities via shops, food and beverage service activities via
stalls, and other food and beverage service activities.
Table 12: Classification of Primary Food and Beverage Service Types in ROC
according to the DGBAS Standard Industrial Classification System
Division Group Class
56 – Food and Beverage Service Activities
Includes all businesses engaged in food and beverage serving activities providing prepared food and drinks for on-premise or immediate consumption. Take-away or delivery of food and drink, catering, and other services are classified under this division.
561 – Restaurants Includes all restaurants engaged in providing prepared food and drinks for on-premise or immediate consumption. Take-away or delivery shops providing items such as boxed meals, pizza, or hamburgers belong to this group.
5610 – Restaurants Snack shops, Japanese restaurants, fast-food restaurants.
562 – Beverage Service Activities via Shops
Includes all shops engaged in the serving of prepared alcoholic and non-alcoholic drinks for on-premise or immediate consumption.
5621 – Non-Alcoholic Beverage Service Activities via Shops
Fruit shops, cold drink shops. 5622 – Alcoholic Beverage
Service Activities Via Shops
Bars.
563 – Food and Beverage Service Activities via Stalls
Includes all fixed or mobile stalls engaged in the serving of prepared food and drinks for o- premise or immediate consumption.
5631 – Food-Service Activity via Stalls
Snack stalls, noodle stalls. 5632 – Beverage Service
Activities via Stalls Mobile coffee carts, cold drink stalls.
569 – Other Food and Beverage Service Activities
Includes all businesses engaged in food and beverage service activities other than those classified under Groups 561 to 563, such as catering services (including the catering of banquets etc.).
5690 – Other Food and Beverage Service Activities
Employee canteens, airline catering companies, group meal providers, banquet catering.
II. Overview of Food and Beverage Services Sector
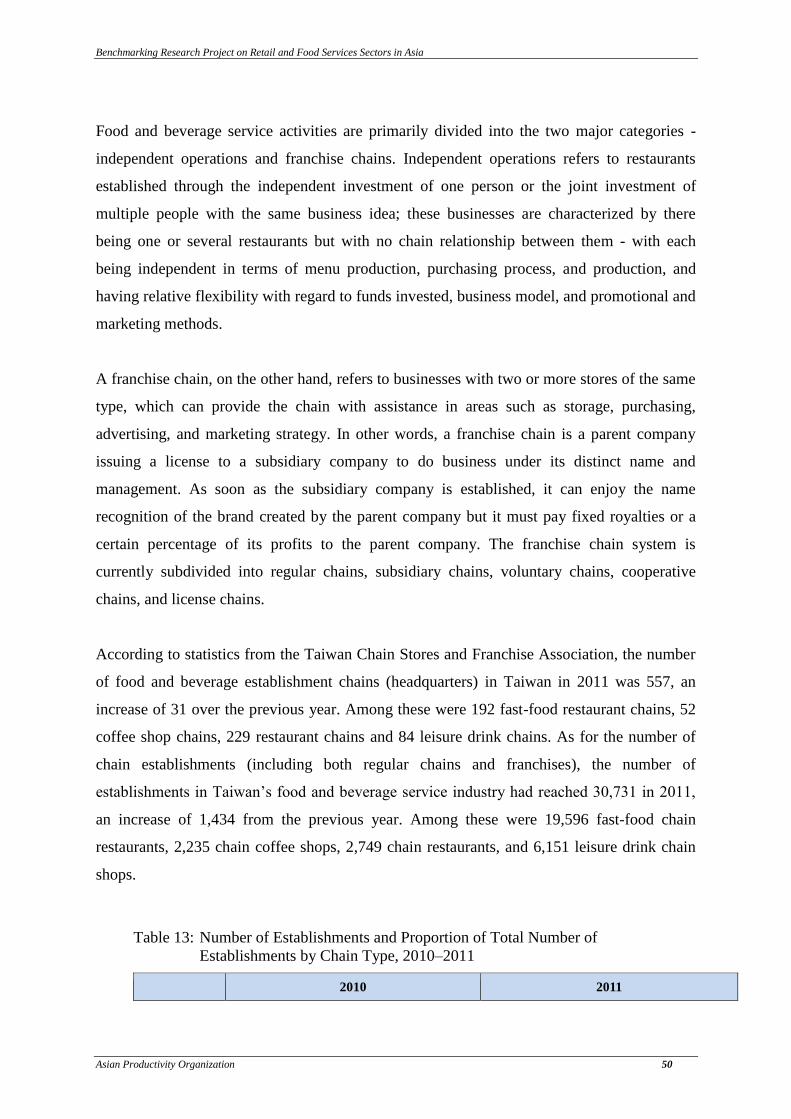
Benchmarking Research Project on Retail and Food Services Sectors in Asia
Asian Productivity Organization 50
Food and beverage service activities are primarily divided into the two major categories -
independent operations and franchise chains. Independent operations refers to restaurants
established through the independent investment of one person or the joint investment of
multiple people with the same business idea; these businesses are characterized by there
being one or several restaurants but with no chain relationship between them - with each
being independent in terms of menu production, purchasing process, and production, and
having relative flexibility with regard to funds invested, business model, and promotional and
marketing methods.
A franchise chain, on the other hand, refers to businesses with two or more stores of the same
type, which can provide the chain with assistance in areas such as storage, purchasing,
advertising, and marketing strategy. In other words, a franchise chain is a parent company
issuing a license to a subsidiary company to do business under its distinct name and
management. As soon as the subsidiary company is established, it can enjoy the name
recognition of the brand created by the parent company but it must pay fixed royalties or a
certain percentage of its profits to the parent company. The franchise chain system is
currently subdivided into regular chains, subsidiary chains, voluntary chains, cooperative
chains, and license chains.
According to statistics from the Taiwan Chain Stores and Franchise Association, the number
of food and beverage establishment chains (headquarters) in Taiwan in 2011 was 557, an
increase of 31 over the previous year. Among these were 192 fast-food restaurant chains, 52
coffee shop chains, 229 restaurant chains and 84 leisure drink chains. As for the number of
chain establishments (including both regular chains and franchises), the number of
establishments in Taiwan’s food and beverage service industry had reached 30,731 in 2011,
an increase of 1,434 from the previous year. Among these were 19,596 fast-food chain
restaurants, 2,235 chain coffee shops, 2,749 chain restaurants, and 6,151 leisure drink chain
shops.
Table 13: Number of Establishments and Proportion of Total Number of
Establishments by Chain Type, 2010–2011
2010 2011

Benchmarking Research Project on Retail and Food Services Sectors in Asia
Asian Productivity Organization 51
Establishments Establishments
Co
mp
an
ies Regular
Chain Franchise Total
Co
mp
an
ies Regular
Chain Franchise Total
(#) (%
) (#)
(%
) (#) (#)
(%
) (#) (%) (#)
Fast Food 171 2,512 13 16,941 87 19,453 192 2,629 13 16,967 87 19,596
Coffee Shops 50 627 37 1,090 63 1,717 52 765 34 1,470 66 2,235
Restaurants 222 1,482 53 1,332 47 2,814 229 1,565 56 1,184 44 2,749
Leisure
Drinks 83 666 13 4,647 87 5,313 84 677 11 5,474 89 6,151
Total 526 5,287 18 24,010 82 29,297 557 5,636 18 25,095 82 30,731
Source: Taiwan Chain Store Almanac 2012, Taiwan Chain Stores and Franchise
Association
Subdividing them by business model, Taiwan’s food and beverage chains primarily operate
on a franchise basis. The total number of franchise establishments in 2011 was 25,095, while
the number of regular chain establishments was 5,636. The 5,474 leisure drink chain
franchise shops made up 89% of all leisure drink shops, while the 1,470 chain coffees shop
franchises made up 66% of all chain coffee shops.
There were more companies operating chain restaurants than any other type of stores in the
food and beverage industry. In 2011, there were 229 chain restaurant headquarters, an
increase of seven over the previous year. The three most common types of chain restaurants
were Hotpot restaurants, Chinese restaurants, and Japanese & Korean restaurants.
Table 14: Number of Restaurant Chains and Total Chain Restaurant Establishments in
Taiwan, 2011
Chains Total
Establishments %
Regular
Chain Franchise
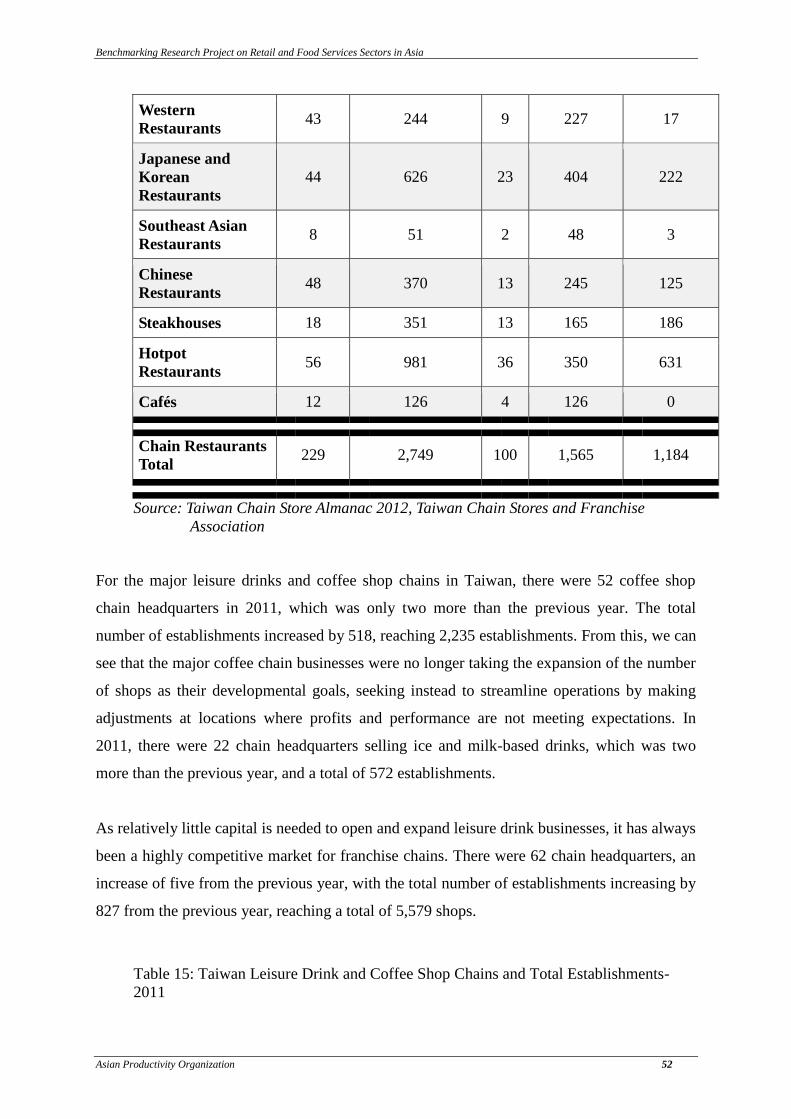
Benchmarking Research Project on Retail and Food Services Sectors in Asia
Asian Productivity Organization 52
Western
Restaurants 43 244 9 227 17
Japanese and
Korean
Restaurants
44 626 23 404 222
Southeast Asian
Restaurants 8 51 2 48 3
Chinese
Restaurants 48 370 13 245 125
Steakhouses 18 351 13 165 186
Hotpot
Restaurants 56 981 36 350 631
Cafés 12 126 4 126 0
Chain Restaurants
Total 229 2,749 100 1,565 1,184
Source: Taiwan Chain Store Almanac 2012, Taiwan Chain Stores and Franchise
Association
For the major leisure drinks and coffee shop chains in Taiwan, there were 52 coffee shop
chain headquarters in 2011, which was only two more than the previous year. The total
number of establishments increased by 518, reaching 2,235 establishments. From this, we can
see that the major coffee chain businesses were no longer taking the expansion of the number
of shops as their developmental goals, seeking instead to streamline operations by making
adjustments at locations where profits and performance are not meeting expectations. In
2011, there were 22 chain headquarters selling ice and milk-based drinks, which was two
more than the previous year, and a total of 572 establishments.
As relatively little capital is needed to open and expand leisure drink businesses, it has always
been a highly competitive market for franchise chains. There were 62 chain headquarters, an
increase of five from the previous year, with the total number of establishments increasing by
827 from the previous year, reaching a total of 5,579 shops.
Table 15: Taiwan Leisure Drink and Coffee Shop Chains and Total Establishments-
2011

Benchmarking Research Project on Retail and Food Services Sectors in Asia
Asian Productivity Organization 53
Chain Total Shops % Regular
Chain
Franchis
e
Coffee Shops 52 2,235 27 765 1,470
Ice and Milk-
Based Drinks 22 572 7 112 460
Leisure Drinks 62 5,579 66 565 5,014
Leisure Drinks
Total 136 8,386 100 1,442 6,944
Source: Taiwan Chain Store Almanac 2012, Taiwan Chain Stores and Franchise
Association
Chain restaurants in Taiwan are numerous and varied, making competition exceptionally
intense. Local Chinese food brands, such as Din Tai Fung and Shin Yeh combine the
traditional flavors of Taiwan with innovative service and are actively moving towards
internationalization. Other new types of foreign cuisines and brands, such as Wowprime, the
Namchow Group and numerous foreign franchise chains, have also cropped up and seized
much of the Taiwanese market. The influence of the economic recovery means that coffee
chain businesses have seen good growth trend in their operations. But fast-food chains,
supermarkets, and bakeries entering the market have given consumers more choices, and
forced coffee chains to focus more on increasing segmentation and differentiation of products
and services. Building on the success of the Taiwanese coffee chain industry – a mature
market with perfect competition – there have been plans for international development. For
example, the company 85°C is actively planning on expanding into the second and third-
tiered cities in mainland China. Lakaffa is one of the few coffee companies that has yet to
undergo a major expansion within Taiwan. However, it had already stepped into the west
coast of the United States, Australia, Southeast Asia, mainland China, and other overseas
markets. Leisure drinks have a strong Taiwanese character, and with the funds required to
open new locations, and the relevant ease of the related technology transfers, they have
become the vanguard of the internationalization of Taiwan’s food and beverage service
industry.
a. Revenue

Benchmarking Research Project on Retail and Food Services Sectors in Asia
Asian Productivity Organization 54
According to MOF statistics, total revenue for food and beverage service activities in Taiwan
was NT$353 billion in 2012 - with restaurants bringing in a total revenue of NT$295.8
billion, ranking first among food and beverage service activities and accounting for 83.8% of
total revenue (an increase over the previous years). As for the revenue of other activity types,
beverage service activities via shops earned revenues of NT$33.6 billion, accounting for
9.55% of total revenues (which is less than the previous years). Food and beverage service
activities via stalls earned revenues of NT$980 million, accounting for 2.79% of total
revenues (which is less than the previous years). Other food and beverage service activities
earned revenues of NT$1.36 billion, accounting for 3.86% of total revenues for food and
beverage service activities.
b. Business Units
The number of business units has been positively influenced by the relatively flexible capital
levels and skills needed to enter the food and beverage service business - making it the first
choice for entrepreneurs. The number of business units has shown a growth trend over the
years; in 2012, the total number of business units engaged in food and beverage service
activities was 109,816, with restaurants accounting for the largest number of business units at
82,201. There were 14,985 units engaged in beverage service activities via shops, 10,802
units engaged in food and beverage service activities via stalls, and 1,828 units engaged in
other food and beverage service activities.

Benchmarking Research Project on Retail and Food Services Sectors in Asia
Asian Productivity Organization 55
Table 16: Comparison of Total Revenues from and Business Units Engaged in Food
and Beverage Service Activities in Taiwan for the Years 2011-2012
Units:
New Taiwan
Dollars,
millions
2011 2012
Units (%) Revenu
e (%) Units (%)
Revenu
e (%)
Restaurants 79,193 74.51 269,989 83.03 82,201 74.85 295,870 83.8
Beverage
Service
Activities via
Shops
14,282 13.43 32,641 10.04 14,985 13.65 33,672 9.55
Food and
Beverage
Service
Activities via
Stalls
11,084 10.43 10,033 3.08 10,802 9.84 9,863 2.79
Other Food
and Beverage
Service
Activities
1,728 1.63 12,527 3.85 1,828 1.66 13,645 3.86
Food and
Beverage
Service
Activities
Total
106,287 100 325,190 100 109,816 100 353,050 100
Source: Monthly financial statistics report; DGBAS, Executive Yuan
c. Employment
Food and beverage service is an industry requiring large amounts of manpower resources.
Although there were many businesses that employed computerized operating systems or have
standardized their service, these techniques can only help increase revenues and reduce
customer waiting time to increase profits. They are unable to reduce the need for manpower.
With the current trend of the internationalization of cuisine and food and beverage businesses
there is an urgent need for upper-level and middle-level management talent, in addition to
front-line service staff.

Benchmarking Research Project on Retail and Food Services Sectors in Asia
Asian Productivity Organization 56
The number of males and females employed in restaurants and other food and beverage
service activities, as well as average salaries, increased in 2012. The total number of people
employed by restaurants in 2012 was 200,866, while other Food & Beverage service
activities employed a total of 47,669 people, giving a total of 248,535. The average salary for
restaurant employees was NT$27,926 per month in 2012, while the average salary for
employees engaged in other food and beverage service activities was NT$44,763 per month.
Comparing the average number of people employed and average salaries between the two,
one can see that while the number of persons employed by restaurants was larger than that
employed in other food and beverage service activities, the average salary is lower.
As for the percentage of males and females among people employed in restaurants and other
food and beverage service activities, there were more female than male employees in both
categories. The average salary of female employees is lower than that of male employees.
Table 17: Comparison of the Average Number of Persons Employed in Restaurants
and Other Food and Beverage Service Activities Average Salaries for the
Years 2011-2012
Units
:
New Taiwan
Dollars per
Month
2011 2012
Persons
Employed
Average
Salary
Persons
Employed
Average
Salary
Male Female Male Femal
e Male Female Male Female
Restaurant
s 84,649 109,367 29,230 28,467 87,361 113,505 29,967 26,354
Other
Food
Service
Activities
14,966 27,278 76,470 54,056 15,733 31,936 56,672 38,896
Source: Salary and Productivity Time series Data, DGBAS, Executive Yuan.
Intense competition in the food and beverage industry and increased demand from consumers
with different consumption patterns means that most food and beverage businesses operate
long business hours - with some even operating 24 hours a day. This gives rise to a greater
need for manpower compared to the other industries. In December 2012, the number of

Benchmarking Research Project on Retail and Food Services Sectors in Asia
Asian Productivity Organization 57
temporary employees employed by restaurants was 19,799, which was higher than in other
industries. The number of temporary employees in other Food & Beverage service activities
was 4,986, making these businesses second in terms of the proportion of temporary
employees among the total number of persons employed (10.46%) in comparison with other
industries.
Table 18: Number of Temporary Employees and percentage of Total Employees by
Industry
Number of
temporary
employees
Proportion of total number
of persons employed in
industry (%)
Wholesale Trade 13,258 1.35
Retail Trade 16,513 4.13
Retail Sale in Non-Specialized
Stores 15,310 10.68
Restaurants 19,799 9.86
Other Food and Beverage
Service Activities 4,986 10.46
Source: December 2012 Monthly Salary and Productivity Statistics Report,
Table 3, DGBAS, Executive Yuan.

Benchmarking Research Project on Retail and Food Services Sectors in Asia
Asian Productivity Organization 58
6.2 Profiles of Participating Food Services Companies (Republic of China)
The respondents in this food services sector were mainly cafés and simple meal restaurant
operators, restaurant operators and drinks shop operators. 49 respondents were cafés and
simple meal restaurant operators, 100 were restaurant operators and 54 drinks shop operators,
giving a total of 203 respondents. The background of these food services companies were as
follows:
I. Year incorporated
Of the cafés and simple meal restaurant operators, the longest was established 25 years ago
while the most recently established venture was two founded years ago. The longest
established restaurant operator opened 45 years ago, while the most recent addition is two
years old. The longest established drinks shop company is 30 years old while the most recent
is three.
II. Type of Businesses
The main type of business of cafés and simple meal restaurants, restaurants or drink shop
operators is ‘Private Limited’.
III. Operation Hours
The cafés and simple meal restaurants were mostly opened from 11am–10pm, the restaurants
mainly from 11am–9pm and the drinks shops mostly from 11am–10pm.
IV. Number of Stores (directly managed and franchised)
All of the cafés and simple meal operators polled had more than five branches. All of the
restaurant operators that responded had more than two branches. Drink shop operators all had
more than four branches.
V. Business Types
Benchmarking Research Project on Retail and Food Services Sectors in Asia
Asian Productivity Organization 59
The main business types of the respondents were medium-price restaurants, cafés and simple
meal restaurants (both with and without central kitchens), and other leisure drink shops.
VI. Mode of Operation
The cafés and simple meal restaurants as well as restaurants provided mainly lunch and
dinner.
VII. Franchising
Among the 203 respondents, 85% were involved in franchising, 95% were the franchise
headquarters and 5% were franchise stores.
6.3 Key Performances of Participating Food Services Companies (Republic of China)
Using the set of questionnaires specifically developed for the survey, the following data was
collected from respondents in the food services sector over the space of three years.
Financial Perspective Information of the Food Services Companies
The food and beverage service market in Taiwan is in a state of saturation. Businesses
operate primarily on a chain or franchise model, and are developing in the direction of
regionalization and internationalization to increase company profits. In recent years,
enterprises have employed a business model of using over-the-counter (OTC) securities sales
and initial public offerings (IPOs) and inter-industry and cross-industry integration to raise
funds, maintain service standards, attract more customers, and to increase competitiveness.
Since the public listing of Taiwan food and beverage service operations such as Wowprime
and 85°C, a succession of other companies in the industry have followed suit by making IPOs
or selling OTC securities, or are preparing to go public. An estimated 60%–70% of
Taiwanese chain businesses are expected to make IPOs in the next two years. Many of these
are Taiwanese enterprises that have been successful in mainland China, such as Zoe
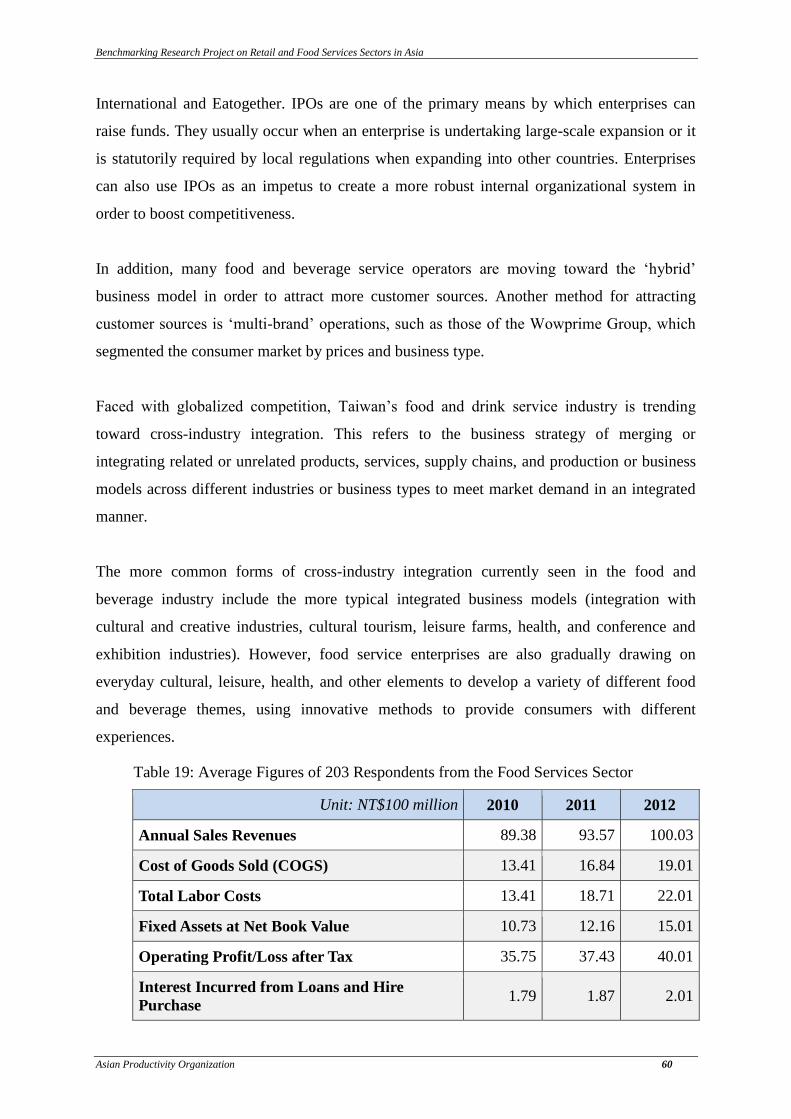
Benchmarking Research Project on Retail and Food Services Sectors in Asia
Asian Productivity Organization 60
International and Eatogether. IPOs are one of the primary means by which enterprises can
raise funds. They usually occur when an enterprise is undertaking large-scale expansion or it
is statutorily required by local regulations when expanding into other countries. Enterprises
can also use IPOs as an impetus to create a more robust internal organizational system in
order to boost competitiveness.
In addition, many food and beverage service operators are moving toward the ‘hybrid’
business model in order to attract more customer sources. Another method for attracting
customer sources is ‘multi-brand’ operations, such as those of the Wowprime Group, which
segmented the consumer market by prices and business type.
Faced with globalized competition, Taiwan’s food and drink service industry is trending
toward cross-industry integration. This refers to the business strategy of merging or
integrating related or unrelated products, services, supply chains, and production or business
models across different industries or business types to meet market demand in an integrated
manner.
The more common forms of cross-industry integration currently seen in the food and
beverage industry include the more typical integrated business models (integration with
cultural and creative industries, cultural tourism, leisure farms, health, and conference and
exhibition industries). However, food service enterprises are also gradually drawing on
everyday cultural, leisure, health, and other elements to develop a variety of different food
and beverage themes, using innovative methods to provide consumers with different
experiences.
Table 19: Average Figures of 203 Respondents from the Food Services Sector
Unit: NT$100 million 2010 2011 2012
Annual Sales Revenues 89.38 93.57 100.03
Cost of Goods Sold (COGS) 13.41 16.84 19.01
Total Labor Costs 13.41 18.71 22.01
Fixed Assets at Net Book Value 10.73 12.16 15.01
Operating Profit/Loss after Tax 35.75 37.43 40.01
Interest Incurred from Loans and Hire
Purchase 1.79 1.87 2.01

Benchmarking Research Project on Retail and Food Services Sectors in Asia
Asian Productivity Organization 61
Depreciation from Buildings, Equipment and
Machinery, etc. 11.62 12.16 13.04
Taxes (Income Tax, Property Tax, etc.) 13.41 14.04 15.03
Earnings Before Interest, Tax, Depreciation
and Amortization (EBITDA) 60.78 63.63 68.08
Current Asset 59.88 62.69 67.02
Current Liability 19.76 20.69 22.12
I. Customer Perspective Information of the Food Services Companies
Over the three years 2010–2012 the following information was gathered from 203
respondents:
a. Customer Service/Feedback System:
85.37% of the total of 203 respondents said that in the three years surveyed new solutions had
been introduced into the customer service system.
b. Channel for Customers’ complaints
87.17% of customers complained through on-site sales assistants/managers; 10.43% through
the customer service hotlines; and 2.40% through the websites/customer service mailboxes.
c. Recording of Customers’ Complaints/Feedback (Verbal or Written)
90.39% of the respondents recorded customer complaints through on-site customer
satisfaction surveys. The content of these complaints were filed in the store manager journals
and the customer management systems. The average number of complaints each year from
2010–2012 were 587, 520 and 517 respectively. All of the respondents had formal channels
and mechanisms to allow management to grasp customer complaints and suggestions.
d. Recording of Customers’ Compliments

Benchmarking Research Project on Retail and Food Services Sectors in Asia
Asian Productivity Organization 62
80.29% of respondents collected and recorded customer feedback via on-site customer
satisfaction surveys, companies’ websites and food and beverage website discussion forums.
The average annual numbers of compliments received from customers over the past three
years was positive and increased from 200 in 2010, to 350 in 2011, and 400 in 2012.
e. System to record and track the number of customers in outlet(s)
80.41% of enterprises used information systems and POS systems to record number of
customers. The average number of customers’ visits had increased significantly from 3.53
million customers in 2011 to 4.57 million customers in 2012.
f. Customer Satisfaction Surveys and Factors used
92.47% of the respondents carried out customer satisfaction surveys over the three years. The
average CSI was 83.4, 87.5 and 89.7 respectively from 2010 - 2012. The customer
satisfaction surveys focused on customer expectations, customer satisfaction and customer
complaints.
Taiwan’s food and beverage service enterprises have introduced standard operating
procedures (SOPs) - clearly defining, regulating, and strictly executing operational, service
and other processes. This had been a crucial factor in their being able to rapidly expand while
also maintaining a certain standard of service. Although standardization of work processes
was not universally applicable worldwide, suitable adjustments can be made on the basis of
the existing program to account for the varying customs and conditions of different countries,
allowing for a consistent standard of service to be maintained.
Taking Taiwan’s Wowprime as an example, standardization was the basis for replicating its
successful experience. The company listened to customers and measured its service quality.
To achieve the goal of service, the company collected over 300,000 ‘Guest Suggestion Cards’
each month to learn more about customers’ experience with their meals. When bills were
brought to customers, service staff members not only verbally asked customers how their
meal was, but also included a card with a toll-free number so that customers could give their
opinions. When dealing with the many customer opinions, complaints and suggestions, the
company first classified the problem to tackle them appropriately. When the feedback is a
Benchmarking Research Project on Retail and Food Services Sectors in Asia
Asian Productivity Organization 63
complaint, service staff needs to report the customer’s opinion to the restaurant manager,
manager, general manager, and chairman of the board within 30 minutes. The restaurant
manager then has to handle the problem within three days and the general manager was
required to personally conclude the case within seven days. Furthermore, customer
complaints were used as examples during training courses.
Data from the survey indicated that the majority of businesses conducted customer
satisfaction surveys. Each of them had established various customer complaint channels for
consumers to give feedback and used IT to systematically manage and follow-up with
customer complaints.
II. Operational Perspective Information (Food Services Sectors)
The following information was gathered over three years (2010–2012):
a. Total Areas (sq. ft.) occupied by the companies
The average area occupied increased from 1,920 sq. ft. (2010) to 2100 sq. ft. (2011) and to
2,240 sq. ft. (2012).
b. Seating Capacity
Generally, the seating capacity of the respondents had increased over the three years from
2010 – 2012 (250 seats, 278 seats and 323 seats).
c. Estimated number of table turns per day
The average daily table turns was two or three sets of customers for lunch, and three to
five for dinners.
d. percentage of sales for food and beverages
The percentages of meals and drinks over the three years were 80/20 in 2010, 75/25 in
2011 and 85/15 respectively
Benchmarking Research Project on Retail and Food Services Sectors in Asia
Asian Productivity Organization 64
e. percentage of take-away sales
Take-away meals as a percentage of sales from 2010 - 2012 were 23.38%, 37.33% and
31.41% respectively.
f. Central Kitchens
45% of the respondents have central kitchens with average areas of 4,200 sq. ft.
g. Key Success Factors (KSFs) for the companies
There were five KSFs highlighted by the respondents that were important for business
growth and competition:
i. Effective control of operating cost, goods value and expanded business scale (cited by
81.19% of the respondents as crucial)
ii. Good customer service (cited by 77.47% of respondents)
iii. Ability to satisfy customized requirements (cited by 73.03% of the respondents)
iv. Strong brand recognition (cited by 66.12% of the respondents)
v. Transportation/parking convenience (cited by 42.15% of the respondents)
h. Applications of IT systems (Technology) to enhance Productivity
2010 - 2012 had seen an increase in the average IT system expenditures and facility capital
expenditures from 1.23 million, 1.37 million and 1.45 million for the former and from 3.43
million, 3.97 million and 4.17 million for the latter.
i. 83.49% of respondents used IT systems to increase their competitiveness
ii. 85.38% used the POS system, credit card/bank card payment system, inventory system,
purchasing system and personnel shift management system
iii. 71.27% used internet sales and ERP systems.

Benchmarking Research Project on Retail and Food Services Sectors in Asia
Asian Productivity Organization 65
Supply chain management played an important role in the expansion of the food and
beverage service industry. To take chain and franchise businesses as an example, a chain
headquarters with five or more franchise locations needs to establish a distribution centre.
Having a consistent overarching strategy in terms of the import and export of ingredients,
ingredient serial numbers, warehousing and distribution systems, and the integration of
warehousing logistics systems and information systems allows the business to maintain the
supply and quality of products.
In order to rapidly and effectively satisfy the massive consumer demand for food services and
maintain stable food quality, economies of scale must be employed in kitchen work to
achieve customer satisfaction. This is the background against which the ‘central kitchen’ was
developed and has become a necessary condition for the food and beverage service business
to expand.
Automation, information and communication technologies have improved the business model
of the food and beverage service industry. Technological developments, whether in terms of
up-front operations or back-office management, have resulted in breakthroughs in the
development of products, marketing approaches, procedures, and systems to achieve greater
operational efficiency.
Data from the current survey indicates that 45% of enterprises were equipped with central
kitchens. And that 85.38% of enterprises used POS systems, credit card/debit card payment
systems, inventory systems, purchasing systems and personnel shift management systems.
71.27% of enterprises used internet marketing and enterprise resource planning (ERP)
systems. All of them used the complete supply chain of a central kitchen distribution system
and IT systems to increase overall enterprise competition.
III. Human Resource Perspective Information (Food Services Sector)
Over three years (2010–2012), the following information was gathered from 203 respondents:
a. Increased Number of Full-Time Employees

Benchmarking Research Project on Retail and Food Services Sectors in Asia
Asian Productivity Organization 66
All of the respondents had experienced significant increase in the average number of full-
time employees from 2010 – 2012 (143 employees, 256 employees and 313 employees
respectively).
b. Increased Length of Weekly Working Time
The average length of weekly working time of full-time employees from 2010–2012 was
70, 72 and 74 hours respectively.
c. Increased Part-Time Employees or Work-Cum-Study Students
95% of the respondents employed part-time workers or ‘work-study student’ employees. The
volume of part-time employees from 2010–2012 was 1120, 167 and 189 respectively. The
average working week was 24, 26 and 32 hours respectively.
d. Employee Turnover Rates
65% of the respondents performed employee turnover surveys. The employee turnover
rates for full-time employees increased from 2010–2012 (20%, 19% and 18%). However,
the turnover rates for part-time employees were moderately stable over the same period of
years (12.1%, 13% and 11.2%).
e. Education and Training
All of the respondents carried out employee education and training using actual lessons
and online teachings. The average number of training hours received by employees from
2010–2012 was 24 hours, 30 hours and 36 hours.
f. On-the-Job Training (OJT)
All of the respondents carried out OJT for their employees.
g. Incentive Mechanisms

Benchmarking Research Project on Retail and Food Services Sectors in Asia
Asian Productivity Organization 67
All of the respondents had an employee incentive system in place (profit sharing and
performance bonus). The variable pay as a percentage of salary increased from 2010 to 2012
(15%, 18% and 20%). Only 10% of respondents used non-financial methods as employee
incentives, such as employee trips and promotion systems
h. Employee Absenteeism Rates
All of the respondents computed employee absenteeism rates. There was a decreasing
average rate from 2010–2012 (from 4.7%, to 3.5% to 2.3%).
Talent cultivation had always been central to Taiwan’s manpower as the food and beverage
businesses face shortages of service staff, professional skilled staff, middle and upper
managers. Cultivating talent was done based on two major focal points:
a. Raising the social status of those employed in the food and beverage service industry – by
encouraging professionally-skilled staff to take part in international competitions and earn
international recognition, the food and beverage industry may be able to attract more
international talent and raise the standard of professional talent.
b. Cultivation of high-level management talent – there were a number of enterprises with a
large demand for talent that have established corporate universities. These companies may
inspire Taiwanese food and beverage industry education brands, attracting people from
other countries to come to Taiwan for training.

Benchmarking Research Project on Retail and Food Services Sectors in Asia
Asian Productivity Organization 68
Key Findings of Food Services Sector in Japan
7.1 Introduction and Overview of the Food Services Sector in Japan
There were a large number of food service SMEs and a variety of menu items in the Japanese
food industry. Compared to other industries, there are not as many traditional large-scale
companies or publicly-traded companies in this sector. Yet, due to the introduction of
franchise-style food chains, and prompted by a demand for efficient development of menus
and procurement of ingredients, recently there has been an observable trend of larger
enterprises entering the food industries in Japan. However, unlike in other industries, smaller
restaurants (food services SMEs) do not appear as menaced by the prospect of large-scale
brand restaurants.
The survey's respondents do not include café shop chains, fast-food shops or family
restaurants, because in Japan these food shops are owned by large-scale companies, and they
are not SMEs. In Japan, where real estates and manpower costs are high, it is difficult for
SMEs to develop multi-store operations, with long opening hours and stable menu varieties,
in terms of finance and store management.
The number of stores belonging to the respondents varies according to the size of the
enterprise. Restaurants that offer lower priced food tend to develop more stores in order to
achieve their profit levels against their high management and manpower costs
Operation hours for the majority of stores are up to 11pm in urban areas. This is because
many people in urban areas use public transportation for commuting. A small number of the
respondents - family-run or very small-scale food shops - keep their stores open until 3am. In
Japan, medium- to large-size food shops are generally open until 11pm and open again at
5am when the first public transportation starts running.
Both the shop employees and the customers usually use public transport, and therefore the
pattern of the operation hours seems efficient and sensible. Taxi fares are expensive.
However, there are food retail shops which are open 24 hours a day, but these are usually
owned by large-scale companies.

Benchmarking Research Project on Retail and Food Services Sectors in Asia
Asian Productivity Organization 69
7.2 Profiles of Participating Food Services Companies (Japan)
There were 25 respondents in this survey and their profiles are as follows:
I. Region of Respondents’ Headquarters
Region Number of Respondents
Tokyo 18
Kanagawa 3
Chiba 2
Osaka 2
II. Form of Company
All company limited (no publicly-traded companies)
III. Type of Business
Expensive restaurants: 3
Middle-priced restaurants: 10
Low-priced restaurants: 5
Cafés: 3
Take-away: 4
IV. Range of Number of Outlets
1–58 shops

Benchmarking Research Project on Retail and Food Services Sectors in Asia
Asian Productivity Organization 70
V. Menu Provided
Only dinner:8
Lunch and dinner: 8
All-day service:5
From noon to midnight: 4 (prepared food shops)
VI. Mode of business operations
Most of them were not franchises (92%); only 8% were franchisees.
VII. Business Hours
Only dinner: 5pm–11pm
Lunch and dinner: 11am–2.30pm and 5pm–11pm
All-day service: 8am–8pm
7.3 Key Performances of the Participating Retail Companies (Japan)
The following is based on data collected from the respondents in the retail sector, over three
years, using the set of questionnaires developed:
I. Financial Perspective Information of the Food Services Companies
Table 20: Average Figures of 25 Respondents from Food Services Sector
Unit: million JPY 2010 2011 2012
Annual Sales Revenues 186 – 9,622 178 – 9,474 182 – 9,912
Cost of Goods Sold (COGS) 52 – 8,725 49 – 8,605 48 – 8,701
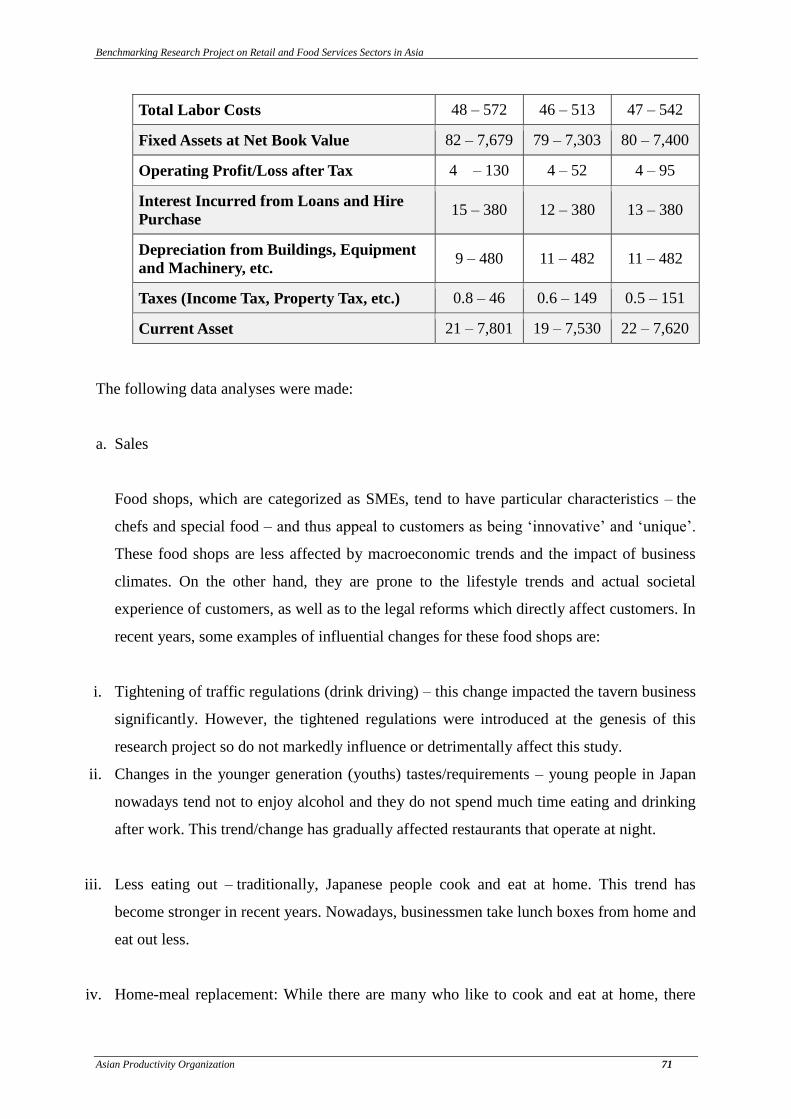
Benchmarking Research Project on Retail and Food Services Sectors in Asia
Asian Productivity Organization 71
Total Labor Costs 48 – 572 46 – 513 47 – 542
Fixed Assets at Net Book Value 82 – 7,679 79 – 7,303 80 – 7,400
Operating Profit/Loss after Tax 4 – 130 4 – 52 4 – 95
Interest Incurred from Loans and Hire
Purchase 15 – 380 12 – 380 13 – 380
Depreciation from Buildings, Equipment
and Machinery, etc. 9 – 480 11 – 482 11 – 482
Taxes (Income Tax, Property Tax, etc.) 0.8 – 46 0.6 – 149 0.5 – 151
Current Asset 21 – 7,801 19 – 7,530 22 – 7,620
The following data analyses were made:
a. Sales
Food shops, which are categorized as SMEs, tend to have particular characteristics – the
chefs and special food – and thus appeal to customers as being ‘innovative’ and ‘unique’.
These food shops are less affected by macroeconomic trends and the impact of business
climates. On the other hand, they are prone to the lifestyle trends and actual societal
experience of customers, as well as to the legal reforms which directly affect customers. In
recent years, some examples of influential changes for these food shops are:
i. Tightening of traffic regulations (drink driving) – this change impacted the tavern business
significantly. However, the tightened regulations were introduced at the genesis of this
research project so do not markedly influence or detrimentally affect this study.
ii. Changes in the younger generation (youths) tastes/requirements – young people in Japan
nowadays tend not to enjoy alcohol and they do not spend much time eating and drinking
after work. This trend/change has gradually affected restaurants that operate at night.
iii. Less eating out – traditionally, Japanese people cook and eat at home. This trend has
become stronger in recent years. Nowadays, businessmen take lunch boxes from home and
eat out less.
iv. Home-meal replacement: While there are many who like to cook and eat at home, there

Benchmarking Research Project on Retail and Food Services Sectors in Asia
Asian Productivity Organization 72
are many single-person households where people prefer a simpler way of food preparation
– i.e. purchasing ready-made meals.
v. For the above reasons, restaurants in Japan have made extra efforts to maintain their sales
revenues. With the increasing number and types of restaurants offering varied menu items,
and in a culture where less people eat out and lifestyle requirements are shifting, it is
becoming harder for restaurants in Japan to be successful and to operate stably over a long
period of time.
b. Sales Ratio to COGS
The ratio tends to range between 35%–40% against COGS. For cafés, it is around 25%.
Those restaurants that serve fish dishes were affected by volatile price changes and as such
the ratio was on average higher (about 40%) due to the shorter shelf-life of the fresh food.
c. Total Labor Cost Ratio to COGS
The respondents divulged a rate of approximately 25% on average, which is relatively high in
comparison to retail businesses – which can operate on mail orders. The reason for a high
total labor cost ratio for food services business was that they have to stay open during low-
peak periods. The traditional restaurants offering a high-level of services tended to have
greater labor costs, and the ratio for such traditional restaurants was above 30% (as per our
respondents’ feedback). In the case of restaurants in Tokyo, the ratio was high because Tokyo
Municipality stipulates that the minimum wage is relatively high for part-time workers (i.e.,
837 JPY per hour is the lowest), who are usually the main labor sources for food services. In
the Tokyo city center, the average part-time pay is about 1,000 JPY per hour during the
daytime.
d. Changes in Net Tangible Asset over the Three Years
Generally speaking, there were no significant changes in net tangible assets for all of the
respondents over the three years covered in this research.
e. Sales Ratio to Operating Profit/Loss after Tax

Benchmarking Research Project on Retail and Food Services Sectors in Asia
Asian Productivity Organization 73
The ratio ranged on average between 3%–8% with the majority recorded between 4%–5%.
Smaller companies recorded higher rates as they were more successful in controlling and
reducing the cost of labor as well as shortening opening hours. The bigger restaurants
operated on a low-margin, high-turnover basis. Food services businesses are usually labor-
intensive.
f. Current Liability Analysis
In Japan, SMEs are not legally obliged to disclose this information and therefore it is difficult
to collect. There were five SMEs which responded to this item, and the respondents were all
operating on a ‘pay as you go’ basis. This suggests two possible situations – either they are in
healthy company management or it is difficult for the SMEs to obtain low-interest financing
from banks.
g. Rate of Depreciations
The respondents recorded the rate to be approximately 3% of the total sales, on average.
II. Customer Perspective Information of the Food Services Companies
a. Customer Services/Feedback System
Restaurants, like retail shops, have recently introduce the Point Card Service – a system that
allows customers to accumulate points, as per their shopping, and use them to get discounts
on services. Generally speaking, it is the restaurants that serve lunch and are likely to have
repeat customers that tend to adopt the Point Card Services. Nine respondents used the Point
Card Service, out of which three reported that they had introduced the system three years ago.
The difference between the system in restaurants and retail shops is that restaurants’ Point
Card System is very analogue in nature (e.g. stamp cards), and does not use IT innovations.
This is because restaurant owners do not readily invest in equipment, assets, infrastructures
etc.

Benchmarking Research Project on Retail and Food Services Sectors in Asia
Asian Productivity Organization 74
Other than the Point Card Service, the following incentives were listed as services provided
by the respondents for their customers:
Free drink service for customers who ordered from the lunch menus
Serving of wine or similar beverage for those customers celebrating their birthdays
Discount coupons
Over the past three years, there has been an aggressive and proactive introduction of discount
coupons distributed throughout news and gourmet websites by the majority of middle-priced
restaurants.
b. Channel for Customer Complaints
20% of respondents received complaints via emails, mobile phones and through suggestion
boxes. However, the majority of restaurants received complaints directly on site. Restaurant
operations need to be very service-oriented to handle feedback with operators facing
complaints in areas such as quality and quantity of food offered and the attitude of waiters
and waitresses.
Restaurants are service industries. The quality and quantity of food they offer, as well as the
attitude of waiters and waitresses, are subject to complaints and these complaints must be
dealt with efficiently and to the satisfaction of the customers, on site. Even the 20% of
respondents who received their complaints via indirect media would not proactively
encourage customers to send complaints through such channels.
c. Recording of Customers’ Complaints/Feedback (Verbal or Written)
The majority (80%) of respondents kept records of customer complaints/feedback. For the
minority (20%) who did not keep record of complaints about quality and quantity, records of
feedback on critical issues such as food poisoning, were retained.
Only three of the respondents kept the record of complaints in a proper data system. The rest
usually keep records in Excel or Word documents.

Benchmarking Research Project on Retail and Food Services Sectors in Asia
Asian Productivity Organization 75
Recorded information comprises:
Reported food security information (food poisonings and stomach aches caused by the
food)
Complaints on taste of food and the way the food was prepared (e.g. cold)
Complaints on missing menus
Complaints on service attitude
Complaints on speediness
d. Recording of Customers’ Compliments
None of the respondents recorded compliments. The reason behind this was that many
Japanese food service companies do not understand the criteria of a ‘compliment’.
Restaurants are the kind of business where the opinion of customers can be easily monitored
on site. The respondents commented that if customers wanted to pay a compliment, they
could convey it directly to the service providers instead of doing it in a written form.
e. System to record and track the number of customers in outlets
Sixty four % of the respondents captured and recorded the number of customers on the POS
System. 36% of the respondents did not capture this data. The volume/number of customers
appear dependent on the size of the company, opening hours and food they offered, and
therefore it was not so meaningful to get an average figure of the number of customers of the
various sample companies under this research.
The following charts the shift of customer numbers, per type of restaurant, over the three
years:
Only dinner (taverns): average 60 customers/day/restaurant; over the three years, slight
decline in number.
Lunch and dinner: average 90 customers/day/restaurant; over the three years, status quo.
All-day café (average-priced): 100 customers/day/café; over the three years, slight decline.
Taverns that are only open at night experienced a larger decline of customer numbers, while
restaurants kept their customer numbers relatively stable. In big cities, taverns are facing
Benchmarking Research Project on Retail and Food Services Sectors in Asia
Asian Productivity Organization 76
extinction by the new-style bar and food stands.
f. Customer Satisfaction Surveys and Factors Used
The majority of respondents (80%) did not conduct customer satisfaction surveys. Those who
did (20%) gathered information on customer satisfaction via questionnaires that they
distributed. None of the respondents have used a set of ‘factors’ or quantifiable indexes to
assess the overall customer satisfaction and compute the customer satisfaction index.
III. Operational Perspective Information for the Food Services Companies
a. KSFs for the companies
There were six KSFs highlighted by the respondents that were important for business growth
and to be competitive:
I. Good-quality product according to customers’ requirements (48%)
II. Good customer service (16%)
III. Scale of operations e.g. multiple store and locations (12%)
IV. Value for money (8%)
V. Strong reputation/brand name (8%)
VI. Low operating cost (8%)
b. Rate of Seat Turn per Day
i. Middle to high-class restaurants
average 2.2 turns (dinner only)
average 8 turns (lunch and dinner)
ii. Café: average 5.4 turns
iii. Take-out (with eat-in space): average 5.8 turns
Over the three years, the only ventures showing an increase of covers are take-out with eat-in
space. For cafés, the seat turn rate remained stable, while restaurants’ seat turn rate tended to
be lower.

Benchmarking Research Project on Retail and Food Services Sectors in Asia
Asian Productivity Organization 77
c. Ratio of Food Menu against Drink Sales
i. Restaurants offering alcohol: 7:3 (food:drink ratio)
(Note: for taverns, food is 60%)
ii. Café: 2.5:7.5 (food:drink ratio)
iii. Take-out: 9:1 (food:drink ratio)
Over the three years, only those restaurants offering alcohol increased the ratio of food they
served. Other than that, there was no change in trends, as above.
d. Central Kitchen Facilities
Only a minority (12%) had central kitchens, where they cooked the food items and then
kept them in appropriate temperatures in their take-out restaurants.
e. Applications of IT Systems to Enhance Productivity
The extent of technology applications among the respondents to increase their
competitiveness are as follows:
i. 64% use the POS system
ii. 72% use the credit card system
iii. 24% use the inventory management system
iv. 4% use the net sales system
Except for franchise restaurants, there are no SME restaurants that invested in information
technology. In the past three years, innovative IT systems have only really been introduced
for large companies.
f. Capital Investment Other than for IT
It has been difficult to obtain an average for all samples, because the size of such investment
varies, depending on the company. Also, when analyzing the tendency and size of capital
investment, it comprises of investments for both tangible and intangible assets. Hence, the
Benchmarking Research Project on Retail and Food Services Sectors in Asia
Asian Productivity Organization 78
range of capital investment may widely vary. Generally speaking, investment size is larger for
those retailers who have established new outlets or developed new business.
IV. Human Resource Perspective Information for the Food Services Companies
a. Number of Permanent Employees and their Working Hours
Generally, the range of number of employees over the three years has been constant:
FY 2010: 4–148 employees
FY 2011: 4–160 employees
FY 2012: 3–172 employees
The working hours (per week) of permanent employees are tabulated as follows:
FY 2010: average 48.2 hours/week
FY 2011: average 48.8 hours/week
FY 2012: average 49.6 hours/week
This data showed that the workload per person, over the three years, had become longer. This
was due to utilization of part-time staff for reducing labor costs and ensuring staff rotation, as
well as a reduced number of service staff/back-office employees. Food service employees
tend to work, in general, eight hours per day and six days per week.
This working pattern is more labor intensive than the office worker’s working style, which is
usually eight hours per day and five days a week. This situation is considered to be caused by
the fact that the food services sector utilizes part-time employees.
b. Number of Working Hours of Part-time Employees
Among respondents, the largest number of part-time staff was employed by, high turnover,
take-out food services with multiple shops.
FY2010: Average 18–1280 employees
FY2011: Average 20–1380 employees
FY2012: Average 30–1450 employees

Benchmarking Research Project on Retail and Food Services Sectors in Asia
Asian Productivity Organization 79
These shops operated long opening hours, and therefore managed their shop operations
through shift work manned by many part-time workers. For that reason, the number of part-
time workers for such businesses was larger; although the actual working hours per part-time
employee was not necessarily that long.
The working hours (per week) of part-time employees are tabulated as follows:
FY 2010: average 20.2 hours
FY 2011: average 21.6 hours
FY2012: average 21.8 hours
From the data above, we can see that the working hours (per week) of part-time employees
have increased over the three years. University students form the core of part-time workers
for the food services sector, however, recently, housewives and job-hopping part-timers have
become the main source of workers for the sector. As the sector primarily operates by shift
work, the working hours per part-time worker may not be too long.
c. Record of Staff Turnover Rate
Although many of the respondents shared that they do record the number of retired persons
internally, none of them record their staff turnover rate.
Compared with other sectors, the food services sector has one of the highest staff turnover
businesses. Family owned food service shops responded that they do not keep a record of
staff turnover, but they indicated that the rate was very low.
d. Training Program
Only 20% of the respondents reported that they gave training to those who have the potential
to become future store managers, but do not give training to every employee. None of the
respondents recorded training hours of employees.
e. On-the-Job Training (OJT) Programs for New Employees

Benchmarking Research Project on Retail and Food Services Sectors in Asia
Asian Productivity Organization 80
Most of the respondents (84%) do not provide OJT for new employees. Of the 16% who said
that they provided OJT, only 8% provided programed OJT. Their programed OJT was simply
to refer and check with the work manuals established. Most employees learn during their
daily work routines.
f. incentive System as per Operational Performance Results
None of the respondents have implemented the incentive system. A small number of them
responded that they sometime gave small incentive tips but this was not systemized.
g. Non-Cash Incentive System
Most (88%) respondents do not have a structured non-cash incentive system. Only 12% of
the respondents reward employees for perfect attendance regardless of their performance.
Some of them gave birthday presents for part-time employees but none of these incentive
actions were systemized.
h. Absenteeism Rate
None of the respondents systematically kept records of absenteeism rate as a standardized
indicator, although some automatically collect the data for calculating employees’ salaries.

Benchmarking Research Project on Retail and Food Services Sectors in Asia
Asian Productivity Organization 81
Key Findings of Food Services Sector in Malaysia
8.1 Introduction and Overview of the Food Services Sector in Malaysia
Generally, Malaysia’s food service industry is as diverse as its culture, with a wide range of
processed food of Asian origin. The food processing industry and services are predominantly
Malaysian-owned and the food services sector is dominated by small- and medium-scale
companies.
The food services sector serves to sustain the economic growth of the country and is
recognized as having the potential to propel the Malaysian economy forwards. In the same
interest, this sector also promotes local and international foods and services from Malaysia. It
provides strong multiplier effects in contributions to the Gross National Income (GNI) in
2020 and plays an important role in assisting Malaysia to achieve high-income status.
In general, Malaysia is one of the countries that emphasize the growth of its food services
sector. With the increase of Malaysian economic growth, this sector is being classified into a
few categories of business ownership, such as the sole proprietor, partnership, private limited
and public listed. In this research, twenty SMEs were identified and eighteen of them were
sole proprietors. One of the respondents was a partnership and another one a private limited
company.
8.2 Profiles of Participating Food Services Companies (Malaysia)
The breakdown of the respondents in each of the business types is shown in the table below:

Benchmarking Research Project on Retail and Food Services Sectors in Asia
Asian Productivity Organization 82
Table 21: Type of Food Services Sector Respondents
Type of Business Business Type Mode of Operation
Sole
Proprietor 18 Fine Dining Restaurant
0 Breakfast only
1
Partnership 1 Mid-Price Dining Restaurant 1 Lunch only 1
Private
Limited 1 Casual Dining Restaurant
1 Dinner only
0
Public Listed 0 Fast Food Restaurants 2
Breakfast and Lunch
only 4
Food Caterers
4
Breakfast and Dinner
only 1
Café, Coffee House, Snack Bar
(With a Central Kitchen) 2 Lunch and Dinner only
1
Cafés, Coffee House, Snack Bar
(No Central Kitchen) 1
Whole Day
(Breakfast, Lunch and
Dinner) 3
Food Court, Coffee Shop, Eating
House (With Mainly Food and
Beverage Income) 2
Others
12
Pub (Including Bar) 0
Other Restaurants, Cafés and Bars 6
Canteen 1
8.3 Key Performances of the participating Food Services Companies (Malaysia)
The key performances of the participating companies were reviewed using the four key
perspectives of financial, customers, operational and human resources.
I. Financial Perspective Information of the Food Service Companies
In this study, the following four financial indicators were used – VA-to-sales ratio, labor cost
competitiveness, working capital ratio and profit margins.
The VA-to-sales ratio, which refers to the proportion of sales created by the organization over

Benchmarking Research Project on Retail and Food Services Sectors in Asia
Asian Productivity Organization 83
and above purchased materials and services, was noted to be on average 0.68.
As for the efficiency and effectiveness of the organization in term of its labor cost, a
relatively high score of 8.0 was recorded based on data from respondents.
The average profit margin that was computed from the respondents was 52%.
II. Customer Perspective Information of the Food Services Companies
For the CSI, it was noted that a medium score of 0.58 was experienced from the respondents.
This signals additional effort needed by the respondents in servicing their customers.
III. Human Resource Perspective Information for the Food Services Companies
The study showed that not many of the respondents had taken the initiative of providing
training for their employees to enhance their competencies – only some of them measured the
training hours per employee as per their staff policy.

Benchmarking Research Project on Retail and Food Services Sectors in Asia
Asian Productivity Organization 84
Key Findings of Food Services Sector in Singapore
9.1 Introduction and Overview of the Food Services Sector in Singapore
The food services3 sector comprises 6,500 establishments employing around 102,000
workers4. Measured by value added per worker, the productivity level of food services is
S$26,000 respectively, less than the services sector’s average of S$97,000.
There are five key sub-sectors under the food services sector:
Restaurants
Cafés, food court and kiosks
Pubs and bars
Fast-food restaurants
Food caterers
9.2 Profiles of Participating Food Services Companies (Singapore)
27 SMEs from the food services sector participated in the benchmarking study. Their average
annual sales turnover was S$40.2 million.
Data on key productivity indicators was collected from the companies, and more in-depth
interviews were conducted with a selected group of companies to identify best practices for
productivity. As not all companies measure all of the indicators identified for the cross-
country assessment in the same manner; the analysis performed focused mainly on the
financial indicators.
3 Food services cluster refers to food and beverage services excluding hawkers and stall-holders
4 Source: Department of Statistics, 2011
Benchmarking Research Project on Retail and Food Services Sectors in Asia
Asian Productivity Organization 85
9.3 Key Performances of Participating Food Services Companies (Singapore)
I. Financial Perspective Information of the Food Services Companies
Generally, the respondents focused more on the key financial data such as typical financial
indicators (e.g. sales, costs and profits) to manage their businesses instead of analyzing their
financial statements to determine the key productivity indicators. It was noted that
productivity is not ‘top of the agenda’ for respondents, and most of them did not understand,
measure or keep track of productivity indicators (e.g. the VA) per worker. To the majority of
companies, opening new outlets/stores was the preferred way of increasing sales revenue.
The companies were weak in converting sales to value added, which indicated scope for them
to better control their costs and optimize the use of their resources. The top three expenses for
the food services companies were:
a. Cost of goods sold
b. Labor costs
c. Rental cost
II. Customer Perspective Information of the Food Services Companies
From the research study, it was found that many food services companies do not have clear
definitions or consistent business models to support their operating concepts. Most of them
offer similar products to their competitors (e.g. offer set meals during lunch hours). They
usually target families as their key customers. Some companies were able to differentiate
their concepts from their competitors, but the concept or value proposition was not applied
consistently throughout the company.
For the larger-sized respondents (SMEs) it was noted that they have put in place customer
management systems to collect feedback, compliments and complaints. Some of the
respondents conduct customer satisfaction surveys and mystery shopping exercises as well.
Where these customer-related activities were undertaken, it was noted that the companies
usually do not make good use of the information collected to improve their operations,
product offerings and pricing levels. Most of the companies tended to focus mainly on costs
instead of determining what customers were willing to pay for their products and services. As

Benchmarking Research Project on Retail and Food Services Sectors in Asia
Asian Productivity Organization 86
such, the emphasis was to study and compete based on price comparison with your
competitors.
III. Operational Perspective Information for the Food Services Companies
All of the food services companies relied heavily on manual labor in their daily business
operations. The use of technology and even a basic automation system was very low. An
example was the labor-intensive food preparation and serving process which relied largely on
manpower. At the present moment, most companies have not objectively analyzed the
advantages and potentials of central kitchens. Due to perceived challenges some were
reluctant to start a central kitchen as they considered their processes to be highly customized.
Some companies who do have central kitchens have yet to benefit from cost savings due to
the under-utilized capacities in their central kitchens.
IV. Human Resource Perspective Information for the Food Services Companies
It was noted that the respondents who had participated in the study have in place basic human
resource management systems to recruit, train and compensate their employees. However, the
sectors have not made use of part-timers effectively to meet the demand fluctuations of their
businesses. Manpower planning and deployment were not well structured and implemented
due to several of the factors that the companies were facing. The incentive structures tend to
be tied solely to sales, with weak alignment to business strategies and areas such as
teamwork.

Benchmarking Research Project on Retail and Food Services Sectors in Asia
Asian Productivity Organization 87
Best Practices
Based on the references from related literatures, the common characteristics of the retail and
food services sectors and the key best practices can be summarized as follows:
I. Organization Culture
Excellent enterprises that have employees with good service attitude possess a ‘family’ style
of management and a happy working environment, with most of them having the deep belief
that ‘happy employees lead to satisfied customers’.
The role cognition and self-management of service providers often influence their service
attitude. In these flagship enterprises, the employee is treated as ‘boss’ in representing their
company as they fulfill their obligations to serve their customers diligently. Employees were
encouraged to be autonomous and to make every effort to preserve their professional service
image and improve the service level. They are taught not to readily say ‘no’ to customers and
to ‘think before the customer does’.
II. Customer Service Attitude
Excellent enterprises that achieved a high level of customer satisfaction had made a great
effort to improve ‘service attitude’, to strengthen their competitive advantage. Service attitude
is thus an effective enabler and indicator of service quality. Service attitude is thus receiving
greater attention to meet growing customers’ requirements and expectations besides facilities,
product offerings and prices.
It had been acknowledged that while service attitude is explicit in nature and difficult to
measure, enhancing its level will bring intangible advantages such as increased customer
compliments and reduced customer complaints. Service attitude is a ‘two-way’ process, with
‘empathy’ as a key enabling factor. Thus, managers of enterprises often use ‘role swapping’
by putting employees in different positions to achieve the desired service concepts and
modify service attributes and the mentality of their employees.
III. Recruitment Policy

Benchmarking Research Project on Retail and Food Services Sectors in Asia
Asian Productivity Organization 88
When excellent enterprises select and recruit new employees, their service attitudes are
measured through interview observations of personality and characters as well as by
exchanging opinions about habits, ideas and values. Potential employees with major
shortcomings in personality or attitude will not be recruited.
The molding of service attitudes for new employees begins early by their managers through
regular chatting, observation of their attitudes, eye contacts and through early education and
work habit cultivation. Most service attitude education is carried out through ‘observation
and emulation’ where people are engaged in social learning and behavioural modelling. New
employees are also paired with experienced employees who pass on their skills and
knowledge through demonstrations and OJT approaches. These practices were found to be
the most effective ways of teaching.
Senior employees and basic level managers can have an extremely important role to play in
‘attitude’ education through an ‘apprentice’ or ‘nanny’ system where they guide new
employees for one to three months using different methods to lead and persuade. Attitude
development is also being carried out by using videos (attending classroom sessions),
handbooks (teaching materials) and implementation (execution) via three-in-one training and
one-to-one demonstrations/observations.
Through a managerial process of ‘leading by example’, experiences are passed on and
emulated by subordinates, which results in enhanced employee service attitude.
IV. Communication by Leaders
Excellent enterprises were found to correct and improve service attitude through
encouragement, guidance and sharing as well as attaching importance to future performance.
It was found that the key to service attitude correction was not merely paying attention to
apportioning responsibility and blame for external realities, but to adjust, changing and
guiding the mentality of the service providers.

Benchmarking Research Project on Retail and Food Services Sectors in Asia
Asian Productivity Organization 89
In terms of management methods, it was found that the better organizations provide guidance
to their employees through positive encouragement instead of negative reinforcement and
punishment. Examples of positive approaches and steps to improve attitude comprise:
Thinking of employee’s good and positive points
Affirming employee’s good points and actions
Putting forward questions
Thinking of solutions
Putting thoughts in writing
Enterprises that employ people with good service attitudes were found to perform these steps
very often together with their managers, due to their long-term insistence on leading by
examples and providing good leadership role models. These regular practices give rise to
enhance service attitude reputation and corporate image.
V. Performance Assessment and Rewards
The service attitude performance evaluations used by excellent enterprises attach great
importance to encouragement and rewards, measurement and evaluation of internal and
external customers and key stakeholders. Various reward mechanisms and schemes were
provided at appropriate times.
Performance evaluations were used as the enterprises’ communication, encouragement and
reward tool. Various forms of evaluation were carried out through practices and feedback
mechanisms such as opinion cards, management by walking around and visiting with
customers.
Other best practices that enterprises adopted include:
Generous rewards and public praise for employees who received high regards and good
feedback from customers.
For employees who had made mistakes in their effort to serve customers, managers will
first give their support and thereafter share their experience and views to address them.
Performance evaluation is positioned as searching for the crux of problems, looking for
the foundation facts, finding answers and thereafter making significant improvements.
Benchmarking Research Project on Retail and Food Services Sectors in Asia
Asian Productivity Organization 90
Proactive actions by employees to ask customers to rate their performances.
VI. Workflow and Standard Operation Procedures (SOPs)
In order to ensure the performance of the staff at its optimum level, Standard Operation
Procedures (SOP) had been planned to ease the workflow for the employees. The SOPs
contain necessary work instructions, procedures for the maintenance of equipment, account
management, etc. This created a conducive working environment for all.
VII. Meeting Customer Requirements
To ensure that consumers are comfortable when visiting an outlet, a lifestyle concept has
been introduced to meet the needs and aspirations of the young and career minded customers.
Location of the outlet was carefully and strategically chosen to better serve the targeted
customer segments/markets.
VIII. Reduction of Staff Turnover
Systems have been incorporated to stipulate job descriptions and roles of each employee
clearly, thereby helping employees to better understand their roles in detail through a
structured training and learning process. These systems have enhanced employee’s working
experience and led to greater staff satisfaction and lower staff turnover.
Benchmarking Research Project on Retail and Food Services Sectors in Asia
Asian Productivity Organization 91
IX. Effective Cost Control to Maximize Revenues and Profitability
An integrated automated system helps to monitor and review company’s and franchisee’s
performance on a regular basis to ensure the business performance results are on par with the
target (key performance indicators) established. Key processes were being scrutinized closely
to reduce and/or eliminate unnecessary wastes (the seven types of wastes comprising
transportation, inventory, motion, waiting, overproduction, defects and processing).
X. Innovation and Creativity
Principle, such as ‘tolerance to mistakes’, has been introduced, and policies established for
employees to have time for experimenting with new practices to create new products and
service offerings.

Benchmarking Research Project on Retail and Food Services Sectors in Asia
Asian Productivity Organization 92
Recommendations
Based on this research study, the team noted that numerous approaches could be adopted by
the SMEs in both the retail and food services to improve their business performance
(financial, customer results, operational results and human resources results) through the
following recommendations:
I. Improving Financial Results
a. Focus on tracking and reporting the VA to review the wealth generation of the company,
in addition to the commonly-used sets of financial indicators. From the computed VA and
financial indicators, the companies will be able to review and improve their labor
productivity and capital productivity, labor cost, competitiveness and profitability to
become more competitive and to achieve sustainable business growth.
b. Link the financial indicators with the other three perspectives of performance indicators so
that the company can better align themselves to business strategies. The management
could share findings with their outlets/store managers so that they could motivate their
employees towards achieving the company’s objectives by setting departmental KPIs. The
KPIs identified and the data collected could be used to develop strategic action plans
within the organization, linked to an employee incentive structure.
II. Improving Customer Results
a. SMEs could cultivate customer loyalty to generate greater customer spendings by
upselling and differentiating themselves from their competitors. They could increase
average transaction value by bundling products, displaying complementary product
offerings next to each other and creating customer loyalty programs to retain existing
customers and attract new customers.
b. The customer-centric experiences should be developed based on customer insights (e.g.
data collected from surveys and mystery shopping exercises).

Benchmarking Research Project on Retail and Food Services Sectors in Asia
Asian Productivity Organization 93
c. Companies could also develop and leverage on multiple channels to drive productivity and
enhance customer experiences.
d. Companies could better explore and leverage on technology and e-commerce (such as
social media and the Internet) to promote their products and drive traffic to their stores.
This will then help to mitigate rising rental costs and extend their reach to new markets.
III. Improving Operational Results
a. Companies could optimize their processes and workflows. This could be done by
standardizing operations across retail and food services stores/outlets, streamlining low-
value and administrative tasks and implementing 5S Housekeeping practises.
b. Companies could also analyze and redesign their menu items (food services) and product
offerings (retail) to improve management of inventory and streamline processes.
c. Companies could make greater use of technology to improve productivity such as:
Simple IT systems to process invoices so as to minimize human errors
Integrated POS systems for better management of inventories
Self-ordering and self-checkout systems to reduce reliance on manpower
Customer relationship management (CRM) systems
Enterprise Resource Planning (ERP) systems
IV. Improving Human Resources Results
a. Optimizing work schedules to efficiently allocate manpower to meet customer demand
while reducing overall labor requirements. Labor scheduling should be data-driven (e.g.
based on POS/ historical data and sales forecasts).
b. Making better use of part-timers to increase flexibility so as to ensure sufficient
manpower during peak periods, and reduce excess labor during lull periods.
Benchmarking Research Project on Retail and Food Services Sectors in Asia
Asian Productivity Organization 94
c. Complementing the use of part-timers with a structured training system and
comprehensive standard operating procedures to ensure consistency in service.
d. Implementing comprehensive training programs across all job functions and different
levels of employees. In addition to supporting their employees to attend external
training programs, the companies could also put in place in-house training curriculum
customized to the concept of the stores.
e. Aligning compensation and benefits packages with business objectives to better retain
employees and reduce staff turnover. The incentives programs should encourage profit
maximization and productivity improvement, instead of just sales maximization.
f. Using non-monetary incentives to reward desirable behaviors (e.g. learning trips and
awards).
Benchmarking Research Project on Retail and Food Services Sectors in Asia Appendix A
Asian Productivity Organization 95
Conclusion
As this is the first APO Benchmarking Research Project in the retail and food services sectors
in Asia, several interesting and valuable learning insights have been achieved:
I. While it was noted that the Benchmarking Process is a powerful and proven methodology
to enhance continuous and breakthrough improvements, it was noted that companies were
generally cautious and concerned about data and information of their companies being
made public due to the highly competitive business environment in these two sectors.
As such, in order to motivate companies to take part in this research project, a common
approach has been taken to assure that specific company’s information would not be
mentioned in the findings. In particular, financial perspective information and data of the
other three perspectives will only be expressed as overall averages and not based on
individual company’s figures.
II. Due to the different business environment and practices, each country has their own
specific definitions and categories of the sub-sectors in the retail and food services sectors
that are linked to their national statistics from the Department of Statistics.
III. Generally, most of the SMEs in the four countries do not have a structured approach
for collecting, analyzing and sharing key organizations’ data and information, besides the
basic financial data. Also, the applications and practices differed from each of the
countries.
IV. While the VA, number of companies and the employment size of the two identified
sectors are available at the national level, this data and information are not further
segmented and categorized into the corresponding sub-sectors within them. This makes it
difficult for the SMEs in each of the sub-sectors in the retail and food services sectors to
compare and benchmark each other for continuous and breakthrough improvements due to
the wide variation of their companies’ structures and sizes.
V. It was insightful to note the numerous interesting best practices and achievements that
were found among the SMEs, in both the retail and food services. Adaption and

Benchmarking Research Project on Retail and Food Services Sectors in Asia Appendix A
Asian Productivity Organization 96
implementation of these best practices will help enhance competitiveness which will lead
to sustainable business growth of the SMEs in the years ahead.
As this is the first Benchmarking Research Project, every effort has been taken by the
research team to develop and endorse a framework and structure of benchmarking; to define a
holistic set of key performance indicators based on the four perspective of balanced
scorecard; and to design a comprehensive set of questionnaires to gather additional data. It is
the hope of this project that the findings and the framework will be beneficial for the follow-
on research projects for other business sectors in the years to come.
Thanks go to all of four national experts – Dr. Eugene Lin, Ms. Kaori Yoshida, Mr.
Mohamad Sahril and Ms. Loo Ya Lee – for their personal contributions and efforts in making
this research project possible.
Appreciations also go to APO for the opportunity for us to work together on this project. A
special mention and thanks to Ms. Yasuko Asano, APO Program Officer, Research and
Planning Department, for her invaluable assistance and support throughout this
benchmarking research project for the retail and food services sectors.

Benchmarking Research Project on Retail and Food Services Sectors in Asia Appendix A
Asian Productivity Organization 97
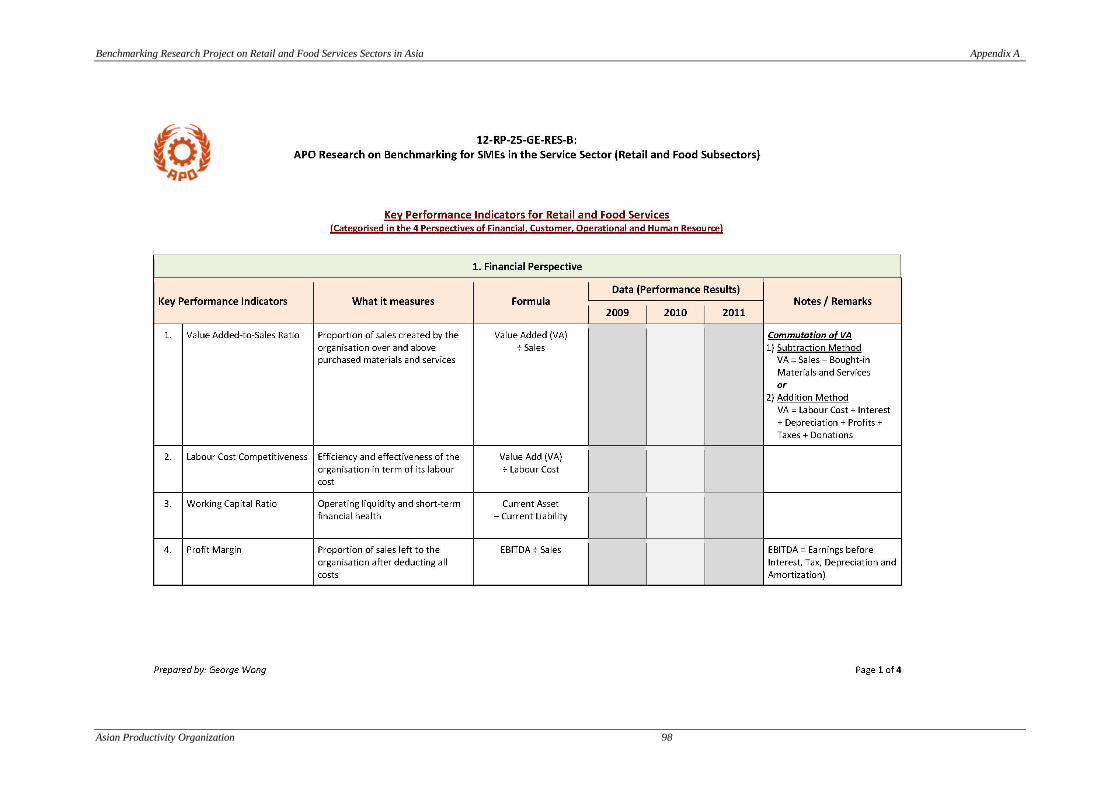
Benchmarking Research Project on Retail and Food Services Sectors in Asia Appendix A
Asian Productivity Organization 98
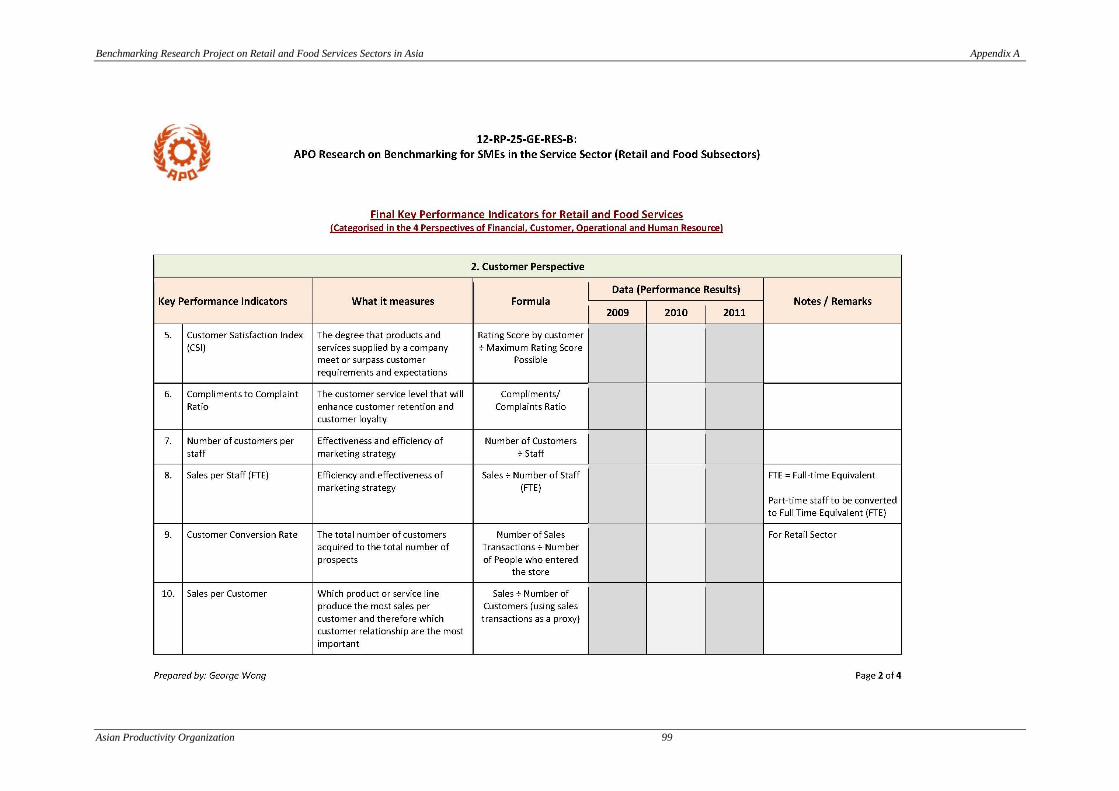
Benchmarking Research Project on Retail and Food Services Sectors in Asia Appendix A
Asian Productivity Organization 99

Benchmarking Research Project on Retail and Food Services Sectors in Asia Appendix A
Asian Productivity Organization 100

Benchmarking Research Project on Retail and Food Services Sectors in Asia Appendix A
Asian Productivity Organization 101

Benchmarking Research Project on Retail and Food Services Sectors in Asia Appendix A
Asian Productivity Organization 102
Benchmarking Research Project on Retail and Food Services Sectors in Asia Appendix B
Asian Productivity Organization 103

Benchmarking Research Project on Retail and Food Services Sectors in Asia Appendix B
Asian Productivity Organization 104

Benchmarking Research Project on Retail and Food Services Sectors in Asia Appendix B
Asian Productivity Organization 105

Benchmarking Research Project on Retail and Food Services Sectors in Asia Appendix B
Asian Productivity Organization 106

Benchmarking Research Project on Retail and Food Services Sectors in Asia Appendix B
Asian Productivity Organization 107
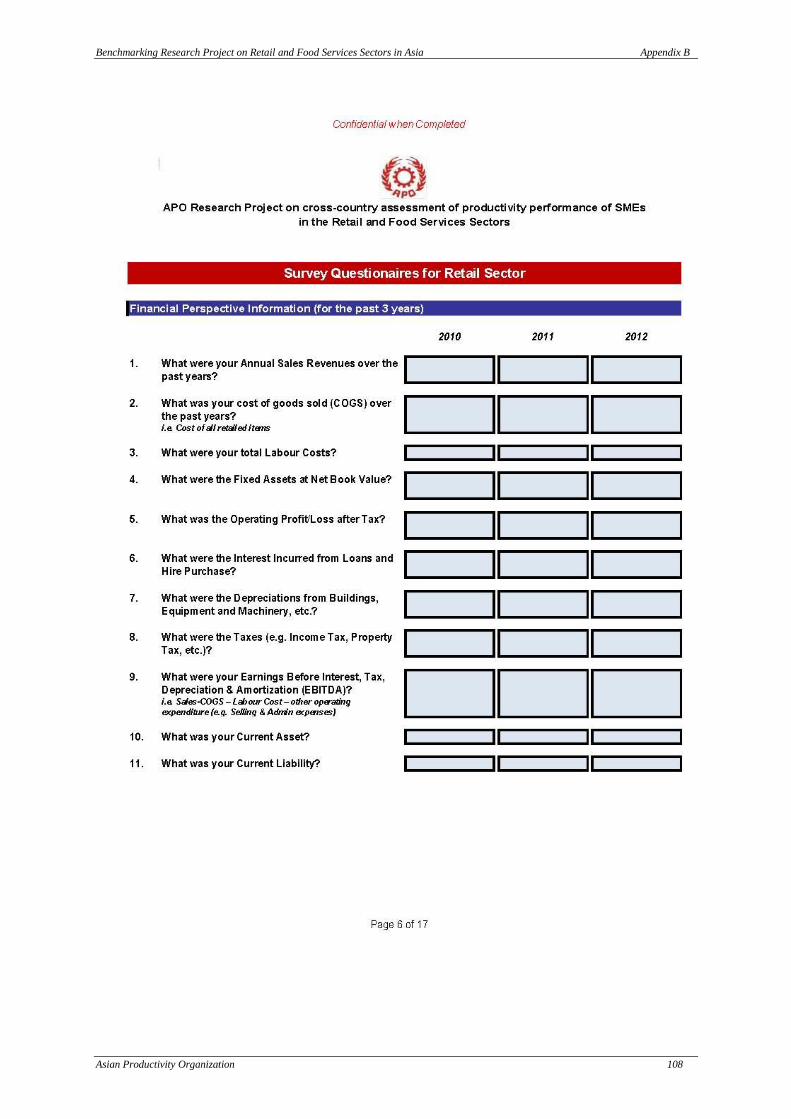
Benchmarking Research Project on Retail and Food Services Sectors in Asia Appendix B
Asian Productivity Organization 108
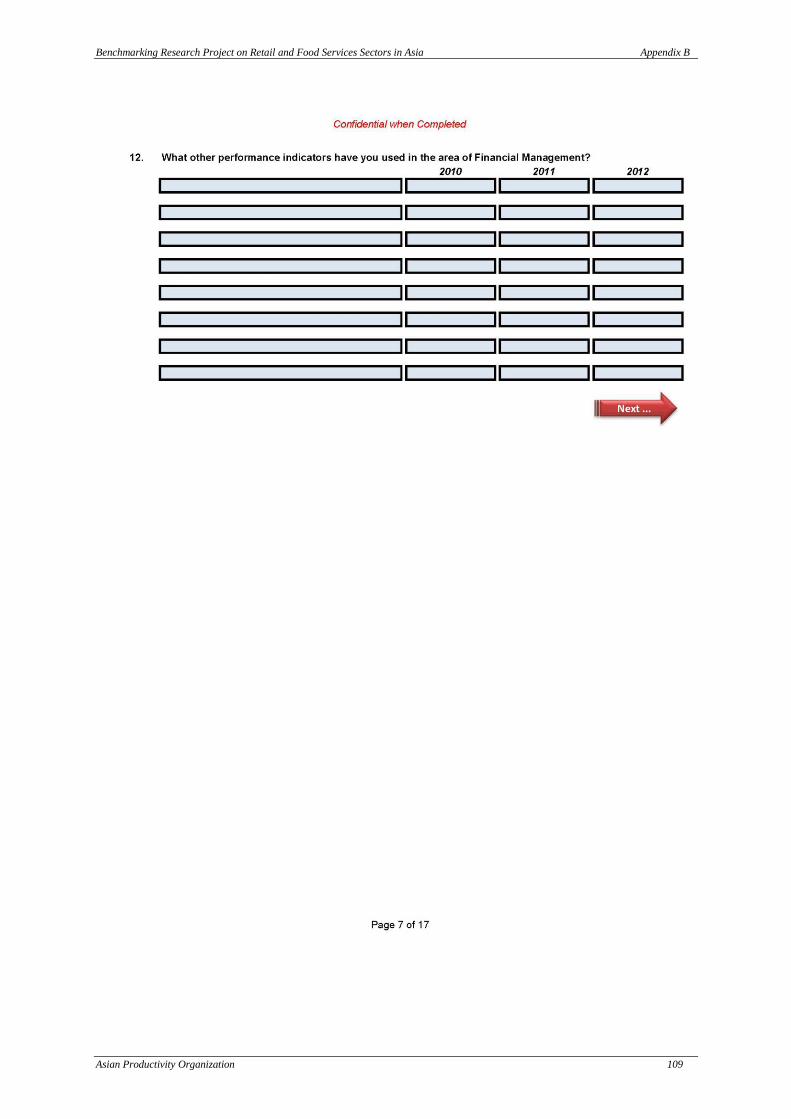
Benchmarking Research Project on Retail and Food Services Sectors in Asia Appendix B
Asian Productivity Organization 109
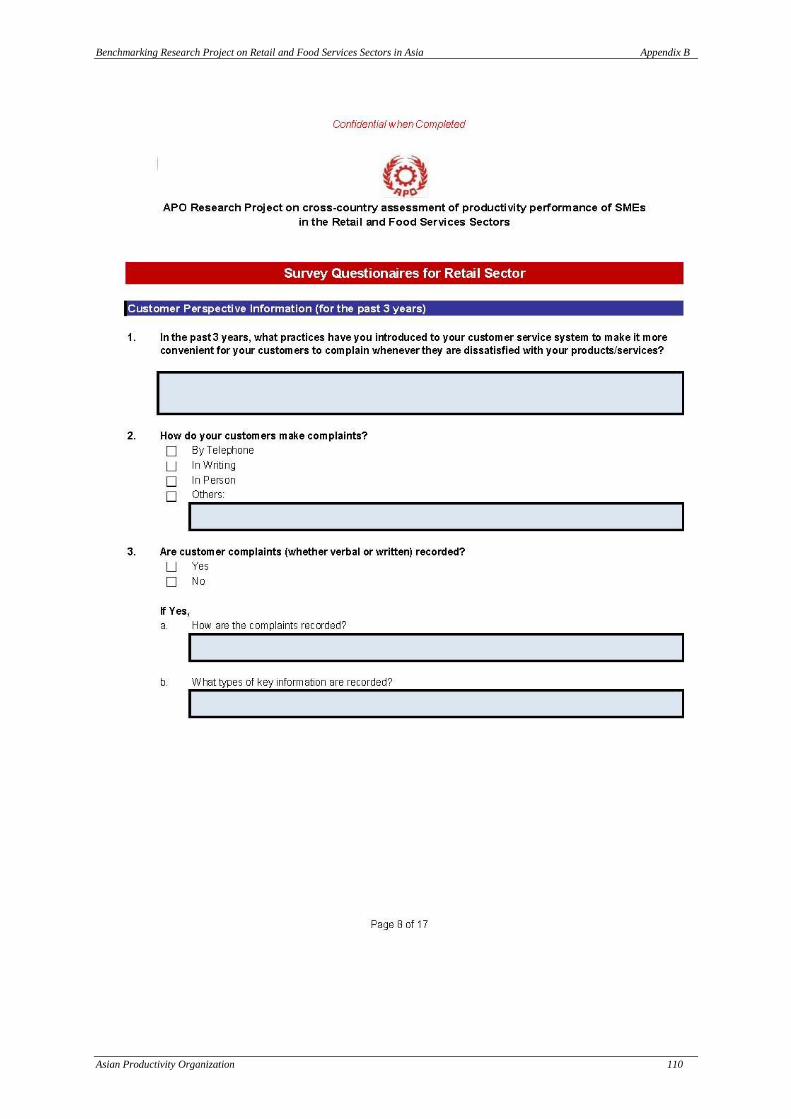
Benchmarking Research Project on Retail and Food Services Sectors in Asia Appendix B
Asian Productivity Organization 110

Benchmarking Research Project on Retail and Food Services Sectors in Asia Appendix B
Asian Productivity Organization 111

Benchmarking Research Project on Retail and Food Services Sectors in Asia Appendix B
Asian Productivity Organization 112
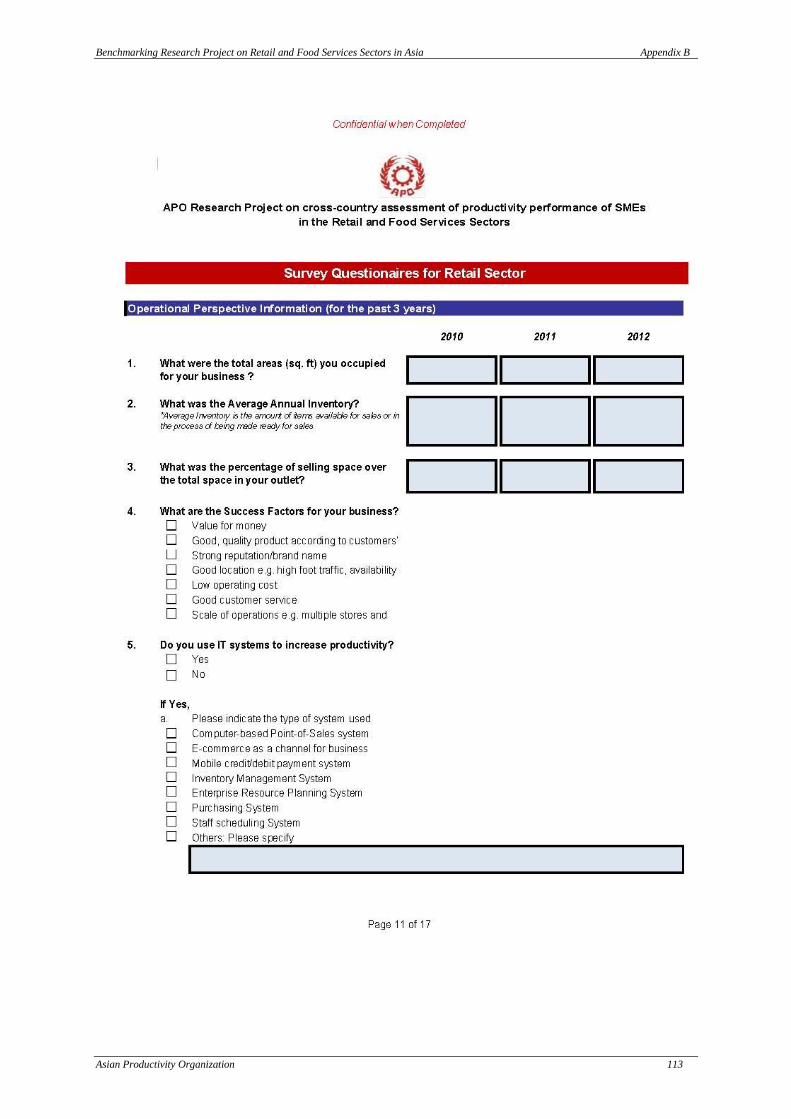
Benchmarking Research Project on Retail and Food Services Sectors in Asia Appendix B
Asian Productivity Organization 113
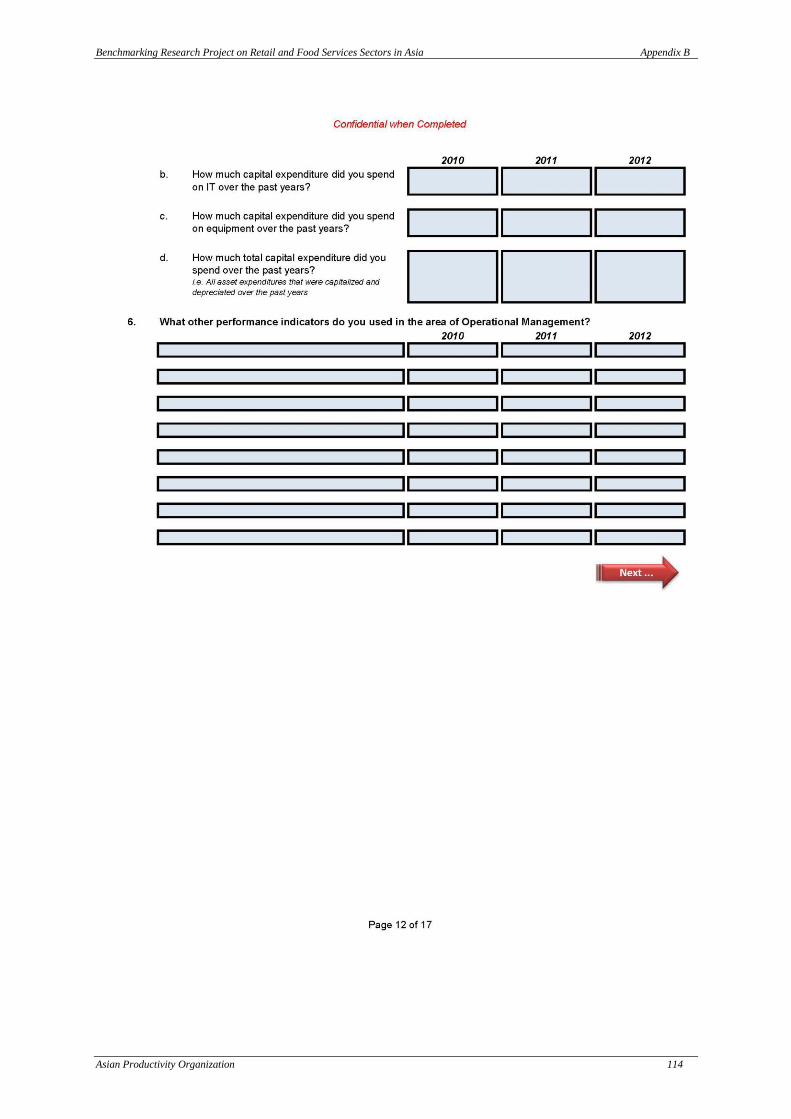
Benchmarking Research Project on Retail and Food Services Sectors in Asia Appendix B
Asian Productivity Organization 114

Benchmarking Research Project on Retail and Food Services Sectors in Asia Appendix B
Asian Productivity Organization 115

Benchmarking Research Project on Retail and Food Services Sectors in Asia Appendix B
Asian Productivity Organization 116
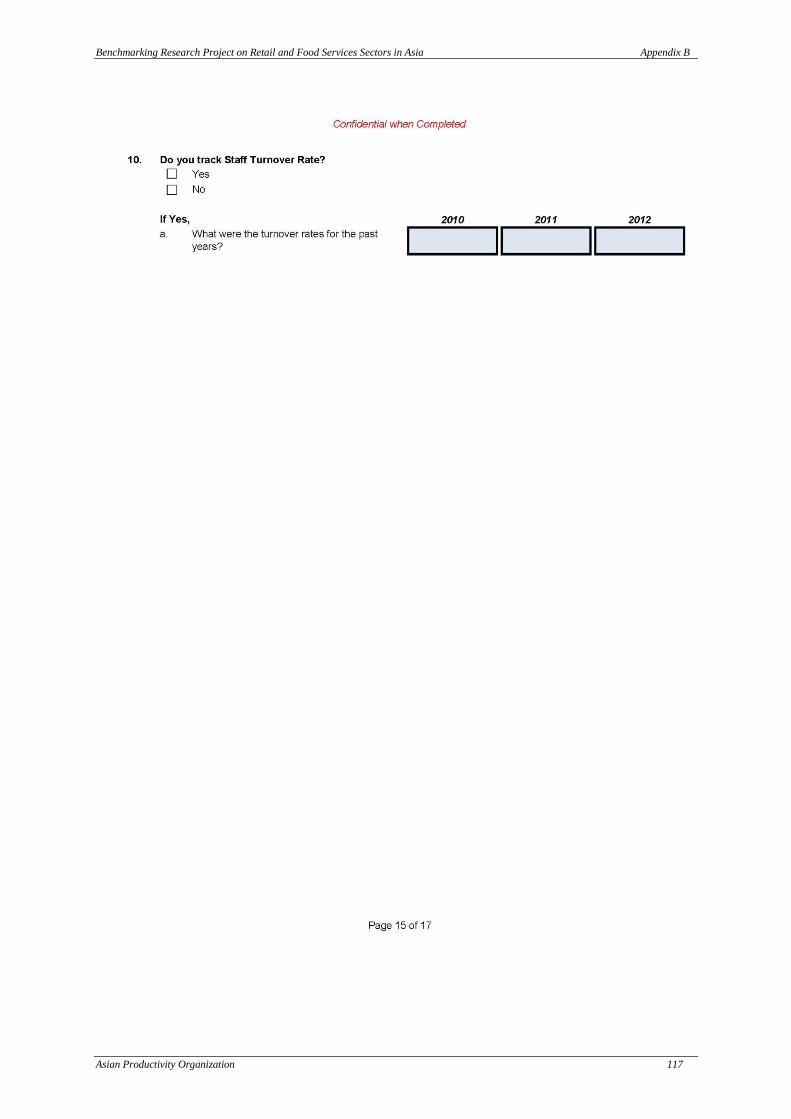
Benchmarking Research Project on Retail and Food Services Sectors in Asia Appendix B
Asian Productivity Organization 117

Benchmarking Research Project on Retail and Food Services Sectors in Asia Appendix B
Asian Productivity Organization 118
Benchmarking Research Project on Retail and Food Services Sectors in Asia Appendix B
Asian Productivity Organization 119

Benchmarking Research Project on Retail and Food Services Sectors in Asia Appendix C
Asian Productivity Organization 120
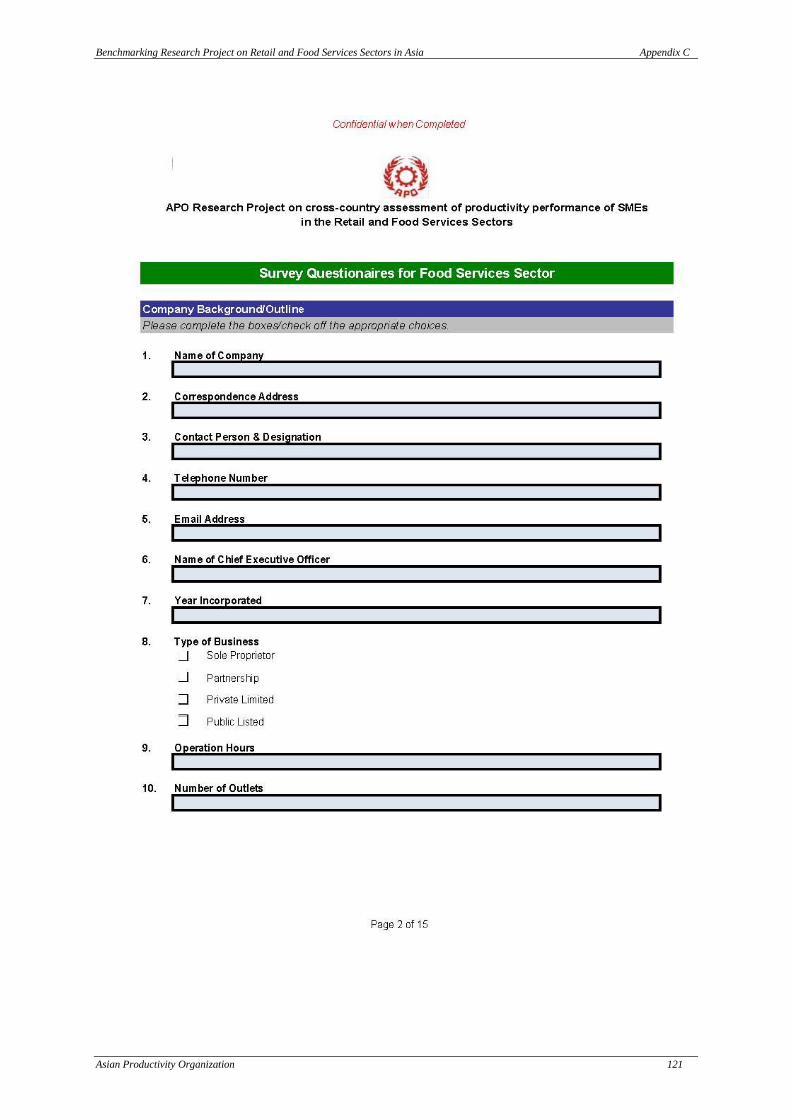
Benchmarking Research Project on Retail and Food Services Sectors in Asia Appendix C
Asian Productivity Organization 121
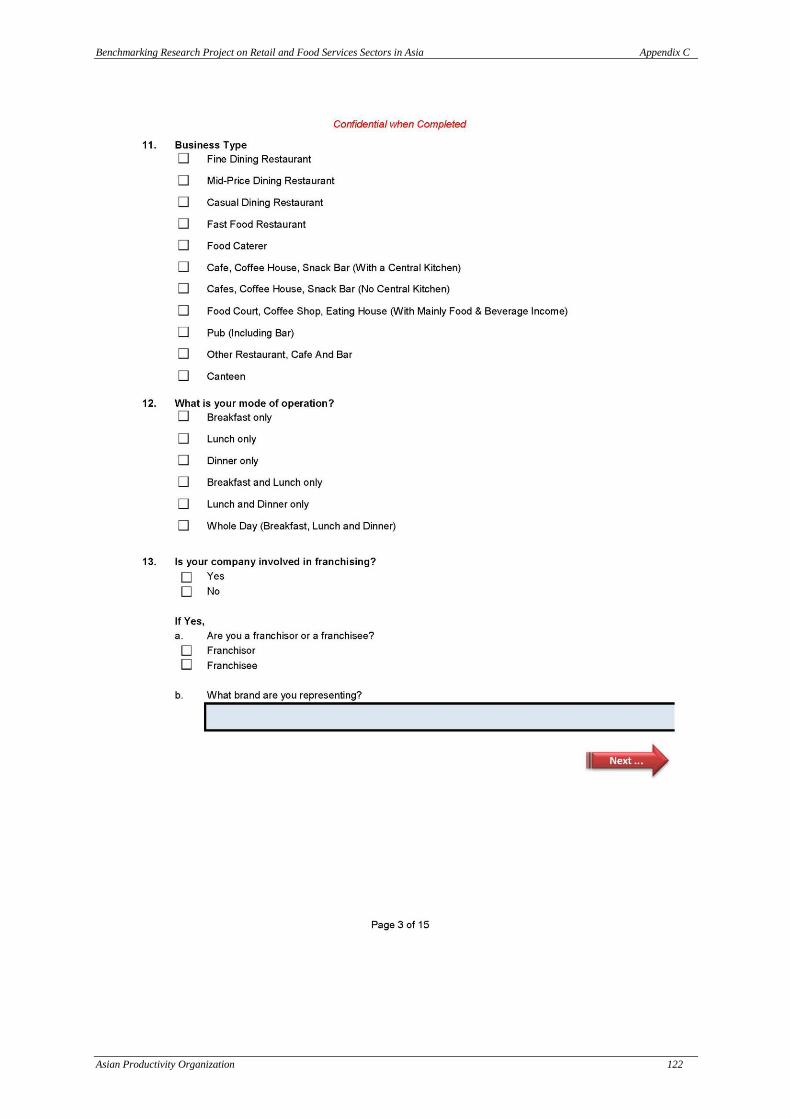
Benchmarking Research Project on Retail and Food Services Sectors in Asia Appendix C
Asian Productivity Organization 122

Benchmarking Research Project on Retail and Food Services Sectors in Asia Appendix C
Asian Productivity Organization 123

Benchmarking Research Project on Retail and Food Services Sectors in Asia Appendix C
Asian Productivity Organization 124
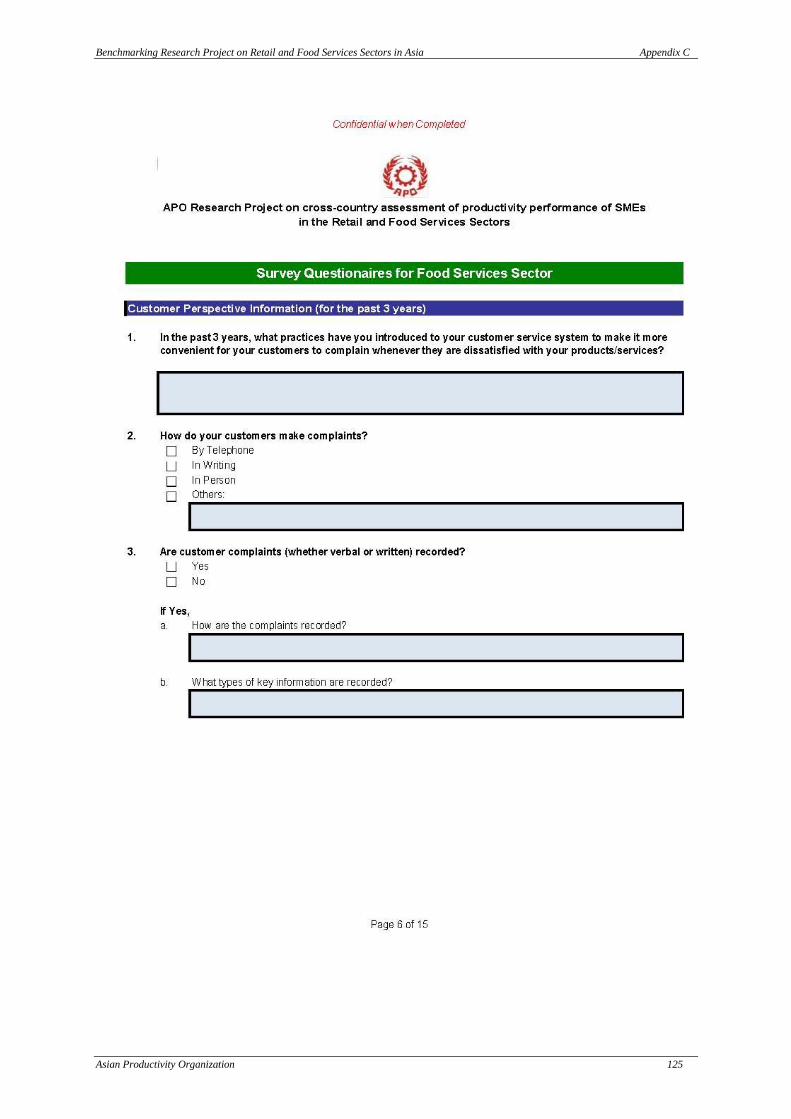
Benchmarking Research Project on Retail and Food Services Sectors in Asia Appendix C
Asian Productivity Organization 125
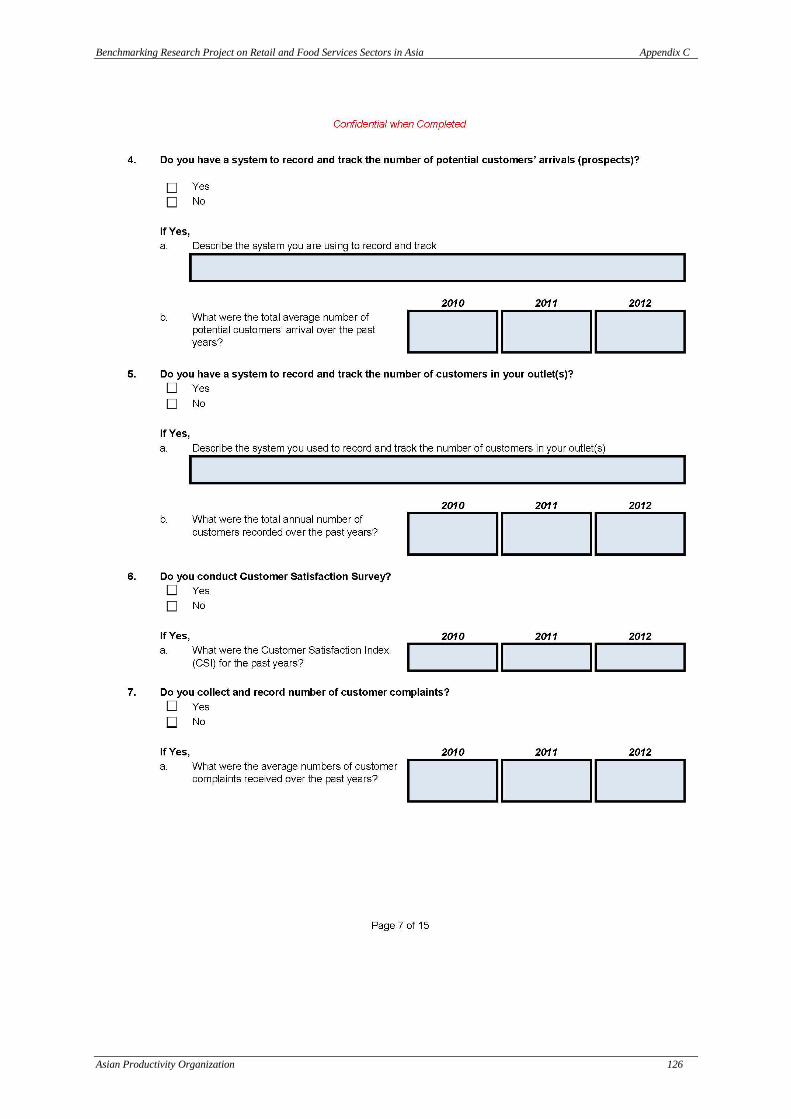
Benchmarking Research Project on Retail and Food Services Sectors in Asia Appendix C
Asian Productivity Organization 126
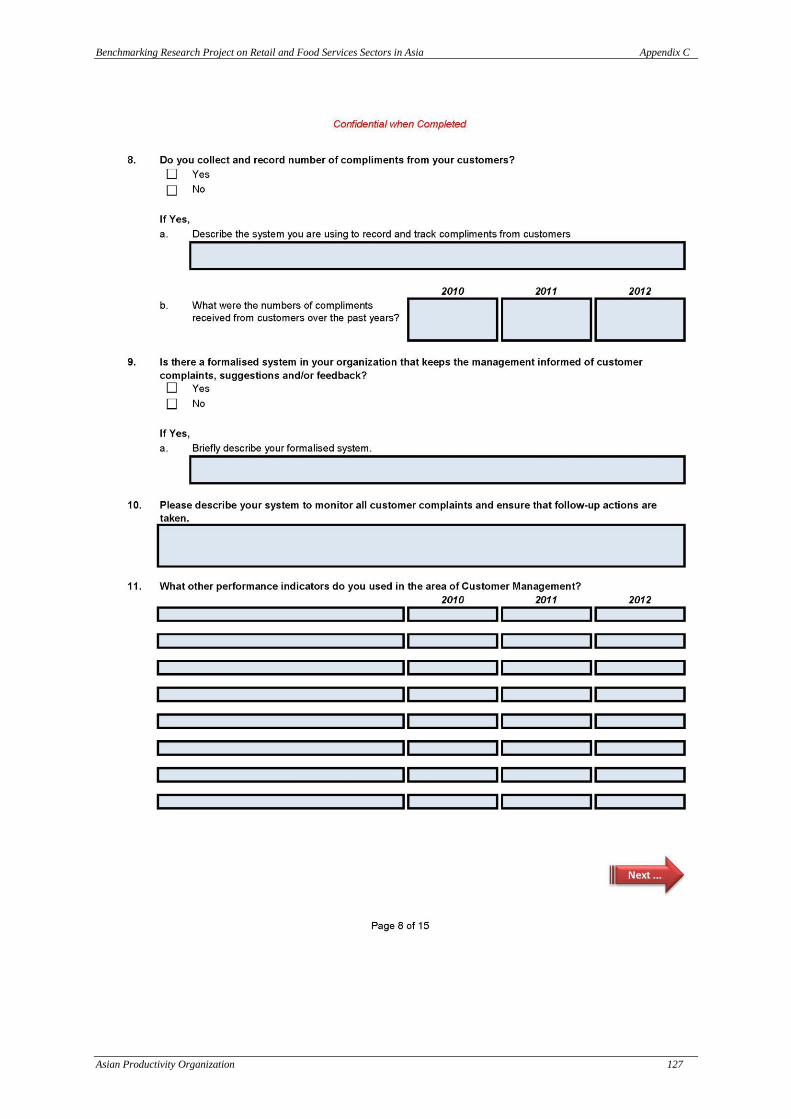
Benchmarking Research Project on Retail and Food Services Sectors in Asia Appendix C
Asian Productivity Organization 127
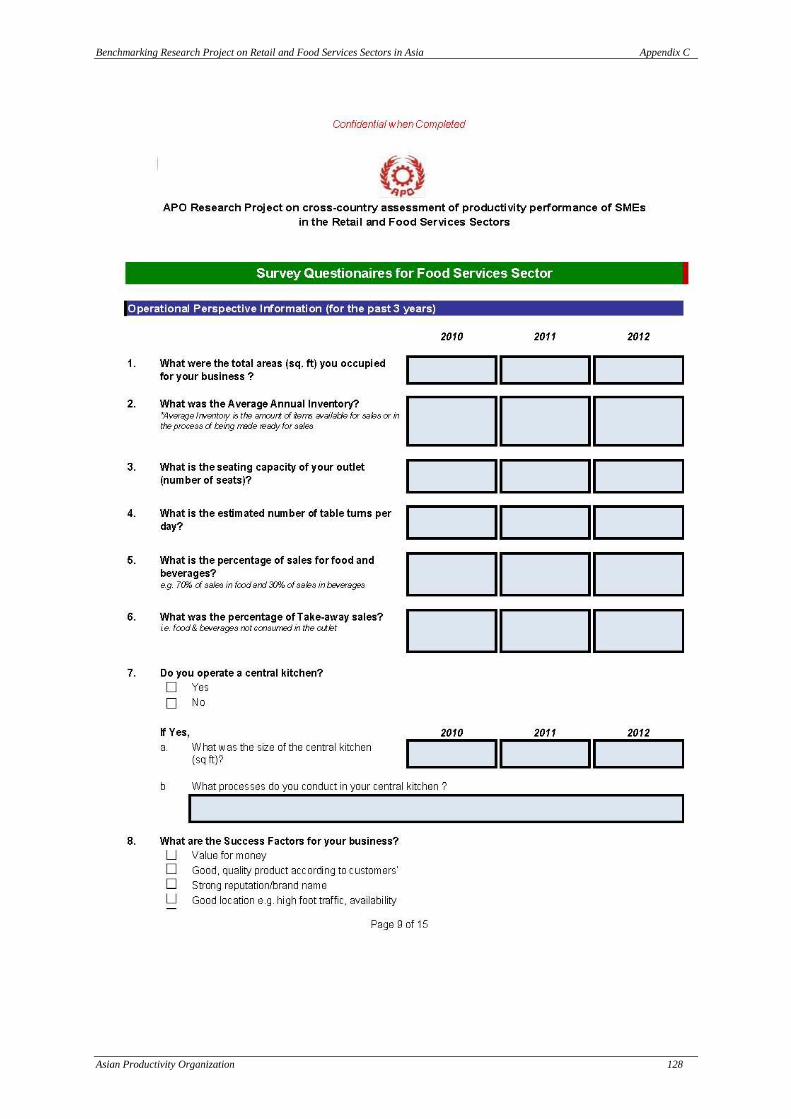
Benchmarking Research Project on Retail and Food Services Sectors in Asia Appendix C
Asian Productivity Organization 128

Benchmarking Research Project on Retail and Food Services Sectors in Asia Appendix C
Asian Productivity Organization 129
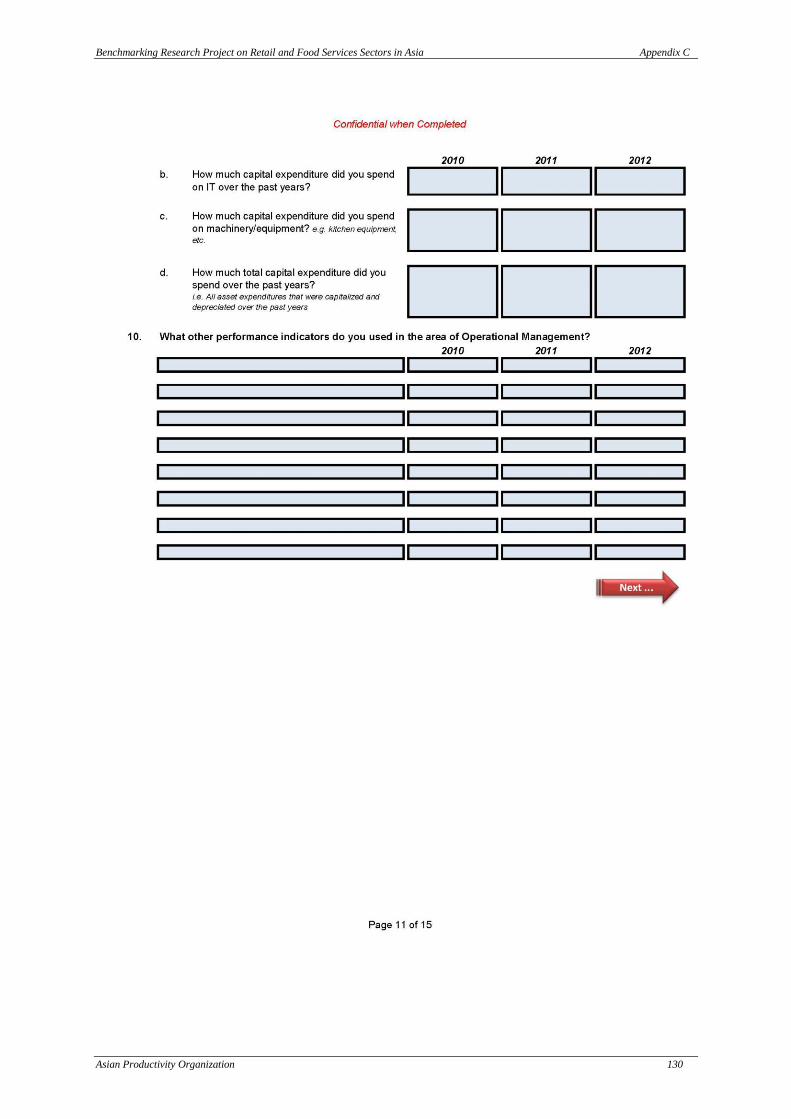
Benchmarking Research Project on Retail and Food Services Sectors in Asia Appendix C
Asian Productivity Organization 130

Benchmarking Research Project on Retail and Food Services Sectors in Asia Appendix C
Asian Productivity Organization 131

Benchmarking Research Project on Retail and Food Services Sectors in Asia Appendix C
Asian Productivity Organization 132
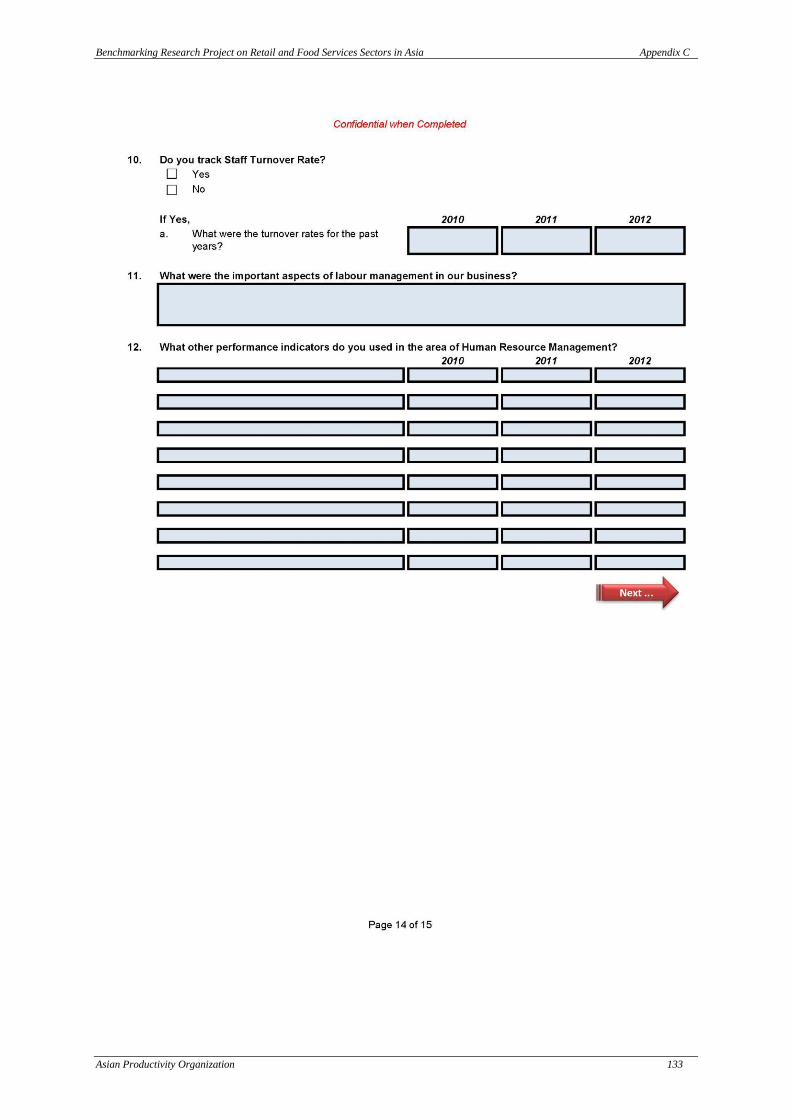
Benchmarking Research Project on Retail and Food Services Sectors in Asia Appendix C
Asian Productivity Organization 133

Benchmarking Research Project on Retail and Food Services Sectors in Asia Appendix C
Asian Productivity Organization 134
Benchmarking Research Project on Retail and Food Services Sectors in Asia
Asian Productivity Organization 135
Acknowledgement
George Wong
Chief Expert, APO Benchmarking Research Project Team
Managing Director and Principal Consultant
Hoclink Systems & Services Pte Ltd, Singapore
Top Related