


Languages
Pages
Legal

BENCHMARKING FOCUSED ON THE SATISFACTION OF BUS TRANSIT USERS 1
2
3
4
Luis Antonio Lindau 5
Laboratório de Sistemas de Transporte, Universidade Federal do Rio Grande do Sul, Brazil 6
WRI Brasil Center for Sustainable Cities 7
Av. Independência, 1299/401 90035-077 Porto Alegre, RS, Brazil 8
Tel: + 555133126324; Email: [email protected] 9
10
Mariana Müller Barcelos, Corresponding Author 11
Laboratório de Sistemas de Transporte, Universidade Federal do Rio Grande do Sul, Brazil 12
WRI Brasil Center for Sustainable Cities 13
Av. Independência, 1299/401 90035-077 Porto Alegre, RS, Brazil 14
Tel: + 555133126324; Email: [email protected] 15
16
Maria Beatriz Berti da Costa 17
Laboratório de Sistemas de Transporte, Universidade Federal do Rio Grande do Sul, Brazil 18
Av. Osvaldo Aranha, 99 – 5° andar 90035-190, Porto Alegre, RS, Brazil 19
Tel: + 5551 33083596; Email: [email protected] 20
21
Carla S. ten Caten 22
Laboratório de Otimização de Produtos e Processos, Universidade Federal do Rio Grande do Sul, 23
Brazil 24
Av. Osvaldo Aranha, 99 – 5° andar 90035-190, Porto Alegre, RS, Brazil 25
Tel: + 5551 33083596; Email: [email protected] 26
27
Cristina Albuquerque Moreira da Silva 28
WRI Brasil Center for Sustainable Cities 29
Av. Independência, 1299/401 90035-077 Porto Alegre, RS, Brazil 30
Tel: + 555133126324; Email: [email protected] 31
32
Brenda Medeiros Pereira 33
WRI Brasil Center for Sustainable Cities 34
Av. Independência, 1299/401 90035-077 Porto Alegre, RS, Brazil 35
Tel: + 555133126324; Email: [email protected] 36
37
38
39
Word count: 4,756 words text + 7 tables/figures x 250 words (each) = 6,506 words 40
41
42
43
Submission Date: November 15th
, 2016 44
45
46

Lindau et al. 1
ABSTRACT 1
Investing in quality of public transport is fundamental to keep and attract users and to foster more 2
sustainable cities. Benchmarking is the adequate tool to identify best practices and promote an 3
exchange of experiences to improve transport systems. Nevertheless, benchmarking focused on 4
customer satisfaction imposes challenges due to the lack of standardization in collecting data and 5
to the sociocultural biases inherent to opinion surveys. This study presents a benchmarking 6
analysis based on satisfaction data collected through a standardized survey. We propose a 7
normalization of satisfaction scores that: (i) reduces the effect of sociocultural biases, (ii) enables 8
the comparison of bus systems operating in different cities, and (iii) allows the identification of 9
potential benchmarks. The proposed method proved suitable for identifying goals, priorities and 10
attributes of bus transit systems that can serve as reference to other cities. 11
12
13
14
15
Keywords: Benchmarking, User satisfaction, Bus transit system, Quality focused on client, 16
Satisfaction Analysis 17
18

Lindau et al. 2
INTRODUCTION 1
Understanding user´s perception of bus transit systems is utterly important worldwide given the 2
direct relation between quality of services and ridership. Also, it is good to use methods that 3
provide objective measures of quality satisfaction and can be applied in different locations as to 4
enable comparisons. In this context, the benchmarking process emerges as an appropriate tool to 5
identify and advance improvements in bus transit systems. 6
Benchmarking is a quality tool globaly used. It consists of an exchange of experiences and 7
comparison process with the purpose of identifying good practices and solutions for the quality 8
improvement of organizations (1). Typically, benchmarking is used to improve processes and 9
reduce costs. Recently, customer-related aspects have also emerged within benchmarking groups. 10
In the transit sector it is not different, users’ perception has becomerelevant to initiatives such as 11
the International Bus Benchmarking Group (IBBG) and Benchmarking European Service of 12
Public Transport (BEST) (2, 3). 13
The present work addresses benchmarking focused on the satisfaction of bus transit users 14
in Brazil. To measure users’ perception, we used QualiÔnibus Satisfaction Survey, developed by 15
WRI Brasil Center for Sustainable Cities. This is a standardized survey tool currently being 16
applied in Brazilian cities to measure the users' level of satisfaction andconcerning the bus transit 17
system (4). 18
Comparing satisfaction surveys applied in different locations is a challenge due to 19
differences between types of surveys, questionnaires, sampling procedures, plus cultural and 20
social contexts. While most of the aspects can be solved with the application of a standardized 21
survey, sociocultural aspects are inherent to opinion surveys and must be normalized to make 22
different applications comparable. 23
This study proposes a normalization of satisfaction scores of public transit users in order to 24
reduce the cultural and social biases. Hence, it is possible to compare cities while identifying those 25
which have potential to be a reference for best practices, and to allow benchmarking of users´ 26
satisfaction data. 27
We start by presenting a literature review on quality of the bus transit system with focus on 28
the customer and benchmarking, followed by a description of the method we developed. Then we 29
perform benchmarking analyses and discuss the results. 30
31
QUALITY WITH FOCUS ON THE CUSTOMER 32
Historically, the bus transit system has quality associated to operational aspects of the system 33
predominantly reflecting interests of operators and public managers. After the 1990s, the concept 34
of quality of services started to be more widely used by taking users’ perception as well as desires 35
and needs of the society into consideration (5). However, the public sector is yet to adopt this 36
concept. Introducing users’ perception of services as a factor in the management processes ends up 37
being a differential for organizations that count with more resources and also with riders that face 38
a wider diversity of transport options (6). 39
The Quality Loop, proposed by European Standard EN 13816, allows for better 40
understanding of the components involved in bus transit system quality. As depicted in Figure 1, 41
for transport customers and the community, users’ satisfaction is defined as the difference between 42
the service quality sought and the perceived quality of services rendered. For agencies and 43
transport operators, the performance measurement is determined by the difference between the 44
quality of services targeted and the quality of services provided (7). The differences between the 45
four types of quality are called quality gaps. These gaps should be as small as possible. This loop is 46

Lindau et al. 3
useful as a management tool for the transit network as a whole or for a single bus line (8). 1
2
3 4
FIGURE 1 Quality loop proposed by European Standard EN 13816. 5
6
Bus transit system quality must be perceived from the point of view of the user (9) given its 7
impact on keeping ridership and attracting new riders. The user, as any customer, has the right to a 8
certain quality of services that justifies loyalty to the bus transit system, the most sustainable 9
motorized mode to move people in the cities (10). The work described in this study is focused on 10
“measurement of satisfaction”, i.e. the gap between “quality of services sought” and the “quality of 11
services perceived” in the quality loop. 12
13
BENCHMARKING 14
Benchmarking is a tool intended to reveal the best practices of an organization recognized as 15
competent in a certain aspect, and then implement such best pratices to improve the performance 16
of other organizations (1). Benchmarking started in 1979, when Xerox Corporation faced major 17
reduction in its market-share. Xerox applied this process for the first time and disseminated the 18
practice globally (11). 19
The benchmarking process consists of identifying an organization’s operational error, 20
establishing more effective ways to achieve the desired goal, learning how to apply the new 21
concept and implementing it (12). Hence, benchmarking stimulates focus on practices adopted by 22
competitors (1). Benchmarking groups usually rely on strict no disclosure policies, implemented 23
to preserve the data shared within the work group and to prevent information leakage to external 24
entities (13). 25
Transit Cooperative Research Program, in Report 141, describes the Benchmarking 26
process in eight steps, which envolve (i) understanding context, (ii) developing performance 27
measures, (iii) stabilishing peer groups, (iv) comparing performance, (v) contacting best-practice 28
peers, (vi) developing implementation strategies, (vii) implementing strategy, and (viii) 29
monitoring results (14). Benchmarking must be implemented as multiple step process as each step 30
is relevant to the outcome benefits provide by this tool. However, this study focuses on “Step four 31
– compare performance”, specifically in normalizing and applying techniques that allow for 32
standardization of performance data, so that information can properly be compared. 33
Several national and international benchmarking groups were created to improve the 34
quality of transit services, like Community of Metros (CoMET), International Bus Benchmarking 35
Group (IBBG), Suburban Rail Benchmarking Group (ISBeRG), American Bus Benchmarking 36
Group (ABBG), Benchmarking European Service of Public Transport (BEST), Fetranspor 37

Lindau et al. 4
Benchmarking Group, (Syndicate of bus transit operators in the State of Rio de Janeiro, Brazil). 1
These groups are mostly focused on the performance and the operating costs (13, 15, 16), although 2
aspects related to customers’ satisfaction have recently appeared in some of them (2, 3). 3
Benchmarking focused on users’ satisfaction can present a challenge due to data collection 4
technical differences, as well as social and cultural contexts (2). Even in situations when the survey 5
method is standardized, there is innerent risk of users´ responses influenced by cultural and social 6
biases, which can disqualify comparisons between different cities within a country or between 7
different countries (17, 18). 8
In 2009, members of the International Bus Benchmarking Group (IBBG) introduced a data 9
normalization process into customer satisfaction assessment. The objective was not to directly 10
compare the customer satisfaction between different cities, but normalize results in order to 11
comprehend how the quality of the bus transit systems can possibly meet the customers’ 12
expectations on multiple aspects of the service provided (2). 13
14
METHOD 15
Benchmarking analyses with focus on the users’ perception requires standardized data collection 16
methodology. To allow for results from different Brazilian cities to be compared, data collected by 17
WRI Brasil Center for Sustainable Cities through QualiÔnibus Satisfaction Survey in different 18
Brazilian cities was used. 19
After evaluating the relevance of the existing samples, a method for normalizing scores of 20
users’ satisfactionto overcome sociocultural biases and enable the unbiased comparison between 21
cities data is proposed. In this chapter, QualiÔnibus Satisfaction Survey and the methodological 22
procedures adopted to conduct the benchmarking are proposed. 23
24
QualiÔnibus Satisfaction Survey 25
QualiÔnibus Satisfaction Survey measures the perception of bus transit system users. It was 26
conceived by WRI Brasil Center for Sustainable Cities (4) based on an extensive literature review 27
of existing practices (e.g. reports from TCRP, European Standard 13816, among others) and on 28
surveys applied in different countries, cities and systems (as in the case of Transantiago, 29
TransMilenio, Madrid Regional Transport Consortium, URBS, SPTrans, BHTRANS, National 30
Association of Public Transportation - ANTP, among others). 31
Although standardized, QualiÔnibus Satisfaction Survey is set in modules as to provide 32
flexibility to suit specific needs of a city or transit system. It provides a quantitative only 33
assessment of the users’ perception and was so far used to verify the impact of interventions in the 34
public transport system and to support decision making at the local level (4). For the work reported 35
in this study, we use data obtained from the application of QualiÔnibus Satisfaction Survey in four 36
Brazilian cities. 37
38
Questionnaire 39
The questionnaire of QualiÔnibus Satisfaction Survey consists of one basic module and several 40
detailed modules. The basic module is required for all cities wishing to apply the survey, while the 41
detailed modules are optional and can be selected depending on needs and interest on specific 42
aspect of the bus transit system (4). 43
The basic module consists of four sections: (i) customer profile; (ii) usage profile; (iii) 44
satisfaction; (iv) general perception. The satisfaction section presents one question about general 45
satisfaction and 16 questions that are specific to each quality factor. The objective of the section on 46
general perception is to get the users´ position on eight statements regarding transit. The 16 quality 47

Lindau et al. 5
factors included in the survey are (4): 1
access to transport: ease of getting to points of access and circulating in stations and 2
terminals; 3
availability: time interval between buses at the required period and location; 4
speed; 5
reliability: arrival on time; 6
easiness to transfer between bus lines and other means of transport to get to destination; 7
comfort at bus stops: lighting, protection, cleanliness, loading; 8
comfort at stations: lighting, protection, cleanliness, loading; 9
comfort at integration terminals: lighting, protection, cleanliness, loading; 10
comfort inside buses: lighting, cleanliness, loading, availability of seats; 11
customer service: respectfulness, friendliness, qualification of drivers, ticket collectors, 12
staff and call center; 13
customer information: including timetables, routes, lines and general information; 14
security: against theft, robberies and assault on the way to bus stops, stations and terminals 15
as well as inside the bus; 16
road safety; 17
exposure to noise and pollution: produced by the buses; 18
easiness to pay fares: including the recharging of travel cards; 19
expenses: with bus transit. 20
21
Sampling 22
QualiÔnibus Satisfaction Survey indicates the minimum number of questionnaires applied 23
through simple random sampling (18), using a 95% confidence level and 5% significance level. 24
Regarding systems that carry more than 20,000 daily passengers, approximately 400 valid and 25
randomly distributed interviews must be collected for accuracy throughout the system (17). The 26
cities examined in our benchmarking analysis adopted wider samples, which reduces the sampling 27
error and allows the stratification of results. 28
To ensure a random distribution of surveys, samples are divided by bus line and time slot 29
(morning peak, off peak and rush-hour peak). Questionnaires are distributed proportionally to the 30
demand of each line in a way that ensures that the selected lines represent at least 90% of the total 31
system demand. Sampling distribution by time is proportional to the demand of the system in each 32
time slot; total representing period includes 90% of the system demand (17). 33
34
Scores of Satisfaction 35
The reported benchmarking analyses are based on satisfaction questions from the 16 quality 36
factors of the basic module of QualiÔnibus Satisfaction Survey. Data was originally collected by 37
interviewers in the field using a five-point Likert scale (20) to facilitate responses and later on 38
translated into scores from 0 to 10. Likert scale and its respective translation scores are shown in 39
Figure 2. 40
41

Lindau et al. 6
1 2
FIGURE 2 Likert scale and its respective scores. 3
4
Statistical Analysis 5
We started by calculating the coefficient of variation of samples to represent the dispersion of the 6
respondent’s scores. The Analysis of Variance for two factors (Two Way ANOVA) was applied to 7
investigate the relation between “Quality factors” and “Cities”. The objective was to determine the 8
existence of significant differences between the scores of some quality factors and differences 9
between the four surveyed cities. If the statistical test reveals significant differences, it becomes 10
necessary to complement the analysis through Multiple Comparison of Averages to uncover the 11
quality factors and cities that differ significantly in the sampling and can be thus extrapolated to 12
the entire population. 13
14
Normalization of Satisfaction 15
Significant differences among cities may infer - in statistical terms - that the evaluation in 16
perceptions is different for each city, characterizing a cultural bias. The International Bus 17
Benchmarking Group (2) proposes a normalization of the satisfaction scores using the average 18
scores achieved by each city. The normalization process consists in reducing the absolute 19
satisfaction score of a city (scores from 0 to 10) by using the average score of all quality factors of 20
that same city, as presented in Equation 1. 21
22
(1) 23
24
Where: 25
is the normalized score of quality factor i in city j; 26
is the absolute score of quality factor i in city j; 27
is the number of quality factors assessed in city j. 28
29
Benchmarking Analyses 30
Data from QualiÔnibus Satisfaction Survey and the normalization proposed by Equation 1 allows 31
us to carry out benchmarking of user’s satisfaction. The normalization enables to compare and 32
identify the reference cities, as well targets to be reached for different quality factors. The 33
definition of priorities for a city can be accomplished by using absolute scores of satisfaction, from 34
0 to 10. At the end of this study, we provide an example where the procedure is applied. 35
36
RESULTS AND ANALYSES 37
Benchmarking analyses were based on the results of QualiÔnibus Satisfaction Survey, conducted 38
in four large and medium-sized Brazilian cities in 2015. In cities C and D, the questionnaires were 39
applied for evaluating the bus transit system of the entire city, while in cities A and B the 40

Lindau et al. 7
application was restricted to specific corridors. In accordance to the anonymity policy of 1
benchmarking, the cities are not here identified and the respective satisfaction scores resulting 2
from the survey are not presented. 3
4
Sample Characterization 5
To get a better picture of respondents in the cities, we started by evaluating the variation 6
coefficient of the samples. We found out that the samples present high dispersion (more than 30%) 7
- an expected result for a satisfaction survey that covers such a wide and variable population of 8
transit users. Table 1 presents the main characteristics of the samples for each of our four cities 9
including sizing, errors, average scores of satisfaction, and variation coefficients. 10
11
TABLE 1 Characteristics of samples 12
13
City Sample
size Verified sampling error
Average scores of
satisfactiona
Coefficient of
variation of the
samplesb
City A 2,000 2.20% 5.41 48.4%
City B 2,599 1.93% 5.73 42.1%
City C 2,012 2.19% 4.86 55.2%
City D 527 4.27% 5.16 53.5% a Average satisfaction score of the 16 quality factors of QualiÔnibus Satisfaction Survey in the city. b Coefficient of variation based on the satisfaction responses of 16 quality factors.
14
The variation coefficient of the samples is similar in the four cities and remained around 15
50%. Real variabilities are important for re-estimating the sample’s sizes (21). Our results indicate 16
a minimum sample of 384 valid questionnaires for when stratified analyses are not carried out. It 17
reinforces the general sampling rule proposed by the QualiÔnibus Satisfaction Survey method, 18
which defines circa 400 interviews for each transit system or corridor. 19
20
Benchmarking Users’ Satisfaction 21
A satisfaction score for each of the 16 quality factors was determined as follows: absolute scores 22
varying from 0 to 10 came from the transposition of the Likert scale as depicted in Figure 2. For 23
each city, an average satisfaction score is calculated as the arithmetic mean of scores of the16 24
quality factors. 25
26
Identification of Potential Benchmarks 27
Literature (17, 2, 18) recommends that the comparison of absolute scores of surveys conducted in 28
different locations must consider the chance of external factors, such as cultural and social issues, 29
influence the evaluation of satisfaction by imposing biases. Taking that into consideration, the 30
effect of variables “City” and “Quality factor” were tested through an Analysis of Variance 31
(ANOVA) of two factors without repetition. The complete ANOVA table is shown in Table 2. 32
33
34
35
36
37
TABLE 2 ANOVA on Quality Factor and City 38
39

Lindau et al. 8
Source of variation SS df MS F P-value F critical
Quality factor 46.90 15 3.13 9.54 1.725E-09 1.89
City 6.50 3 2.17 6.61 0.0008504 2.81
Error 14.75 45 0.33
Total 68.15 63
1
Table 2 shows that the variable “City” has a significant effect in the satisfaction scores of 2
the quality factors (P-value less than 5%), assuring that the absolute satisfaction scores of user’s 3
perception differ statistically in the cities where the data came from. The “Quality factor” exertion 4
of a significant influence in the scores (also a P-value less than 5%) was expected and presents no 5
issue for the purpose of this analyses, given each quality factor separately analysis. 6
7
Aiming to removing the variable “City” effect and reduce social and cultural biases, similar 8
procedures were adopted to IBBG, which consists on normalizing the average satisfaction score of 9
each city (2). Normalization was completed accordingly to Equation 1. The resulting normalized 10
satisfaction scores are shown on Table 3. 11
12
TABLE 3 Normalized Satisfaction Scores by City for Each Quality Factor 13
14 Quality factors City A City B City C City D Access to transport 1.36 0.54 1.24 1.19 Availability 0.79 -0.36 0.04 -0.49 Speed 1.43 0.76 0.19 0.26 Reliability 0.95 0.34 0.34 0.31 Easiness to transfer 0.85 0.26 1.18 0.73 Comfort at bus stops -1.02 -0.99 -1.31 -1.79 Comfort at stations -0.34 0.61 -0.54 a Comfort at integration terminals -0.29 0.43 -0.27 -0.08 Comfort inside buses -0.70 0.85 -0.47 -0.72 Customer service 0.14 0.60 1.56 1.23 Customer information -0.09 0.37 1.16 1.36 Security -2.55 -1.23 -2.15 -0.54 Road safety -0.08 -0.09 -0.22 0.25 Exposure to noise and pollution -0.03 -0.36 -0.67 -0.85 Easiness to pay 0.18 0.64 1.42 1.28 Expenses -0.60 -2.38 -1.49 -2.13 Average of quality factors 0.00 0.00 0.00 0.00 a Question not applied in city D.
15
The normalized results of the averaged quality factors, presented in the last line of Table 3, 16
result in zero as expected, since these averages were the basis for normalization. Normalization 17
generates both positive and negative scores, highlighting the quality factors that are worse or better 18
than the average in each city. Very similar results for some quality factors were observed, 19
regardless of where they were collected. When the scores variability is low, it proves difficult to 20
define what city presents the best practices. For the definition of the benchmarking city for each 21
quality factor, a Multiple Comparison of Averages was performed to verify which scores are 22
significantly different than the others. The results are plotted in Figure 3, presenting the 23
normalized scores of satisfaction for each quality factor and city. The rectangles represent the 24
scores with no significant difference, characterizing a technical tie between cities. 25

Lindau et al. 9
1 2
3
4
5
6
7
8
9
10
11
12
13
14
15
16
17
18
19
20
21
22
23
24
25
26
27
28
29
30
31
32
33
34
35
36
37
38
39
40
FIGURE 3 Scores of satisfaction normalized by quality factor and city (rectangles 41
represent scores with no significant difference). 42
Those cities with best quality factors can probably share good practices with the others. 43
Cities considered reference in quality in the group are called potential benchmarks and are 44
Lindau et al. 10
indicated on Figure 3. 1
The quality factors “Exposure to noise and pollution”, “Comfort at bus stops”, “Security” 2
and “Expense” have all negative scores, i.e. none of the cities had them evaluated above average. 3
Less negative scores can indicate that a city may be adopting a better practice than the others and 4
thus serve as a benchmark for that quality factor. 5
6
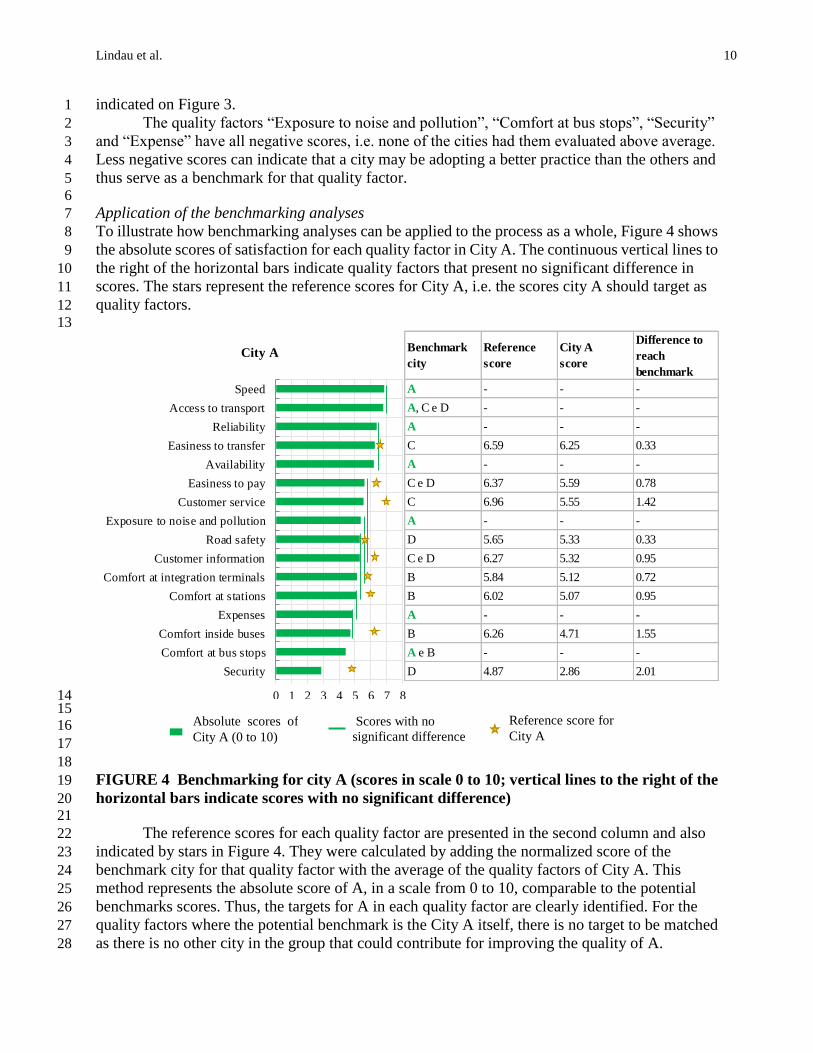
Application of the benchmarking analyses 7
To illustrate how benchmarking analyses can be applied to the process as a whole, Figure 4 shows 8
the absolute scores of satisfaction for each quality factor in City A. The continuous vertical lines to 9
the right of the horizontal bars indicate quality factors that present no significant difference in 10
scores. The stars represent the reference scores for City A, i.e. the scores city A should target as 11
quality factors. 12
13
Benchmark
city
Reference
score
City A
score
Difference to
reach
benchmark
A - - -
A, C e D - - -
A - - -
C 6.59 6.25 0.33
A - - -
C e D 6.37 5.59 0.78
C 6.96 5.55 1.42
A - - -
D 5.65 5.33 0.33
C e D 6.27 5.32 0.95
B 5.84 5.12 0.72
B 6.02 5.07 0.95
A - - -
B 6.26 4.71 1.55
A e B - - -
D 4.87 2.86 2.01
0 1 2 3 4 5 6 7 8
Security
Comfort at bus stops
Comfort inside buses
Expenses
Comfort at stations
Comfort at integration terminals
Customer information
Road safety
Exposure to noise and pollution
Customer service
Easiness to pay
Availability
Easiness to transfer
Reliability
Access to transport
Speed
City A
14 15
16
17
18
FIGURE 4 Benchmarking for city A (scores in scale 0 to 10; vertical lines to the right of the 19
horizontal bars indicate scores with no significant difference) 20
21
The reference scores for each quality factor are presented in the second column and also 22
indicated by stars in Figure 4. They were calculated by adding the normalized score of the 23
benchmark city for that quality factor with the average of the quality factors of City A. This 24
method represents the absolute score of A, in a scale from 0 to 10, comparable to the potential 25
benchmarks scores. Thus, the targets for A in each quality factor are clearly identified. For the 26
quality factors where the potential benchmark is the City A itself, there is no target to be matched 27
as there is no other city in the group that could contribute for improving the quality of A. 28
Absolute scores of
City A (0 to 10)
Scores with no
significant difference
Reference score for
City A
Lindau et al. 11
Prioritizing improvements for City A must be done from the lower to the higher score of 1
satisfaction (Figure 4). Hence, the first quality factor to be prioritized is “Security”, where City A 2
scores 2.86 and the benchmark is 4.87. “Comfort at bus stops” would be the second factor to be 3
prioritized, but City A is already a potential benchmark for it. Following this order, the next quality 4
factor is “Comfort inside buses”, that has City B as a potential benchmark, i.e. reference score of 5
6.26 is the target to be reached. And so continues the ranking in prioritization. 6
The next steps in this round of benchmarking are the identification of best practices and the 7
exchange of experiences between cities, as to contemplate all stages of the benchmarking process 8
(12). The benchmarking process must also evaluate the prevailing context of each city and verify 9
the feasibility of applying certain practices. Communication and exchange of experiences between 10
cities is crucial to identify practices that can be replicated, practices that must be adapted and 11
practices that apply exclusively to a specific context. 12
13
FINAL CONSIDERATIONS 14
The method developed for benchmarking bus transit user’s satisfaction was applied with success. 15
It includes using data from interviews conducted in four Brazilian cities and a normalizing 16
procedure. QualiÔnibus Satisfaction Survey provides a systematic and quantitative approach of 17
information collection from users, which enables comparing different sets of data. Normalizing 18
user´s satisfaction scores reduces the cultural and social biases that are inherent to opinion surveys. 19
This analyses was presented in a capacity that facilitates the identification of potential benchmarks 20
as well as the reaching targets by cities for different quality factors. 21
It is important to notice that user´s perceptions are invariably extracted from samples that 22
need to be representative of the reality being surveyed. Despite often forgotten in benchmarking 23
efforts, analyses of variance and multiple comparisons of average statistical tests, conducted in this 24
work, played an essential role in validating the results. 25
It is also important to realize that benchmarking is a continuous improvement process, and 26
that analyses are not absolute in identifying all aspects to be improved or the ultimate benchmarks. 27
Nevertheless, the results from this bus transit benchmarking method resulted useful in identifying 28
quality factors in specific cities that can serve as benchmarks for others. It is crucial to add an 29
empirical knowledge of the bus system derived from this experience and to understand how transit 30
works in different realities. Benchmarking should not be restricted to comparisons and setting 31
targets but also to fostering peer-to-peer knowledge sharing. To achieve this goal, a successful 32
benchmarking group should have active members, promote meetings, facilitate contacts and 33
exchange experiences. It is the process as a whole that makes benchmarking an appropriate tool for 34
quality improvement and promotes its global success. 35
36
ACKNOWLEDGMENTS 37
The authors acknowledge the support of WRI Brasil Center for Sustainable Cities, FedEx, 38
ALC-BRT, the Center of Excellence for BRT, and Capes. 39
40
REFERENCES 41
1. Bhutta K. S. and Huq F. Benchmarking Best practices: as integrated approach. 42
Benchmarking: An International Journal, v. 6, iss 3, 1999, p. 254-268 43
2. Trompet, M., Parasram, R, and Anderson, R.J. Benchmarking disaggregate 44
customer satisfaction scores between bus operators in different cities and countries. 45
In Transportation Research Board 92st Annual Meeting, TRB, 2013 46
3. EMTA. BEST: Benchmarking of customer satisfaction with public transport in 47

Lindau et al. 12
Europe. www.emta.com/spip.php?article668&lang=en. Accessed July 4, 2016 1
4. EMBARQ Brasil. QualiÔnibus pesquisa de Satisfação. EMBARQ Brasil, Porto 2
Alegre, 2014 3
5. Bertozzi, P. P. and O. F. Lima Jr. A qualidade no serviço de transporte público sob 4
as óticas do usuário, do operador e do órgão gestor. Revista dos Transportes 5
Públicos, n. 081, 1998, p. 53-66 6
6. Kittlenson& Associates, Inc.; Urbitran, Inc.; LKC Consulting Services, Inc.; 7
MORPACE International, Inc.; Queensland University Of Technology; Yuko 8
Nakanishi. A Guidebook for Developing a Transit Performance-Measurement 9
System. Transit Cooperative Research Program: Report 88, Washington, DC, USA, 10
2003. 11
7. European Commission. Quality approach in tendering urban public transport 12
operations. Transport Research Fourth Framework Programme Urban Transport – 13
Report 76, 229 p., European Communities, Luxembourg, 1998 14
8. European Standard. EN 13816: transportation – logistics and services – public 15
passenger transport – service quality definition, targeting and measurement. 16
Bruxelas, 2002 17
9. Kittlenson& Associates, Inc.; Kfc Group, Inc.; Parsons Brinckerhoff Quade& 18
Douglas, Inc; Hunter-Zaworski, K. Transit capacity and quality of service manual. 19
Transit Cooperative Research Program: Report 100, 2nd Edition, Washington, DC, 20
USA, 2003. 21
10. Ferraz, A. C. P. and Torres, I. G. E. Transporte Público Urbano. 2. ed. ampl. e 22
atual. São Carlos, 2004 23
11. Zairi, Mohamed. Effective Benchmarking: learning from the best. Chapman & 24
Hall, London, 1996 25
12. American Productivity & Quality Center – APQC. Emerging Best Practices in 26
Knowledge Management, American Productivity & Quality Center, Houston, TX., 27
1996 28
13. Randall, E. R., B. J. Condry, and M. Trompet International Bus System 29
Benchmarking: Performance Measurement Development, Challenges, and Lessons 30
Learned. In Transportation Research Board 86th Annual Meeting, TRB, 2007 31
14. Ryus, Paul; Coffel, Kathryn; Parks, Jamie; Kittlenson& Associates, Inc. A 32
methodology for performance measurement and peer comparison in the public 33
transportation industry. Transit Cooperative Research Program: Report 141, 34
Washington, DC, USA, 2010 35
15. Ribeiro, G. R. S. B.; Gonçalves, R. C. Estruturação de metodologia de 36
benchmarking para o setor de transporte rodoviário de passageiros. XXIX 37
Congresso Nacional de Pesquisa em Transporte da ANPET. Ouro Preto, nov 2015 38
16. Alouche, P. L. and Barbosa, M. C. Benchmarking: um importante projeto do metrô 39
de São Paulo. Revista dos transportes públicos, ANTP, n. 77, 1997, p. 63-72 40
17. MORPACE International, Inc.; Cambridge Systematics, Inc. A Handbook for 41
Measuring Customer Satisfaction and Service Quality. Transit Cooperative 42
Research Program: Report 47, 2nd Edition, Washington, DC, USA, 1999 43
18. EQUIP Consortium. The Benchmarking Handbook. Transport Programme Project 44
No. UR-98-RS.3076, Contract Report 4, Brussels, August 2000 45
19. Oliveira E. F. T. da and M. C. C. Grácio Análise a respeito do tamanho de amostras 46
Lindau et al. 13
aleatórias simples: uma aplicação na área de Ciência da Informação. Revista de 1
Ciência da Informação, v. 6, n. 3, 2005 2
20. Likert, R. A technique for the measurement of attitudes. New York: The Science 3
Press, 1932 4
21. Ribeiro, J. L. D.; Echeveste, M. E.; Danilevicz, A. M. F. A utilização do QFD na 5
otimização de produtos, processos e serviços. Porto Alegre: FEENG/UFRGS. Série 6
Monográfica Qualidade, 2001 7
8
9
Top Related