


Languages
Pages
Legal

Baseline IHM Assessment:
Improving Smallholder Farmers Livelihood through Mango
Production and Marketing Project
Salima, Central Region, Malawi
Self Help Africa (SHA) and Agriculture and Natural Resources Management Consortium
(ANARMAC)
August, 2013
Stella Ngoleka with SHA and EfD

i
Acknowledgements
The study team would like to thank the ANARMAC project officer, Alekeni Phiri,
Chiluwa EPA officers, Mr N. Phiri (AEDC) and Mr M. Mabuka (assistant AEDC) who
led the Livelihood Zone exercise and members of the communities of
Mfitiziyenderana1 village and Traditional Authority Khombeda who generously gave
their time. Thanks are also due to Evidence for Development, London for their
technical support and contributions to the text and to Wilm van Bekkum, SHA
Programme Development Advisor, for his contributions to the study protocol.
Self Help Africa receives support for its Malawi country programme and its
Monitoring and Evaluation processes from DFID through a PPA in consortium with
Farm Africa.
ii
LIST OF ACRONYMS
ANARMAC Agriculture and Natural Resources Management Consortium
EfD Evidence for Development
AEDO Agricultural Extension Development Officer
AEDC Agricultural Extension Development Coordinator
EPA Extension Planning Area
IHM Individual Household Method
MoAFS Ministry of Agriculture and Food Security
SEP Socio-Economic Planning
SHA Self Help Africa
TA Traditional Authority
iii
TABLE OF CONTENTS
LIST OF TABLES ................................................................................................................................... IV
LIST OF FIGURES ................................................................................................................................. .V
EXECUTIVE SUMMARY ......................................................................................................................... 6
CHAPTER ONE ....................................................................................................................................... 8
1.0. INTRODUCTION .............................................................................................................................. 8
1.1. DESCRIPTION OF THE PROJECT ........................................................................................................ 8
1.2. OBJECTIVES OF THE PROJECT .......................................................................................................... 8
1.3. THE IHM STUDY ............................................................................................................................. 9
2.0. METHODOLOGY .............................................................................................................................. 9
2.1. SAMPLING STRATEGY .................................................................................................................... 11
2.3. SURVEY IMPLEMENTATION ............................................................................................................. 12
2.4. DEFINITIONS USED IN IHM ............................................................................................................. 14
3.0. THE STANDARD OF LIVING THRESHOLD ............................................................................................ 15
CHAPTER TWO: SURVEY FINDINGS, LAKESHORE AGRO-FISHING ZONE .................................... 16
2.0. INTRODUCTION ............................................................................................................................ 16
2.1. FINDINGS AND DISCUSSION FOR MFITIZIYENDERANA VILLAGE ........................................... 16
2.1.1. HOUSEHOLD DISPOSABLE INCOME ............................................................................................... 17
2.1.2. SOURCES OF CASH INCOME (MK) ............................................................................................... 21
CHAPTER THREE: SURVEY FINDINGS, NORTHERN COTTON AND MAIZE PRODUCTION ZONE 27
3.0. INTRODUCTION ............................................................................................................................ 27
3.1. FINDINGS AND DISCUSSION ....................................................................................................... 27
3.1.1. HOUSEHOLD INCOME DISPOSABLE INCOME ................................................................................... 28
3.1.2. DISPOSABLE INCOME WITH STANDARD OF LIVING THRESHOLD ....................................................... 30
3.1.3. SOURCES OF FOOD INCOME (KILOCALORIES) ............................................................................... 31
3.1.4. SOURCES OF CASH INCOME (MK) ............................................................................................... 33
CONCLUSION ....................................................................................................................................... 38
iv
LIST OF TABLES
TABLE 1.1: GOODS AND SERVICES REQUIRED TO MEET MINIMUM STANDARD OF LIVING ................................... 15
TABLE 2.1: DISPOSABLE INCOME MEDIAN VALUE BY HOUSEHOLD INCOME ........................................................ 17
TABLE 3.1: DISPOSABLE INCOME MEDIAN VALUE BY INCOME QUINTILE .............................................................. 29
TABLE 3.2: PROPORTION OF INCOME FROM AGRICULTURAL TO NON AGRICULTURAL EMPLOYMENT .............. 35
TABLE 3.3: MAIN CASH CROPS INCOME PER ADULT EQUIVALENT IN MK BY QUINTILE ..................................... 37
v
LIST OF FIGURES
FIGURE 2.1: POPULATION PYRAMID FOR MFITIZIYENDERANA VILLAGE ............................................................... 16
FIGURE 2.2: HOUSEHOLD DISPOSABLE INCOME PER ADULT EQUIVALENT ......................................................... 17
FIGURE 2.3: STANDARD OF LIVING THRESHOLD (SOLT) ................................................................................... 18
FIGURE 2.4: FOOD INCOME PER ADULT EQUIVALENT IN KILOCALORIES ............................................................ 19
FIGURE 2.5: TWO MAIN SOURCES OF FOOD INCOME PER ADULT EQUIVALENT IN KILOCALORIES ..................... 19
FIGURE 2.6: OTHER SOURCES OF FOOD INCOME PER ADULT EQUIVALENT IN KILOCALORIES .......................... 20
FIGURE 2.7: CASH INCOME PER ADULT EQUIVALENT IN MK BY HOUSEHOLD .................................................... 21
FIGURE 2.8: TOTAL CASH INCOME PER ADULT EQUIVALENT IN MALAWI KWACHA ............................................ 22
FIGURE 2.9: THREE MAIN CASH CROP INCOME PER ADULT EQUIVALENT IN MK BY HOUSEHOLD .................... 23
FIGURE 2.10: CASH INCOME PER ADULT EQUIVALENT IN MK FROM AGRICULTURAL AND NON AGRICULTURAL
ACTIVITIES ................................................................................................................................................... 25
FIGURE 3.1: POPULATION PYRAMID ..................................................................................................................... 27
FIGURE 3.2: HOUSEHOLD DISPOSABLE INCOME PER ADULT EQUIVALENT ......................................................... 28
FIGURE 3.3: HOUSEHOLD DISPOSABLE INCOME PER ADULT EQUIVALENT FOR BENEFICIARY AND NON
BENEFICIARY HOUSEHOLDS ........................................................................................................................ 29
FIGURE 3.4: STANDARD OF LIVING THRESHOLD (SOLT) ................................................................................... 30
FIGURE 3.5: FOOD INCOME PER ADULT EQUIVALENT IN KCAL ........................................................................... 31
FIGURE 3.6: MINOR FOOD INCOME PER ADULT EQUIVALENT IN KCAL (ARROWS MARK NON-BENEFICIARY
HOUSEHOLDS) ............................................................................................................................................. 32
FIGURE 3.7: CASH INCOME PER ADULT EQUIVALENT IN MK BY HOUSEHOLD (ARROWS MARK NON-
BENEFICIARY HOUSEHOLDS) ....................................................................................................................... 34
FIGURE 3.8: CASH INCOME PER ADULT EQUIVALENT IN MK FROM OFF FARM AND FARM EMPLOYMENT ........ 35
FIGURE 3.9: TOTAL CASH INCOME PER ADULT EQUIVALENT IN MALAWI KWACHA ............................................ 36
FIGURE 3.10: MAIN CASH CROP INCOME PER ADULT EQUIVALENT IN MK BY HOUSEHOLD .............................. 37
6
EXECUTIVE SUMMARY
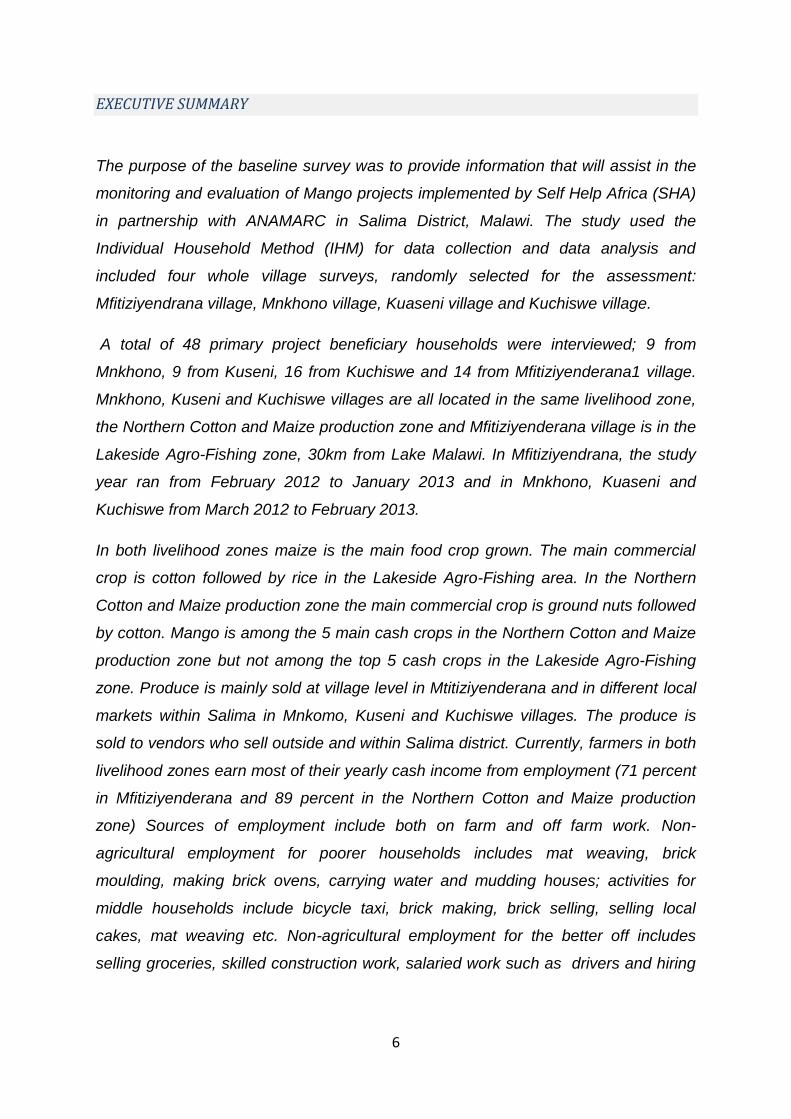
The purpose of the baseline survey was to provide information that will assist in the
monitoring and evaluation of Mango projects implemented by Self Help Africa (SHA)
in partnership with ANAMARC in Salima District, Malawi. The study used the
Individual Household Method (IHM) for data collection and data analysis and
included four whole village surveys, randomly selected for the assessment:
Mfitiziyendrana village, Mnkhono village, Kuaseni village and Kuchiswe village.
A total of 48 primary project beneficiary households were interviewed; 9 from
Mnkhono, 9 from Kuseni, 16 from Kuchiswe and 14 from Mfitiziyenderana1 village.
Mnkhono, Kuseni and Kuchiswe villages are all located in the same livelihood zone,
the Northern Cotton and Maize production zone and Mfitiziyenderana village is in the
Lakeside Agro-Fishing zone, 30km from Lake Malawi. In Mfitiziyendrana, the study
year ran from February 2012 to January 2013 and in Mnkhono, Kuaseni and
Kuchiswe from March 2012 to February 2013.
In both livelihood zones maize is the main food crop grown. The main commercial
crop is cotton followed by rice in the Lakeside Agro-Fishing area. In the Northern
Cotton and Maize production zone the main commercial crop is ground nuts followed
by cotton. Mango is among the 5 main cash crops in the Northern Cotton and Maize
production zone but not among the top 5 cash crops in the Lakeside Agro-Fishing
zone. Produce is mainly sold at village level in Mtitiziyenderana and in different local
markets within Salima in Mnkomo, Kuseni and Kuchiswe villages. The produce is
sold to vendors who sell outside and within Salima district. Currently, farmers in both
livelihood zones earn most of their yearly cash income from employment (71 percent
in Mfitiziyenderana and 89 percent in the Northern Cotton and Maize production
zone) Sources of employment include both on farm and off farm work. Non-
agricultural employment for poorer households includes mat weaving, brick
moulding, making brick ovens, carrying water and mudding houses; activities for
middle households include bicycle taxi, brick making, brick selling, selling local
cakes, mat weaving etc. Non-agricultural employment for the better off includes
selling groceries, skilled construction work, salaried work such as drivers and hiring

7
out bicycles. Major agricultural employment includes land clearing, weeding, ridging
and cotton spraying all done by poorer households.
All households in the study area had access to sufficient income to meet WHO
recommended food energy requirements- none fell below the ‘food poverty line’.
Soil type and distance to water sources in Mnkhono, Kuseni and Kuchiswe villages
are the main challenges faced by households that also have implications for the
mango project. In Mfitiziyenderana the soil is good for mangoes and water is
available. Key informants indicated that markets and cost of transport of produce to
market centres is the main challenge faced by farmers in both zones.

8
CHAPTER ONE
1.0. INTRODUCTION
This is a baseline study, designed to support the monitoring and evaluation of the
‘Improving smallholder farmers’ livelihoods through Mango production and
marketing’ project, implemented in Salima District, Malawi, by Self Help Africa (SHA)
in partnership with the ANAMARC. The baseline study targeted two livelihood zones
namely the Northern Cotton and Maize production zone and the Lakeside Agro-
Fishing zone1.
1.1. Description of the Project
The project aims at ‘developing enterprise solutions that enable smallholder farmers
to achieve a better quality of life’. It is targeting poor farmers, particularly women.
Women are involved in many activities along the mango value chain; however it is
understood that they do not get adequate economic benefits from these activities
and for this reason have been targeted by the project.
Beneficiaries were selected based on the following criteria
Smallholder farmer resident in the area for more than 10 years
Should own land to grow seedlings
Should have mango trees for top-working
Should belong to Liwadzi or Chiluwa Cooperative
1.2. Objectives of the Project
The Mango project’s ultimate goal is to reduce poverty and hunger among resource
poor smallholder farmers in the targeted communities of TA Khombedza and
Karonga/Mwanza in Salima district by the promotion of mango production,
processing and marketing. The project is expected to increase mango production
and raise income levels as well as increasing off season consumption of mangoes. The
project started in 2012 and is due to end in 2015. During this three year project,
1 See appendix III for details of livelihood zoning

9
selected farmers will receive mango seedlings and others will provide their local
mango trees for grafting with improved stock.
1.3. The IHM Study
The goal of the IHM study was to measure baseline economic and social indicators
to help the implementation of the key components of the mango project. Data was
collected on household income with reference to the year before project inputs were
distributed. This will allow comparisons with data gathered in the mid-term and end
of project period. In this survey whole village studies were carried out all four
selected villages, located in the two livelihood zones. The methodology used will
provide a simple monitoring system and evaluation for the project.
2.0. METHODOLOGY
The Individual Household Method (IHM) was used to collect and analyse data on
household livelihoods. The IHM is a method for measuring household income,
developed by Evidence for Development2. In common with other household budget
survey methods, the IHM involves the collection of household income data for the
purpose of policy development and planning. However, the IHM differs from other
approaches in (i) the method of data collection (a semi structured interview, rather
than a standard questionnaire format is used) and (ii) the use of specialised
software, which allows data checking and analysis to be carried out in the field.
Together these reduce the risk of errors in data collection and allow errors to be
identified and corrected.
The steps in an IHM study are as follows. First, before any individual household
interviews take place, a preliminary survey is conducted involving community leaders
and other local key informants. This allows the team to explain in detail the purpose
of the assessment, and to refine key research questions. It provides interviewers
with basic information on the local economy and economic activities that
subsequently allows them to identify inconsistencies in individual household
interviews, and to cross question where appropriate. The preliminary survey also
involves mapping the study area and drawing the sample.
2 See www.evidencefordevelopment.org

10
Second, individual household interviews are kept short (between 45 – 60 minutes) to
avoid interviewer/ interviewee fatigue and where possible, appointments are made
with households to arrange a time that does not interrupt normal working activities.
Third, on returning from the survey site, data is consolidated and entered into the
IHM database. This allows for cross checking and identification of apparent
anomalies in the data which can be discussed with the interviewer and followed up
the next day.
The baseline survey carried out in Salima district included an additional ‘Livelihood
Zoning’ step. A livelihood zone (LZ) is defined as an agro-ecological area in which
the population has access to the same range of economic opportunities, including
crop and livestock production, access to markets and employment. In consultation
with a local agricultural extension worker, the agro ecological and economic
characteristics of different zones were identified. At the end of the process, four LZs
were identified in Salima district3 It was established that Mfitiziyenderana, the first
randomly sampled village was in Lakeside agro-fishing area. . The second LZ
sampled was the Northern Cotton and Maize production zone where three villages
namely Mnkhono, Kuseni, Kuchiswe were randomly selected. As the three villages
fall within the same livelihood zone, information from the sampled households could
be combined for analysis. Additional information on the characteristics of the
livelihood zones can be found in Appendix II [see Appendix file in this folder]
The contextual information for the Lakeshore Agro-Fishing zone was collected from
Mfitiziyenderana village and for the Northern Cotton and Maize production zone from
Mnkhomo village, through interviews with knowledgeable local key informants.
Individual household interviews were conducted with all households present during
the study’s reference period. Household interviews focus on household demography,
land and other assets and all sources of income, classified under five headings:
crops, livestock and livestock products, employment, transfers/gifts and wild foods.
Additional contextual information on farming practices (agricultural labour), business
performance and wages, access to credit, input use and institutions and
organizations present in the villages was also collected. The complete interview form
3 4 LZs identified in Salima are Northern Cotton and Maize production zone, Lakeside Agro-Fishing zone,
Salima South zone and Chipoka-Sengabay Lakeside zone
11
for both the household-level survey and the village-level survey are included in the
Salima Mango Project Appendices file that accompanies this report.
The IHM survey instruments are designed to be user-friendly for the enumerators in
the field, while also gathering extremely detailed data at both the individual and
village levels. We developed a series of direct and indirect approaches to addressing
sensitive labour issues, gathering data on workers on farms (including type of work,
forms of payment and duration of employment), school attendance, and any periods
of absence of household members eg for migrant work. Additional information was
also gathered by the survey team on social interactions and individual policy
preferences and priorities through observation and discussion with communities
(e.g., the most important problems facing the village). In addition, the survey
provided detailed information on crop yields and productivity, and current levels of
knowledge of the bean market, the local economy and household coping
mechanisms.
Besides collecting data from individual farmers and village leaders in an interview
format, the baseline survey also incorporates data from direct observations recorded
by the survey team (e.g. on road access and quality, building materials and
maintenance). Finally, information on local measures was recorded converted to
standard measures. The detailed nature in the data collected by the survey will allow
us to examine the specific mechanisms by which different types of initiatives
generate positive effects for Mango farmers over time. Field work was conducted
over 7 days (11th August to 17th August 2013).
2.1. Sampling Strategy
The study locations were randomly selected from a list of 23 Farmers Clubs within
the 13 GVHs in the ANARMAC Mango production project area.
The study villages were randomly selected from a list of possible study sites. Villages
had to have enough project beneficiaries to allow a plausible assessment of project
impact in subsequent follow up work. The final selection was made from a list of 6
GVHs that met the selection criteria in terms of number of beneficiaries per village.

12
One GVH was randomly selected from the list and one farmer’s club was randomly
selected from all the clubs in that GVH. When the team was in the field the exact
number of households and project beneficiaries in the village was confirmed. As this
was lower than anticipated it was possible to extend the area covered. To ensure a
range of conditions were included in this baseline study a second livelihood zone
was identified and 3 small villages within the zone were randomly selected to provide
a wider representation or the project and its beneficiaries in the study.
The first selected site (Mfitiziyenderana village) has 22 households. Of the 22
households 14 households were interviewed4. During the study period it was
established that there were a total of 16 beneficiary households in the village but
they had not yet received mango project inputs. In the second site (Mkhono, Kuseni
and Kuchiswe villages in the Northern cotton and maize production zone) 46
households (from a total of 57 households5) were included in the study, of which 34
were project beneficiaries.
2.3. Survey Implementation
To implement the survey, we worked with field researchers who have considerable
experience conducting surveys using the IHM method of data collection. The survey
followed a strict IHM protocol to ensure quality data and sensitivity to the local
context and confidentiality. Interviews were conducted in the local languages6.
Before the survey, a short refresher training was conducted by the team leader on
first day of field work. The training encompassed explanations of the purpose and
background of the study as well as a livelihood zoning exercise with the Agricultural
Extension worker and a review of the contextual and household interview forms. The
survey teams were given precise protocols for entering villages, obtaining approvals
from district officials and village chiefs and explaining the purpose of the exercise.
The team was comprised of eight interviewers three of whom were University of
4 Datails of reasons households were not interviewed are included in Appendix III
5 Datails of reasons households were not interviewed are included in Appendix III
6As part of EfD’s capacity building partnership with SHA, Lonjezo Masikini and Lovemore Chikalend took on the
role of ‘assistant leaders’ working closely with EfD associate Stella Ngoleka who led the survey.
13
Malawi post graduates, two University of Malawi undergraduates, two SHA project
officers and one from a partner organization7.
The protocol we developed was for the survey team to meet with the village leader
(the chief) when they first arrived in each of the survey sites, explain the research,
describe the surveys, and obtain permission from AEDO to proceed. We interviewed
a total sample of 14 households in the Lakeside agro-fishing area LZ and 46
households in Northern cotton and maize production LZ, gathering information from
all households present in the reference year (both beneficiaries and non-
beneficiaries). To collect context information, a minimum of eight to twelve key
informants representing the farming community were interviewed, including both
male and female farmers and village chiefs. General information on agriculture was
gathered in the focus group discussions including crop and livestock production,
markets, employment, business, petty trade, salaried work, wild foods, formal and
social transfers, other projects in the area, locally defined wealth indicators and the
cost of inputs. With the village head man and key village members a list of stage one
MANGO targeted farmers in the selected villages was drawn up. Additional
information was gathered from published sources including the Salima District
Assembly socio-economic profile and data from Meteorological department.
Information on yields, production, and minimum and maximum prices for specific
crops was obtained from the participants in the focus group discussion in the
selected villages. The soil type, rainfall, potential markets, access to farm inputs and
coping mechanisms in the event of shocks were discussed in focus group discussion
and verified with local agricultural officers. This baseline survey therefore provides
rich insights into conditions faced by mango farmers across the sampled livelihood
zones.
7 See appendix IV. for study participants and their IHM levels
14
2.4. Definitions used in IHM
2.4.1. The household
A household was defined as those people resident in the house and eating from one
pot during the reference year.
2.4.2. Household income
Household income is made up partly in food, and partly in money. In many cases
some or all food income is not sold, so no price is available for that food. This means
that total household income cannot be calculated in terms of money. Therefore a
standardized presentation is used in terms of 'disposable income'/ adult equivalent.
This is defined in the IHM as:
The money income remaining to the household after it has met its food energy
requirement at a standard rate, for each 'adult equivalent' in the household.
This is calculated from
1. The household’s total food energy requirement, calculated from UN reference
values8. This is based on the period individuals were actually resident in the
household, so periods away from home e.g. at boarding school, doing migrant labour
are excluded.
2. The cost of the proportion of the household energy requirement not met from the
household's income as food (Kcal income) estimated using a set diet defined in
discussion with poorer residents as being typical of the diets of poorer households.
In this study the diet used was maize.
3. The disposable income is calculated by subtracting the cost of the minimum diet
from the total household money income.
The result is standardized to take account of variation in household size by dividing
the disposable income by the number of 'adult equivalents' in the household. The
8 Individual food energy requirement was calculated by age and sex from World Health Organisation ‘Energy
and protein requirements’ (WHO technical report series 724, Geneva 1985) for the population of a typical developing country. Averaged over the entire population requirement approximates to 2100 kcal/ person/ day.

15
number of adult equivalents is calculated as the total household energy requirement/
the energy requirement of a young adult (2,600Kcals/day).9
3.0. THE STANDARD OF LIVING THRESHOLD
The cost of a basket of goods and services sufficient to achieve a minimum
acceptable standard of living was established in discussion with residents (Table 1).
Table 1.1: Goods and services required to meet minimum standard of living
Expense type Cost per year Applies to:
Mfitiziyenderana1
village
Mnkhono
village
Soap 1300 16000 The household
Paraffin/other
fuel
1365 2400 The household
Clothes male 4200 5000 Adult male aged over 15
years
Clothes female 3150 4000 Adult female aged over
15 years
Clothes child
male
1100 3000 Male child aged 4 to 14
years
Clothes child
female
1800 2200 Female child aged 4 to
14 years
Primary school 3450 1050 All children aged 7 to 13
years
Matches 150 200 The household
Salt 1385 580 The household
Table 1.1 indicates that the cost of a basket of goods and services sufficient to
achieve a minimum acceptable standard of living was higher in in the Northern
9 See www.evidencefordevelopment.org

16
Cotton livelihood zone. This is because the zone is located nearer Salima town
compared to the Lakeside Agro-Fishing zone. Note that the standard of living
threshold reflects the amount actually spent by poor households to reach the locally
defined ‘acceptable standard’.
CHAPTER TWO: Survey findings, Lakeshore agro-fishing zone
2.0. Introduction
This chapter covers findings from Mfitiziyenderana village in the Lakeside agro-
fishing livelihood zone.
2.1. Findings and Discussion for Mfitiziyenderana Village
The analysis was done using the open-ihm software version 1.5.1.The charts in this
section show the result of the whole village survey, carried out in Mfitiziyenderana
village.
Figure 2.1: Population pyramid for Mfitiziyenderana village
Not
Note that only 14 households were interviewed for this study, which may account for the
‘gaps’ in the population pyramid. The other survey site, which included 46 households, has
a more typical population profile.
17
2.1.1. Household disposable income
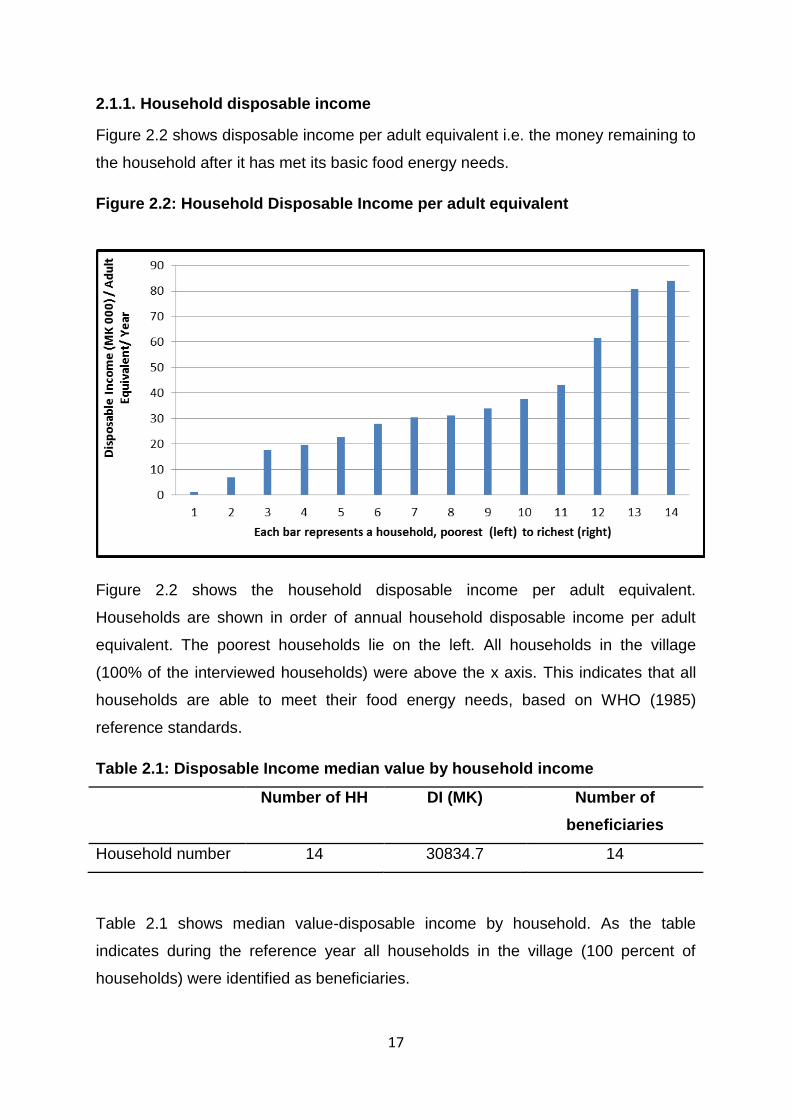
Figure 2.2 shows disposable income per adult equivalent i.e. the money remaining to
the household after it has met its basic food energy needs.
Figure 2.2: Household Disposable Income per adult equivalent
Figure 2.2 shows the household disposable income per adult equivalent.
Households are shown in order of annual household disposable income per adult
equivalent. The poorest households lie on the left. All households in the village
(100% of the interviewed households) were above the x axis. This indicates that all
households are able to meet their food energy needs, based on WHO (1985)
reference standards.
Table 2.1: Disposable Income median value by household income
Number of HH DI (MK) Number of
beneficiaries
Household number 14 30834.7 14
Table 2.1 shows median value-disposable income by household. As the table
indicates during the reference year all households in the village (100 percent of
households) were identified as beneficiaries.
18
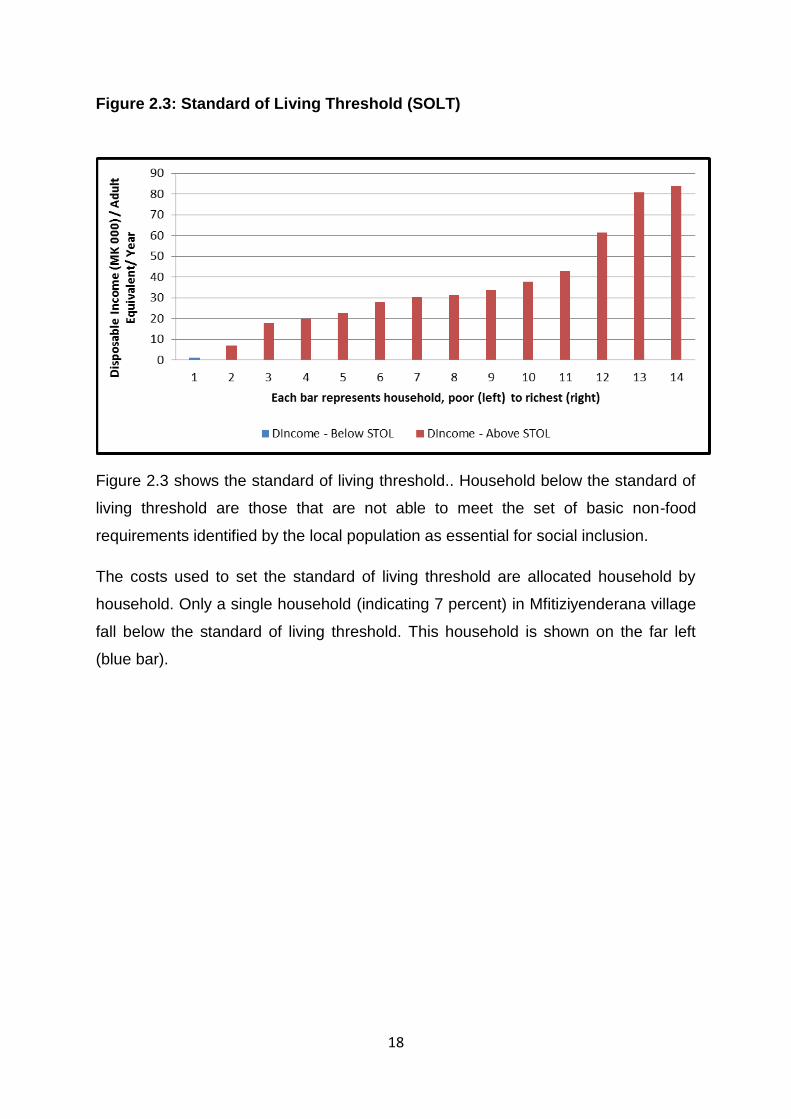
Figure 2.3: Standard of Living Threshold (SOLT)
Figure 2.3 shows the standard of living threshold.. Household below the standard of
living threshold are those that are not able to meet the set of basic non-food
requirements identified by the local population as essential for social inclusion.
The costs used to set the standard of living threshold are allocated household by
household. Only a single household (indicating 7 percent) in Mfitiziyenderana village
fall below the standard of living threshold. This household is shown on the far left
(blue bar).
19
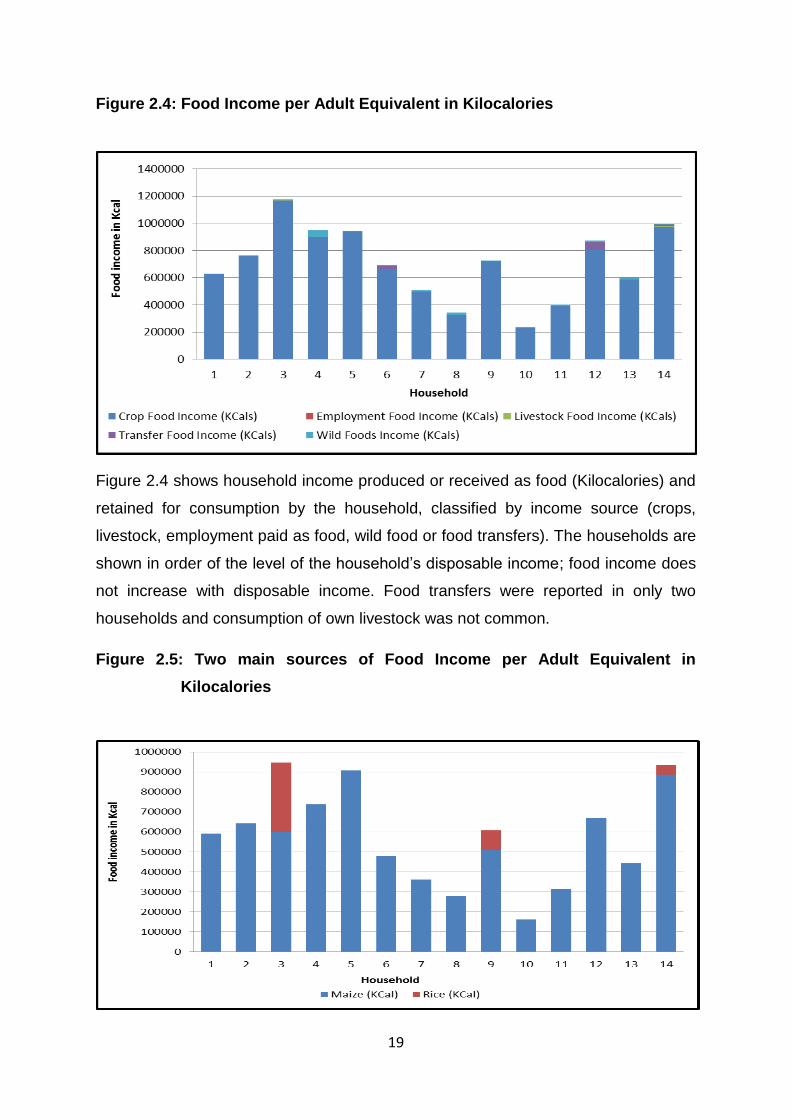
Figure 2.4: Food Income per Adult Equivalent in Kilocalories
Figure 2.4 shows household income produced or received as food (Kilocalories) and
retained for consumption by the household, classified by income source (crops,
livestock, employment paid as food, wild food or food transfers). The households are
shown in order of the level of the household’s disposable income; food income does
not increase with disposable income. Food transfers were reported in only two
households and consumption of own livestock was not common.
Figure 2.5: Two main sources of Food Income per Adult Equivalent in
Kilocalories
20
Figure 2.5 shows the two main sources of food income per adult equivalent in
Kilocalories. Maize is the main staple food followed by rice. The food energy (Kcal)
contribution from maize is far higher than rice. Within the Lakeshore agro fishing
livelihood zone some villages were producing more rice than in this village. The
reasons for this difference could be explored further.
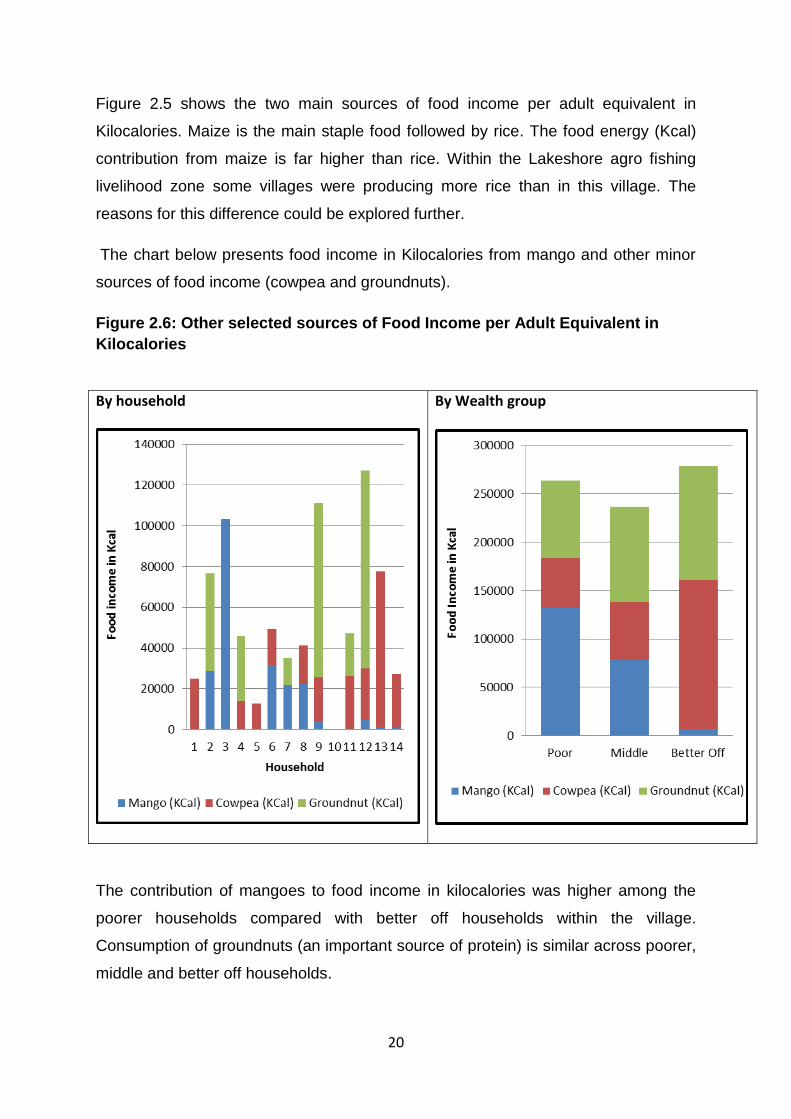
The chart below presents food income in Kilocalories from mango and other minor
sources of food income (cowpea and groundnuts).
Figure 2.6: Other selected sources of Food Income per Adult Equivalent in
Kilocalories
By household
By Wealth group
The contribution of mangoes to food income in kilocalories was higher among the
poorer households compared with better off households within the village.
Consumption of groundnuts (an important source of protein) is similar across poorer,
middle and better off households.
21
2.1.2. Sources of Cash Income (MK)
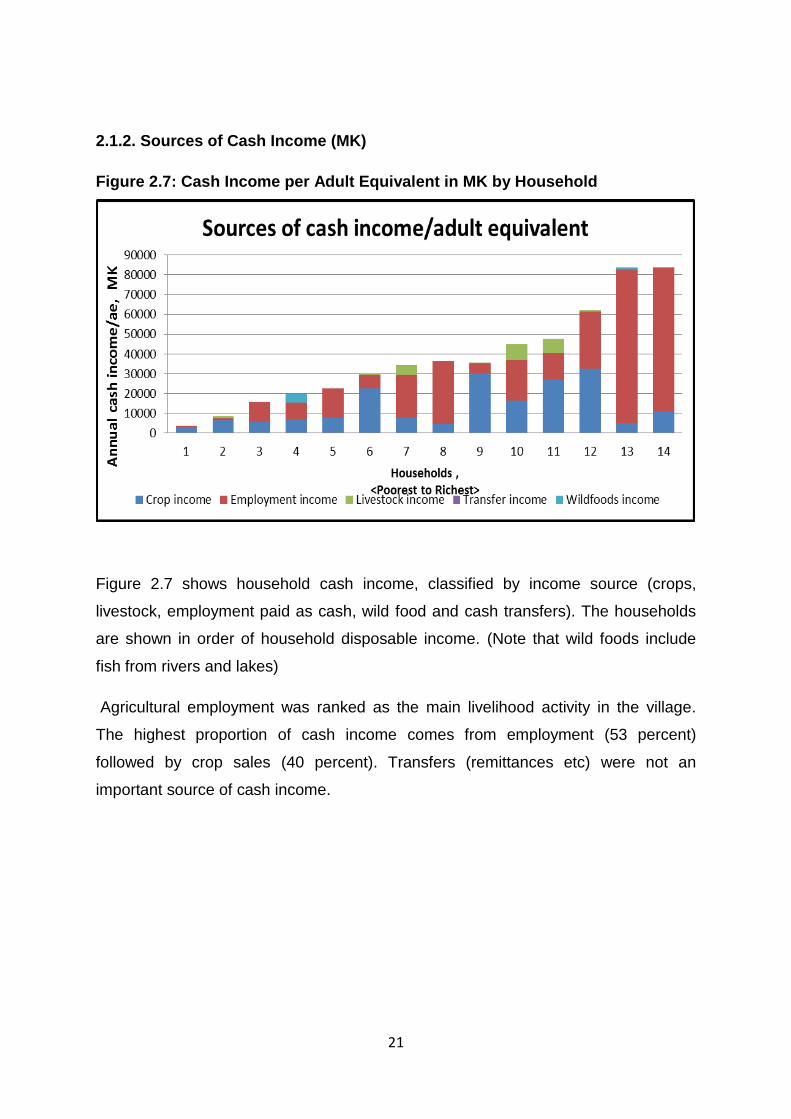
Figure 2.7: Cash Income per Adult Equivalent in MK by Household
Figure 2.7 shows household cash income, classified by income source (crops,
livestock, employment paid as cash, wild food and cash transfers). The households
are shown in order of household disposable income. (Note that wild foods include
fish from rivers and lakes)
Agricultural employment was ranked as the main livelihood activity in the village.
The highest proportion of cash income comes from employment (53 percent)
followed by crop sales (40 percent). Transfers (remittances etc) were not an
important source of cash income.

22
Figure 2.8: Total Cash Income per Adult Equivalent in Malawi Kwacha
Figure 2.8 shows total cash income per adult equivalent in Malawi Kwacha.
Employment income ranks as the major source of cash income followed by crop
income. Employment income includes income generated from both agricultural and
non- agricultural activities. Examples of non-agricultural activities include mat
weaving, selling local beer, petty trade etc. The main crops being sold were cotton,
rice and maize. Fishing contributed 63 percent of wild food cash income.
Fishing was among the main livelihood activities in the area in the past five years.
However during key informant interviews it was revealed that households are now
changing their livelihood activities (from fishing to crop production) due to lower
returns, possibly linked to over fishing and drying up of the lake and major rivers on
the boundary of the zone (the Lingazi and Liwazi rivers). The distance from the
village to the lake (30km) is another factor, although a small number of housheolds
have temporary houses closer to the lakeshore.
23
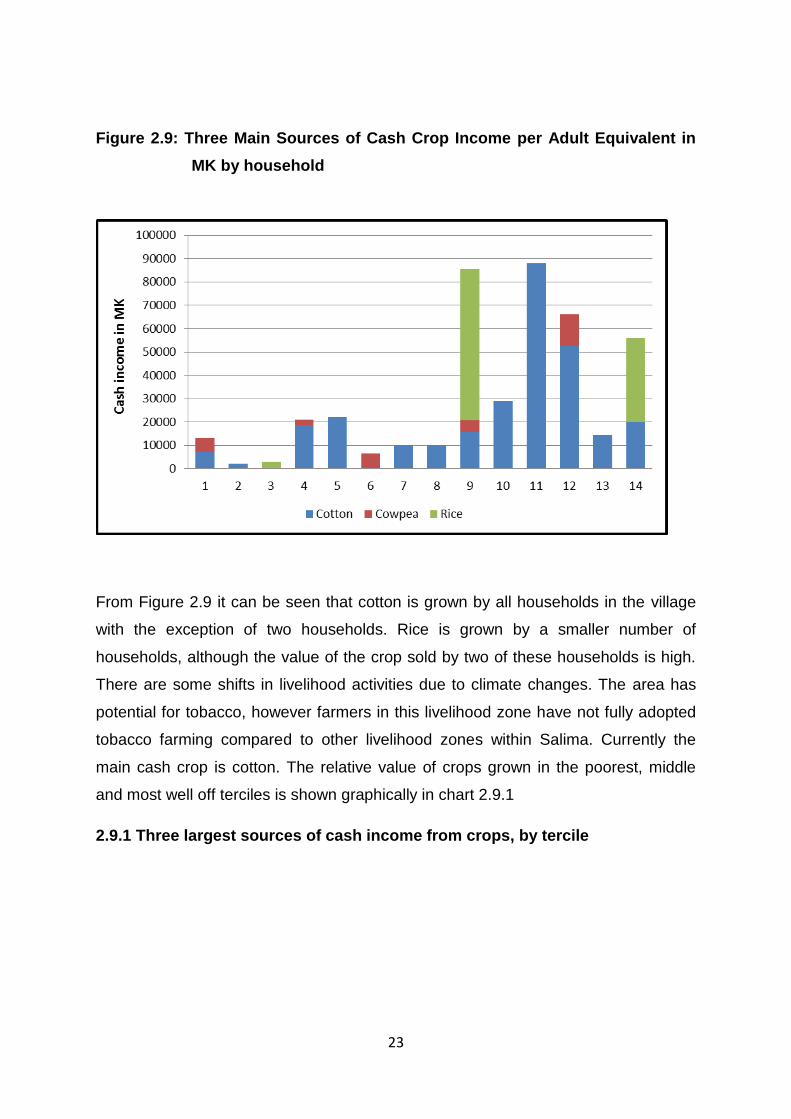
Figure 2.9: Three Main Sources of Cash Crop Income per Adult Equivalent in
MK by household
From Figure 2.9 it can be seen that cotton is grown by all households in the village
with the exception of two households. Rice is grown by a smaller number of
households, although the value of the crop sold by two of these households is high.
There are some shifts in livelihood activities due to climate changes. The area has
potential for tobacco, however farmers in this livelihood zone have not fully adopted
tobacco farming compared to other livelihood zones within Salima. Currently the
main cash crop is cotton. The relative value of crops grown in the poorest, middle
and most well off terciles is shown graphically in chart 2.9.1
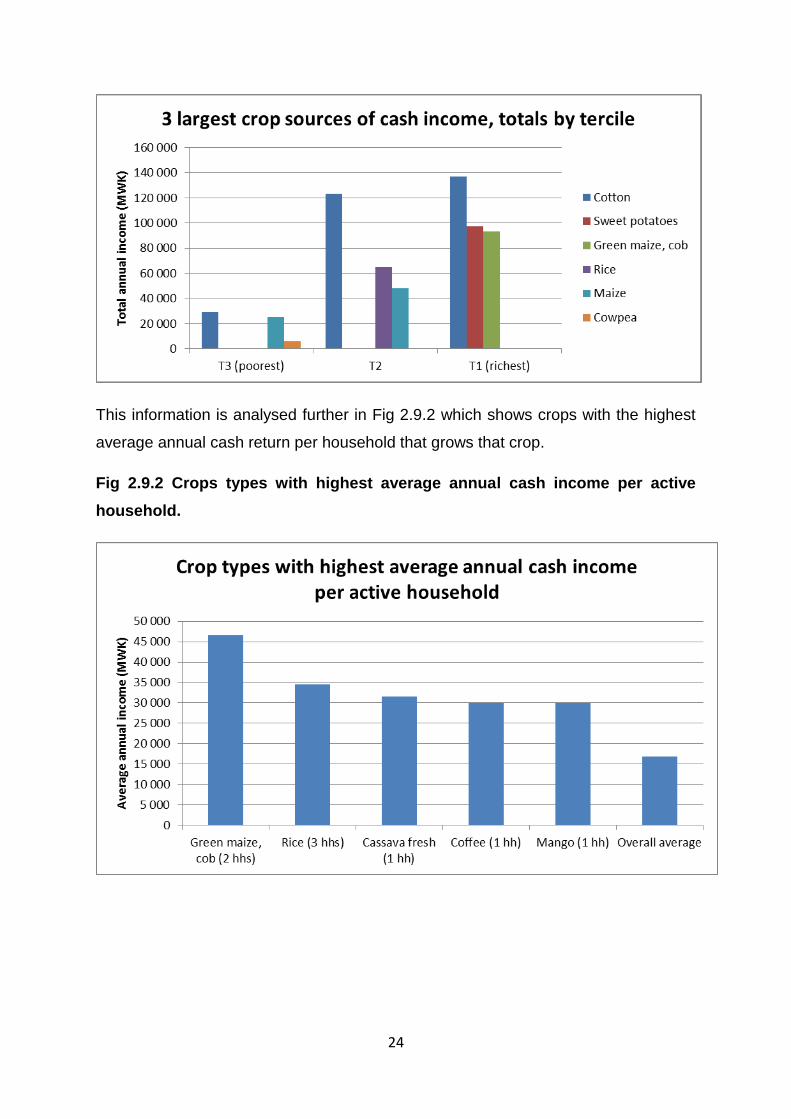
2.9.1 Three largest sources of cash income from crops, by tercile
24
This information is analysed further in Fig 2.9.2 which shows crops with the highest
average annual cash return per household that grows that crop.
Fig 2.9.2 Crops types with highest average annual cash income per active
household.

25
There are some shifts in livelihood activities due to climate changes. The area has
potential for tobacco, however farmers in this livelihood zone have not adopted
tobacco farming to the same extent as in other livelihood zones within Salima district.
Figure 2.10: Cash Income per Adult Equivalent in MK from Agricultural and
Non Agricultural activities
Figure 2.10 indicates that non-agricultural activities provide a higher proportion of
cash income than agricultural employment: 72% of all employment income is derived
from non-agricultural work. Non-agricultural activities provided income for all but
three households. Sources of non-agricultural employment among the better off
households include petty trade, mat weaving, public works, sieve making and tin-
smithing. As noted in the figure the two poorest households generated 100 percent
of their employment cash income from casual farm labour. These include weeding,
land clearing, ridging and harvesting. Cotton spraying in private farms owned by
companies and better off households within and outside the livelihood zone also
provides agricultural piece work for poor and middle income households in this
livelihood zone.
26
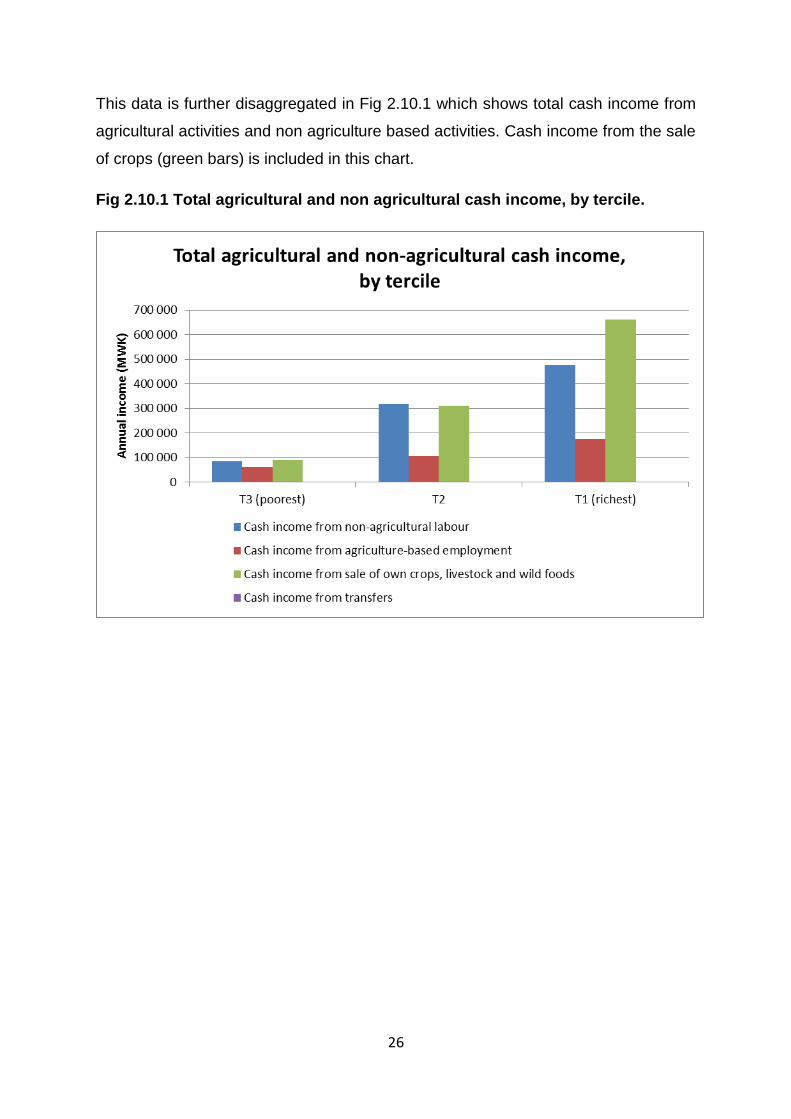
This data is further disaggregated in Fig 2.10.1 which shows total cash income from
agricultural activities and non agriculture based activities. Cash income from the sale
of crops (green bars) is included in this chart.
Fig 2.10.1 Total agricultural and non agricultural cash income, by tercile.

27
CHAPTER THREE: Survey findings, Northern Cotton and Maize
production zone
3.0. Introduction
The section covers findings from the Northern Cotton and Maize production zone.
The baseline study was conducted after the beneficiary households were selected.
This chapter sets out baseline findings for both non targeted and targeted
(beneficiary) households.
3.1. Findings and Discussion
In this zone three village,s Mnkhono, Kuseni and Kuchiswe, were sampled. As the
villages are in the same livelihood zone, the analysis presented in this section is for
the combined data sets. Of the 46 households included in the analysis, a total of 34
households were beneficiaries: 9 were from Mnkhono village, 9 from Kuseni village,
16 from Kuchiswe village.
Figure 3.1: Population pyramid

28
3.1.1. Household income disposable income
Figure 3.2 shows disposable income per adult equivalent i.e. the money remaining to
the household after it has met its basic food energy needs.
Figure 3.2: Household Disposable Income per adult equivalent
Figure 3.2 shows household disposable income per adult equivalent. The
households are represented by vertical bars10 Households are displayed in order of
their annual household disposable income per adult equivalent. The poorest
households are on the left while the richest households are on the. All households
(100 percent) as indicated in the figure are able to meet their basic food energy
needs. Figure 3.3 below shows disposable income per adult equivalent for
beneficiaries and non-beneficiaries. In the figure red bars indicate beneficiary
households.
10
Note that numbers on the x axis do not correspond with household ID numbers

29
Figure 3.3: Household Disposable Income per adult equivalent for Beneficiary
and Non Beneficiary households
The figure indicates that the households were selected with no specific consideration
of their current economic status: beneficiary households are spread across all
income groups.
Table 3.1: Disposable Income median value by income quintile
Quintiles
(Poorest to
Richest)
Number
of HH
DI quintiles-median value
(MK)
Number of
beneficiaries
Quintile 1 10 8,295.9 10
Quintile 2 9 16,862.5 7
Quintile 3 9 36,450.7 5
Quintile 4 9 66,317.6 5
Quintile 5 9 167,777.9 7
30
Table 3.1 indicates there are 34 beneficiary households interviewed in the study
area. Note that the poorest quintile has the highest number of beneficiary
households (10).
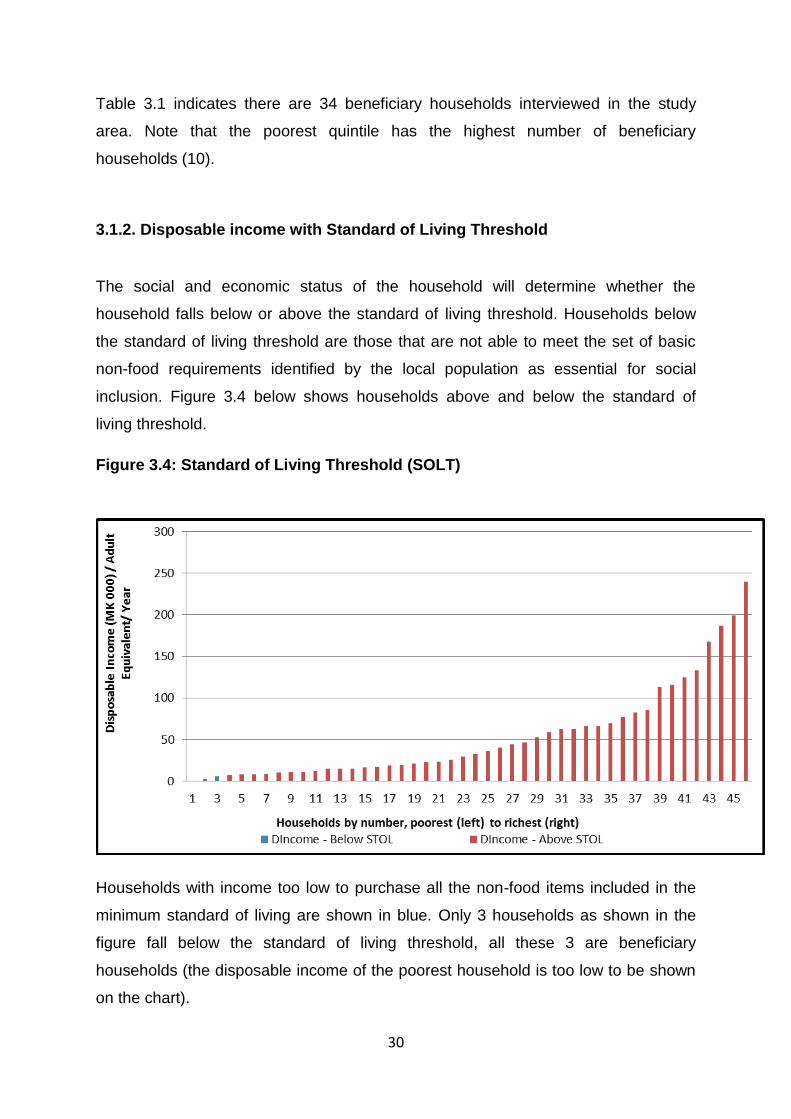
3.1.2. Disposable income with Standard of Living Threshold
The social and economic status of the household will determine whether the
household falls below or above the standard of living threshold. Households below
the standard of living threshold are those that are not able to meet the set of basic
non-food requirements identified by the local population as essential for social
inclusion. Figure 3.4 below shows households above and below the standard of
living threshold.
Figure 3.4: Standard of Living Threshold (SOLT)
Households with income too low to purchase all the non-food items included in the
minimum standard of living are shown in blue. Only 3 households as shown in the
figure fall below the standard of living threshold, all these 3 are beneficiary
households (the disposable income of the poorest household is too low to be shown
on the chart).

31
3.1.3. Sources of Food Income (Kilocalories)
Figure 3.4 below shows household income produced or received as food
(Kilocalories) and retained for consumption by the household, classified by income
source (crops, livestock and employment paid as food, wild food and food transfers).
Households are shown in order of household disposable income poorest to the left
and richest to the right of the figure.
Figure 3.5: Food Income per Adult Equivalent in Kcal
(arrows mark non-beneficiary households)
All households as indicated in the figure derive food income from their own crop
production, livestock products, transfers; wild foods and employment also provide
some food income for a few households. Figure 3.5 also shows that household food
income does not depend on the wealth of the household. Some poorer households
are retaining more of their own food for consumption than better off households.
Some of the wealthier households receive food transfers (these are likely to be gifts
from relatives).
The main food crop reported in this livelihood zone was maize contributing about 80
percent of food income in kilocalories. From this, it can be noted that maize is a
predominant food income crop in the area. The other two main food crops reported
were cowpeas and groundnuts in that order. Figure 3.6 below represents these

32
crops. The chart includes mango for easy comparisons of contribution of mango to
household food income.
Figure 3.6: Minor Food Income per Adult Equivalent in Kcal
(arrows mark non-beneficiary households)
Just as in Mfitiziyenderana, in the three villages presented in Figure 3.7 it can be
seen that mango contributes a small proportion of the kilocalorie food income of the
surveyed households.. This is shown in the following charts.
Fig 3.6.1 compares the total annual kcal income of the entire survey population with
the total annual kcal value of mangoes
Fig 3.6.1 Whole village food income from mangoes compared with other
sources
33
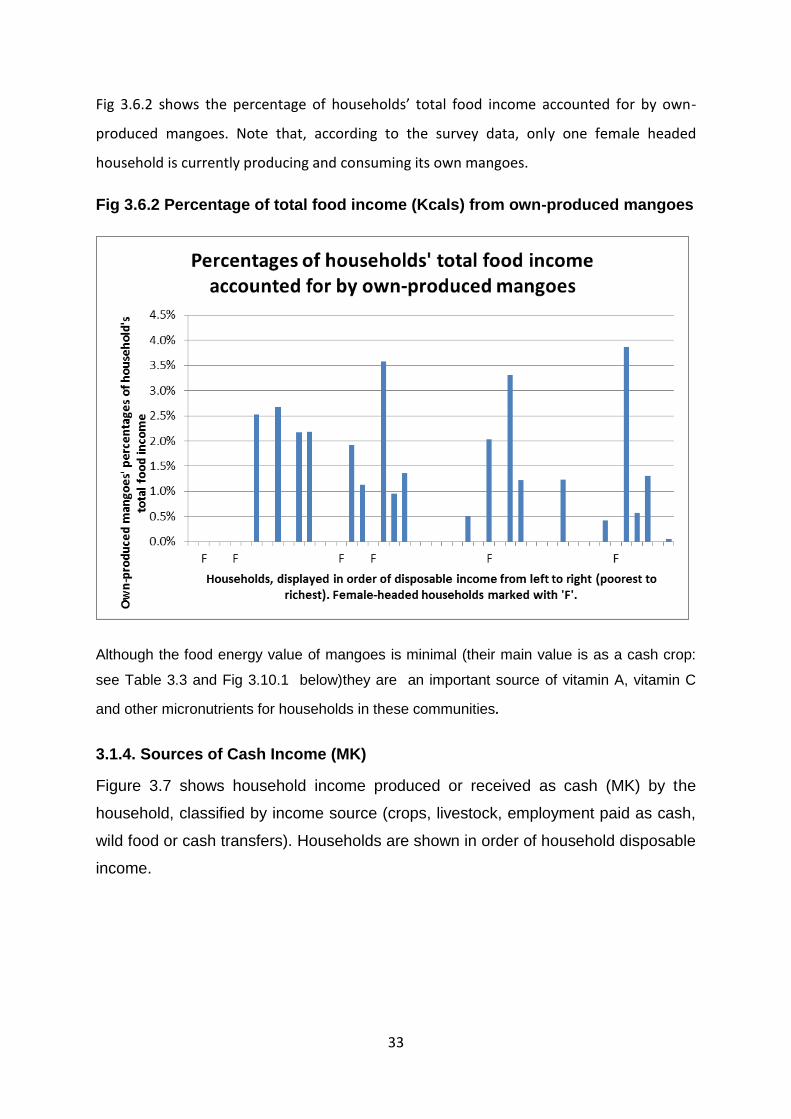
Fig 3.6.2 shows the percentage of households’ total food income accounted for by own-
produced mangoes. Note that, according to the survey data, only one female headed
household is currently producing and consuming its own mangoes.
Fig 3.6.2 Percentage of total food income (Kcals) from own-produced mangoes
Although the food energy value of mangoes is minimal (their main value is as a cash crop:
see Table 3.3 and Fig 3.10.1 below)they are an important source of vitamin A, vitamin C
and other micronutrients for households in these communities.
3.1.4. Sources of Cash Income (MK)
Figure 3.7 shows household income produced or received as cash (MK) by the
household, classified by income source (crops, livestock, employment paid as cash,
wild food or cash transfers). Households are shown in order of household disposable
income.

34
Figure 3.7: Cash Income per Adult Equivalent in MK by Household (arrows
mark non-beneficiary households)
Figure 3.7 indicates employment provides a higher proportion of cash income than
any other type of income source in the village. Employment income includes both
agricultural and non-agricultural activities. Figure 3.8 below presents the summary of
these findings.

35
Figure 3.8: Cash Income per Adult Equivalent in MK from agricultural and
non-agricultural Employment
Figure 3.8 indicates that employment from off farm activitiesl contributed a large
proportion in all income quintiles. Over all, cash from off farm employment was 89
percent. In quintile one agricultural employment contributed a large proportion, 86
percent. In quintile two, three four and five the contribution of agricultural
employment to was 25, 34, 17 and 2 percent respectively. The findings are
summarized in Table 3.2 below.
Table 3.2: Proportion of Income from Agricultural to Non Agricultural
Employment
Quintile (Poorest to Richest)
Total Non-Agricultural Employment (MK)
Total Agricultural Employment (MK)
Agricultural to Non Agricultural Income
in Percentage
Quintile 1 170,000 145,700 86
Quintile 2 338,830 84,633 25
Quintile 3 666,948 228,050 34
Quintile 4 987,200 170,000 17
Quintile 5 3,032,700 46,000 1.5

36
Non-agricultural employment for poorer households includes bicycle taxi, brick
making, brick selling, selling local cakes, mat weaving etc. Non-agricultural
employment for the better off includes selling groceries, construction work, salaried
work like driver and bicycle hire. Major agricultural employment includes land
clearing, weeding, ridging and cotton spraying
Figure 3.9: Total Cash Income per Adult Equivalent in Malawi Kwacha
The households’ total cash income was mostly sourced through employment in both
agricultural and non-agricultural activities in the study area11. Crop income ranks
second with crops such as cotton, maize and groundnuts being most important.
Livestock income also contributes to the overall cash income followed by transfers
which were not common in the area. Wild foods contribute the smallest proportion of
cash income.
11
Types of off farm work available in the study area are included in Appendix, table V II
37
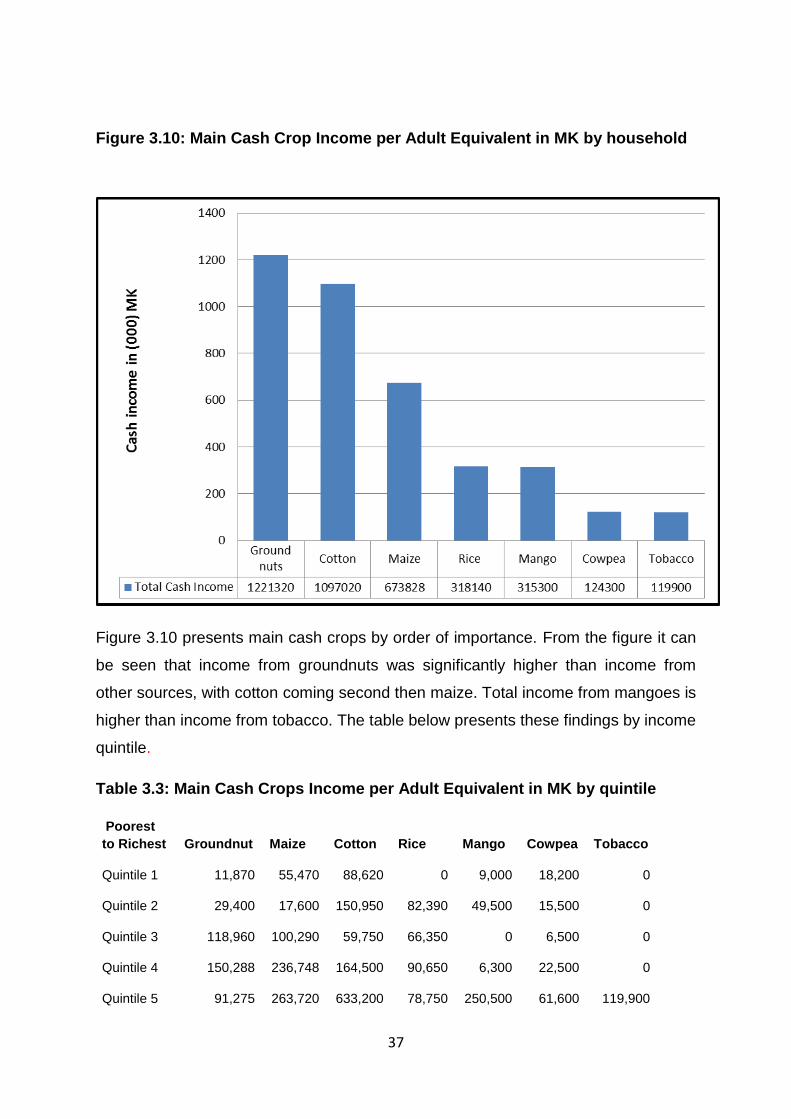
Figure 3.10: Main Cash Crop Income per Adult Equivalent in MK by household
Figure 3.10 presents main cash crops by order of importance. From the figure it can
be seen that income from groundnuts was significantly higher than income from
other sources, with cotton coming second then maize. Total income from mangoes is
higher than income from tobacco. The table below presents these findings by income
quintile.
Table 3.3: Main Cash Crops Income per Adult Equivalent in MK by quintile
Poorest
to Richest Groundnut Maize Cotton Rice Mango Cowpea Tobacco
Quintile 1 11,870 55,470 88,620 0 9,000 18,200 0
Quintile 2 29,400 17,600 150,950 82,390 49,500 15,500 0
Quintile 3 118,960 100,290 59,750 66,350 0 6,500 0
Quintile 4 150,288 236,748 164,500 90,650 6,300 22,500 0
Quintile 5 91,275 263,720 633,200 78,750 250,500 61,600 119,900

38
Table 3.3 shows that cash income from ground nuts was highest in quintile four and
lowest in quintile one. This indicates that ground nuts cash income is not the most
important cash crop among the wealthiest households in the village. Maize, cotton,
mango, cowpea and tobacco cash income was highest in quintile five. Tobacco was
cultivated by quintile five only.
Fig 3.10.1 Proportion of total cash income from sale of own-produced
mangoes
CONCLUSION
The purpose of the baseline survey was to collect and analyse information that will
assist in implementing, monitoring and evaluating the Mango project. The sites
randomly selected for the study were within ‘’Northern Cotton and Maize production
zone’’ and ‘’Lakeside Agro-Fishing zone,’’ Salima district. Data was collected from all
households in Mfitiziyenderana village under the Lakeside agro-fishing livelihood
zone, where all households were beneficiaries. In the Northern cotton and maize
production zone three whole village studies were carried out (Mnkhono, Kuseni and
Kuchiswe), where the population included both beneficiaries and non-beneficiaries.

39
The zone has a number of projects focusing on agriculture and livelihood support
systems, with most current projects sponsored by NGOs. Maize, cotton, rice and
local ground nuts were grown in Mfitiziyenderana village. Tobacco was not grown in
the village. Maize, cotton, tobacco and local ground nuts among other crops were
grown in Mnkhomo, Kuseni and Kuchiswe villages. In all villages maize is the main
staple food. However, conditions in the northern cotton and maize production zone
were less favourable to mango production than in Mfitiziyenderana village
The majority of households interviewed in the study area could purchase essential
non-food needs from the income remaining after food energy requirements were
met. Only 1 household in Mfitiziyenderana and 3 households from the other three
villages fell below the standard of living threshold. Employment contributes a large
proportion of cash income in the study area. The total income obtained from crop
sales came second, with a far smaller proportion of cash income derived from
livestock trading, followed by wild foods (mainly fishing).
In both zones households described climate change as the main challenge they
face. During key infomant interviews in the Lakeside agrofishing zone interviewees
commented on significant changes in livelihood actvities in this area. Fishing used to
contribute a large proportion of household income but currenly the lake is drying and
the stock of fish has decreased in the lake. In the northern cottom and maize
production area low rainfall and extensive soil erosion caused by deforestation was
reported as a major challenge for crop production.
Top Related