


Languages
Pages
Legal


1
Pillar III Basel Disclosures
1.1 General
The BASEL III disclosures contained herein relate to Citibank N.A., India Branches (herein also referred to as
the 'Bank') as of September 30, 2018. These are compiled in accordance with Reserve Bank of India (the
'RBI') regulations on Master Circular – Basel III Capital Regulations vide RBI Circular DBR. No. BP. BC.
1/21.06.201/2015-16 dated July 1, 2015 as amended from time to time.
The Bank being a branch does not have any direct subsidiaries nor does it hold any significant stake in any
company. The RBI guidelines on Financial Regulation of Systemically Important NBFCs and Banks’
Relationship vide circular ref. DBOD. No. FSD. BC.46 / 24.01.028/ 2006-07 December 12, 2006 read with
‘Guidelines for consolidated accounting and other quantitative methods to facilitate consolidated supervision’
vide circular ref. DBOD.No.BP.BC.72/ 21.04.018/2001-02 dated February 25, 2003 mandate coverage of the
‘Consolidated Bank’ (herein also referred to as ‘Citi’). This includes, in addition to the Bank as a branch of
Citibank N.A., the following wholly/majority owned non-banking finance company, which is a subsidiary of
Citigroup Inc. held through intermediary holding companies:
Citicorp Finance (India) Limited incorporated in India on 1 May 1997, is registered with the Reserve Bank
of India (‘RBI’) as a Non-Banking Financial Company (‘NBFC’) vide Certificate No. N-13.02079 dated 10
October 2014. It is a non-deposit taking systemically important Non-Banking Financial Company (‘NBFC-
ND-SI’).
As prescribed in the above guidelines, the Bank is not required to prepare consolidated financial statements.
However, certain prudential guidelines apply on a Consolidated Bank basis, including that of capital adequacy
computation under BASEL III guidelines. Accordingly, Citicorp Finance (India) Limited has been considered
under regulatory scope of consolidation for the quantitative disclosures. The Bank does not have any interests
in insurance entities.
In accordance with BASEL requirements, the Bank also has an Internal Capital Adequacy Assessment Process
(ICAAP) for Citibank India. The ICAAP depicts the various categories of risks to which the Bank is exposed,
details the ongoing assessment of such risks, how risks are to be mitigated, and quantifies the amount of capital
required currently and in the future to cope with these risks. The ICAAP process also includes an assessment
of capital adequacy in an extreme stress scenario. The ICAAP is subjected to an independent review as
required by RBI guidelines.
1.2 Capital Structure
The capital funds of Citi include the following:
Tier 1 Capital:
1. Paid up Equity Capital/Initial Capital.
2. Interest-free funds from Head Office.
3. Statutory Reserves.
4. Capital Reserves.
5. Other Eligible Reserves.
6. Remittable surplus retained in Indian Books.
7. Revaluation reserves arising from revaluation of the premises owned, after a discount of 55% subject to
meeting certain conditions as laid down in RBI circular ref. DBR.No.BP.BC.83/21.06.201/2015-16 dated
March 1, 2016

2
8. Properties Investment Reserve
9. Deductions: Deferred Tax Assets (however, DTA which relate to timing difference, up to 10% of CET1
Capital has been recognized as CET 1 Capital as per RBI notification DBR.No.BP.BC.83/21.06.201/2015-
16 dated March 1, 2016), Defined pension benefit asset, Intangibles and Prudential valuation adjustment for
illiquid positions.
Tier 2 Capital: 1. Revaluation reserves arising from revaluation of the premises owned after a discount of 55% to the extent
not recognized in CET 1 Capital.
2. Provision on Standard Assets (including provision on account of Unhedged Foreign Currency Exposure-
UFCE)
3. Floating Provision
4. Country Risk Provision
5. Investment Reserve
Quantitative disclosures:
Amount in Rs. lakhs
Particulars Standalone Consolidated
Tier 1 Capital Sep 30, 2018 Sep 30, 2018
Common Shares (Paid-up equity Capital) - 289,330
Statutory Reserves - 59,740
Other disclosed free reserves - 3,674
Balance in Profit & Loss account - 38,672
Current financial profit, to the extent admissible - 8,948
Interest-free funds from Head Office. 374,384 374,384
Statutory Reserves kept in Indian Books 806,440 806,440
Remittable Surplus retained in Indian books 713,370 713,370
Capital Reserves 13,821 13,821
Interest free funds remitted from abroad for acquisition of
property and held in separate account
6,194 6,194
Revaluation Reserves at a discount of 55 per cent (CET -1) 12,287 12,287
Other Eligible Reserves 18,733 18,733
Common Equity Tier I (CET1) (A) 1,945,229 2,345,593
Regulatory Adjustments - -
Intangibles 23,477 29,460
Deferred Tax Asset (DTA) associated with Accumulated Losses - -
Defined Benefit Pension Fund Asset - -
Deferred Tax Asset associated with Timing Differences (other
than those related to accumulated losses)
25,423 40,492
Other eligible deduction from CET1 (Prudential valuation
adjustment)
3,954 3,954
Total Regulatory Adjustments (B) 52,854 73,906
CET 1 Capital after above adjustments (A-B) 1,892,376 2,271,688
Recognition of DTA associated with Timing Differences in
CET 1
25,423 40,492
Final Common Equity Tier I Capital (C) 1,917,798 2,312,180
Additional Tier I Capital (D) - -

3
Particulars Standalone Consolidated
Sep 30, 2018 Sep 30, 2018
Tier II Capital
Provision on Standard Asset (including UFCE) 59,995 63,403
Floating Rate Provision 9,100 9,100
Country Risk Provision 510 510
Investment Reserve 12,238 12,238
Regulatory Adjustments
Regulatory adjustment applied in respect of amount related to
pre-Basel III treatment
- -
Total Regulatory Adjustments - -
Total Tier II Capital (E) 81,803 85,251
Total of Tier I + Tier II (C) + (D) + (E) = (F) 1,999,601 2,397,431
1.3 Capital Adequacy
As per Basel III guidelines issued by RBI, the Bank is required to maintain a minimum Capital to Risk-
weighted Assets Ratio (CRAR) of 13.13% on an on-going basis which includes capital required to be
maintained on account of Capital Conservation Buffer (CCB) of 1.875% and Global Systematically Important
Bank (G-SIB) buffer as prescribed by the Home Regulator of Citibank N.A. Currently, there is no requirement
to maintain Counter-cyclical Capital Buffer (CCCB) as per RBI guidelines.
The Bank is engaged in providing wholesale, retail and private banking services. The Bank has processes in
place to assess and maintain on an ongoing basis the amounts, types and distribution of internal capital that
they consider adequate to cover the nature and level of the risks to which they are or might be exposed. The
Bank’s Asset Liability Management Committee (ALCO) monitors capital levels to ensure adherence to capital
standards and manages the capital planning and repatriation exercise.
The Bank has an Internal Capital Adequacy Assessment Process (ICAAP) which establishes a framework for
the Bank to perform a comprehensive assessment of the risks they face and to relate capital adequacy to these
risks. Further, the capital analysis performed by the Bank is expected to encompass all significant risks, not
only those risks captured by the Pillar 1 minimum regulatory capital calculation. The ICAAP exercise also
includes a 3-year forecast of capital levels vis-à-vis requirements which is reviewed by the management team.
As allowed under the BASEL III guidelines issued by the Reserve Bank of India, the Bank has adopted
Standardized Approach (SA) for credit risk, Standardized Duration approach (SDA) for computing capital
requirement for market risks and Basic Indicator Approach (BIA) for operational risk.
Capital requirements for credit risk:
Amount in Rs. lakhs
Standalone Consolidated
Category Nature As at Sep 30, 2018 As at Sep 30, 2018
Risk
weighted
assets
Capital
required
Risk
weighted
assets
Capital
required
Wholesale
exposures
Generally includes exposures to
Banks, Financial Institutions and
Corporates
6,067,322 796,639 6,759,553 887,529
Retail
exposures
Generally includes exposures to
individuals and households, small
businesses of a retail nature
3,194,411 419,426 3,532,115 463,767

4
Securitization
exposures
Includes credit enhancement 10,693 1,404 10,693 1,404
Total 9,272,426 1,217,470 10,302,361 1,352,700
Capital requirements for market risk:
Amount in Rs. lakhs
Standalone Consolidated
Category
Nature
As at September 30, 2018 As at September 30, 2018
Risk
weighted
assets
Capital
required
Risk
weighted
assets
Capital
required
Interest rate
risk
Includes specific and general risk
on interest rate instruments in the
trading book
1,100,476 144,492 1,101,424 144,617
Foreign
exchange risk
Includes specific and general risk
on currencies (including gold)
266,819 35,033 266,819 35,033
Equity risk Includes specific and general risk
on equity instruments
20,974 2,754 133,858 17,576
Total 1,388,269 182,280 1,502,101 197,226
Capital requirements for operational risk:
Per the Basic Indicator approach for Operational Risk, the Bank is required to maintain capital at the rate of
15% of average gross income of previous three financial years. The notional risk weighted assets for
operational risk is calculated by multiplying the operational risk capital charge by 12.5. The Capital required
for operational risk is Rs. 253,801 Lakhs for standalone and Rs. 264,182 lakhs for consolidated.
Capital Adequacy Ratio
Entity
As at September 30, 2018
Total
Capital
ratio
Tier I
Capital
ratio
Tier II
Capital
ratio
Citibank N.A. (Standalone)
15.88% 15.23% 0.65%
Citibank N.A. (Consolidated)
17.35% 16.74% 0.62%
1.4 Credit Risk: General Disclosures
The three principal businesses of the Bank organized by client segmentation viz. Corporate Banking,
Commercial Banking and Consumer Banking approve and implement policies and procedures appropriate to
their respective risk, business and portfolio. These policies address risk measurement, reporting, monitoring,
mitigation and remediation.
For Corporate Bank, the ICG Risk Management Manual along with the Local Corporate Credit Policy lays
down the parameters/norms for credit exposure. Based on the industry studies and detailed company analysis
and after considering the Target Market Norms & Risk Acceptance Criteria, credit is approved. For proposals
above a certain material threshold, bank follows Credit committee approach where Senior Credit officers from
Independent Risk & Business sanctions credit in a committee which convenes every week or such other
frequency as required to discuss the proposals. Wherever required, Industry specialist and product specialists

5
review and approve sizeable credits in addition to committee approval. The Bank has a policy of internal rating
on a global scale and assigns Obligor Risk Ratings (ORRs) and Facility Risk Ratings (FRR). ORRs define one-
year probability of default and are continuously monitored. The Bank also assigns an Obligor Limit Rating
(OLR), which provides a medium to long-term view of credit quality. Approval authority is defined as per
Credit Facilities Approval Grid, which requires higher level of authority to approve higher exposures and
depending on the OLR scale ranging from high to low.
The Commercial Banking Business Credit Policies define the guidelines and policies under which portfolio is
managed supplemented by Credit Programs. The Business team prospects customers within approved industry
segments. The due diligence is performed by Business Unit (Coverage Bankers and Credit Lending
Management unit) which assesses the borrowing requirements and recommends facilities within the
parameters set out by the credit programs / framework. The due diligence process includes, but is not restricted
to, management evaluation, business and financial statements analysis. All proposals are approved by at least
two credit approvers (one at least from Credit Lending Unit or Independent Risk) at least one of whom has
credit initials to cover the facilities proposed. In addition, proposals over a specific threshold are reviewed and
approved by a Credit Committee. Independent Risk provides oversight to implementation of the Credit
Policies and Programs and Procedures.
Consumer banking has an independent Policy Unit, which recommends lending policy, reviews portfolio and
takes credit actions. This is supported by a credit operations unit, which reviews proposals for adherence to
laid down policies as well as does all verifications prior to disbursal of credit. Underwriting authority is
delegated to Credit Officers only who are independent from business and report into the Credit Initiation Unit.
Credit appraisal is independent of the business stream to ensure unbiased credit judgment.
The Global Consumer Credit and Fraud Risk Policy (GCCFRP) establishes the credit policies and procedures
that govern all types of consumer lending in Global Consumer. These represent defined criteria for all forms of
credit extension with which consumer business must comply. Any exception or deviation from these policies
or established criteria requires prior approval from Global Consumer Risk Management. Any changes must be
approved by the Global Consumer Chief Risk Officer (CRO).
Norms for Determining When to Classify Various Types of Assets as Non-Performing
The Bank follows the RBI guidelines for asset classification, which are briefly described herein below.
Term Loans and Consumer loans are treated as a non-performing if the interest and/ or installments of
principal remain overdue for a period of more than 90 days. Cash credits & Overdrafts are treated as non-
performing if it remains ‘out of order’ for a period of more than 90 days.
An account will be treated "out of order" if the outstanding balance remains continuously in excess of the
sanctioned limit/drawing power. In case where the outstanding balance is less than the sanctioned
limit/drawing power, but there are no credits continuously for three months as on balance-sheet date or credits
are not enough to cover the interest debited during the same period, these accounts will be treated as out of
order.
Bills purchased /discounted are treated as non-performing if the bill remains overdue and unpaid for a period
of more than 90 days during the financial year.
Any other facility (including dues on forward exchange and derivative contracts) will be treated as non-
performing if any amount to be received remains overdue for a period of more than 90 days.
6
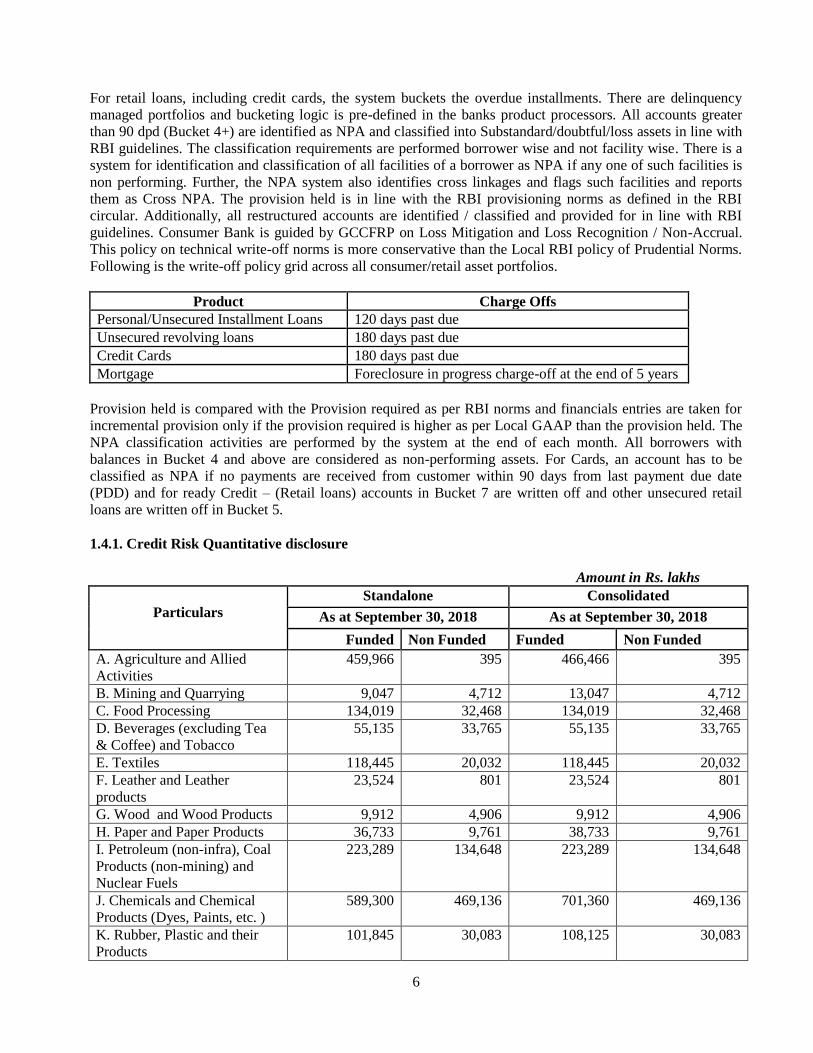
For retail loans, including credit cards, the system buckets the overdue installments. There are delinquency
managed portfolios and bucketing logic is pre-defined in the banks product processors. All accounts greater
than 90 dpd (Bucket 4+) are identified as NPA and classified into Substandard/doubtful/loss assets in line with
RBI guidelines. The classification requirements are performed borrower wise and not facility wise. There is a
system for identification and classification of all facilities of a borrower as NPA if any one of such facilities is
non performing. Further, the NPA system also identifies cross linkages and flags such facilities and reports
them as Cross NPA. The provision held is in line with the RBI provisioning norms as defined in the RBI
circular. Additionally, all restructured accounts are identified / classified and provided for in line with RBI
guidelines. Consumer Bank is guided by GCCFRP on Loss Mitigation and Loss Recognition / Non-Accrual.
This policy on technical write-off norms is more conservative than the Local RBI policy of Prudential Norms.
Following is the write-off policy grid across all consumer/retail asset portfolios.
Product Charge Offs
Personal/Unsecured Installment Loans 120 days past due
Unsecured revolving loans 180 days past due
Credit Cards 180 days past due
Mortgage Foreclosure in progress charge-off at the end of 5 years
Provision held is compared with the Provision required as per RBI norms and financials entries are taken for
incremental provision only if the provision required is higher as per Local GAAP than the provision held. The
NPA classification activities are performed by the system at the end of each month. All borrowers with
balances in Bucket 4 and above are considered as non-performing assets. For Cards, an account has to be
classified as NPA if no payments are received from customer within 90 days from last payment due date
(PDD) and for ready Credit – (Retail loans) accounts in Bucket 7 are written off and other unsecured retail
loans are written off in Bucket 5.
1.4.1. Credit Risk Quantitative disclosure
Amount in Rs. lakhs
Particulars
Standalone Consolidated
As at September 30, 2018 As at September 30, 2018
Funded Non Funded Funded Non Funded
A. Agriculture and Allied
Activities
459,966 395 466,466 395
B. Mining and Quarrying 9,047 4,712 13,047 4,712
C. Food Processing 134,019 32,468 134,019 32,468
D. Beverages (excluding Tea
& Coffee) and Tobacco
55,135 33,765 55,135 33,765
E. Textiles 118,445 20,032 118,445 20,032
F. Leather and Leather
products
23,524 801 23,524 801
G. Wood and Wood Products 9,912 4,906 9,912 4,906
H. Paper and Paper Products 36,733 9,761 38,733 9,761
I. Petroleum (non-infra), Coal
Products (non-mining) and
Nuclear Fuels
223,289 134,648 223,289 134,648
J. Chemicals and Chemical
Products (Dyes, Paints, etc. )
589,300 469,136 701,360 469,136
K. Rubber, Plastic and their
Products
101,845 30,083 108,125 30,083

7
L. Glass & Glassware 10,419 3,879 30,993 3,879
M. Cement and Cement
Products
35,323 2,559 35,323 2,559
N. Basic Metal and Metal
Products
181,844 168,541 223,266 168,541
O. All Engineering 381,529 352,772 384,529 352,772
P. Vehicles, Vehicle Parts and
Transport Equipment
335,934 167,777 345,834 167,777
Q. Gems and Jewellery 9,124 8 9,354 8
R. Construction 3,304 715 52,524 876
S. Infrastructure 175,111 52,280 175,112 52,280
T. Other Industries 22,774 151,901 144,652 156,482
U. Transport Operators 95,965 2,064 128,027 2,064
V. Computer Software 139,536 533,746 146,036 533,746
W. Tourism, Hotel and
Restaurants
10,351 3,024 10,351 3,024
X. Shipping 42,957 26,821 42,957 26,821
Y. Professional Services 840,636 1,009,650 1,037,653 1,009,650
Z. Trade 383,629 154,752 398,728 154,752
AA. Aviation 8 15,924 8 15,924
AB. Retail Exposure 2,108,506 214,308 2,353,969 214,308
AC. Services 2,197,362 597,516 2,200,862 597,516
Total 8,735,527 4,198,944 9,612,233 4,203,686
Note:
1. As a branch of a foreign bank, the operations of the Bank do not extend outside of India. Hence the Bank
is considered to operate only in the domestic segment.
2. Exposure is comprised of Loans & Advances, Balance with Banks, Money at call and short notice, On-
balance sheet securitisation exposures, Revaluation gains on foreign exchange and derivative contracts,
Deposits with NABARD, SIDBI & NHB under the priority/weaker section lending schemes, credit
equivalent of guarantees, acceptances, letters of credit, other Non-Market Related off balance sheet
obligations and credit equivalent of foreign exchange and derivative exposures.
ii) Residual contractual maturity breakdown of assets Amount in Rs. lakhs
Standalone Consolidated
As at September 30, 2018 As at September 30, 2018
Loans and Advances Investments Loans and Advances Investments
Day 1 25,015 3,044,512 28,847 3,044,512
2 to 7 days 231,354 95,409 253,422 105,146
8 to 14 days 242,532 - 272,464 -
15 to 30 days 336,681 698,763 396,038 698,763
31 days to 2 months 396,333 251,934 535,513 266,900
2 months to 3 months 298,875 76,102 442,316 76,102
Over 3 months to 6 months 145,867 124,356 245,677 124,356
Over 6 months to 12 months 573,104 108,962 787,266 108,962
Over 1 year to 3 years 2,427,045 1,351,234 2,554,645 1,351,234
Over 3 years to 5 years 743,087 10,762 766,123 10,762
Over 5 years 446,780 307,185 446,960 317,555
Total 5,866,673 6,069,219 6,729,271 6,104,292
8
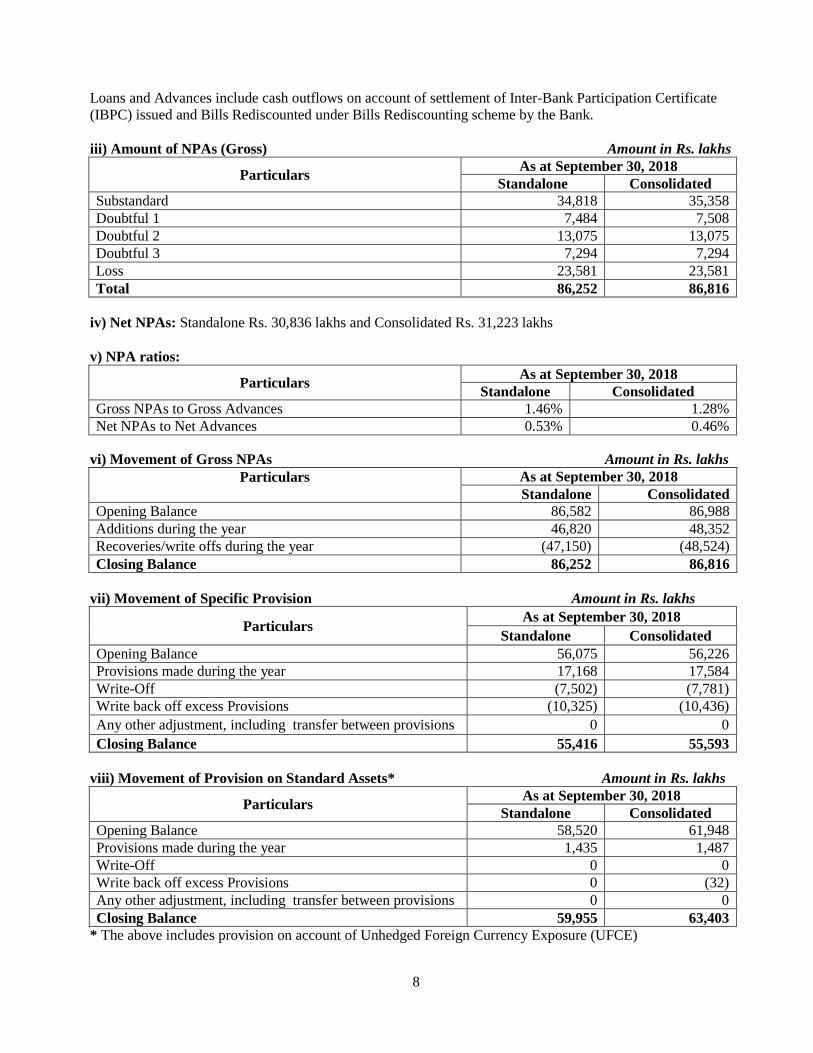
Loans and Advances include cash outflows on account of settlement of Inter-Bank Participation Certificate
(IBPC) issued and Bills Rediscounted under Bills Rediscounting scheme by the Bank.
iii) Amount of NPAs (Gross) Amount in Rs. lakhs
Particulars As at September 30, 2018
Standalone Consolidated
Substandard 34,818 35,358
Doubtful 1 7,484 7,508
Doubtful 2 13,075 13,075
Doubtful 3 7,294 7,294
Loss 23,581 23,581
Total 86,252 86,816
iv) Net NPAs: Standalone Rs. 30,836 lakhs and Consolidated Rs. 31,223 lakhs
v) NPA ratios:
Particulars As at September 30, 2018
Standalone Consolidated
Gross NPAs to Gross Advances 1.46% 1.28%
Net NPAs to Net Advances 0.53% 0.46%
vi) Movement of Gross NPAs Amount in Rs. lakhs
Particulars
As at September 30, 2018
Standalone Consolidated
Opening Balance 86,582 86,988
Additions during the year 46,820 48,352
Recoveries/write offs during the year (47,150) (48,524)
Closing Balance 86,252 86,816
vii) Movement of Specific Provision Amount in Rs. lakhs
Particulars As at September 30, 2018
Standalone Consolidated
Opening Balance 56,075 56,226
Provisions made during the year 17,168 17,584
Write-Off (7,502) (7,781)
Write back off excess Provisions (10,325) (10,436)
Any other adjustment, including transfer between provisions 0 0
Closing Balance 55,416 55,593
viii) Movement of Provision on Standard Assets* Amount in Rs. lakhs
Particulars As at September 30, 2018
Standalone Consolidated
Opening Balance 58,520 61,948
Provisions made during the year 1,435 1,487
Write-Off 0 0
Write back off excess Provisions 0 (32)
Any other adjustment, including transfer between provisions 0 0
Closing Balance 59,955 63,403
* The above includes provision on account of Unhedged Foreign Currency Exposure (UFCE)

9
ix) Non-performing Investments (NPIs): Standalone – NIL and Consolidated - Rs. 3,000 lakhs
x) Provision for NPls: Standalone – NIL and Consolidated - Rs. 3,000 lakhs
xi) Movement of provision held towards depreciation on investments Amount in Rs. Lakhs
Particulars As at September 30, 2018
Standalone Consolidated
Opening Balance 64,463 65,885
Additions during the year 70,351 70,351
Recoveries/write offs during the year 0 0
Closing Balance 134,814 136,236
Note: The above does not include provision on Non-Performing Investments, which has been reported under
point x.
x) Industry wise classification of NPA, specific and General Provision
Standalone Amount in Rs. Lakhs
Industry
As at September 30, 2018 For the quarter
ended
Gross
NPA
Provisions
for NPA
Provision
for
Standard
Assets
Write
off
Provisio
n for
NPA
A. Agriculture and Allied Activities 8,694 4,894 2,656 139 708
B. Mining and Quarrying - - 79 - -
C. Food Processing - - 606 - -
D. Beverages (excluding Tea & Coffee) and
Tobacco
- - 127 - -
E. Textiles 1,027 1,027 926 - -
F. Leather and Leather products - - 211 - -
G. Wood and Wood Products - - 66 - -
H. Paper and Paper Products - - 201 - -
I. Petroleum (non-infra), Coal Products (non-
mining) and Nuclear Fuels
- - 441 - -
J. Chemicals and Chemical Products (Dyes,
Paints, etc.)
3,779 3,781 3,640 - -
K. Rubber, Plastic and their Products 960 960 643 - (100)
L. Glass & Glassware - - 68 - -
M. Cement and Cement Products - - 122 - -
N. Basic Metal and Metal Products 1,109 1,209 1,411 - -
O. All Engineering 5,439 5,509 2,240 - (10)
P. Vehicles, Vehicle Parts and Transport
Equipment
5,989 5,989 2,071 - (55)
Q. Gems and Jewellery - - 33 - -
R. Construction - - 22 - -
S. Infrastructure 2 - 817 - (431)
T. Other Industries 32 28 653 - (5)
U. Transport Operators 5,042 4,923 287 37 (188)
V. Computer Software - - 590 - -
W. Tourism, Hotel and Restaurants 51 - 88 - -

10
X. Shipping - - 91 - -
Y. Professional Services 73 - 3,134 - (2)
Z. Trade 811 781 2,383 - -
AA. Aviation - - - - -
AB. Retail Exposure 51,138 24,352 36,319 27,617 (432)
AC. Services 2,106 1,963 30 - (144)
Total 86,252 55,416 59,955 27,793 (659)
Industry wise classification of NPA, specific and General Provision
Consolidated Amount in Rs. Lakhs
Industry
As at September 30, 2018 For the quarter
ended
Gross
NPA
Provisions
for NPA
Provision
for
Standard
Assets
Write
off
Provision
for NPA
A. Agriculture and Allied Activities 8,694 4,894 2,682 139 708
B. Mining and Quarrying - - 95 - -
C. Food Processing - - 606 - -
D. Beverages (excluding Tea & Coffee) and
Tobacco
- - 127 - -
E. Textiles 1,027 1,027 926 - -
F. Leather and Leather products - - 211 - -
G. Wood and Wood Products - - 66 - -
H. Paper and Paper Products - - 209 - -
I. Petroleum (non-infra), Coal Products (non-
mining) and Nuclear Fuels
- - 441 - -
J. Chemicals and Chemical Products (Dyes,
Paints, etc.)
3,779 3,781 4,088 - -
K. Rubber, Plastic and their Products 960 960 668 - (100)
L. Glass & Glassware - - 151 - -
M. Cement and Cement Products - - 122 - -
N. Basic Metal and Metal Products 1,109 1,209 1,577 - -
O. All Engineering 5,439 5,509 2,252 - (10)
P. Vehicles, Vehicle Parts and Transport
Equipment
5,989 5,989 2,111 - (55)
Q. Gems and Jewellery - - 33 - -
R. Construction 50 44 219 (32) (34)
S. Infrastructure 2 - 817 - (431)
T. Other Industries 32 28 1,084 - (5)
U. Transport Operators 5,053 4,930 415 (46) (191)
V. Computer Software - - 616 - -
W. Tourism, Hotel and Restaurants 51 - 88 - -
X. Shipping - - 91 - -
Y. Professional Services 73 - 3,922 - (2)
Z. Trade 811 781 2,443 - -
AA. Aviation - - - - -
AB. Retail Exposure 51,641 24,478 37,300 28,724 (391)

11
AC. Services 2,106 1,963 44 - (144)
Total 86,816 55,593 63,405 28,785 (655)
1.4.2 Credit Risk: disclosures for portfolios subject to the standardized approach
The Bank has approved use of ratings issued by renowned external rating agencies- CRISIL Limited, Fitch
India, ICRA Limited, Brickwork, SMERA and CARE for local exposures as permitted by Reserve Bank of
India. For the foreign exposures the ratings assigned by Standard & Poor’s, Fitch and Moody’s are used by the
Bank, these being the parents of the local entities in question.
Where the obligors have obtained rating of the facility from any of the above credit rating agencies, the Bank
has applied the risk weights relevant to the ratings so assigned. Where the obligors have not yet obtained such
a rating, the exposure has been considered as unrated and appropriate risk weights applied.
The breakdown of the exposure (after mitigation): Amount in Rs. Lakhs
Particulars As at September 30, 2018
Standalone Consolidated
Below 100% risk weight 7,656,976 7,665,204
100% risk weight 1,487,104 1,967,113
More than 100% risk weight 3,790,392 4,181,531
Note: Exposure is comprised of Loans & Advances, Balance with Banks, Money at call and short notice, On-
balance sheet securitisation exposures, Revaluation gains on foreign exchange and derivative contracts,
Deposits with NABARD, SIDBI & NHB under the priority/weaker section lending schemes, credit equivalent
of guarantees, acceptances, letters of credit, other Non-Market Related off balance sheet obligations and credit
equivalent of foreign exchange and derivative exposures. Previous year’s numbers have been regrouped
accordingly.
1.4.3 Credit risk mitigation
The Bank has a three-stage approach to credit risk mitigation i.e. pre-disbursement due diligence, credit
approval and post disbursement monitoring. The policies are individually varied for the corporate, retail and
Small and Medium Enterprises (SMEs) segments. Risk mitigation and defeasance techniques are utilized as
appropriate in the various lines of business. While security and support are used by the corporate bank as risk
mitigants, various risk mitigation tools such as rewrite and settlement programs are used in the consumer bank
based on well-defined policies and processes. Ongoing calculation and monitoring ensures that the
management is comfortable with the residual risk, which is adequately supported by the capital employed.
Credit review in Retail segment is based on an analysis of portfolio behaviour as opposed to any judgmental
review at an obligor level. Pre-disbursement due diligence involves appraisal and legal verification of
collateral documents. The legal documentation is vetted and pre-approved. The Retail risk unit on a monthly
basis tracks and monitors Portfolio performance and behavior against the approved benchmarks. There is a
formal review process involving senior country risk and business managers with any early warning signs
actioned upon on priority. In line with the RBI policy, the retail bank credit risk also formulates targeted Risk
Mitigation Programs (RMP) where programs are developed to manage event-related contingencies (i.e.
unemployment, reductions in income, sickness, death, unforeseen mishap such as landslide, flood and etc.).
These programs are generally developed to cater for long term (more than 12 months and up to 5 years) and
short term predicaments (3 months and up to 12 months).
Separately also, the performance and losses of these programs are tracked to ensure the programs offered are
for the purpose of rehabilitating borrowers who are in financial distress whether temporary or for a longer

12
frame of time. There are documented policies on use of treatments offered to delinquent and pre-delinquent
customer resulting in temporary or permanent changes in the T&C of repayment. All accounts which are
restructured are categorized as sub-standard assets. Post restructuring the account treatment continues are per
defined RBI policy guidelines and incase the accounts slips back into delinquency relevant collection treatment
is applied.
For SME segment, as per RBI guidelines, the Bank has adopted the comprehensive approach that allows fuller
offset of collateral against exposures, by effectively reducing the exposure amount by the value ascribed to the
collateral. Under this approach, eligible financial collateral is reduced from the credit exposure to counterparty
when calculating their capital requirements subject to haircuts as prescribed under the guidelines. Credit
collateral information is maintained by the Credit Administration. This data is available at facility level and is
being used for reporting purposes.
The eligible collaterals used by the Bank as risk mitigants are in the form of cash collaterals pledged with the
Bank and eligible guarantees for arriving at the benefit for capital adequacy purposes. Corporate/parent
guarantee etc.do act as a risk mitigants but not taken benefit of when computing the prudential ratios. Given
the nature of collateral, the Bank does not have any concentration risk within the mitigants accepted by the
Bank.
Exposure covered by eligible financial collateral after application of hair cut: Amount in Rs. Lakhs
As at September 30, 2018
Category Standalone Standalone Consolidated
Wholesale
exposures
Generally includes exposures to Banks,
Financial Institutions and Corporates - -
Retail
exposures
Generally includes exposures to individuals
and households, small businesses of a retail
nature
- -
Securitisation
exposures
Includes credit enhancement which is reduced
from Capital funds
- -
Exposure covered by guarantees: Amount in Rs. Lakhs
As at September 30, 2018
Category Standalone Standalone Consolidated
Wholesale
exposures
Generally includes exposures to Banks,
Financial Institutions and Corporates - -
Retail
exposures
Generally includes exposures to individuals
and households, small businesses of a retail
nature
- -
Securitisation
exposures
Includes credit enhancement which is
reduced from Capital funds
- -
1.4.4 Securitisation
Securitisation risk includes the risk that the capital resources held by the firm in respect of assets which it has
securitised or participated in any third party securitisation transactions are inadequate having regard to the
economic substance of the transaction, including the degree of risk transfer achieved. Typically, in
securitisation transactions bank acts as an originator, servicing agent, investor in pass through certificates and
provider of credit enhancement or as guarantor.
As an Originator, assets in the form of loan receivables held on the books of the bank are assigned to an
independent Special Purpose Vehicle (SPV) which is created as a specific trust by an independent third party

13
acting as the Trustee. The Bank does not have any role in the management of SPVs. The Bank has not
sponsored any off-balance sheet vehicles for the purpose of securitisation. The Bank does not provide any
direct or indirect support to the SPV. The Bank is not responsible for the solvency or otherwise of the SPV, nor
is it concerned with any gains or losses that the SPV may make. The Bank obtains True sale opinion and loans
so securitised are recorded as sales once the management is satisfied that control over the underlying assets has
been transferred. Pursuant to RBI guidelines, the gain arising on securitisation of portfolio, which is the
difference between sale consideration and book value of loans, is deferred and recognised in profit and loss
account over the life of securities issued by the SPV. Loss, if any, is recognised on upfront basis in the profit
and loss account. Expenses relating to securitisation namely rating fees, trusteeship fees and legal expenses are
charged to the profit and loss account. Where the Bank is acting as a servicing agent it earns servicing income
from the transaction. In certain securitisation structures, the Bank would have retained interest in the form of
excess interest strips (also called Interest only strips receivable - IOSR). Credit enhancement, where required,
is provided by the Bank to support the transaction in the form of guarantee, cash collateral and subordination
of IOSR. The Bank has not held any Pass through Certificates (PTCs) for securitisation transactions where it
has acted as originator. The credit enhancements provided as part of securitisation transaction are assigned risk
weight as per RBI guidelines. Apart from the credit enhancements the Bank does not have any continuing
obligation/ exposure from the securitisation except IOSR (not offered as credit enhancement). The Bank does
not hold any securitisation exposures in its trading books as an investor or otherwise. Bank is not running any
pipeline and warehousing risks with regard to its asset book.
Following the decline in transactions in securitisation market over last several years, the Bank has not been
carrying out any loan securitisations through a SPV structure. In the recent past, the loan securitisations have
been direct loan assignments not involving any ‘packaging’ or ‘repackaging’ of receivables. The Bank has not
provided any credit enhancement for such transactions executed in the recent past.
Quantitative Disclosures (Banking Book): Amount in Rs. Lakhs
As at September 30, 2018
Particulars Standalone Consolidated
Total amount of exposures securitised during the year
For exposures securitised losses recognised by Citi during the
current period broken by the exposure type - -
Amount of assets intended to be securitised within a year - -
Of above, amount of assets originated within a year before
securitisation - -
Unrecognised gain on securitisation of deals - -
Unrecognised loss on securitisation of deals - -
Aggregate amount of On-Balance Sheet securitisation
exposures/whole loan sale retained or purchased - -
IOSR (subordinated) - -
IOSR (non-subordinated) 3 3
Cash Collaterals 855 855
Investment in Pass Through Certificates (PTCs) - -
Aggregate amount of off-balance sheet securitisation exposures - -
Guarantees - -
Exposures that have been deducted entirely from Tier 1 and Tier
2 capital - -
IOSR (subordinated) - -
IOSR (non-subordinated) - -
Cash Collaterals - -
Guarantees - -

14
Aggregate amount of securitisation exposures retained and the associated capital charges, broken down
between exposures: Amount in Rs. Lakhs
Exposure Type Capital Approach
As at September 30, 2018
Standalone Consolidated
RWA Capital
required
RWA Capital
required
IOSR (subordinated) Forms part of RWA - - - -
IOSR (non-
subordinated)
Forms part of RWA 3 0.4 3 0.4
Cash Collaterals Forms part of RWA 10,693 1,404 10,693 1,404
There are no quantitative disclosures required to be made for trading book as Citi is not holding any position.
1.5 Market Risk
1.5.1 Market risk in trading book
Market Risk is the risk of loss due to changes in the market values of the Bank's assets and liabilities caused by
changing interest rates, currency exchange rates and security prices.
The Bank is integrated into the overall Citigroup risk and control framework, balancing senior management
oversight with well-defined independent risk management functions. It is the responsibility of the senior
management of the Bank to implement Citigroup policies and practices, to oversee risk management, and to
respond to the needs and issues in the Bank. The Bank’s policy is to control material market risks through a
framework of limits & triggers which are approved by LOMC and to manage any residual exposure through a
series of sensitivity analyses, scenario tests and robust controls over calculating, monitoring and reporting
results
All market risk taking activity in Citibank N.A. India is centralised with Treasury and undertaken by
authorised dealers. The Treasury is subject to limits and triggers across all products and risk factor. The Bank’s
Risk Management Policy approved by LOMC defines the process and procedures of limit approvals, changes,
delegation, reporting and escalation in case of limit excesses and trigger breaches. The independent Market
Risk Management reports and monitors the trading risk exposures against approved limits and triggers on a
daily basis. An excess or a breach is reported and dealt with appropriately for corrective action with reporting
to ALCO, Senior Market Risk Management and Corporate Treasury.
The capital charge for interest rate related instruments and equities would apply to current market value of
these items in Banks trading book. Since the Bank is required to maintain capital for market risks on an
ongoing basis, the trading positions are marked to market on a daily basis. The current market value is
determined as per extant RBI guidelines on valuation of investments.
The minimum capital requirement is expressed in terms of two Separately calculated charges: Specific risk
charge for each security, which is designed to protect against an adverse movement in the price of an
individual security owing to factors related to the individual issuer. General market risk charge, which is
towards interest, exchange and price risk in the portfolio in different securities or instruments.
Specific charge is computed in line with the rates for capital charge provided under the RBI guidelines on
Prudential Norms on Capital Adequacy. The capital requirements for general market risk are designed to
capture the risk of loss arising from changes in market interest rates. The Bank follows the modified duration
method for measurement of the general market risk charge on investments portfolio. Measurement of market
risk charge for interest rates include all interest rate derivatives and off-balance sheet instruments in the trading
book, which react to changes in interest rates. The Bank has adopted intermediate approach for measuring the

15
price risk for options. Options are reported as a position equal to the market value of the underlying multiplied
by the delta. In addition, capital charge is also provided for the gamma and vega risk.
Capital charge for market risks in foreign exchange is 9 % on the open position limit of the Bank. This capital
charge is in addition to the capital charge for credit risk on the on-balance sheet and off-balance sheet items
pertaining to foreign exchange.
On the equity position in the investment portfolio capital charge has been maintained at 11.25% for specific
risk and 9% for general risk.
The risk appetite is largely determined and controlled due to regulatory limits on foreign exchange and interest
rate exposure. The spot foreign exchange exposure is limited through Net Open Position which is approved by
RBI and the interest rate exposure on rupee derivatives is controlled through the gross PV01 limit which is
restricted to 0.25% of the networth of the Bank as required by RBI. Further, the aggregate interest rate
exposures on trading account is limited by limits on PV01 which is much below the stipulated Gross PV01
limits established by RBI.
Risk is measured in terms of:-
(a) Factor sensitivities (DV01 – impact of change of rates by one basis point) for interest rate products,
FX Delta for Spot position, Vega and Gamma limits for FX Options. These measures & limits are
further sub-divided for each yield curves and currencies.
(b) Value-at-risk Trigger, which measures maximum potential loss at 99% confidence level over 1-day
holding period based on the day’s outstanding risk positions across the entire mark-to-market
exposures.
(c) Loss Triggers: The Trading book and available for sale book profit and loss monitored against month-
to-date and inception-to-date (for available for sale) Loss Triggers.
Capital requirements for market risk: Amount in Rs. Lakhs
Standalone Consolidated
Category
Nature
As at September 30, 2018 As at September 30, 2018
Risk
weighted
assets
Capital
required
Risk
weighted
assets
Capital
required
Interest rate
risk
Includes specific and general risk
on interest rate instruments in the
trading book
1,100,476 144,492 1,101,424 144,617
Foreign
exchange risk
Includes specific and general risk
on currencies (including gold)
266,819 35,033 266,819 35,033
Equity risk Includes specific and general risk
on equity instruments
20,974 2,754 133,858 17,576
Total 1,388,269 182,280 1,502,101 197,226
1.5.2 Interest rate risk in banking book (IRRBB)
Interest rate risk represents the Bank's exposure to adverse movements in interest rates with regard to its non-
trading exposures. Interest rate risk is measured by doing a gap analysis as well as factor sensitivity analysis.
Business-specific assumptions underlying these measurements, e.g., tenor bucket used for demand deposits,
are documented and models used to measure interest rate risk are independently reviewed. Interest rate gap
analysis utilizes the maturity or repricing schedules of balance sheet items to determine the differences
between maturing or repricing items within given tenor buckets. Interest rate exposure (IRE) measures the
potential pre-tax earnings impact, over a specified reporting period, for the accrual positions, from a defined
16
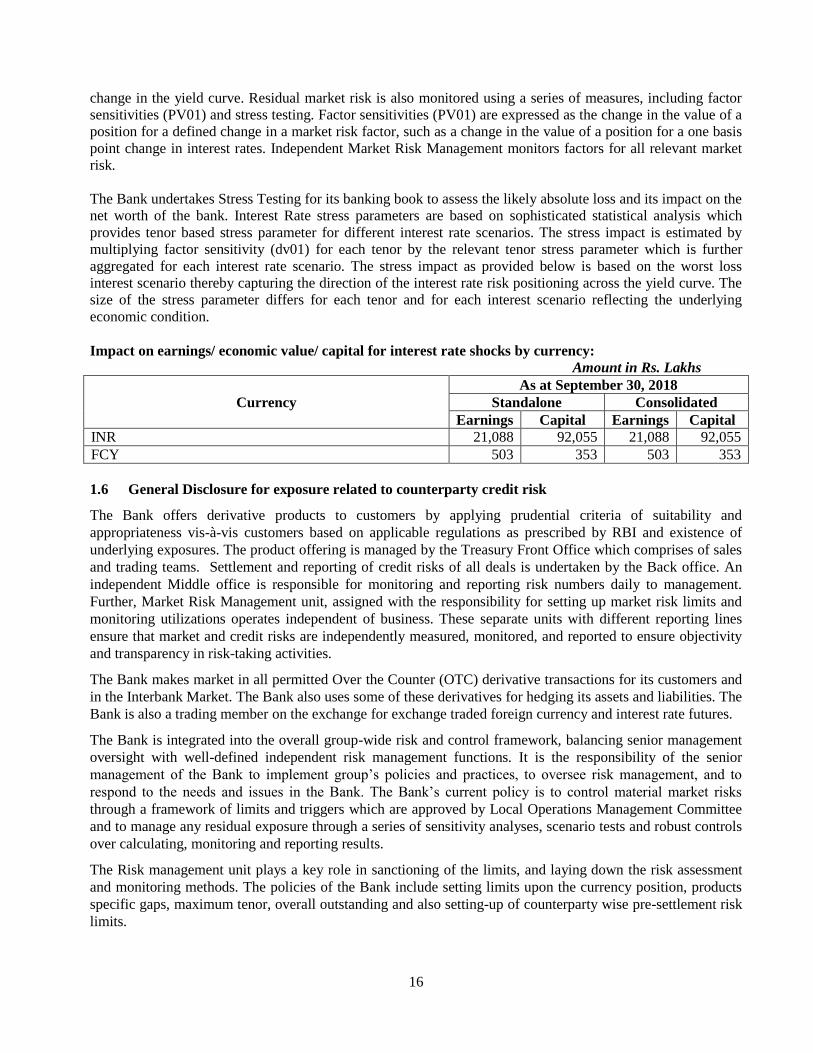
change in the yield curve. Residual market risk is also monitored using a series of measures, including factor
sensitivities (PV01) and stress testing. Factor sensitivities (PV01) are expressed as the change in the value of a
position for a defined change in a market risk factor, such as a change in the value of a position for a one basis
point change in interest rates. Independent Market Risk Management monitors factors for all relevant market
risk.
The Bank undertakes Stress Testing for its banking book to assess the likely absolute loss and its impact on the
net worth of the bank. Interest Rate stress parameters are based on sophisticated statistical analysis which
provides tenor based stress parameter for different interest rate scenarios. The stress impact is estimated by
multiplying factor sensitivity (dv01) for each tenor by the relevant tenor stress parameter which is further
aggregated for each interest rate scenario. The stress impact as provided below is based on the worst loss
interest scenario thereby capturing the direction of the interest rate risk positioning across the yield curve. The
size of the stress parameter differs for each tenor and for each interest scenario reflecting the underlying
economic condition.
Impact on earnings/ economic value/ capital for interest rate shocks by currency:
Amount in Rs. Lakhs
Currency
As at September 30, 2018
Standalone Consolidated
Earnings Capital Earnings Capital
INR 21,088 92,055 21,088 92,055
FCY 503 353 503 353
1.6 General Disclosure for exposure related to counterparty credit risk
The Bank offers derivative products to customers by applying prudential criteria of suitability and
appropriateness vis-à-vis customers based on applicable regulations as prescribed by RBI and existence of
underlying exposures. The product offering is managed by the Treasury Front Office which comprises of sales
and trading teams. Settlement and reporting of credit risks of all deals is undertaken by the Back office. An
independent Middle office is responsible for monitoring and reporting risk numbers daily to management.
Further, Market Risk Management unit, assigned with the responsibility for setting up market risk limits and
monitoring utilizations operates independent of business. These separate units with different reporting lines
ensure that market and credit risks are independently measured, monitored, and reported to ensure objectivity
and transparency in risk-taking activities.
The Bank makes market in all permitted Over the Counter (OTC) derivative transactions for its customers and
in the Interbank Market. The Bank also uses some of these derivatives for hedging its assets and liabilities. The
Bank is also a trading member on the exchange for exchange traded foreign currency and interest rate futures.
The Bank is integrated into the overall group-wide risk and control framework, balancing senior management
oversight with well-defined independent risk management functions. It is the responsibility of the senior
management of the Bank to implement group’s policies and practices, to oversee risk management, and to
respond to the needs and issues in the Bank. The Bank’s current policy is to control material market risks
through a framework of limits and triggers which are approved by Local Operations Management Committee
and to manage any residual exposure through a series of sensitivity analyses, scenario tests and robust controls
over calculating, monitoring and reporting results.
The Risk management unit plays a key role in sanctioning of the limits, and laying down the risk assessment
and monitoring methods. The policies of the Bank include setting limits upon the currency position, products
specific gaps, maximum tenor, overall outstanding and also setting-up of counterparty wise pre-settlement risk
limits.
17
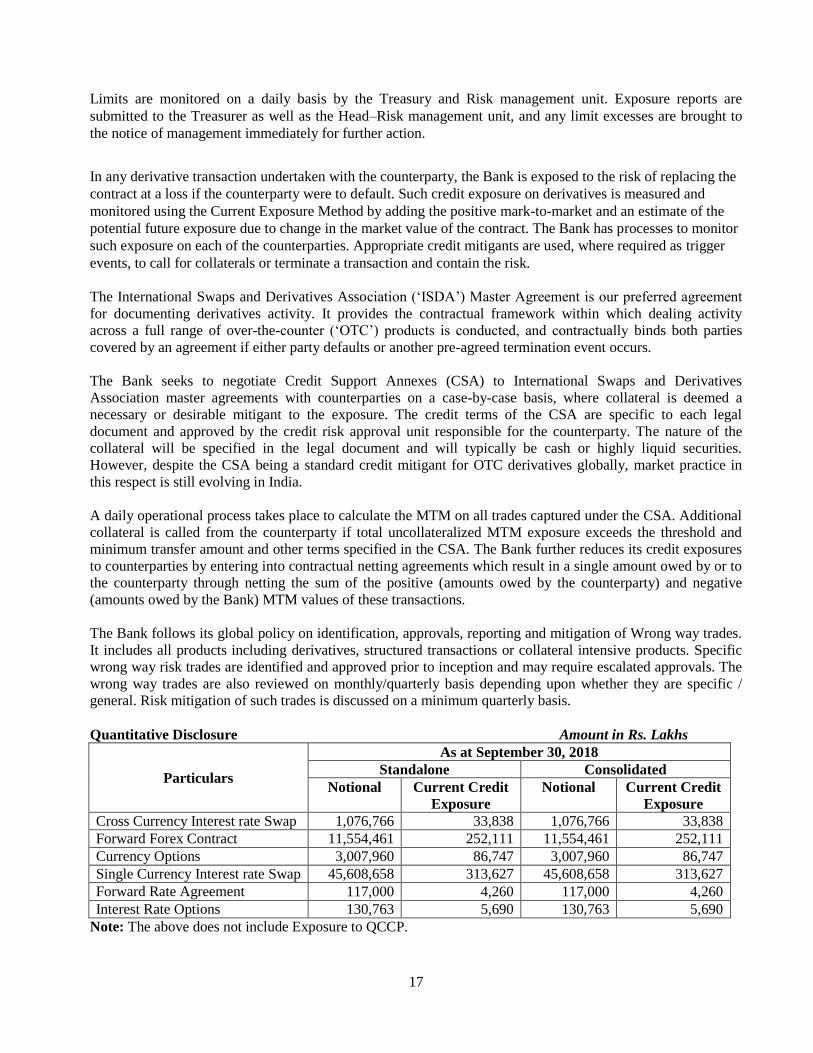
Limits are monitored on a daily basis by the Treasury and Risk management unit. Exposure reports are
submitted to the Treasurer as well as the Head–Risk management unit, and any limit excesses are brought to
the notice of management immediately for further action.
In any derivative transaction undertaken with the counterparty, the Bank is exposed to the risk of replacing the
contract at a loss if the counterparty were to default. Such credit exposure on derivatives is measured and
monitored using the Current Exposure Method by adding the positive mark-to-market and an estimate of the
potential future exposure due to change in the market value of the contract. The Bank has processes to monitor
such exposure on each of the counterparties. Appropriate credit mitigants are used, where required as trigger
events, to call for collaterals or terminate a transaction and contain the risk.
The International Swaps and Derivatives Association (‘ISDA’) Master Agreement is our preferred agreement
for documenting derivatives activity. It provides the contractual framework within which dealing activity
across a full range of over-the-counter (‘OTC’) products is conducted, and contractually binds both parties
covered by an agreement if either party defaults or another pre-agreed termination event occurs.
The Bank seeks to negotiate Credit Support Annexes (CSA) to International Swaps and Derivatives
Association master agreements with counterparties on a case-by-case basis, where collateral is deemed a
necessary or desirable mitigant to the exposure. The credit terms of the CSA are specific to each legal
document and approved by the credit risk approval unit responsible for the counterparty. The nature of the
collateral will be specified in the legal document and will typically be cash or highly liquid securities.
However, despite the CSA being a standard credit mitigant for OTC derivatives globally, market practice in
this respect is still evolving in India.
A daily operational process takes place to calculate the MTM on all trades captured under the CSA. Additional
collateral is called from the counterparty if total uncollateralized MTM exposure exceeds the threshold and
minimum transfer amount and other terms specified in the CSA. The Bank further reduces its credit exposures
to counterparties by entering into contractual netting agreements which result in a single amount owed by or to
the counterparty through netting the sum of the positive (amounts owed by the counterparty) and negative
(amounts owed by the Bank) MTM values of these transactions.
The Bank follows its global policy on identification, approvals, reporting and mitigation of Wrong way trades.
It includes all products including derivatives, structured transactions or collateral intensive products. Specific
wrong way risk trades are identified and approved prior to inception and may require escalated approvals. The
wrong way trades are also reviewed on monthly/quarterly basis depending upon whether they are specific /
general. Risk mitigation of such trades is discussed on a minimum quarterly basis.
Quantitative Disclosure Amount in Rs. Lakhs
Particulars
As at September 30, 2018
Standalone Consolidated
Notional Current Credit
Exposure
Notional Current Credit
Exposure
Cross Currency Interest rate Swap 1,076,766 33,838 1,076,766 33,838
Forward Forex Contract 11,554,461 252,111 11,554,461 252,111
Currency Options 3,007,960 86,747 3,007,960 86,747
Single Currency Interest rate Swap 45,608,658 313,627 45,608,658 313,627
Forward Rate Agreement 117,000 4,260 117,000 4,260
Interest Rate Options 130,763 5,690 130,763 5,690
Note: The above does not include Exposure to QCCP.

18
1.7 Operational risk
Operational Risk is the risk of loss resulting from inadequate or failed internal processes, systems, or human
factors, or from external events. It includes reputation and franchise risks associated with Citi’s business
practices or market conduct. It also includes the risk of failing to comply with applicable laws, regulations,
ethical standards, regulatory administrative actions or Citi policies and legal risk. Legal risk includes, but is not
limited to, exposure to fines, penalties, or punitive damages resulting from supervisory actions, as well as
private settlements.
Citi maintains an Operational Risk Management Framework with a Governance Structure to support its core
operational risk management activities of anticipation, mitigation and recovery. To ensure effective
management of operational risk across Citi, the Governance Structure presents three lines of defense:
First Line of Defense: The business owns its risks, including its operational risk, and is responsible for its
management. They are responsible for identifying and reporting operational risks to Independent Risk
Management and Control Functions.
Second Line of Defense: Management including Operational Risk Management works proactively with
business and all control functions to embed a strong operational risk management culture and framework
across Citi.
Third Line of Defense: Internal Audit recommends enhancements on an ongoing basis and provides
independent assessment and evaluation.
The ORM Framework establishes a foundation on which the activities of Businesses, Regions, and Functions,
the resulting operational risks, and the associated controls are identified, periodically assessed, subject to
corrective action, appropriately documented, and communicated. Specifically, the ORM Framework
establishes minimum standards for consistent identification, measurement, monitoring, reporting, and
management of operational risk across Citi
The process established by the ORM Framework is expected to lead to effective anticipation and mitigation of
operational risk and improved operational risk loss experience and includes the following steps:
Identify and assess Key Operational Risks (KOR);
Design controls to mitigate identified risks;
Establish Key Risk Indicators (KRI);
Implement a process for early problem recognition and timely escalation;
Produce comprehensive operational risk reporting; and
Ensure that sufficient resources are available to actively improve the operational risk environment and
mitigate emerging risks.
Citi has detailed out the Operational Risk Management requirement and objectives through its Operational
Risk Policy which requires deployment of various operational risk tools for proactive identification and
management of key risks. Manager’s Control Assessment(MCA) is a diagnostic tool used in the management
of operational risks. MCA also supports the evaluation of internal controls over financial reporting and
compliance with regulations by ensuring appropriate review and assessment of the design and execution of
internal controls and risk and control assessment processes
Significant control issues, emerging risks and MCA results are consolidated and aggregated for review by
Citi’s Business Risk Compliance and Control Committees (BRCCs) Quarterly Managers assign a MCA Entity
Rating along with significant residual operational risks (SRORs – These risks reflect the residual risk
impacting the control environment considering management’s assessment of the effectiveness of key controls
designed to mitigate the entity’s significant inherent operational risks)

19
Citi India has adopted the Basic Indicator Approach to operational risk for capital adequacy computation.
Given the low experience of actual operational loss events, this approach is assessed to be conservative and
builds in buffer for unanticipated losses.
1.8 Other Risks
The bank also assesses other qualitative risks such as Reputational/Franchise Risk, Business, Strategic risks
and additional capital requirements, if any, to cover for such risks. The assessment is covered in the ICAAP
process. As part of the assessment process of all products and lines of business, the bank makes a specific
assessment of franchise risk impacting the reputational position of the company. While Business and strategic
risk is considered a material risk for Citibank India, strong controls exist to mitigate such risks such as the
approval of new products and new activities and complex transactions. A robust process of mitigation of the
individual risks also results in a collective mitigation of reputational / franchise risk.
1.9 Leverage Ratio
As per RBI guidelines, disclosures required for leverage ratio for the Bank at the consolidated level at Mar 31,
2018 is as follows:
Amount in Rs. Lakhs
Summary comparison of accounting assets vs. leverage ratio exposure measure
Sl.
No
Item As at September 30, 2018
Standalone Consolidated
1 Total consolidated assets as per published financial
statements 14,594,894 15,644,803
2 Adjustment for investments in banking, financial,
insurance or commercial entities that are consolidated for
accounting purposes but outside the scope of regulatory
consolidation
- -
3 Adjustment for fiduciary assets recognised on the
balance sheet pursuant to the operative accounting
framework but excluded from the leverage ratio
exposure measure
- -
4 Adjustments for derivative financial instruments 1,660,069 1,660,069
5 Adjustment for securities financing transactions (i.e.
repos and similar secured lending) 1,399,167 1,399,167
6 Adjustment for off-balance sheet items (i.e. conversion
to credit equivalent amounts of off- balance sheet
exposures)
3,609,363 3,614,105
7 Other adjustments (23,477) (29,460)
8 Leverage ratio exposure 21,240,017 22,288,685
Amount in Rs. Lakhs
Leverage ratio common disclosure template
SI.
No
Item As at September 30, 2018
Standalone Consolidated
On-balance sheet exposures
1 On-balance sheet items (excluding derivatives and SFTs,
but including collateral) 13,481,934 14,531,844

20
2 (Asset amounts deducted in determining Basel III Tier 1
capital) (23,477) (29,460)
3 Total on-balance sheet exposures (excluding derivatives
and SFTs) (sum of lines 1 and 2) 13,458,457 14,502,384
Derivative exposures
4 Replacement cost associated with all derivatives
transactions (i.e. net of eligible cash variation margin) 1,112,960 1,112,960
5 Add-on amounts for PFE associated with all derivatives
transactions 1,660,069 1,660,069
6 Gross-up for derivatives collateral provided where deducted
from the balance sheet assets pursuant to the operative
accounting framework
-
-
7 (Deductions of receivables assets for cash variation margin
provided in derivatives transactions) - -
8 (Exempted CCP leg of client-cleared trade exposures) - -
9 Adjusted effective notional amount of written credit
derivatives - -
10 (Adjusted effective notional offsets and add-on deductions
for written credit derivatives) - -
11 Total derivative exposures (sum of lines 4 to 10) 2,773,029 2,773,029
Securities financing transaction exposures
12 Gross SFT assets (with no recognition of netting), after
adjusting for sale accounting transactions 1,399,167 1,399,167
13 (Netted amounts of cash payables and cash receivables of
gross SFT assets) - -
14 CCR exposure for SFT assets - -
15 Agent transaction exposures - -
16 Total securities financing transaction exposures (sum of
lines 12 to 15) 1,399,167 1,399,167
17 Off-balance sheet exposure at gross notional amount 8,316,414 8,321,316
18 (Adjustments for conversion to credit equivalent amounts) (4,707,051) (4,707,211)
19 Off-balance sheet items (sum of lines 17 and 18) 3,609,363 3,614,105
Capital and total exposures
20 Tier 1 capital 1,917,798 2,312,180
21 Total exposures (sum of lines 3, 11, 16 and 19) 21,240,017 22,288,685
Leverage ratio
22 Basel III leverage ratio 9.03% 10.37%
Quantitative Disclosures
As per RBI guidelines, disclosures required for leverage ratio for the Bank at a standalone basis for the last 4
quarters:
30-Sep-2018 30-Jun-2018 31-Mar-2018 31-Dec-2017
Tier 1 Capital 1,917,798 1,917,820 1,918,491 1,821,417
Exposure Measure 21,240,017 19,973,907 20,847,015 18,853,465
Leverage Ratio (%) 9.03% 9.60% 9.20% 9.66%

21
Basel III common disclosure template to be used during the transition period
Composition of Capital (Standalone Basis)
Sl.
No. Common Equity Tier 1 capital: instruments and reserves Sept 30, 2018 REF
1
Directly issued qualifying common share capital plus related stock
surplus (share premium) 374,384 a
2 Retained earnings b9
3 Accumulated other comprehensive income (and other reserves) 1,570,845
b1+b2+b3+
b4+b5+b6+
b7+b8
4
Directly issued capital subject to phase out from CET1 (only
applicable to non-joint stock companies1) -
5
Common share capital issued by subsidiaries and held by third
parties (amount allowed in group CET1) -
6 Common Equity Tier 1 capital before regulatory adjustments 1,945,229
Common Equity Tier 1 capital: regulatory adjustments
7 Prudential valuation adjustments 3,954
8 Goodwill (net of related tax liability) -
9 Intangibles (net of related tax liability) 23,477 c
10 Deferred tax assets 25,423 d
11 Cash-flow hedge reserve -
12 Shortfall of provisions to expected losses -
13 Securitisation gain on sale -
14
Gains and losses due to changes in own credit risk on fair valued
liabilities -
15 Defined-benefit pension fund net assets -
16
Investments in own shares (if not already netted off paid-up capital
on reported balance sheet) -
17 Reciprocal cross-holdings in common equity -
18
Investments in the capital of banking, financial and insurance
entities that are outside the scope of regulatory consolidation, net of
eligible short positions, where the bank does not own more than
10% of the issued share capital (amount above 10% threshold) -
19
Significant investments in the common stock of banking, financial
and insurance entities that are outside the scope of regulatory
consolidation, net of eligible short positions (amount above 10%
threshold)3 -
20 Mortgage servicing rights4 (amount above 10% threshold) -
21
Deferred tax assets arising from temporary differences5 (amount
above 10% threshold, net of related tax liability) -
22 Amount exceeding the 15% threshold6 -
23
of which: significant investments in the common stock of financial
entities -
24 of which: mortgage servicing rights -
25 of which: deferred tax assets arising from temporary differences -
26 National specific regulatory adjustments7 (26a+26b+26c+26d) -
26a
of which: Investments in the equity capital of the unconsolidated
insurance subsidiaries -
26b
of which: Investments in the equity capital of unconsolidated non-
financial subsidiaries8 -

22
Sl.
No. Common Equity Tier 1 capital: instruments and reserves Sept 30, 2018 REF
26c
of which: Shortfall in the equity capital of majority owned financial
entities which have not been consolidated with the bank9 -
26d of which: Unamortised pension funds expenditures -
27
Regulatory adjustments applied to Common Equity Tier 1 due to
insufficient Additional Tier 1 and Tier 2 to cover deductions -
28 Total regulatory adjustments to Common equity Tier 1 52,854
Add:
Deferred Tax Asset which relate to timing difference, up to
10% of CET1 Capital 25,423
29 Common Equity Tier 1 capital (CET1) 1,917,798
Additional Tier 1 capital: instruments
30
Directly issued qualifying Additional Tier 1 instruments plus
related stock surplus (31+32) -
31
of which: classified as equity under applicable accounting standards
(Perpetual Non-Cumulative Preference Shares) -
32
of which: classified as liabilities under applicable accounting
standards (Perpetual debt Instruments) -
33
Directly issued capital instruments subject to phase out from
Additional Tier 1 -
34
Additional Tier 1 instruments (and CET1 instruments not included
in row 5) issued by subsidiaries and held by third parties (amount
allowed in group AT1) -
35 of which: instruments issued by subsidiaries subject to phase out -
36 Additional Tier 1 capital before regulatory adjustments -
Additional Tier 1 capital: regulatory adjustments
37 Investments in own Additional Tier 1 instruments -
38 Reciprocal cross-holdings in Additional Tier 1 instruments -
39
Investments in the capital of banking, financial and insurance
entities that are outside the scope of regulatory consolidation, net of
eligible short positions, where the bank does not own more than
10% of the issued common share capital of the entity (amount
above 10% threshold) -
40
Significant investments in the capital of banking, financial and
insurance entities that are outside the scope of regulatory
consolidation (net of eligible short positions)10 -
41 National specific regulatory adjustments (41a+41b) -
41a
Investments in the Additional Tier 1 capital of unconsolidated
insurance subsidiaries -
41b
Shortfall in the Additional Tier 1 capital of majority owned
financial entities which have not been consolidated with the bank -
42
Regulatory adjustments applied to Additional Tier 1 due to
insufficient Tier 2 to cover deductions -
43 Total regulatory adjustments to Additional Tier 1 capital -
44 Additional Tier 1 capital (AT1) -
44a Additional Tier 1 capital reckoned for capital adequacy11 -
45 Tier 1 capital (T1 = CET1 + AT1) (29 + 44a) 1,917,798
Tier 2 capital: instruments and provisions -
46
Directly issued qualifying Tier 2 instruments plus related stock
surplus -

23
Sl.
No. Common Equity Tier 1 capital: instruments and reserves Sept 30, 2018 REF
47 Directly issued capital instruments subject to phase out from Tier 2 -
48
Tier 2 instruments (and CET1 and AT1 instruments not included in
rows 5 or 34) issued by subsidiaries and held by third parties
(amount allowed in group Tier 2) -
49 of which: instruments issued by subsidiaries subject to phase out -
50 Provisions and Revaluation Reserve (Refer Note) 81,802
51 Tier 2 capital before regulatory adjustments 81,802
Tier 2 capital: regulatory adjustments -
52 Investments in own Tier 2 instruments -
53 Reciprocal cross-holdings in Tier 2 instruments -
54
Investments in the capital of banking, financial and insurance
entities that are outside the scope of regulatory consolidation, net of
eligible short positions, where the bank does not own more than
10% of the issued common share capital of the entity (amount
above the 10% -
55
Significant investments13 in the capital banking, financial and
insurance entities that are outside the scope of regulatory
consolidation (net of eligible short positions) -
56 National specific regulatory adjustments (56a+56b) -
56a
of which: Investments in the Tier 2 capital of unconsolidated
subsidiaries -
56b
of which: Shortfall in the Tier 2 capital of majority owned financial
entities which have not been consolidated with the bank -
57 Total regulatory adjustments to Tier 2 capital -
58 Tier 2 capital (T2) 81,802
58a Tier 2 capital reckoned for capital adequacy 81,802
58b Excess Additional Tier 1 capital reckoned as Tier 2 capital -
58c Total Tier 2 capital admissible for capital adequacy (58a + 58b) 81,802
59 Total capital (TC = T1 + T2) (45 + 58c) 1,999,601
60 Total risk weighted assets (60a + 60b + 60c) 12,594,414
60a of which: total credit risk weighted assets 9,272,426
60b of which: total market risk weighted assets 1,388,269
60c of which: total operational risk weighted assets 1,933,719
Capital ratios
61 Common Equity Tier 1 (as a percentage of risk weighted assets) 15.23%
62 Tier 1 (as a percentage of risk weighted assets) 15.23%
63 Total capital (as a percentage of risk weighted assets) 15.88%
64
Institution specific buffer requirement (minimum CET1
requirement plus capital conservation and countercyclical buffer
requirements, expressed as a percentage of risk weighted assets) 9.63%
65 of which: capital conservation buffer requirement 1.88%
66 of which: bank specific countercyclical buffer requirement -
67 of which: G-SIB buffer requirement 2.25%
68
Common Equity Tier 1 available to meet buffers (as a percentage of
risk weighted assets) 9.73%
National minima (if different from Basel III)
69
National Common Equity Tier 1 minimum ratio (if different from
Basel III minimum) 5.50%
24
Sl.
No. Common Equity Tier 1 capital: instruments and reserves Sept 30, 2018 REF
70
National Tier 1 minimum ratio (if different from Basel III
minimum) 7.00%
71
National total capital minimum ratio (if different from Basel III
minimum) 9.00%
Amounts below the thresholds for deduction (before risk
weighting) -
72 Non-significant investments in the capital of other financial entities -
73 Significant investments in the common stock of financial entities -
74 Mortgage servicing rights (net of related tax liability) -
75
Deferred tax assets arising from temporary differences (net of
related tax liability) -
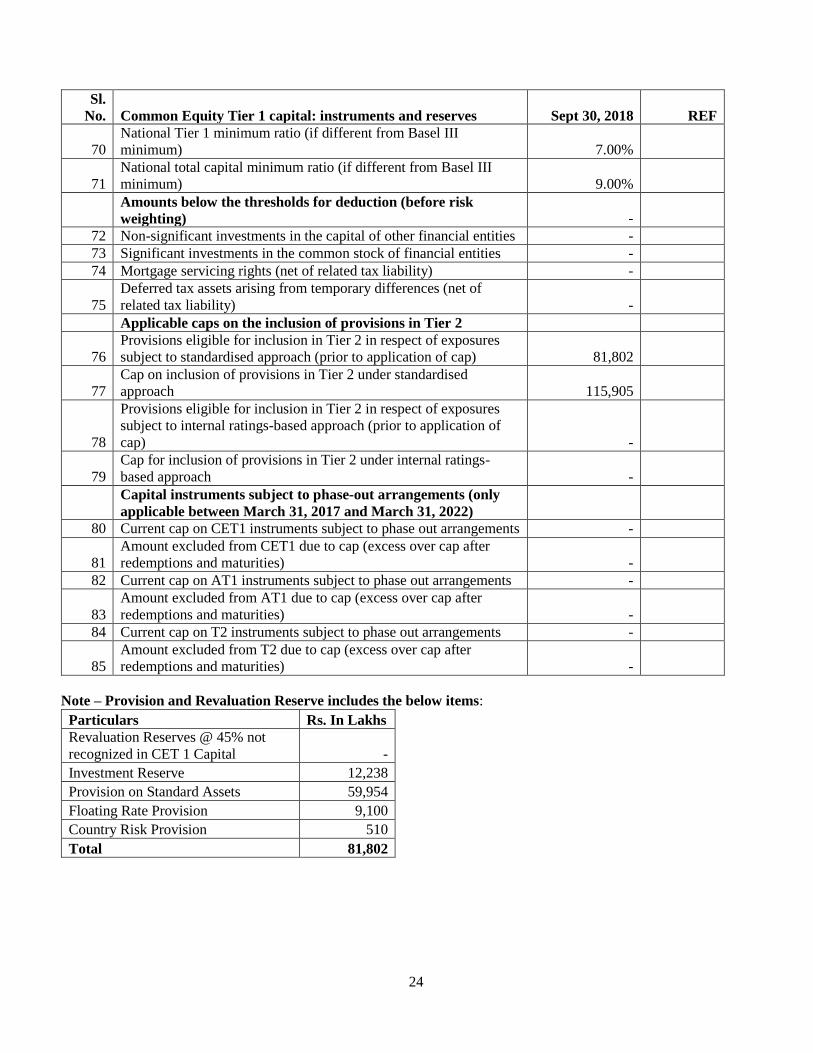
Applicable caps on the inclusion of provisions in Tier 2
76
Provisions eligible for inclusion in Tier 2 in respect of exposures
subject to standardised approach (prior to application of cap) 81,802
77
Cap on inclusion of provisions in Tier 2 under standardised
approach 115,905
78
Provisions eligible for inclusion in Tier 2 in respect of exposures
subject to internal ratings-based approach (prior to application of
cap) -
79
Cap for inclusion of provisions in Tier 2 under internal ratings-
based approach -
Capital instruments subject to phase-out arrangements (only
applicable between March 31, 2017 and March 31, 2022)
80 Current cap on CET1 instruments subject to phase out arrangements -
81
Amount excluded from CET1 due to cap (excess over cap after
redemptions and maturities) -
82 Current cap on AT1 instruments subject to phase out arrangements -
83
Amount excluded from AT1 due to cap (excess over cap after
redemptions and maturities) -
84 Current cap on T2 instruments subject to phase out arrangements -
85
Amount excluded from T2 due to cap (excess over cap after
redemptions and maturities) -
Note – Provision and Revaluation Reserve includes the below items:
Particulars Rs. In Lakhs
Revaluation Reserves @ 45% not
recognized in CET 1 Capital -
Investment Reserve 12,238
Provision on Standard Assets 59,954
Floating Rate Provision 9,100
Country Risk Provision 510
Total 81,802
25
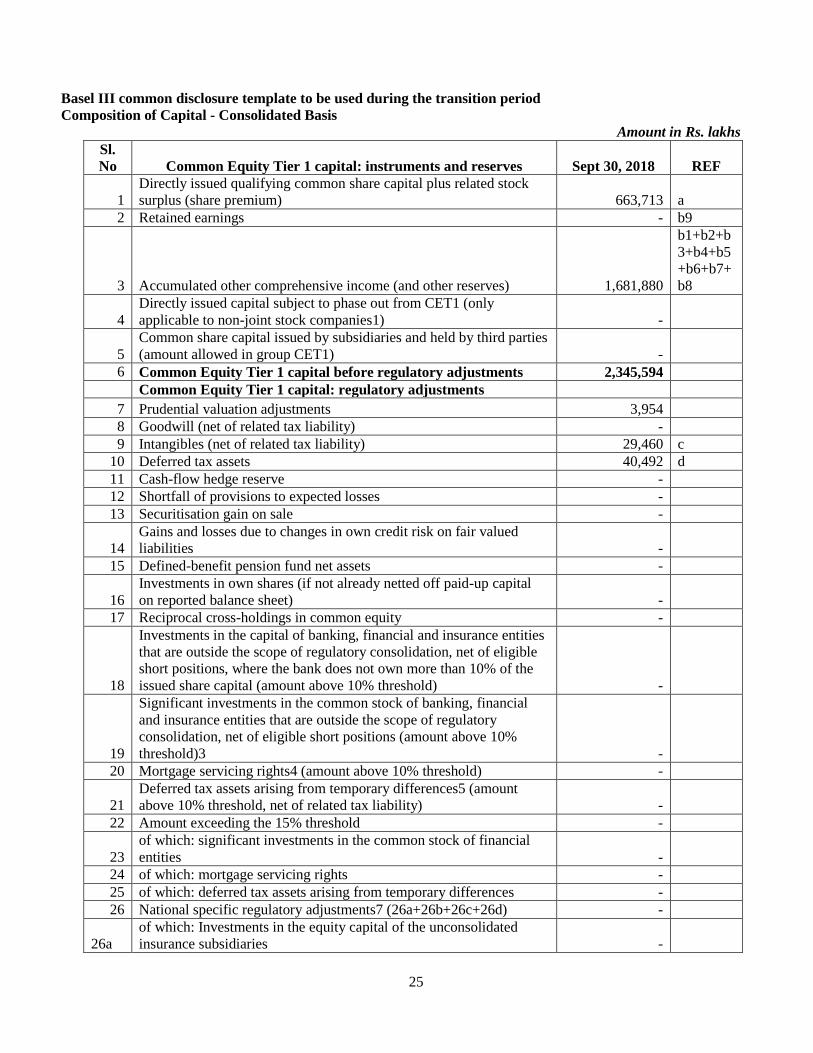
Basel III common disclosure template to be used during the transition period
Composition of Capital - Consolidated Basis
Amount in Rs. lakhs
Sl.
No Common Equity Tier 1 capital: instruments and reserves Sept 30, 2018 REF
1
Directly issued qualifying common share capital plus related stock
surplus (share premium) 663,713 a
2 Retained earnings - b9
3 Accumulated other comprehensive income (and other reserves) 1,681,880
b1+b2+b
3+b4+b5
+b6+b7+
b8
4
Directly issued capital subject to phase out from CET1 (only
applicable to non-joint stock companies1) -
5
Common share capital issued by subsidiaries and held by third parties
(amount allowed in group CET1) -
6 Common Equity Tier 1 capital before regulatory adjustments 2,345,594
Common Equity Tier 1 capital: regulatory adjustments
7 Prudential valuation adjustments 3,954
8 Goodwill (net of related tax liability) -
9 Intangibles (net of related tax liability) 29,460 c
10 Deferred tax assets 40,492 d
11 Cash-flow hedge reserve -
12 Shortfall of provisions to expected losses -
13 Securitisation gain on sale -
14
Gains and losses due to changes in own credit risk on fair valued
liabilities -
15 Defined-benefit pension fund net assets -
16
Investments in own shares (if not already netted off paid-up capital
on reported balance sheet) -
17 Reciprocal cross-holdings in common equity -
18
Investments in the capital of banking, financial and insurance entities
that are outside the scope of regulatory consolidation, net of eligible
short positions, where the bank does not own more than 10% of the
issued share capital (amount above 10% threshold) -
19
Significant investments in the common stock of banking, financial
and insurance entities that are outside the scope of regulatory
consolidation, net of eligible short positions (amount above 10%
threshold)3 -
20 Mortgage servicing rights4 (amount above 10% threshold) -
21
Deferred tax assets arising from temporary differences5 (amount
above 10% threshold, net of related tax liability) -
22 Amount exceeding the 15% threshold -
23
of which: significant investments in the common stock of financial
entities -
24 of which: mortgage servicing rights -
25 of which: deferred tax assets arising from temporary differences -
26 National specific regulatory adjustments7 (26a+26b+26c+26d) -
26a
of which: Investments in the equity capital of the unconsolidated
insurance subsidiaries -

26
Sl.
No Common Equity Tier 1 capital: instruments and reserves Sept 30, 2018 REF
26b
of which: Investments in the equity capital of unconsolidated non-
financial subsidiaries8 -
26c
of which: Shortfall in the equity capital of majority owned financial
entities which have not been consolidated with the bank9 -
26d of which: Unamortised pension funds expenditures -
27
Regulatory adjustments applied to Common Equity Tier 1 due to
insufficient Additional Tier 1 and Tier 2 to cover deductions -
28 Total regulatory adjustments to Common equity Tier 1 73,906
Add:
Deferred Tax Asset which relate to timing difference, up to 10%
of CET1 Capital 40,492
29 Common Equity Tier 1 capital (CET1) 2,312,180
Additional Tier 1 capital: instruments -
30
Directly issued qualifying Additional Tier 1 instruments plus related
stock surplus (31+32) -
31
of which: classified as equity under applicable accounting standards
(Perpetual Non-Cumulative Preference Shares) -
32
of which: classified as liabilities under applicable accounting
standards (Perpetual debt Instruments) -
33
Directly issued capital instruments subject to phase out from
Additional Tier 1 -
34
Additional Tier 1 instruments (and CET1 instruments not included in
row 5) issued by subsidiaries and held by third parties (amount
allowed in group AT1) -
35 of which: instruments issued by subsidiaries subject to phase out -
36 Additional Tier 1 capital before regulatory adjustments -
Additional Tier 1 capital: regulatory adjustments -
37 Investments in own Additional Tier 1 instruments -
38 Reciprocal cross-holdings in Additional Tier 1 instruments -
39
Investments in the capital of banking, financial and insurance entities
that are outside the scope of regulatory consolidation, net of eligible
short positions, where the bank does not own more than 10% of the
issued common share capital of the entity (amount above 10%
threshold) -
40
Significant investments in the capital of banking, financial and
insurance entities that are outside the scope of regulatory
consolidation (net of eligible short positions)10 -
41 National specific regulatory adjustments (41a+41b) -
41a
Investments in the Additional Tier 1 capital of unconsolidated
insurance subsidiaries -
41b
Shortfall in the Additional Tier 1 capital of majority owned financial
entities which have not been consolidated with the bank -
42
Regulatory adjustments applied to Additional Tier 1 due to
insufficient Tier 2 to cover deductions -
43 Total regulatory adjustments to Additional Tier 1 capital
44 Additional Tier 1 capital (AT1) -
44a Additional Tier 1 capital reckoned for capital adequacy11 -
45 Tier 1 capital (T1 = CET1 + AT1) (29 + 44a) 2,312,180
Tier 2 capital: instruments and provisions -

27
Sl.
No Common Equity Tier 1 capital: instruments and reserves Sept 30, 2018 REF
46
Directly issued qualifying Tier 2 instruments plus related stock
surplus -
47 Directly issued capital instruments subject to phase out from Tier 2 -
48
Tier 2 instruments (and CET1 and AT1 instruments not included in
rows 5 or 34) issued by subsidiaries and held by third parties (amount
allowed in group Tier 2) -
49 of which: instruments issued by subsidiaries subject to phase out -
50 Provisions and Revaluation Reserve (Refer Note) 85,251
51 Tier 2 capital before regulatory adjustments 85,251
Tier 2 capital: regulatory adjustments
52 Investments in own Tier 2 instruments -
53 Reciprocal cross-holdings in Tier 2 instruments -
54
Investments in the capital of banking, financial and insurance entities
that are outside the scope of regulatory consolidation, net of eligible
short positions, where the bank does not own more than 10% of the
issued common share capital of the entity (amount above the 10%
threshold) -
55
Significant investments13 in the capital banking, financial and
insurance entities that are outside the scope of regulatory
consolidation (net of eligible short positions) -
56 National specific regulatory adjustments (56a+56b) -
56a
of which: Investments in the Tier 2 capital of unconsolidated
subsidiaries -
56b
of which: Shortfall in the Tier 2 capital of majority owned financial
entities which have not been consolidated with the bank -
57 Total regulatory adjustments to Tier 2 capital -
58 Tier 2 capital (T2) 85,251
58a Tier 2 capital reckoned for capital adequacy 85,251
58b Excess Additional Tier 1 capital reckoned as Tier 2 capital -
58c Total Tier 2 capital admissible for capital adequacy (58a + 58b) 85,251
59 Total capital (TC = T1 + T2) (45 + 58c) 2,397,434
60 Total risk weighted assets (60a + 60b + 60c) 13,815,202
60a of which: total credit risk weighted assets 10,300,288
60b of which: total market risk weighted assets 1,502,101
60c of which: total operational risk weighted assets 2,012,813
Capital ratios
61 Common Equity Tier 1 (as a percentage of risk weighted assets) 16.74%
62 Tier 1 (as a percentage of risk weighted assets) 16.74%
63 Total capital (as a percentage of risk weighted assets) 17.35%
64
Institution specific buffer requirement (minimum CET1 requirement
plus capital conservation and countercyclical buffer requirements,
expressed as a percentage of risk weighted assets) 9.63%
65 of which: capital conservation buffer requirement 1.88%
66 of which: bank specific countercyclical buffer requirement -
67 of which: G-SIB buffer requirement 2.25%
68 Common Equity Tier 1 available to meet buffers (as a percentage of
risk weighted assets)
11.24%

28
Sl.
No Common Equity Tier 1 capital: instruments and reserves Sept 30, 2018 REF
National minima (if different from Basel III)
69
National Common Equity Tier 1 minimum ratio (if different from
Basel III minimum) 5.50%
70 National Tier 1 minimum ratio (if different from Basel III minimum) 7.00%
71
National total capital minimum ratio (if different from Basel III
minimum) 9.00%
Amounts below the thresholds for deduction (before risk
weighting)
72 Non-significant investments in the capital of other financial entities -
73 Significant investments in the common stock of financial entities -
74 Mortgage servicing rights (net of related tax liability) -
75
Deferred tax assets arising from temporary differences (net of related
tax liability) -
Applicable caps on the inclusion of provisions in Tier 2
76
Provisions eligible for inclusion in Tier 2 in respect of exposures
subject to standardised approach (prior to application of cap) 85,251
77 Cap on inclusion of provisions in Tier 2 under standardised approach 128,754
78
Provisions eligible for inclusion in Tier 2 in respect of exposures
subject to internal ratings-based approach (prior to application of cap) -
79
Cap for inclusion of provisions in Tier 2 under internal ratings-based
approach
-
Capital instruments subject to phase-out arrangements (only
applicable between March 31, 2017 and March 31, 2022)
80 Current cap on CET1 instruments subject to phase out arrangements -
81
Amount excluded from CET1 due to cap (excess over cap after
redemptions and maturities)
-
82 Current cap on AT1 instruments subject to phase out arrangements -
83
Amount excluded from AT1 due to cap (excess over cap after
redemptions and maturities)
-
84 Current cap on T2 instruments subject to phase out arrangements -
85
Amount excluded from T2 due to cap (excess over cap after
redemptions and maturities)
-
Note – Provision and Revaluation Reserve includes the
below items:
Particulars Rs. In Lakhs
Revaluation Reserves @ 45% not
recognized in CET 1 Capital -
Investment Reserve 12,238
Provision on Standard Assets 63,402
Floating Rate Provision 9,100
Country Risk Provision 510
Total 85,251

29
Step 1 to Reconciliation Requirements Amount in Rs. lakhs
Particulars
Balance sheet as in
financial statements
Solo
Balance sheet as in
financial statements
Balance sheet under
regulatory scope of
consolidation
As on 30th Sept, 2018 As on 30th Sept, 2018
A Capital & Liabilities
i Paid-up Capital 374,384 663,713
Reserves & Surplus 2,027,993 2,139,028
Minority Interest
Total Capital 2,402,376 2,802,741
ii Deposits 11,215,706 11,215,706
of which: Deposits from banks 56,394 56,394
of which: Customer deposits 11,159,312 11,159,312
of which: Other deposits (pl. specify) - -
iii Borrowings 442,125 1,052,333
of which: From RBI - -
of which: From banks 398,006 402,975
of which: From other institutions & agencies 42,970 42,970
of which: Others (Debentures & Finance Lease obligation) 1,149 606,388
of which: Capital instruments - -
iv Other liabilities & provisions 1,946,378 1,985,716
Total 16,006,586 17,056,496
Assets
i Cash and balances with Reserve Bank of India 1,548,492 1,548,492
Balance with banks and money at call and short notice 602,870 634,497
Total 2,151,361 2,182,989
ii Investments: 6,069,220 6,104,292
of which: Government securities 5,444,127 5,444,127
of which: Other approved securities - -
of which: Shares 2,042 3,713
of which: Debentures & Bonds 407,589 432,291
of which: Subsidiaries / Joint Ventures / Associates - 8,700
of which: Others (Commercial Papers, Mutual Funds etc.) 215,461 215,461
iii Loans and advances 5,866,673 6,777,163
of which: Loans and advances to banks - 47,900
of which: Loans and advances to customers 5,866,673 6,729,263
iv Fixed assets 138,259 138,919
v Other assets 1,781,072 1,853,132
of which: Goodwill and intangible assets 23,477 29,460
of which: Deferred tax assets 25,423 40,492
vi Goodwill on consolidation - -
vii Debit balance in Profit & Loss account - -
Total Assets 16,006,585 17,056,496

30
Step 2 to Reconciliation Requirement
Amount in Rs. Lakhs
Particulars
Balance sheet as in
financial statements
Solo
Balance sheet as in
financial statements
Balance sheet under
regulatory scope of
consolidation
Ref
As on 30th Sept, 2018 As on 30th Sept, 2018
A Capital & Liabilities
i Paid-up Capital 374,384 663,713
of which: Amount eligible for CET1 374,384 663,713 a
of which: Amount eligible for AT1
Reserves & Surplus 2,027,993 2,139,028
- Statutory Reserves 806,439 866,180 b1
- Remittable Surplus retained in Indian books 713,370 713,370 b2
- Capital Reserves on Sale of Immovable Property 13,822 13,822 b3
- Furniture & Equipment Reserve - - b4
- Properties Investment Reserve 6,194 6,194 b5
- FX Capital Reserve - - b6
- Special Reserve 18,733 18,733 b7
- Revaluation Reserve (Part of CET 1 Capital) 12,287 12,287 b8
-General Reserves - - b9
-Other reserves 457,147 508,441 b10
Minority Interest - -
Total Capital 2,402,376 2,802,741
ii Deposits 11,215,706 11,215,706
of which: Deposits from banks 56,394 56,394
of which: Customer deposits 11,159,312 11,159,312
of which: Other deposits (pl. specify) - -
Iii Borrowings 442,125 1,052,333
of which: From RBI - -
of which: From banks 398,006 402,975
of which: From other institutions & agencies 42,970 42,970
of which: Others (pl. specify) 1,149 606,388
of which: Capital instruments - -
iv Other liabilities & provisions 1,946,378 1,985,716
of which: DTLs related to goodwill - -
of which: DTLs related to intangible assets - -
Total 16,006,585 17,056,496
Assets
i Cash and balances with Reserve Bank of India 1,548,492 1,548,492
Balance with banks and money at call and short notice 602,870 634,497
Total 2,151,361 2,182,989
ii Investments: 6,069,220 6,104,292
of which: Government securities (Note) 5,444,127 5,444,127
of which: Other approved securities - -
of which: Shares 2,042 3,713
of which: Debentures & Bonds 407,589 432,291
of which: Subsidiaries / Joint Ventures / Associates - 8,700
of which: Others (Commercial Papers, Mutual Funds etc.) 215,461 215,461

31
Particulars Ref
iii Loans and advances 5,866,673 6,777,163
of which: Loans and advances to banks - 47,900
of which: Loans and advances to customers 5,866,673 6,729,263
iv Fixed assets 138,259 138,919
v Other assets 1,781,072 1,853,131
of which: Goodwill and intangible assets 23,477 29,460 c
Of which: Goodwill - -
Of which: Other intangibles (excluding MSRs) 23,477 23,477
of which: Deferred tax assets 25,423 40,492 d
vi Goodwill on consolidation - -
vii Debit balance in Profit & Loss account - -
Total Assets 16,006,585 17,056,495
Note: Citi does not have any regulatory Capital Instrument; the disclosure template for the same is not
applicable.
Scope of Application:
Qualitative Disclosures:
A List of group entities considered for consolidation as on 30th September, 2018 Name
of the
entity /
Countr
y of
incorpo
ration
Whether
the entity is
included
under
accounting
scope of
consolidatio
n (yes / no)
Method
of
consolid
ation
Whether the
entity is
included
under
regulatory
scope of
consolidation
(yes / no)
Explain the method of
consolidation
Reasons
for
differenc
e in the
method
of
consolid
ation
Reasons if
consolidated
under only
one of the
scopes of
consolidation
Citicorp
Finance
(India)
Limited
No NA Yes
The RBI guidelines on
Financial Regulation of
Systemically Important
NBFCs and Banks’
Relationship vide circular ref.
DBOD. No. FSD. BC.46 /
24.01.028/ 2006-07 December
12, 2006 read with ‘Guidelines
for consolidated accounting
and other quantitative methods
to facilitate consolidated
supervision’ vide circular ref.
DBOD.No.BP.BC.72/
21.04.018/2001-02 dated
February 25, 2003 mandate
coverage of the ‘Consolidated
Bank’ (herein also referred to
as ‘Citi’).
NA NA

32
B List of group entities not considered for consolidation both under the accounting and regulatory
scope of consolidation
Amount in Rs. lakhs
Name of the
entity /
country of
incorporation
Principle activity of the
entity
Total balance
sheet equity
(as stated in
the accounting
balance sheet
of the legal
entity)
% of
bank’s
holding in
the total
equity
Regulatory
treatment of
bank’s
investments
in the capital
instruments
of the entity
Total balance
sheet assets (as
stated in the
accounting
balance sheet of
the legal entity)
Citigroup
Global Markets
India private
Limited*
Stock Broking & Investment
Banking 23,000 0% NA 480,281
Orbitech
Private
Limited*
Strategic investment
286 0% NA 7,016
Citicorp
Services India
Private
Limited*
Captive Business Process
Outsourcing (BPO),
Knowledge Process
Outsourcing (KPO),
Information Technology
Outsourcing (ITO), ITES,
vendors’ oversight, decision
support, shared services, SFS
operations and software
development / applications
related services.
10,653 0% NA 250,990
*Note: The numbers updated for Citigroup Global Markets India Private Limited, Citicorp Services India Private
Limited and Orbitech Private Limited are basis unaudited figures.
(ii) Quantitative Disclosures:
C
List of group entities considered for consolidation
Amount in Rs. lakhs
Name of the entity /
country of
incorporation (as
indicated in (i)a. above)
Principle activity
of the entity
Total balance sheet equity (as
stated in the accounting
balance sheet of the legal
entity)
Total balance sheet assets (as
stated in the accounting
balance sheet of the legal
entity)
Citicorp Finance (India)
Limited
NBFC, Insurance
distribution 289,330 1,049,909
D
The aggregate amount of capital deficiencies in all subsidiaries which are not included in the regulatory scope
of consolidation i.e. that are deducted:
Name of the
subsidiaries / country of
incorporation
Principle activity
of the entity
Total balance sheet equity (as
stated in the accounting
balance sheet of the legal
entity)
% of bank’s
holding in
the total
equity
Capital
deficiencies
NA NA NA NA NA

33
E.
The aggregate amounts (e.g. current book value) of the bank’s total interests in insurance entities, which are risk-
weighted:
Name of the insurance
entities / country of
incorporation
Principle activity
of the entity
Total balance sheet equity
(as stated in the accounting
balance sheet of the legal
entity)
% of bank’s
holding in
the total
equity /
proportion of
voting power
Quantitative
impact on
regulatory
capital of
using risk
weighting
method versus
using the full
deduction
method
NA NA NA NA NA
Top Related