


Languages
Pages
Legal

Based on CCIA-BML certified exports
CCIA-BML Exports Report First Half of 2019
CCIA-BML - Center for Economic Research 10-24-2019
Lana El Tabch Center for Economic Research at the CCIA-BML 1
Table of Contents
CCIA-BML certified exports in the first half of 2019 ......................................................... 3
CCIA-BML certified exports by weight ............................................................................. 4
Top export markets of CCIA-BML certified exports ......................................................... 5
Evolution of Lebanon’s main export markets over the past three years based on CCIA-
BML certified exports ....................................................................................................... 7
Geographical distribution of CCIA-BML certified exports ................................................ 7
Main products exported based on CCIA-BML certified exports ....................................... 9
Lana El Tabch Center for Economic Research at the CCIA-BML 2
The present report illustrates Lebanese exports data compiled solely based on
the certificates of origin issued by the Chamber of Commerce, Industry and
Agriculture of Beirut and Mount Lebanon (CCIA-BML). This data is therefore not
to be confused with the Customs data that tallies Lebanese exports on a national
scale. All the tables and charts of the report hence refer exclusively to the CCIA-
BML certified exports.
Lana El Tabch Center for Economic Research at the CCIA-BML 3
CCIA-BML Exports Report
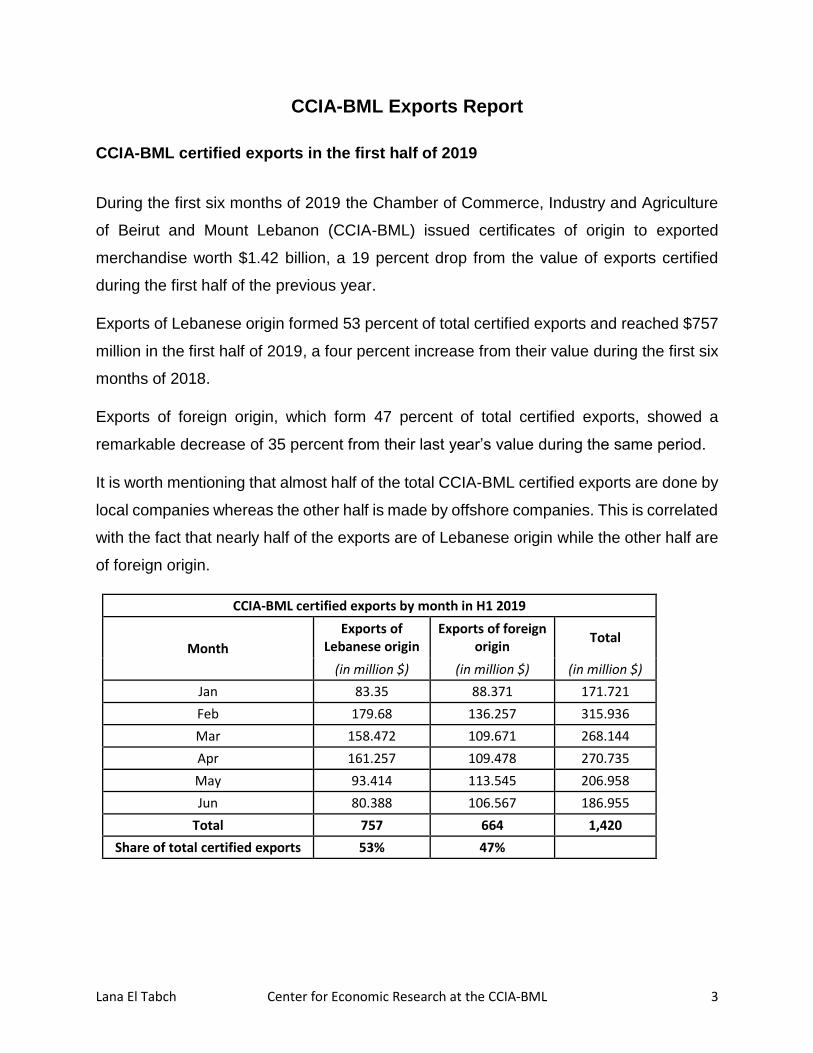
CCIA-BML certified exports in the first half of 2019
During the first six months of 2019 the Chamber of Commerce, Industry and Agriculture
of Beirut and Mount Lebanon (CCIA-BML) issued certificates of origin to exported
merchandise worth $1.42 billion, a 19 percent drop from the value of exports certified
during the first half of the previous year.
Exports of Lebanese origin formed 53 percent of total certified exports and reached $757
million in the first half of 2019, a four percent increase from their value during the first six
months of 2018.
Exports of foreign origin, which form 47 percent of total certified exports, showed a
remarkable decrease of 35 percent from their last year’s value during the same period.
It is worth mentioning that almost half of the total CCIA-BML certified exports are done by
local companies whereas the other half is made by offshore companies. This is correlated
with the fact that nearly half of the exports are of Lebanese origin while the other half are
of foreign origin.
CCIA-BML certified exports by month in H1 2019
Month
Exports of Lebanese origin
Exports of foreign origin
Total
(in million $) (in million $) (in million $)
Jan 83.35 88.371 171.721
Feb 179.68 136.257 315.936
Mar 158.472 109.671 268.144
Apr 161.257 109.478 270.735
May 93.414 113.545 206.958
Jun 80.388 106.567 186.955
Total 757 664 1,420
Share of total certified exports 53% 47%
Lana El Tabch Center for Economic Research at the CCIA-BML 4
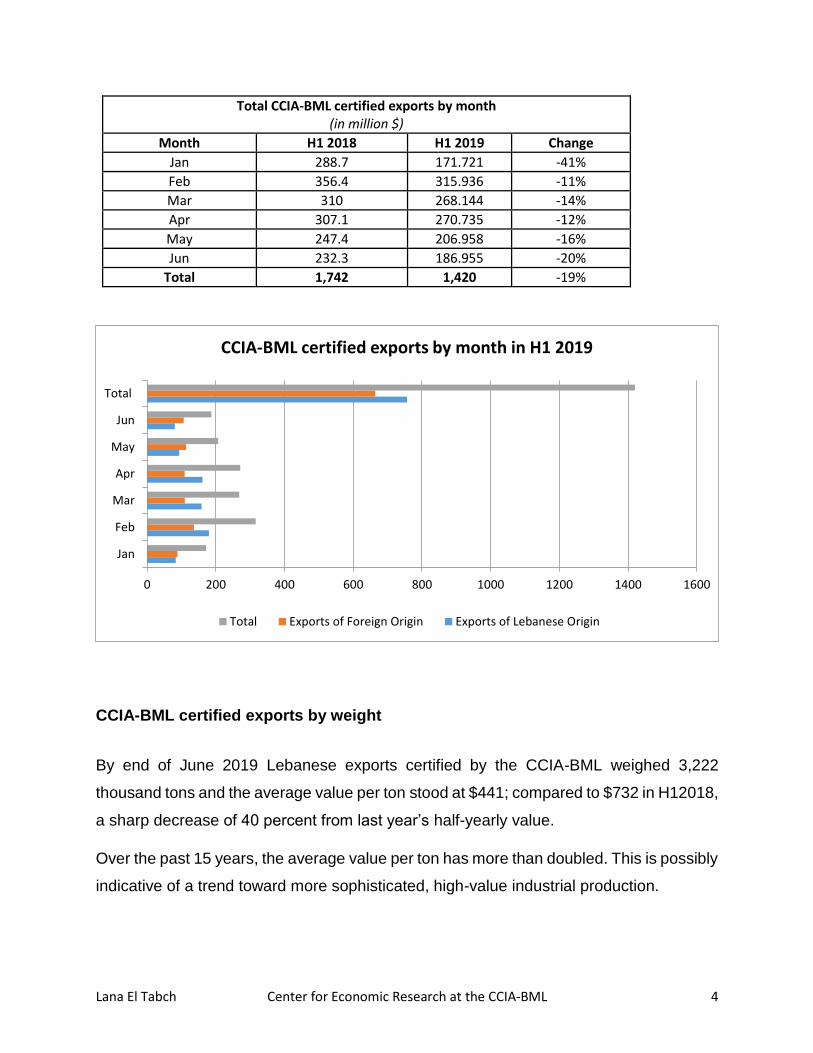
Total CCIA-BML certified exports by month (in million $)
Month H1 2018 H1 2019 Change
Jan 288.7 171.721 -41%
Feb 356.4 315.936 -11%
Mar 310 268.144 -14%
Apr 307.1 270.735 -12%
May 247.4 206.958 -16%
Jun 232.3 186.955 -20%
Total 1,742 1,420 -19%
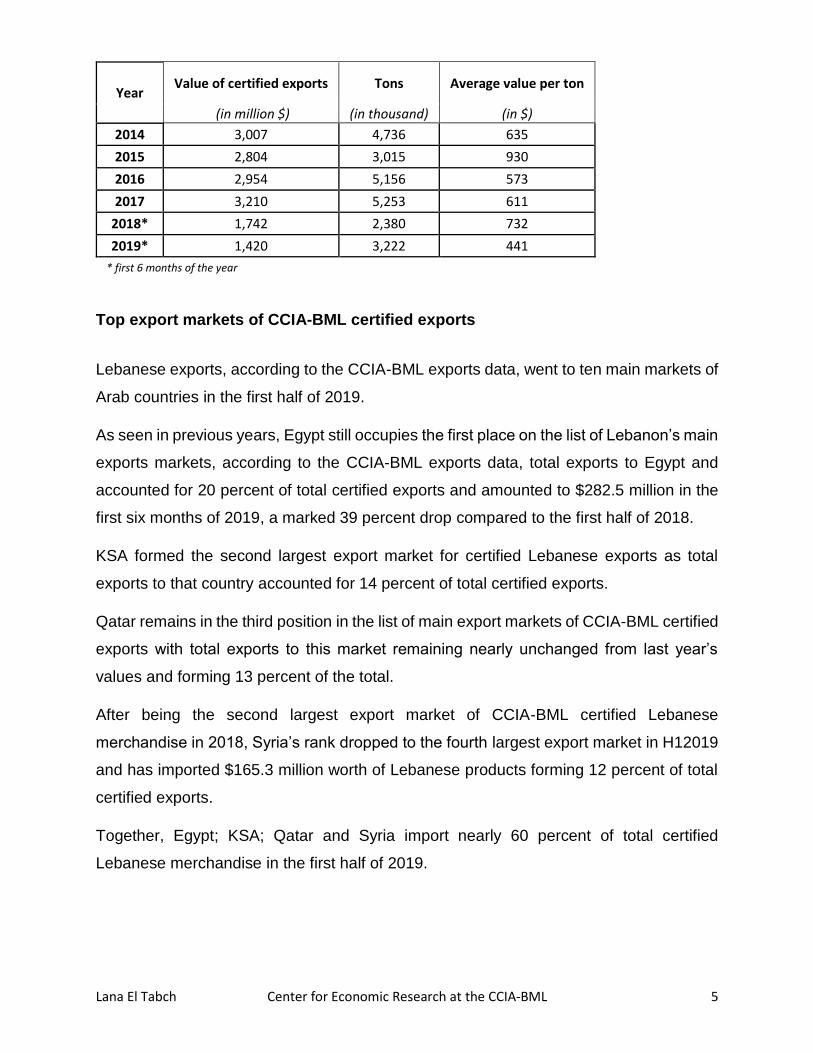
CCIA-BML certified exports by weight
By end of June 2019 Lebanese exports certified by the CCIA-BML weighed 3,222
thousand tons and the average value per ton stood at $441; compared to $732 in H12018,
a sharp decrease of 40 percent from last year’s half-yearly value.
Over the past 15 years, the average value per ton has more than doubled. This is possibly
indicative of a trend toward more sophisticated, high-value industrial production.
0 200 400 600 800 1000 1200 1400 1600
Jan
Feb
Mar
Apr
May
Jun
Total
CCIA-BML certified exports by month in H1 2019
Total Exports of Foreign Origin Exports of Lebanese Origin
Lana El Tabch Center for Economic Research at the CCIA-BML 5
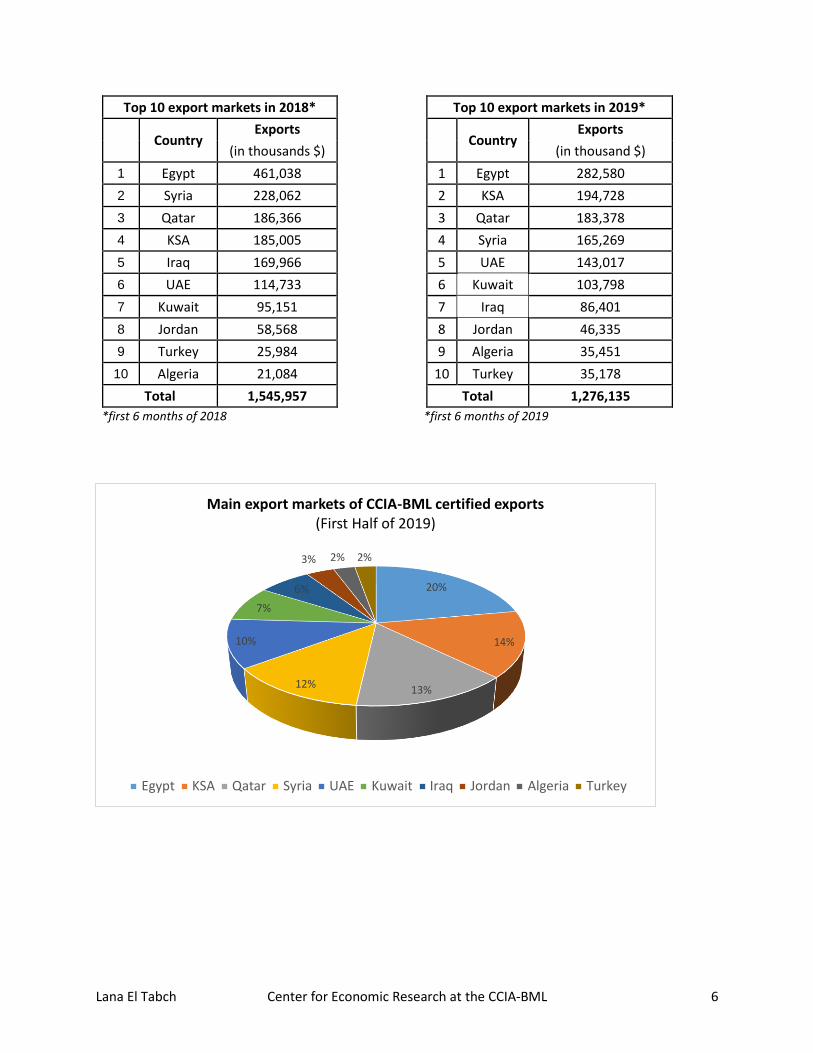
Top export markets of CCIA-BML certified exports
Lebanese exports, according to the CCIA-BML exports data, went to ten main markets of
Arab countries in the first half of 2019.
As seen in previous years, Egypt still occupies the first place on the list of Lebanon’s main
exports markets, according to the CCIA-BML exports data, total exports to Egypt and
accounted for 20 percent of total certified exports and amounted to $282.5 million in the
first six months of 2019, a marked 39 percent drop compared to the first half of 2018.
KSA formed the second largest export market for certified Lebanese exports as total
exports to that country accounted for 14 percent of total certified exports.
Qatar remains in the third position in the list of main export markets of CCIA-BML certified
exports with total exports to this market remaining nearly unchanged from last year’s
values and forming 13 percent of the total.
After being the second largest export market of CCIA-BML certified Lebanese
merchandise in 2018, Syria’s rank dropped to the fourth largest export market in H12019
and has imported $165.3 million worth of Lebanese products forming 12 percent of total
certified exports.
Together, Egypt; KSA; Qatar and Syria import nearly 60 percent of total certified
Lebanese merchandise in the first half of 2019.
Year Value of certified exports Tons Average value per ton
(in million $) (in thousand) (in $)
2014 3,007 4,736 635
2015 2,804 3,015 930
2016 2,954 5,156 573
2017 3,210 5,253 611
2018* 1,742 2,380 732
2019* 1,420 3,222 441
* first 6 months of the year
Lana El Tabch Center for Economic Research at the CCIA-BML 6
Top 10 export markets in 2018* Top 10 export markets in 2019*
Country Exports Country
Exports
(in thousands $) (in thousand $)
1 Egypt 461,038 1 Egypt 282,580
2 Syria 228,062 2 KSA 194,728
3 Qatar 186,366 3 Qatar 183,378
4 KSA 185,005 4 Syria 165,269
5 Iraq 169,966 5 UAE 143,017
6 UAE 114,733 6 Kuwait 103,798
7 Kuwait 95,151 7 Iraq 86,401
8 Jordan 58,568 8 Jordan 46,335
9 Turkey 25,984 9 Algeria 35,451
10 Algeria 21,084 10 Turkey 35,178
Total 1,545,957 Total 1,276,135
*first 6 months of 2018 *first 6 months of 2019
20%
14%
13%12%
10%
7%
6%
3% 2% 2%
Main export markets of CCIA-BML certified exports(First Half of 2019)
Egypt KSA Qatar Syria UAE Kuwait Iraq Jordan Algeria Turkey
Lana El Tabch Center for Economic Research at the CCIA-BML 7
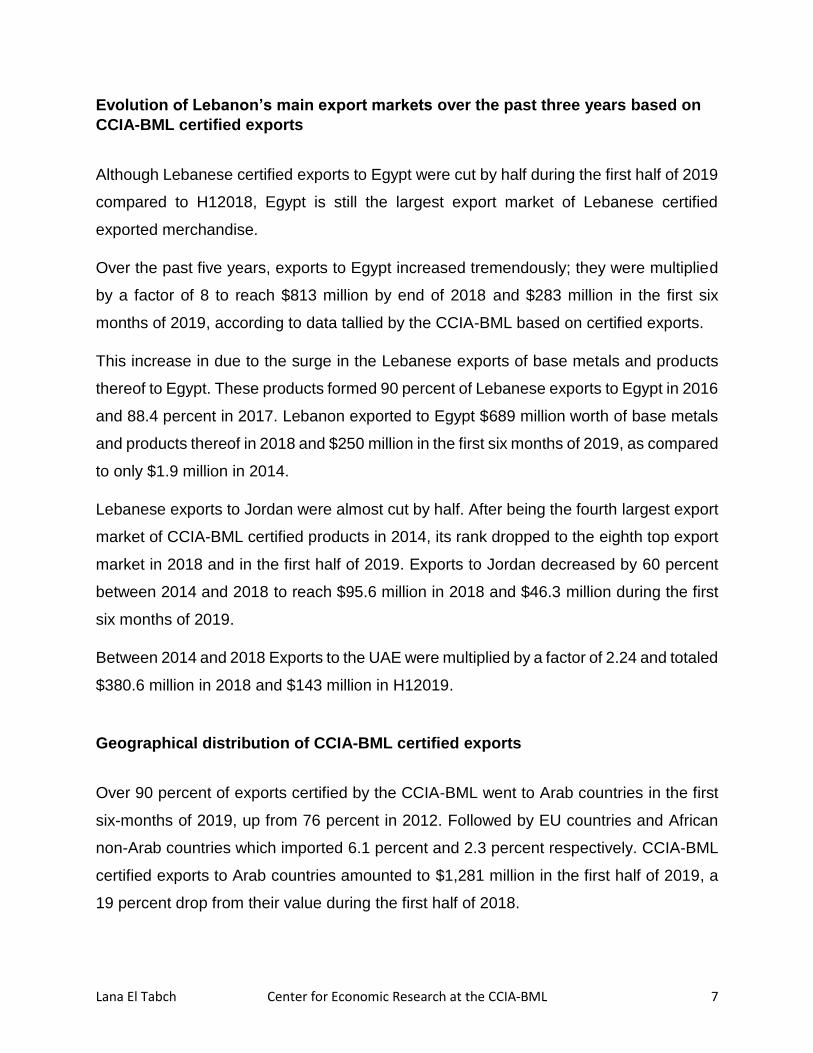
Evolution of Lebanon’s main export markets over the past three years based on
CCIA-BML certified exports
Although Lebanese certified exports to Egypt were cut by half during the first half of 2019
compared to H12018, Egypt is still the largest export market of Lebanese certified
exported merchandise.
Over the past five years, exports to Egypt increased tremendously; they were multiplied
by a factor of 8 to reach $813 million by end of 2018 and $283 million in the first six
months of 2019, according to data tallied by the CCIA-BML based on certified exports.
This increase in due to the surge in the Lebanese exports of base metals and products
thereof to Egypt. These products formed 90 percent of Lebanese exports to Egypt in 2016
and 88.4 percent in 2017. Lebanon exported to Egypt $689 million worth of base metals
and products thereof in 2018 and $250 million in the first six months of 2019, as compared
to only $1.9 million in 2014.
Lebanese exports to Jordan were almost cut by half. After being the fourth largest export
market of CCIA-BML certified products in 2014, its rank dropped to the eighth top export
market in 2018 and in the first half of 2019. Exports to Jordan decreased by 60 percent
between 2014 and 2018 to reach $95.6 million in 2018 and $46.3 million during the first
six months of 2019.
Between 2014 and 2018 Exports to the UAE were multiplied by a factor of 2.24 and totaled
$380.6 million in 2018 and $143 million in H12019.
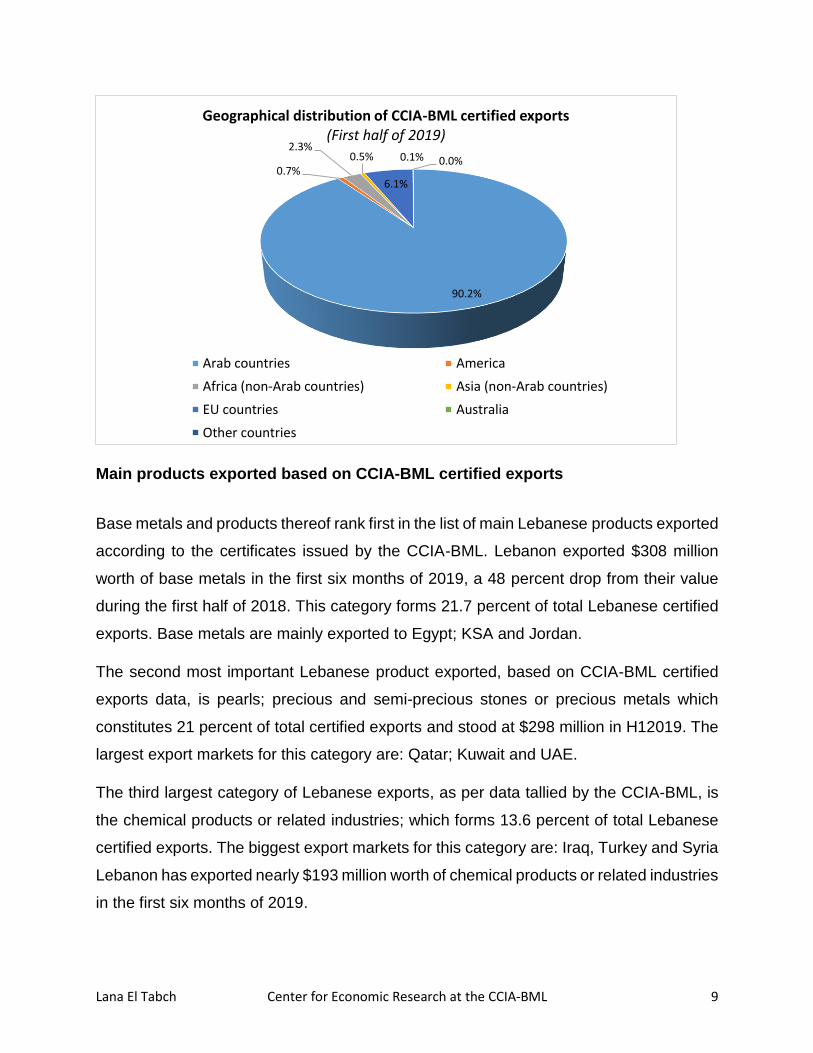
Geographical distribution of CCIA-BML certified exports
Over 90 percent of exports certified by the CCIA-BML went to Arab countries in the first
six-months of 2019, up from 76 percent in 2012. Followed by EU countries and African
non-Arab countries which imported 6.1 percent and 2.3 percent respectively. CCIA-BML
certified exports to Arab countries amounted to $1,281 million in the first half of 2019, a
19 percent drop from their value during the first half of 2018.
Lana El Tabch Center for Economic Research at the CCIA-BML 8
This geographical distribution of imports has been sustained over the past decade due to
the nature of Lebanese products that cater better to the demand of Arab markets, and to
the lack of compliance of Lebanese products to international norms and specifications
which hinders their access to more demanding markets such as the EU countries and the
US.
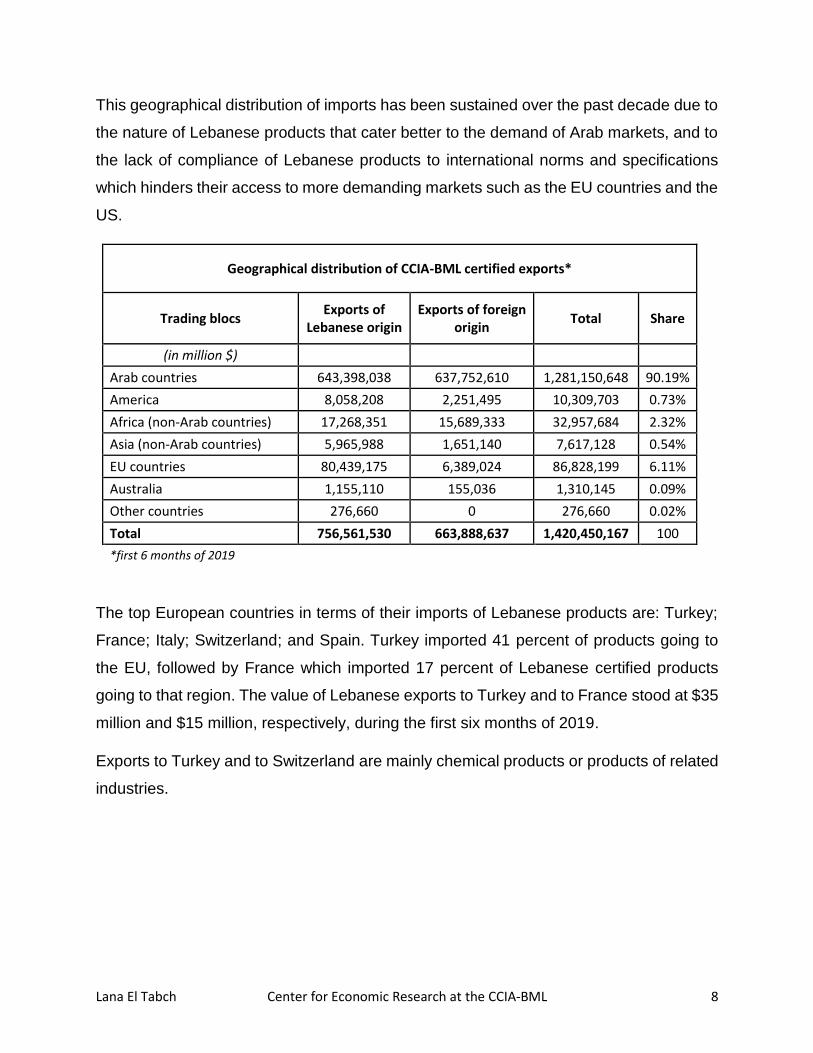
Geographical distribution of CCIA-BML certified exports*
Trading blocs Exports of
Lebanese origin Exports of foreign
origin Total Share
(in million $)
Arab countries 643,398,038 637,752,610 1,281,150,648 90.19%
America 8,058,208 2,251,495 10,309,703 0.73%
Africa (non-Arab countries) 17,268,351 15,689,333 32,957,684 2.32%
Asia (non-Arab countries) 5,965,988 1,651,140 7,617,128 0.54%
EU countries 80,439,175 6,389,024 86,828,199 6.11%
Australia 1,155,110 155,036 1,310,145 0.09%
Other countries 276,660 0 276,660 0.02%
Total 756,561,530 663,888,637 1,420,450,167 100
*first 6 months of 2019
The top European countries in terms of their imports of Lebanese products are: Turkey;
France; Italy; Switzerland; and Spain. Turkey imported 41 percent of products going to
the EU, followed by France which imported 17 percent of Lebanese certified products
going to that region. The value of Lebanese exports to Turkey and to France stood at $35
million and $15 million, respectively, during the first six months of 2019.
Exports to Turkey and to Switzerland are mainly chemical products or products of related
industries.
Lana El Tabch Center for Economic Research at the CCIA-BML 9
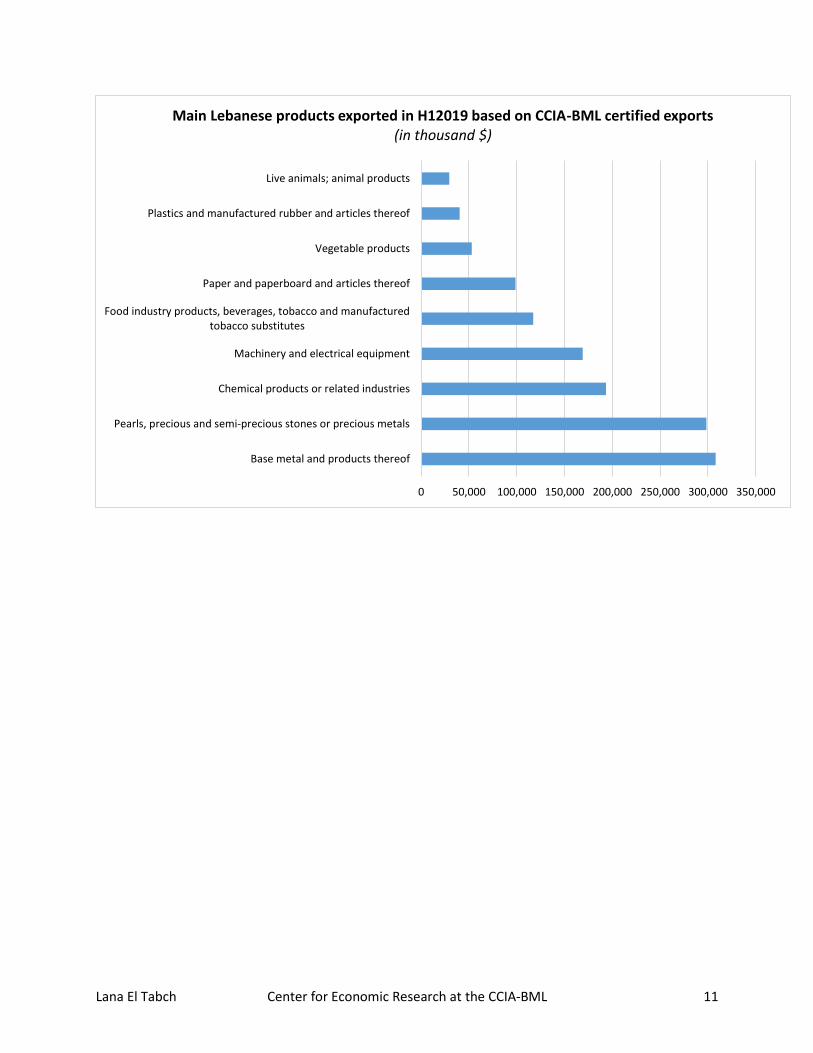
Main products exported based on CCIA-BML certified exports
Base metals and products thereof rank first in the list of main Lebanese products exported
according to the certificates issued by the CCIA-BML. Lebanon exported $308 million
worth of base metals in the first six months of 2019, a 48 percent drop from their value
during the first half of 2018. This category forms 21.7 percent of total Lebanese certified
exports. Base metals are mainly exported to Egypt; KSA and Jordan.
The second most important Lebanese product exported, based on CCIA-BML certified
exports data, is pearls; precious and semi-precious stones or precious metals which
constitutes 21 percent of total certified exports and stood at $298 million in H12019. The
largest export markets for this category are: Qatar; Kuwait and UAE.
The third largest category of Lebanese exports, as per data tallied by the CCIA-BML, is
the chemical products or related industries; which forms 13.6 percent of total Lebanese
certified exports. The biggest export markets for this category are: Iraq, Turkey and Syria
Lebanon has exported nearly $193 million worth of chemical products or related industries
in the first six months of 2019.
90.2%
0.7%
2.3%0.5%
6.1%
0.1% 0.0%
Geographical distribution of CCIA-BML certified exports(First half of 2019)
Arab countries America
Africa (non-Arab countries) Asia (non-Arab countries)
EU countries Australia
Other countries
Lana El Tabch Center for Economic Research at the CCIA-BML 10
Machinery and electrical equipment is the fourth largest category of Lebanese exports
according to the CCIA-BML certified exports; its share of total certified exports is 11.9
percent and its value has reached almost $169 million by end of June 2019. Export
markets of this category are: Syria, Iraq and UAE.
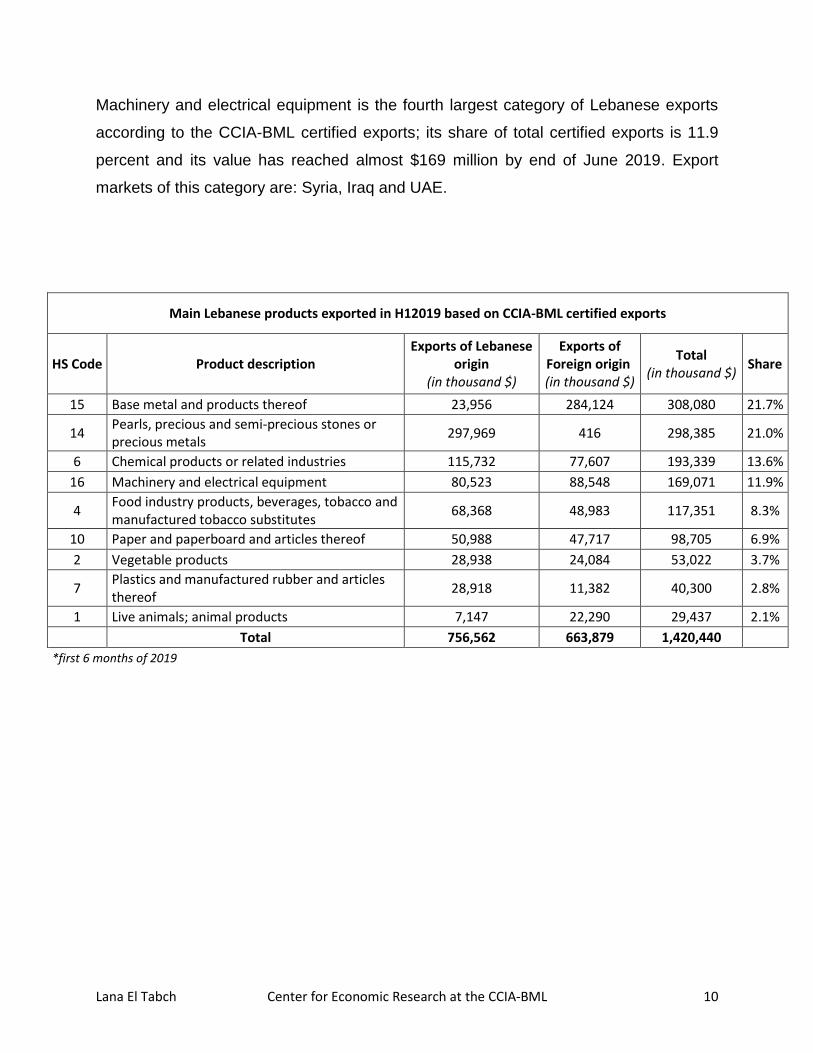
Main Lebanese products exported in H12019 based on CCIA-BML certified exports
HS Code Product description Exports of Lebanese
origin (in thousand $)
Exports of Foreign origin (in thousand $)
Total (in thousand $)
Share
15 Base metal and products thereof 23,956 284,124 308,080 21.7%
14 Pearls, precious and semi-precious stones or precious metals
297,969 416 298,385 21.0%
6 Chemical products or related industries 115,732 77,607 193,339 13.6%
16 Machinery and electrical equipment 80,523 88,548 169,071 11.9%
4 Food industry products, beverages, tobacco and manufactured tobacco substitutes
68,368 48,983 117,351 8.3%
10 Paper and paperboard and articles thereof 50,988 47,717 98,705 6.9%
2 Vegetable products 28,938 24,084 53,022 3.7%
7 Plastics and manufactured rubber and articles thereof
28,918 11,382 40,300 2.8%
1 Live animals; animal products 7,147 22,290 29,437 2.1%
Total 756,562 663,879 1,420,440
*first 6 months of 2019
Lana El Tabch Center for Economic Research at the CCIA-BML 11
0 50,000 100,000 150,000 200,000 250,000 300,000 350,000
Base metal and products thereof
Pearls, precious and semi-precious stones or precious metals
Chemical products or related industries
Machinery and electrical equipment
Food industry products, beverages, tobacco and manufacturedtobacco substitutes
Paper and paperboard and articles thereof
Vegetable products
Plastics and manufactured rubber and articles thereof
Live animals; animal products
Main Lebanese products exported in H12019 based on CCIA-BML certified exports(in thousand $)
Top Related