


Languages
Pages
Legal


September 14, 2016
Barclays 2016 Global Financial Services Conference
22
This presentation, other written or oral communications and our public documents to which we refer contain or incorporate by reference
certain forward-looking statements which are based on various assumptions (some of which are beyond our control) and may be identified by
reference to a future period or periods or by the use of forward-looking terminology, such as "may," "will," "believe," "expect," "anticipate,"
"continue," or similar terms or variations on those terms or the negative of those terms. Actual results could differ materially from those set
forth in forward-looking statements due to a variety of factors, including, but not limited to, changes in interest rates; changes in the yield
curve; changes in prepayment rates; the availability of mortgage-backed securities and other securities for purchase; the availability of financing
and, if available, the terms of any financings; changes in the market value of our assets; changes in business conditions and the general
economy; our ability to grow our commercial business; our ability to grow our residential mortgage credit business; credit risks related to our
investments in credit risk transfer securities, residential mortgage-backed securities and related residential mortgage credit assets, commercial
real estate assets and corporate debt; risks related to investments in mortgage servicing rights and ownership of a servicer; any potential
business disruption following the acquisition of Hatteras Financial Corp.; our ability to consummate any contemplated investment
opportunities; changes in government regulations affecting our business; our ability to maintain our qualification as a REIT; and our ability to
maintain our exemption from registration under the Investment Company Act of 1940, as amended. For a discussion of the risks and
uncertainties which could cause actual results to differ from those contained in the forward-looking statements, see "Risk Factors" in our most
recent Annual Report on Form 10-K and any subsequent Quarterly Reports on Form 10-Q. We do not undertake, and specifically disclaim any
obligation, to publicly release the result of any revisions which may be made to any forward-looking statements to reflect the occurrence of
anticipated or unanticipated events or circumstances after the date of such statements, except as required by law.
This presentation includes unaudited pro forma information reflecting the acquisition of Hatteras Financial Corp. The unaudited pro forma
information should be read in conjunction with the historical financial information and accompanying notes of Annaly Capital Management,
Inc. and Hatteras Financial Corp.
Non-GAAP Financial Measures
This presentation includes certain non-GAAP financial measures. The non-GAAP financial measures should not be viewed in isolation and are
not a substitute for financial measures computed in accordance with GAAP. Please see the section entitled “Non-GAAP Reconciliations” in the
attached Appendix for a reconciliation to the most directly comparable GAAP financial measures.
Safe Harbor Notice
33
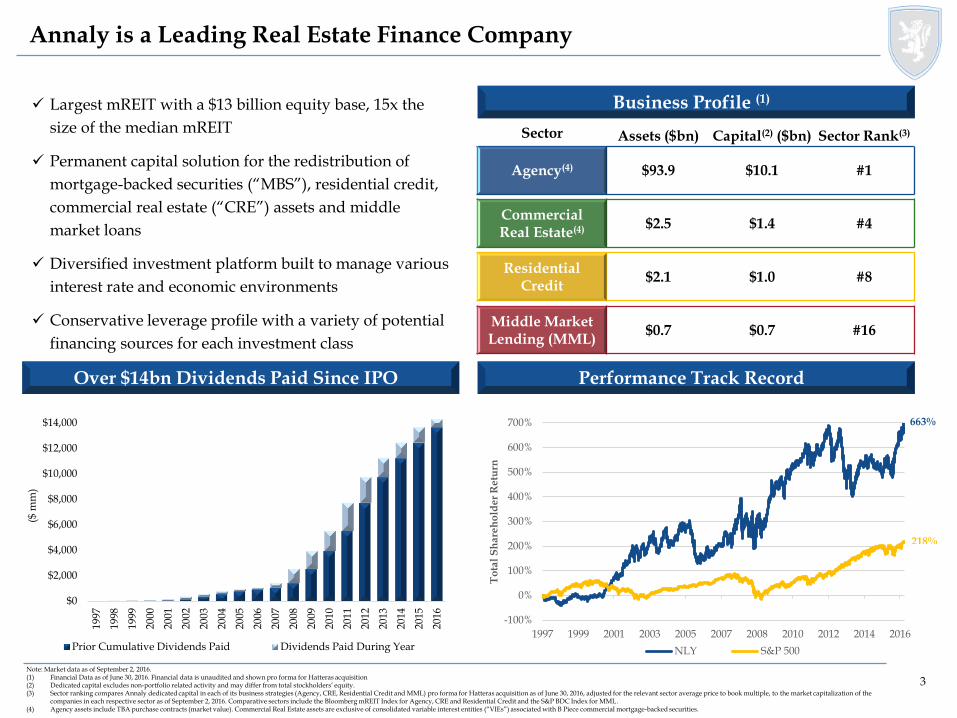
Sector Assets ($bn) Capital(2) ($bn) Sector Rank(3)
Agency(4) $93.9 $10.1 #1
Commercial Real Estate(4) $2.5 $1.4 #4
Residential Credit
$2.1 $1.0 #8
Middle MarketLending (MML)
$0.7 $0.7 #16
Over $14bn Dividends Paid Since IPO Performance Track Record
Annaly is a Leading Real Estate Finance Company
Largest mREIT with a $13 billion equity base, 15x the
size of the median mREIT
Permanent capital solution for the redistribution of
mortgage-backed securities (“MBS”), residential credit,
commercial real estate (“CRE”) assets and middle
market loans
Diversified investment platform built to manage various
interest rate and economic environments
Conservative leverage profile with a variety of potential
financing sources for each investment class
Business Profile (1)
Note: Market data as of September 2, 2016. (1) Financial Data as of June 30, 2016. Financial data is unaudited and shown pro forma for Hatteras acquisition(2) Dedicated capital excludes non-portfolio related activity and may differ from total stockholders’ equity.(3) Sector ranking compares Annaly dedicated capital in each of its business strategies (Agency, CRE, Residential Credit and MML) pro forma for Hatteras acquisition as of June 30, 2016, adjusted for the relevant sector average price to book multiple, to the market capitalization of the
companies in each respective sector as of September 2, 2016. Comparative sectors include the Bloomberg mREIT Index for Agency, CRE and Residential Credit and the S&P BDC Index for MML.(4) Agency assets include TBA purchase contracts (market value). Commercial Real Estate assets are exclusive of consolidated variable interest entities (“VIEs”) associated with B Piece commercial mortgage-backed securities.
-100%
0%
100%
200%
300%
400%
500%
600%
700%
1997 1999 2001 2003 2005 2007 2008 2010 2012 2014 2016
To
tal
Sh
are
ho
lde
r R
etu
rn
NLY S&P 500
663%
218%
$0
$2,000
$4,000
$6,000
$8,000
$10,000
$12,000
$14,000
1997
1998
1999
2000
2001
2002
2003
2004
2005
2006
2007
2008
2009
2010
2011
2012
2013
2014
2015
2016
($ m
m)
Prior Cumulative Dividends Paid Dividends Paid During Year
44
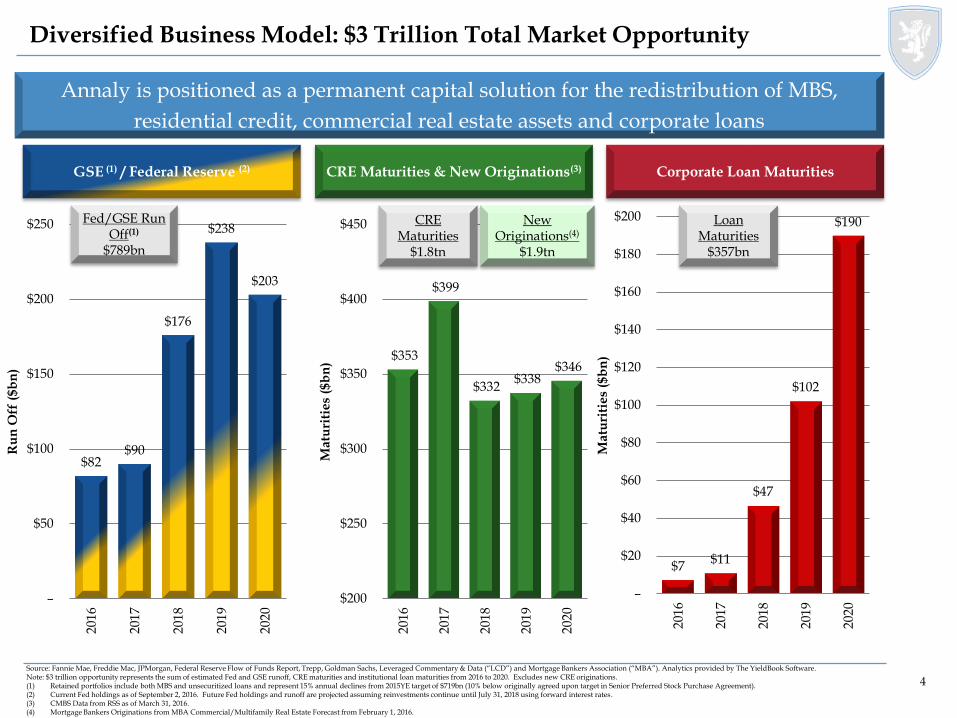
$82 $90
$176
$238
$203
–
$50
$100
$150
$200
$250
201
6
201
7
201
8
201
9
202
0
Ru
n O
ff (
$b
n)
$353
$399
$332 $338
$346
$200
$250
$300
$350
$400
$450
201
6
2017
201
8
201
9
202
0
Ma
turi
tie
s ($
bn
)
$7 $11
$47
$102
$190
–
$20
$40
$60
$80
$100
$120
$140
$160
$180
$200
201
6
201
7
201
8
201
9
202
0
Ma
turi
tie
s ($
bn
)
Diversified Business Model: $3 Trillion Total Market Opportunity
Annaly is positioned as a permanent capital solution for the redistribution of MBS,
residential credit, commercial real estate assets and corporate loans
Corporate Loan Maturities
Source: Fannie Mae, Freddie Mac, JPMorgan, Federal Reserve Flow of Funds Report, Trepp, Goldman Sachs, Leveraged Commentary & Data (“LCD”) and Mortgage Bankers Association (“MBA”). Analytics provided by The YieldBook Software. Note: $3 trillion opportunity represents the sum of estimated Fed and GSE runoff, CRE maturities and institutional loan maturities from 2016 to 2020. Excludes new CRE originations.(1) Retained portfolios include both MBS and unsecuritized loans and represent 15% annual declines from 2015YE target of $719bn (10% below originally agreed upon target in Senior Preferred Stock Purchase Agreement).(2) Current Fed holdings as of September 2, 2016. Future Fed holdings and runoff are projected assuming reinvestments continue until July 31, 2018 using forward interest rates.(3) CMBS Data from RSS as of March 31, 2016.(4) Mortgage Bankers Originations from MBA Commercial/Multifamily Real Estate Forecast from February 1, 2016.
CRE Maturities & New Originations(3)
CRE Maturities
$1.8tn
New Originations(4)
$1.9tn
Loan Maturities
$357bn
GSE (1) / Federal Reserve (2)
Fed/GSE Run Off(1)
$789bn
55
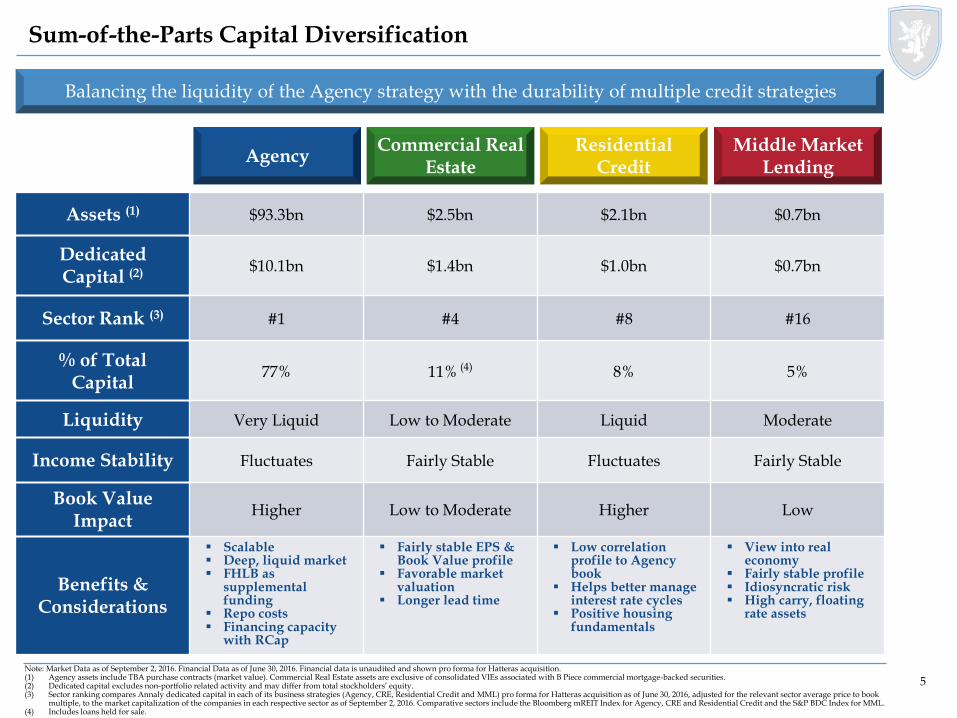
Balancing the liquidity of the Agency strategy with the durability of multiple credit strategies
Sum-of-the-Parts Capital Diversification
AgencyResidential
CreditCommercial Real
EstateMiddle Market
Lending
Assets (1) $93.3bn $2.5bn $2.1bn $0.7bn
Dedicated Capital (2) $10.1bn $1.4bn $1.0bn $0.7bn
Sector Rank (3) #1 #4 #8 #16
% of Total Capital
77% 11% (4) 8% 5%
Liquidity Very Liquid Low to Moderate Liquid Moderate
Income Stability Fluctuates Fairly Stable Fluctuates Fairly Stable
Book ValueImpact
Higher Low to Moderate Higher Low
Benefits &Considerations
Scalable Deep, liquid market FHLB as
supplemental funding
Repo costs Financing capacity
with RCap
Fairly stable EPS & Book Value profile
Favorable market valuation
Longer lead time
Low correlation profile to Agency book
Helps better manage interest rate cycles
Positive housing fundamentals
View into real economy
Fairly stable profile Idiosyncratic risk High carry, floating
rate assets
Note: Market Data as of September 2, 2016. Financial Data as of June 30, 2016. Financial data is unaudited and shown pro forma for Hatteras acquisition.(1) Agency assets include TBA purchase contracts (market value). Commercial Real Estate assets are exclusive of consolidated VIEs associated with B Piece commercial mortgage-backed securities.(2) Dedicated capital excludes non-portfolio related activity and may differ from total stockholders’ equity.(3) Sector ranking compares Annaly dedicated capital in each of its business strategies (Agency, CRE, Residential Credit and MML) pro forma for Hatteras acquisition as of June 30, 2016, adjusted for the relevant sector average price to book
multiple, to the market capitalization of the companies in each respective sector as of September 2, 2016. Comparative sectors include the Bloomberg mREIT Index for Agency, CRE and Residential Credit and the S&P BDC Index for MML.(4) Includes loans held for sale.
66
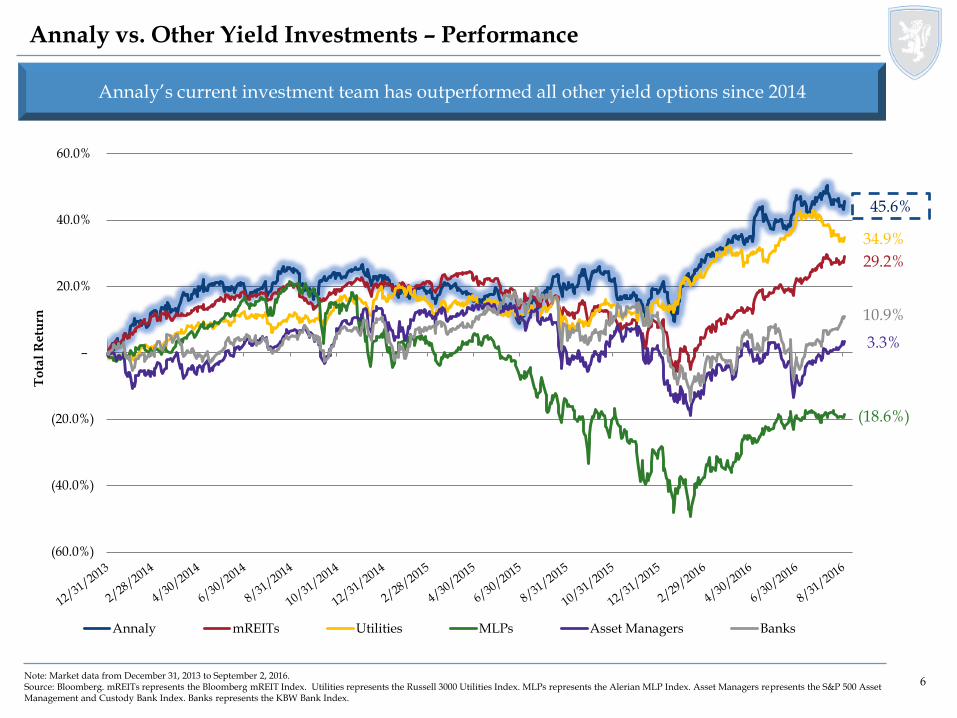
Annaly vs. Other Yield Investments – Performance
Note: Market data from December 31, 2013 to September 2, 2016.Source: Bloomberg. mREITs represents the Bloomberg mREIT Index. Utilities represents the Russell 3000 Utilities Index. MLPs represents the Alerian MLP Index. Asset Managers represents the S&P 500 Asset Management and Custody Bank Index. Banks represents the KBW Bank Index.
Annaly’s current investment team has outperformed all other yield options since 2014
45.6%
34.9%
29.2%
(18.6%)
10.9%
3.3%
(60.0%)
(40.0%)
(20.0%)
–
20.0%
40.0%
60.0%
To
tal
Re
turn
Annaly mREITs Utilities MLPs Asset Managers Banks
77
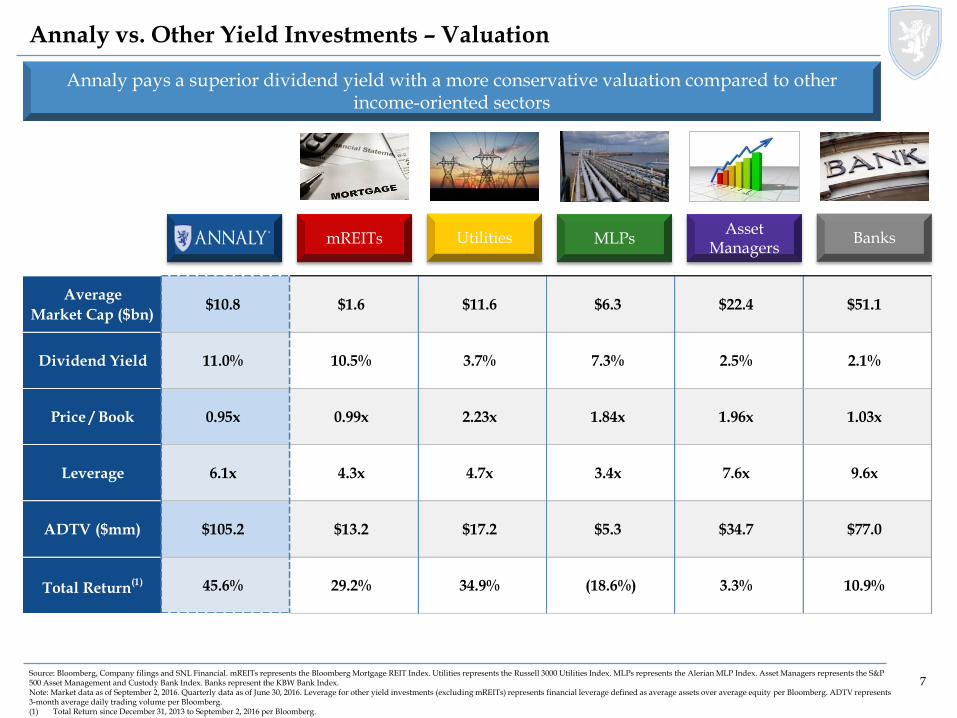
Annaly vs. Other Yield Investments – Valuation
Annaly pays a superior dividend yield with a more conservative valuation compared to other income-oriented sectors
Source: Bloomberg, Company filings and SNL Financial. mREITs represents the Bloomberg Mortgage REIT Index. Utilities represents the Russell 3000 Utilities Index. MLPs represents the Alerian MLP Index. Asset Managers represents the S&P 500 Asset Management and Custody Bank Index. Banks represent the KBW Bank Index.Note: Market data as of September 2, 2016. Quarterly data as of June 30, 2016. Leverage for other yield investments (excluding mREITs) represents financial leverage defined as average assets over average equity per Bloomberg. ADTV represents 3-month average daily trading volume per Bloomberg.(1) Total Return since December 31, 2013 to September 2, 2016 per Bloomberg.
Utilities MLPsAsset
ManagersBanksmREITs
Average
Market Cap ($bn)$10.8 $1.6 $11.6 $6.3 $22.4 $51.1
Dividend Yield 11.0% 10.5% 3.7% 7.3% 2.5% 2.1%
Price / Book 0.95x 0.99x 2.23x 1.84x 1.96x 1.03x
Leverage 6.1x 4.3x 4.7x 3.4x 7.6x 9.6x
ADTV ($mm) $105.2 $13.2 $17.2 $5.3 $34.7 $77.0
Total Return(1) 45.6% 29.2% 34.9% (18.6%) 3.3% 10.9%
88
-100
0
100
200
300
400
500
600
700
800
0
10
20
30
40
50
60
70
80
90
Oct-97 Jan-99 Apr-00 Jul-01 Oct-02 Jan-04 Apr-05 Jul-06 Oct-07 Jan-09 Apr-10 Jul-11 Oct-12 Jan-14 Apr-15 Jul-16
To
tal
Re
turn
VIX
In
de
x
VIX NLY S&P
Recession
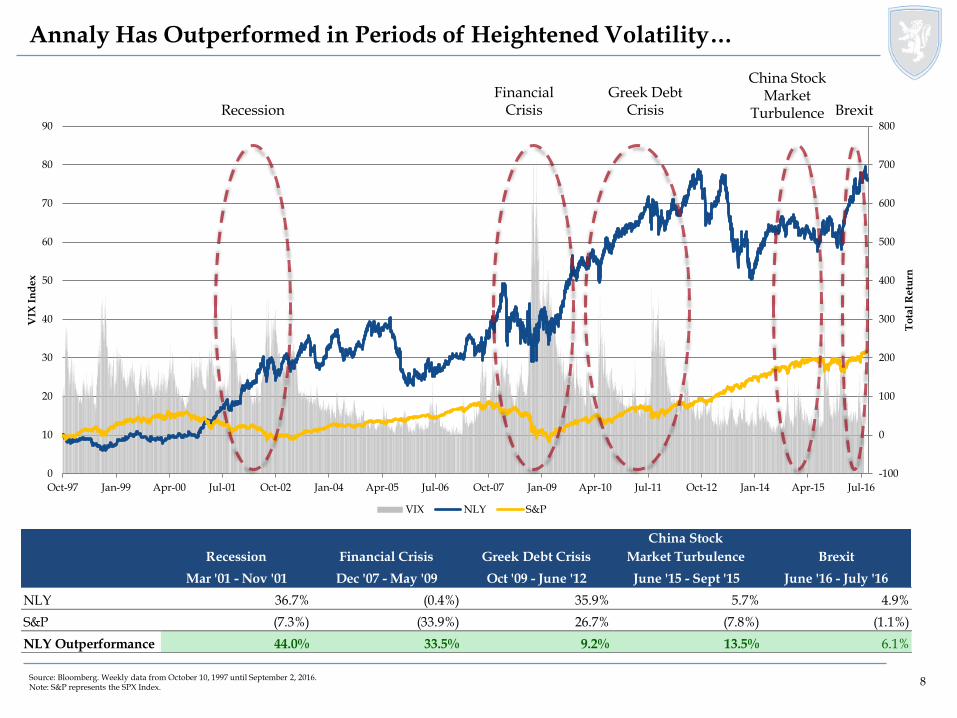
Annaly Has Outperformed in Periods of Heightened Volatility…
Source: Bloomberg. Weekly data from October 10, 1997 until September 2, 2016.Note: S&P represents the SPX Index.
BrexitFinancial
CrisisGreek Debt
Crisis
Recession Financial Crisis Greek Debt Crisis
China Stock
Market Turbulence Brexit
Mar '01 - Nov '01 Dec '07 - May '09 Oct '09 - June '12 June '15 - Sept '15 June '16 - July '16
NLY 36.7% (0.4%) 35.9% 5.7% 4.9%
S&P (7.3%) (33.9%) 26.7% (7.8%) (1.1%)
NLY Outperformance 44.0% 33.5% 9.2% 13.5% 6.1%
China Stock Market
Turbulence
99
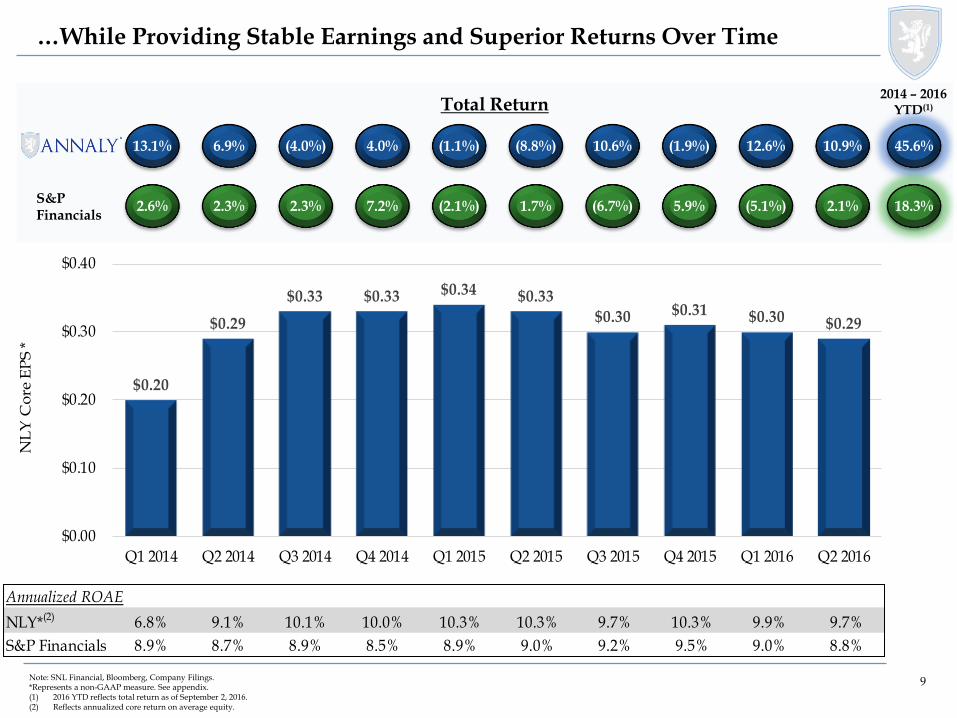
…While Providing Stable Earnings and Superior Returns Over Time
Note: SNL Financial, Bloomberg, Company Filings. *Represents a non-GAAP measure. See appendix.(1) 2016 YTD reflects total return as of September 2, 2016. (2) Reflects annualized core return on average equity.
Annualized ROAE
NLY*(2) 6.8% 9.1% 10.1% 10.0% 10.3% 10.3% 9.7% 10.3% 9.9% 9.7%
S&P Financials 8.9% 8.7% 8.9% 8.5% 8.9% 9.0% 9.2% 9.5% 9.0% 8.8%
$0.20
$0.29
$0.33 $0.33 $0.34 $0.33
$0.30 $0.31 $0.30 $0.29
$0.00
$0.10
$0.20
$0.30
$0.40
Q1 2014 Q2 2014 Q3 2014 Q4 2014 Q1 2015 Q2 2015 Q3 2015 Q4 2015 Q1 2016 Q2 2016
NL
Y C
ore
EP
S *
2014 – 2016 YTD(1)
13.1%
2.6%
6.9%
2.3%
(4.0%)
2.3%
4.0%
7.2%
(1.1%)
(2.1%)
(8.8%)
1.7%
10.6%
(6.7%)
(1.9%)
5.9%
12.6%
(5.1%)
45.6%
18.3%
Total Return
S&P Financials
10.9%
2.1%

1010
2012 2013 2014 2015 2016E (1) Average
1.45% 1.66% 1.61% 1.58% 1.67% 1.60%
Internal Management 2.72% 3.83% 4.13% 3.84% 3.07% 3.52%
External Management 2.20% 3.06% 3.57% 3.75% 3.71% 3.26%
2012 2013 2014 2015 2016E (1) Average
0.19% 0.22% 0.24% 0.25% 0.25% 0.23%
Internal Management 0.54% 0.91% 0.87% 0.73% 0.86% 0.78%
External Management 0.60% 0.66% 0.75% 0.79% 0.64% 0.69%
Op
Ex
as
% o
f
Av
g A
sset
s
Op
Ex
as
% o
f
Av
g E
qu
ity
From 2012 through annualized 1H 2016, Annaly significantly outperformed its mREIT peers with respect to operating expenditures as a percentage of equity and as a percentage of assets
Annaly’s average expense levels over the period were 49% lower as a percentage of average equity and 65% lower as a percentage of average assets
Annaly expense levels averaged 1.60% as a percentage of equity and 0.23% as a percentage of assets, while mREIT peers averaged 3.30% and 0.71%, respectively
Efficiency of Operating Model
Source: Company Filings, SNL and Bloomberg. Averages are market weighted based on market capitalization as of December 31st of each respective year, except 2016E which is as of September 12, 2016.Note: Internal Management and External Management represent the respective internally- and externally-managed members of the BBREMTG Index with market capitalization above $200mm as of the corresponding year end. Excludes Annaly and companies during years in which they became public or first listed. Operating Expense is defined as: (i) for Internally-Managed Peers, the sum of compensation & benefits, general & administrative expenses and other operating expenses, and (ii) for Externally-Managed Peers, the sum of net management fees, compensation & benefits (if any), general & administrative expenses and other operating expenses.(1) 2016E represents annualized operating expenses as of 1H 2016. Average Equity and Average Assets are as of June 30, 2016.
Annaly outperforms internally and externally managed mREITs
1111
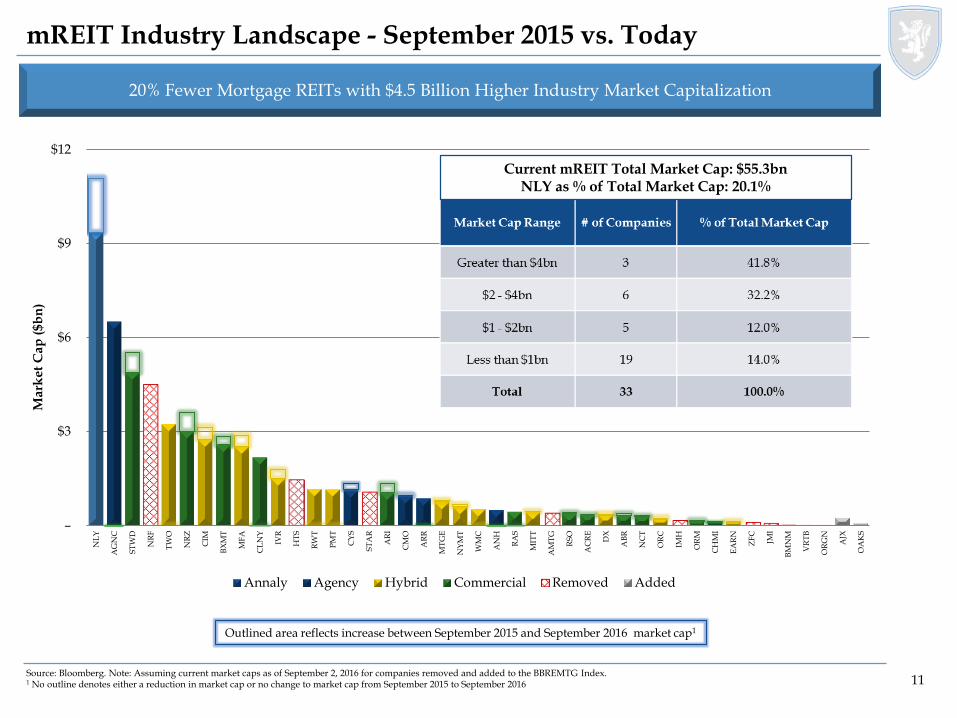
mREIT Industry Landscape - September 2015 vs. Today
Source: Bloomberg. Note: Assuming current market caps as of September 2, 2016 for companies removed and added to the BBREMTG Index.1 No outline denotes either a reduction in market cap or no change to market cap from September 2015 to September 2016
20% Fewer Mortgage REITs with $4.5 Billion Higher Industry Market Capitalization
Outlined area reflects increase between September 2015 and September 2016 market cap1
–
$3
$6
$9
$12
NL
Y
AG
NC
ST
WD
NR
F
TW
O
NR
Z
CIM
BX
MT
MF
A
CL
NY
IVR
HT
S
RW
T
PM
T
CY
S
ST
AR
AR
I
CM
O
AR
R
MT
GE
NY
MT
WM
C
AN
H
RA
S
MIT
T
AM
TG
RS
O
AC
RE
DX
AB
R
NC
T
OR
C
IMH
OR
M
CH
MI
EA
RN
ZF
C
JMI
BM
NM
VR
TB
OR
GN
AJX
OA
KS
Ma
rke
t C
ap
($
bn
)
Annaly Agency Hybrid Commercial Removed Added
Current mREIT Total Market Cap: $55.3bnNLY as % of Total Market Cap: 20.1%
1212
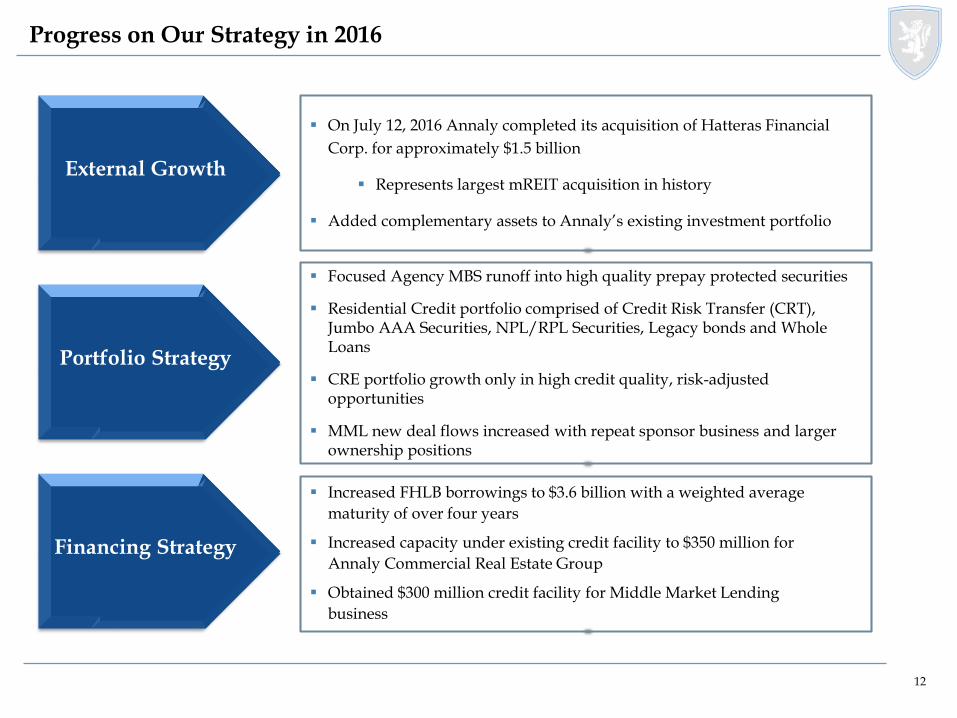
Progress on Our Strategy in 2016
On July 12, 2016 Annaly completed its acquisition of Hatteras Financial
Corp. for approximately $1.5 billion
Represents largest mREIT acquisition in history
Added complementary assets to Annaly’s existing investment portfolio
External Growth
Focused Agency MBS runoff into high quality prepay protected securities
Residential Credit portfolio comprised of Credit Risk Transfer (CRT), Jumbo AAA Securities, NPL/RPL Securities, Legacy bonds and Whole Loans
CRE portfolio growth only in high credit quality, risk-adjusted opportunities
MML new deal flows increased with repeat sponsor business and larger ownership positions
Increased FHLB borrowings to $3.6 billion with a weighted average
maturity of over four years
Increased capacity under existing credit facility to $350 million for
Annaly Commercial Real Estate Group
Obtained $300 million credit facility for Middle Market Lending
business
Financing Strategy
Portfolio Strategy
1313
Pass Through Coupon Type
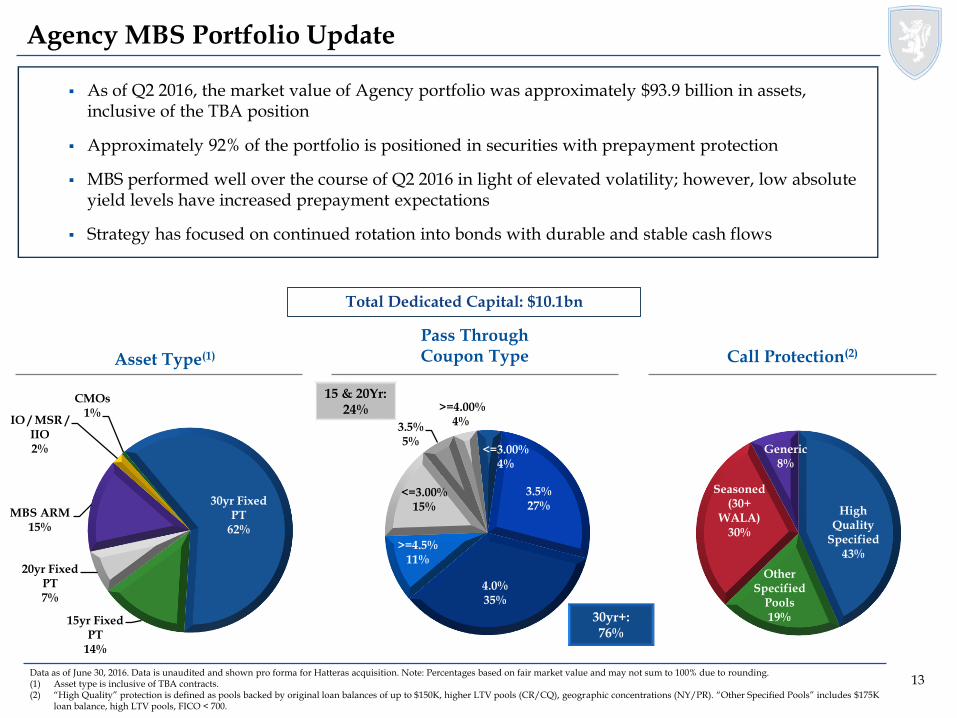
Agency MBS Portfolio Update
Data as of June 30, 2016. Data is unaudited and shown pro forma for Hatteras acquisition. Note: Percentages based on fair market value and may not sum to 100% due to rounding. (1) Asset type is inclusive of TBA contracts.(2) “High Quality” protection is defined as pools backed by original loan balances of up to $150K, higher LTV pools (CR/CQ), geographic concentrations (NY/PR). “Other Specified Pools” includes $175K
loan balance, high LTV pools, FICO < 700.
As of Q2 2016, the market value of Agency portfolio was approximately $93.9 billion in assets, inclusive of the TBA position
Approximately 92% of the portfolio is positioned in securities with prepayment protection
MBS performed well over the course of Q2 2016 in light of elevated volatility; however, low absolute yield levels have increased prepayment expectations
Strategy has focused on continued rotation into bonds with durable and stable cash flows
Asset Type(1) Call Protection(2)
Total Dedicated Capital: $10.1bn
High Quality
Specified43%
Other Specified
Pools19%
Seasoned (30+
WALA)30%
Generic8%
<=3.00%4%
3.5% 27%
4.0% 35%
>=4.5%11%
<=3.00%15%
3.5% 5%
>=4.00%4%
15 & 20Yr: 24%
30yr+:76%
30yr Fixed PT
62%
15yr Fixed PT
14%
20yr Fixed PT7%
MBS ARM15%
IO / MSR / IIO2%
CMOs1%
1414
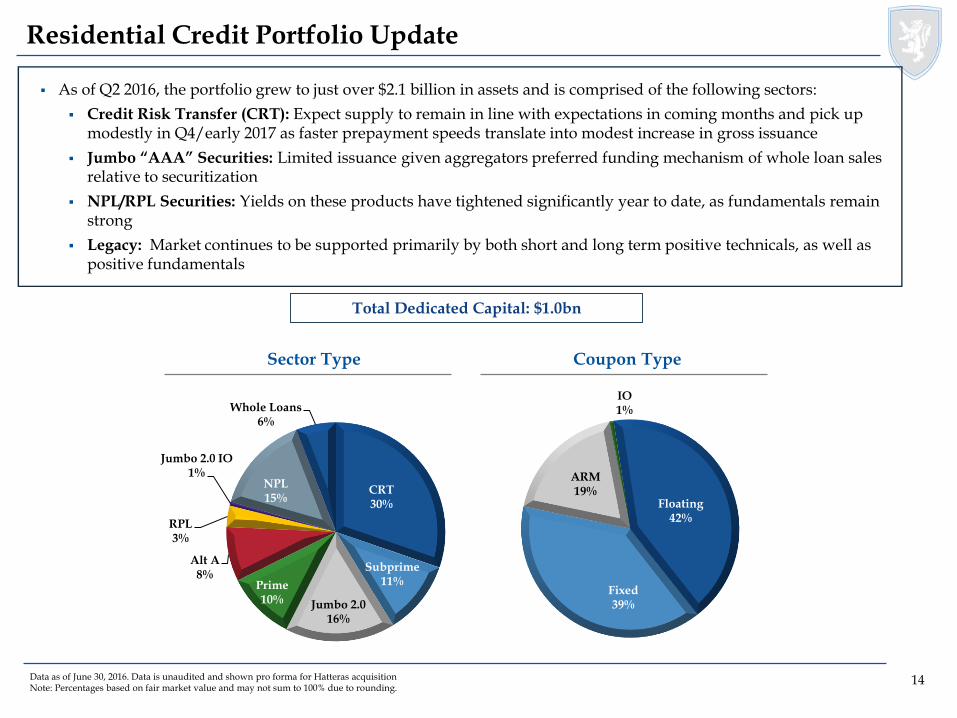
Residential Credit Portfolio Update
Data as of June 30, 2016. Data is unaudited and shown pro forma for Hatteras acquisitionNote: Percentages based on fair market value and may not sum to 100% due to rounding.
As of Q2 2016, the portfolio grew to just over $2.1 billion in assets and is comprised of the following sectors:
Credit Risk Transfer (CRT): Expect supply to remain in line with expectations in coming months and pick up modestly in Q4/early 2017 as faster prepayment speeds translate into modest increase in gross issuance
Jumbo “AAA” Securities: Limited issuance given aggregators preferred funding mechanism of whole loan sales relative to securitization
NPL/RPL Securities: Yields on these products have tightened significantly year to date, as fundamentals remain strong
Legacy: Market continues to be supported primarily by both short and long term positive technicals, as well as positive fundamentals
Sector Type Coupon Type
Total Dedicated Capital: $1.0bn
CRT30%
Subprime11%
Jumbo 2.016%
Prime10%
Alt A8%
RPL3%
Jumbo 2.0 IO1%
NPL15%
Whole Loans6%
Fixed39%
ARM19%
IO1%
Floating42%
1515
Commercial Real Estate Portfolio Update
Data as of June 30, 2016. Data is unaudited and shown pro forma for Hatteras acquisitionNote: Percentages based on economic interest and may not sum to 100% due to rounding. (1) Commercial Real Estate assets are exclusive of consolidated variable interest entities (“VIEs”) associated with B Piece commercial mortgage-backed securities.(2) Other includes 24 states, none of which represent more than 5% of total portfolio value.
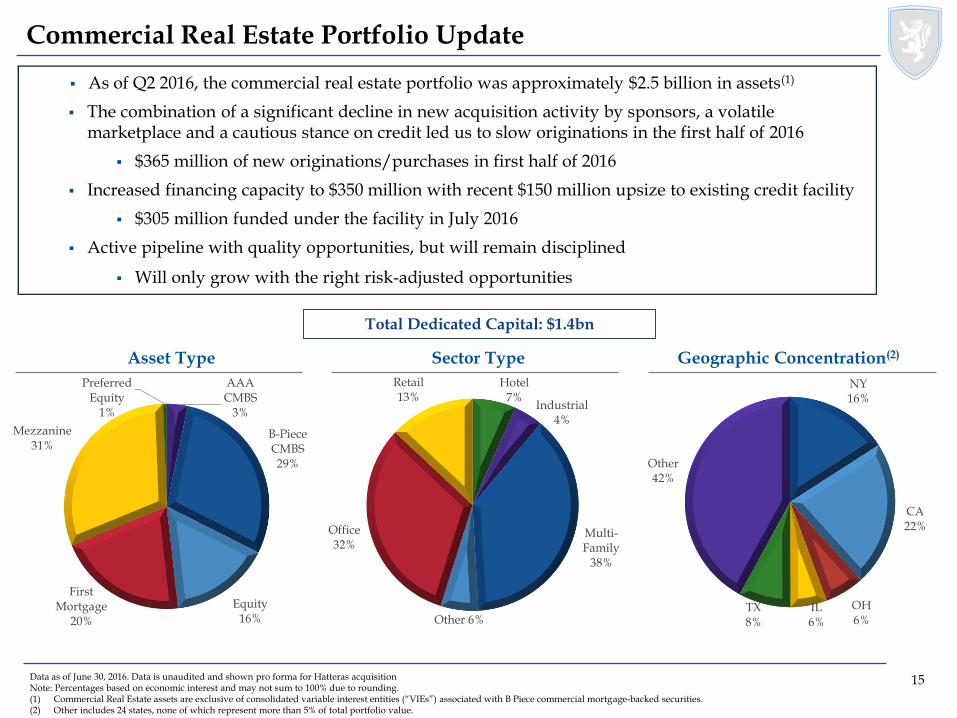
As of Q2 2016, the commercial real estate portfolio was approximately $2.5 billion in assets(1)
The combination of a significant decline in new acquisition activity by sponsors, a volatile marketplace and a cautious stance on credit led us to slow originations in the first half of 2016
$365 million of new originations/purchases in first half of 2016
Increased financing capacity to $350 million with recent $150 million upsize to existing credit facility
$305 million funded under the facility in July 2016
Active pipeline with quality opportunities, but will remain disciplined
Will only grow with the right risk-adjusted opportunities1.9 billion
Asset Type Sector Type Geographic Concentration(2)
Total Dedicated Capital: $1.4bn
AAA CMBS
3%
B-Piece CMBS29%
Equity16%
First Mortgage
20%
Mezzanine31%
Preferred Equity
1%
NY16%
CA22%
OH6%
IL6%
TX8%
Other42%
Hotel7%
Industrial4%
Multi-Family
38%
Other 6%
Office32%
Retail13%
1616
Middle Market Lending Portfolio Update
Lien Position Industry (1) Loan Size(2)
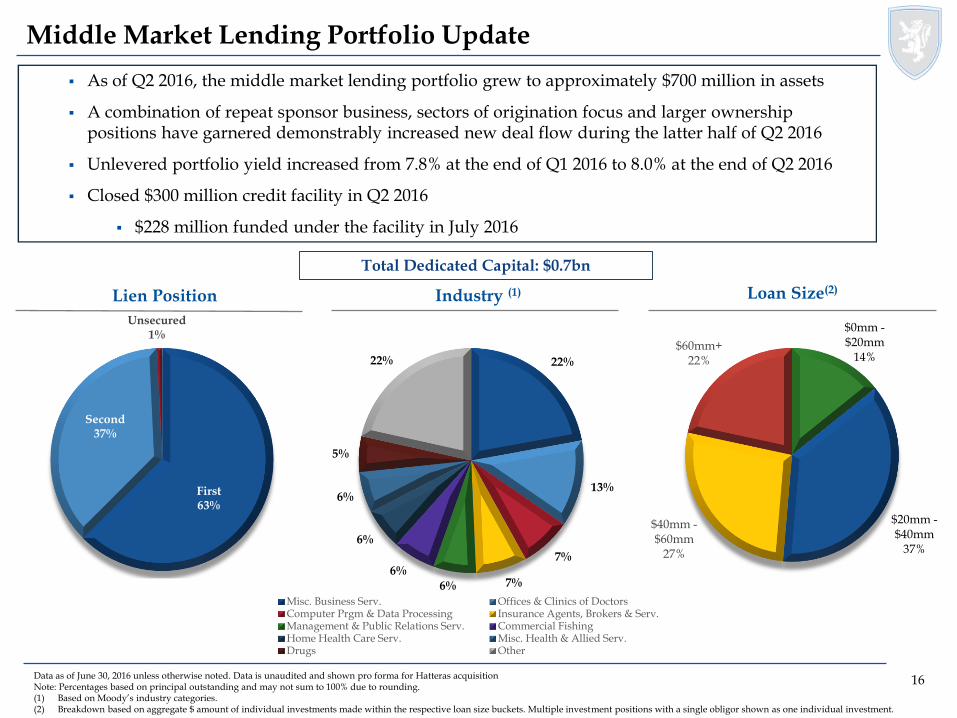
As of Q2 2016, the middle market lending portfolio grew to approximately $700 million in assets
A combination of repeat sponsor business, sectors of origination focus and larger ownership positions have garnered demonstrably increased new deal flow during the latter half of Q2 2016
Unlevered portfolio yield increased from 7.8% at the end of Q1 2016 to 8.0% at the end of Q2 2016
Closed $300 million credit facility in Q2 2016
$228 million funded under the facility in July 2016
Total Dedicated Capital: $0.7bn
Data as of June 30, 2016 unless otherwise noted. Data is unaudited and shown pro forma for Hatteras acquisitionNote: Percentages based on principal outstanding and may not sum to 100% due to rounding.(1) Based on Moody’s industry categories.(2) Breakdown based on aggregate $ amount of individual investments made within the respective loan size buckets. Multiple investment positions with a single obligor shown as one individual investment.
[ TBU ]
22%
13%
7%
7%6%
6%
6%
6%
5%
22%
Misc. Business Serv. Offices & Clinics of DoctorsComputer Prgm & Data Processing Insurance Agents, Brokers & Serv.Management & Public Relations Serv. Commercial FishingHome Health Care Serv. Misc. Health & Allied Serv.Drugs Other
First63%
Second37%
Unsecured1%
$0mm -$20mm
14%
$20mm -$40mm
37%
$40mm -$60mm
27%
$60mm+22%
1717
Transaction Overview
Source: SNL Financial, Company Websites, Company Filings and Wells Fargo as of time of announcement.(1) Excludes segment, portfolio or asset sales. Target assets exclude VIE assets.
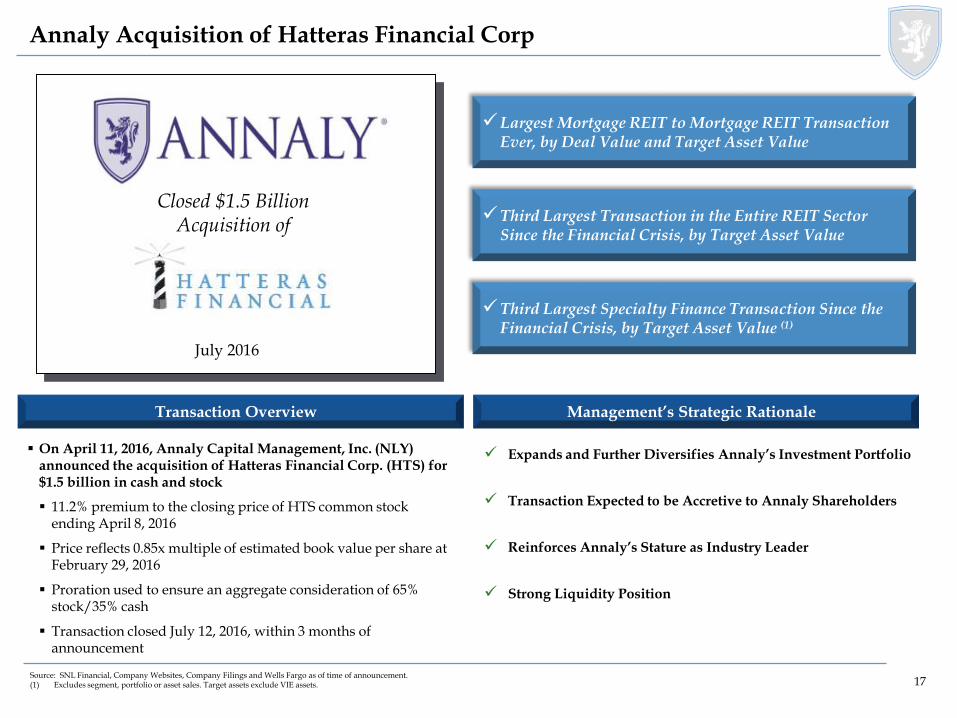
On April 11, 2016, Annaly Capital Management, Inc. (NLY) announced the acquisition of Hatteras Financial Corp. (HTS) for $1.5 billion in cash and stock
11.2% premium to the closing price of HTS common stock ending April 8, 2016
Price reflects 0.85x multiple of estimated book value per share at February 29, 2016
Proration used to ensure an aggregate consideration of 65% stock/35% cash
Transaction closed July 12, 2016, within 3 months of announcement
Management’s Strategic Rationale
Expands and Further Diversifies Annaly’s Investment Portfolio
Transaction Expected to be Accretive to Annaly Shareholders
Reinforces Annaly’s Stature as Industry Leader
Strong Liquidity Position
Closed $1.5 Billion Acquisition of
July 2016
Annaly Acquisition of Hatteras Financial Corp
Largest Mortgage REIT to Mortgage REIT Transaction Ever, by Deal Value and Target Asset Value
Third Largest Transaction in the Entire REIT Sector Since the Financial Crisis, by Target Asset Value
Third Largest Specialty Finance Transaction Since the Financial Crisis, by Target Asset Value (1)
1818
Significant Financing Advantages
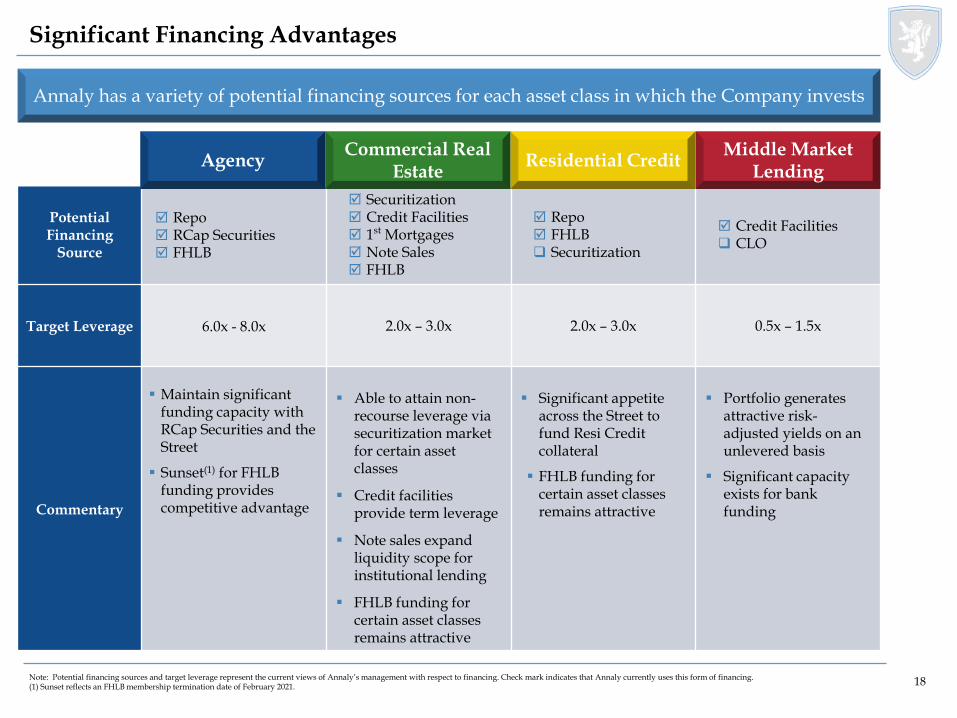
Agency Resi Credit MML
PotentialFinancing
Source
Repo RCap Securities FHLB
Securitization Credit Facilities 1st Mortgages Note Sales FHLB
Repo FHLB Securitization
Credit Facilities CLO
Target Leverage 6.0x - 8.0x 2.0x – 3.0x 2.0x – 3.0x 0.5x – 1.5x
Commentary
Maintain significantfunding capacity with RCap Securities and the Street
Sunset(1) for FHLB funding provides competitive advantage
Able to attain non-recourse leverage via securitization market for certain asset classes
Credit facilities provide term leverage
Note sales expand liquidity scope for institutional lending
FHLB funding for certain asset classes remains attractive
Significant appetite across the Street to fund Resi Credit collateral
FHLB funding for certain asset classes remains attractive
Portfolio generates attractive risk-adjusted yields on an unlevered basis
Significant capacity exists for bank funding
Annaly has a variety of potential financing sources for each asset class in which the Company invests
Note: Potential financing sources and target leverage represent the current views of Annaly’s management with respect to financing. Check mark indicates that Annaly currently uses this form of financing.(1) Sunset reflects an FHLB membership termination date of February 2021.
Agency Residential CreditCommercial Real
EstateMiddle Market
Lending
1919
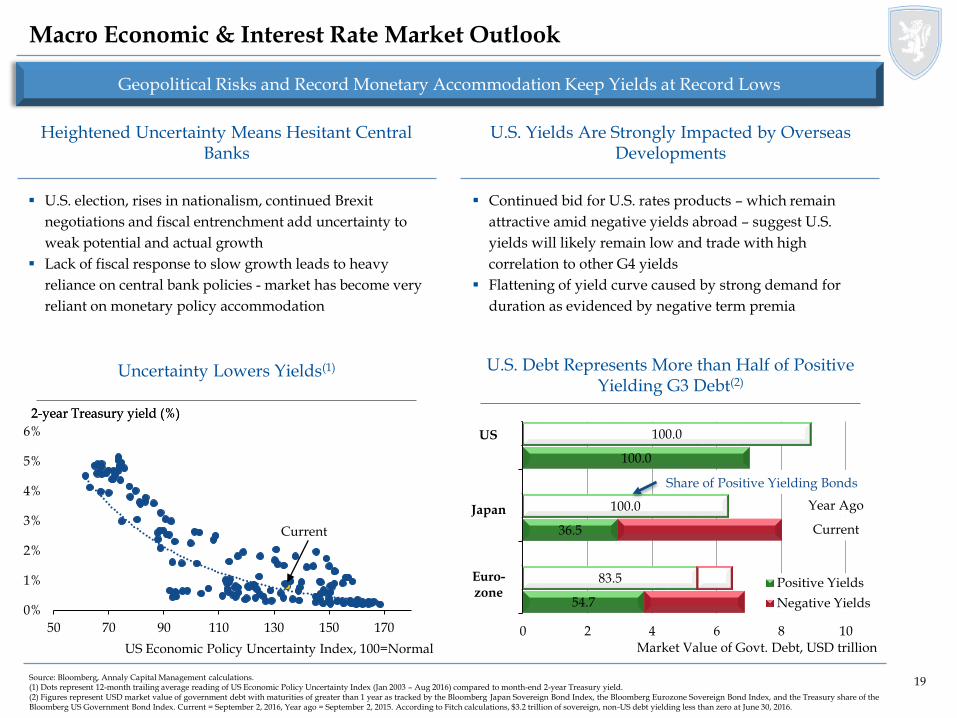
54.7
36.5
100.0
83.5
100.0
100.0
0 2 4 6 8 10Market Value of Govt. Debt, USD trillion
Positive Yields
Negative Yields
US
Japan
Euro-zone
Current
Year Ago
Share of Positive Yielding Bonds
Macro Economic & Interest Rate Market Outlook
U.S. election, rises in nationalism, continued Brexit
negotiations and fiscal entrenchment add uncertainty to
weak potential and actual growth
Lack of fiscal response to slow growth leads to heavy
reliance on central bank policies - market has become very
reliant on monetary policy accommodation
Continued bid for U.S. rates products – which remain
attractive amid negative yields abroad – suggest U.S.
yields will likely remain low and trade with high
correlation to other G4 yields
Flattening of yield curve caused by strong demand for
duration as evidenced by negative term premia
Heightened Uncertainty Means Hesitant Central Banks
U.S. Yields Are Strongly Impacted by Overseas Developments
Geopolitical Risks and Record Monetary Accommodation Keep Yields at Record Lows
Source: Bloomberg, Annaly Capital Management calculations.(1) Dots represent 12-month trailing average reading of US Economic Policy Uncertainty Index (Jan 2003 – Aug 2016) compared to month-end 2-year Treasury yield.(2) Figures represent USD market value of government debt with maturities of greater than 1 year as tracked by the Bloomberg Japan Sovereign Bond Index, the Bloomberg Eurozone Sovereign Bond Index, and the Treasury share of the Bloomberg US Government Bond Index. Current = September 2, 2016, Year ago = September 2, 2015. According to Fitch calculations, $3.2 trillion of sovereign, non-US debt yielding less than zero at June 30, 2016.
Uncertainty Lowers Yields(1) U.S. Debt Represents More than Half of Positive Yielding G3 Debt(2)
0%
1%
2%
3%
4%
5%
6%
50 70 90 110 130 150 170
US Economic Policy Uncertainty Index, 100=Normal
2-year Treasury yield (%)2-year Treasury yield (%)
Current
2020
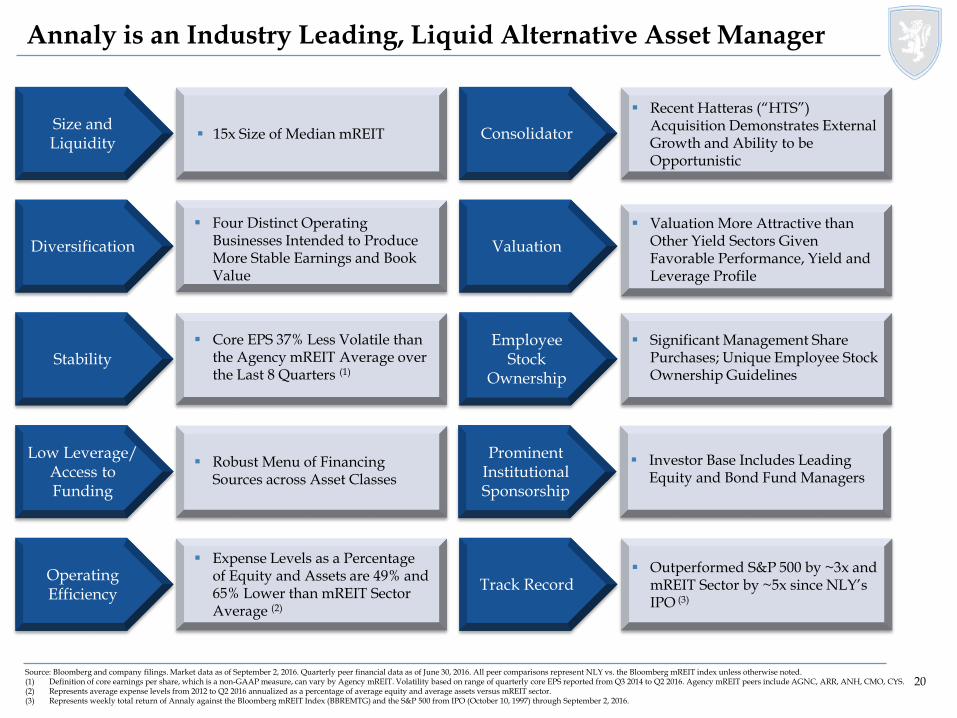
15x Size of Median mREITSize and Liquidity
Consolidator
Recent Hatteras (“HTS”) Acquisition Demonstrates External Growth and Ability to be Opportunistic
Diversification
Four Distinct Operating Businesses Intended to Produce More Stable Earnings and Book Value
Valuation
Valuation More Attractive than Other Yield Sectors Given Favorable Performance, Yield and Leverage Profile
StabilityEmployee
Stock Ownership
Core EPS 37% Less Volatile than the Agency mREIT Average over the Last 8 Quarters (1)
Significant Management Share Purchases; Unique Employee Stock Ownership Guidelines
Operating Efficiency
Track Record
Expense Levels as a Percentage of Equity and Assets are 49% and 65% Lower than mREIT Sector Average (2)
Outperformed S&P 500 by ~3x and mREIT Sector by ~5x since NLY’s IPO (3)
Low Leverage/ Access to Funding
Prominent Institutional Sponsorship
Robust Menu of Financing Sources across Asset Classes
Investor Base Includes Leading Equity and Bond Fund Managers
Source: Bloomberg and company filings. Market data as of September 2, 2016. Quarterly peer financial data as of June 30, 2016. All peer comparisons represent NLY vs. the Bloomberg mREIT index unless otherwise noted.(1) Definition of core earnings per share, which is a non-GAAP measure, can vary by Agency mREIT. Volatility based on range of quarterly core EPS reported from Q3 2014 to Q2 2016. Agency mREIT peers include AGNC, ARR, ANH, CMO, CYS.(2) Represents average expense levels from 2012 to Q2 2016 annualized as a percentage of average equity and average assets versus mREIT sector.(3) Represents weekly total return of Annaly against the Bloomberg mREIT Index (BBREMTG) and the S&P 500 from IPO (October 10, 1997) through September 2, 2016.
Annaly is an Industry Leading, Liquid Alternative Asset Manager

2121
Appendix: Non-GAAP Reconciliation
2222
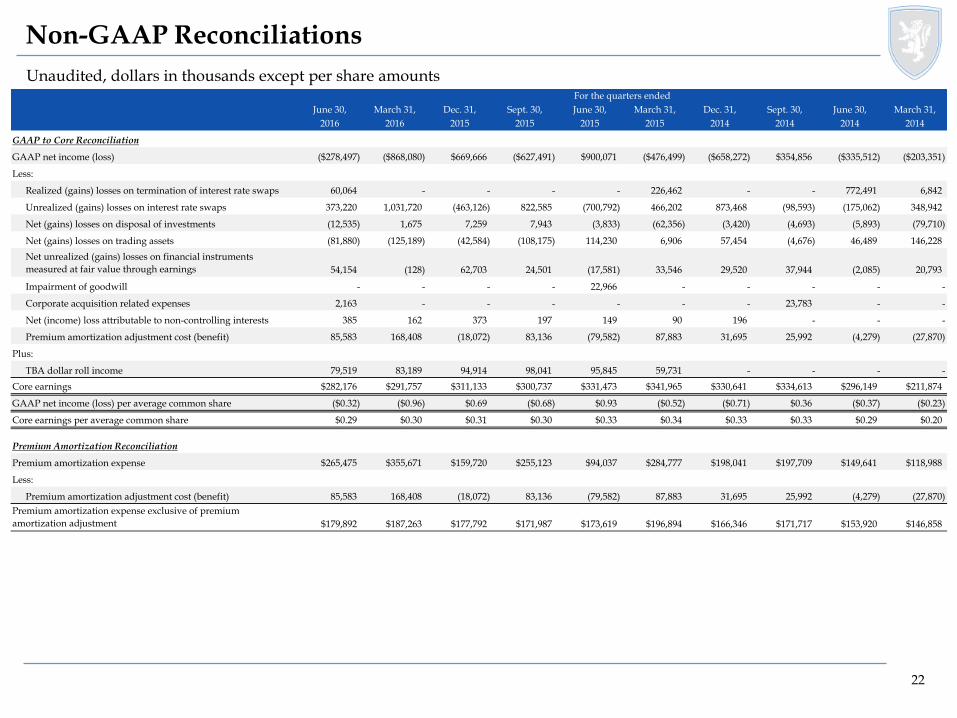
Non-GAAP Reconciliations
Unaudited, dollars in thousands except per share amountsFor the quarters ended
June 30, March 31, Dec. 31, Sept. 30, June 30, March 31, Dec. 31, Sept. 30, June 30, March 31,
2016 2016 2015 2015 2015 2015 2014 2014 2014 2014
GAAP to Core Reconciliation
GAAP net income (loss) ($278,497) ($868,080) $669,666 ($627,491) $900,071 ($476,499) ($658,272) $354,856 ($335,512) ($203,351)
Less:
Realized (gains) losses on termination of interest rate swaps 60,064 - - - - 226,462 - - 772,491 6,842
Unrealized (gains) losses on interest rate swaps 373,220 1,031,720 (463,126) 822,585 (700,792) 466,202 873,468 (98,593) (175,062) 348,942
Net (gains) losses on disposal of investments (12,535) 1,675 7,259 7,943 (3,833) (62,356) (3,420) (4,693) (5,893) (79,710)
Net (gains) losses on trading assets (81,880) (125,189) (42,584) (108,175) 114,230 6,906 57,454 (4,676) 46,489 146,228
Net unrealized (gains) losses on financial instruments
measured at fair value through earnings 54,154 (128) 62,703 24,501 (17,581) 33,546 29,520 37,944 (2,085) 20,793
Impairment of goodwill - - - - 22,966 - - - - -
Corporate acquisition related expenses 2,163 - - - - - - 23,783 - -
Net (income) loss attributable to non-controlling interests 385 162 373 197 149 90 196 - - -
Premium amortization adjustment cost (benefit) 85,583 168,408 (18,072) 83,136 (79,582) 87,883 31,695 25,992 (4,279) (27,870)
Plus:
TBA dollar roll income 79,519 83,189 94,914 98,041 95,845 59,731 - - - -
Core earnings $282,176 $291,757 $311,133 $300,737 $331,473 $341,965 $330,641 $334,613 $296,149 $211,874
GAAP net income (loss) per average common share ($0.32) ($0.96) $0.69 ($0.68) $0.93 ($0.52) ($0.71) $0.36 ($0.37) ($0.23)
Core earnings per average common share $0.29 $0.30 $0.31 $0.30 $0.33 $0.34 $0.33 $0.33 $0.29 $0.20
Premium Amortization Reconciliation
Premium amortization expense $265,475 $355,671 $159,720 $255,123 $94,037 $284,777 $198,041 $197,709 $149,641 $118,988
Less:
Premium amortization adjustment cost (benefit) 85,583 168,408 (18,072) 83,136 (79,582) 87,883 31,695 25,992 (4,279) (27,870)
$179,892 $187,263 $177,792 $171,987 $173,619 $196,894 $166,346 $171,717 $153,920 $146,858
Premium amortization expense exclusive of premium
amortization adjustment
Top Related