


Languages
Pages
Legal


49
133
156
255
192
0
127
127
127
0
153
204
191
191
191
203
224
230
234
234
234
0
97
114
Group Financial Results
for the quarter ended 31 March 2018
Bank of Cyprus Group
29 May 2018
The Group Financial Results have been neither audited nor reviewed by the Group’s external auditors.
This financial information is presented in Euro (€) and all amounts are rounded as indicated. A comma is used to separate thousands and a dot is used to separate decimals.
Important Notice Regarding Additional Information Contained in the Investor Presentation
The presentation for the Group Financial Results for the quarter ended 31 March 2018 contains inside information for the purposes of Article 7 of the Market Abuse Regulation (EU) 596/2014.
The presentation for the Group Financial Results for the quarter ended 31 March 2018 (the “Presentation”), available on http://www.bankofcyprus.com/en-GB/investor-relations-new/reports-
presentations/financial-results/ , includes additional financial information not presented within the Group Financial Results Press Release (the “Press Release”), primarily relating to (i) NPE
analysis (movements by segments geography and customer type), (ii) rescheduled loans analysis, (iii) details of historic restructuring activity including REMU activity, (iv) analysis of new lending,
(v) Income statement by business line, (vi) UK operations analysis, (vii) NIM and interest income analysis and (viii) Loan portfolio analysis in accordance with the three-stages model for
impairment of IFRS 9. Except in relation to any non-IFRS measure, the financial information contained in the Investor Presentation has been prepared in accordance with the Group’s significant
accounting policies as described in the Group’s Annual Financial Report 2017. The Presentation should be read in conjunction with the information contained in the Press Release and neither the
financial information in the Press Release nor in the Presentation constitute statutory financial statements prepared in accordance with International Financial Reporting Standards.

49
133
156
255
192
0
127
127
127
0
153
204
191
191
191
203
224
230
234
234
234
0
97
114
1Q2018 – Highlights
2
• Total income of €231 mn for 1Q2018, including non recurring treasury gains of €19 mn
• Operating profit of €125 mn for 1Q2018
• Profit after tax of €43 mn, EPS of 10 cents in 1Q2018
• Cost to income ratio of 46% for 1Q2018
• Cost of risk of 1.2%
• Deposits increased by 1% qoq to €18.0 bn, with local deposits increasing by €291 mn in 1Q2018
• Full liquidity compliance (Group: LCR at 229%, NSFR 111%; Bank: LCR including local add-on3 at 109%)
• Loan to deposit ratio at 80%
• CET1 ratio2 at 12.0%, with organic capital generation offset by previously guided impact of EBA CRR definition and DTA phasing in
• CET1 ratio fully loaded2 at 11.7%
• Total Capital ratio at 13.5%
• Capital ratios comfortably above SREP minimum requirement, with capacity to issue up to 150 bps of AT1 and further Tier 2
2018
Targets
Unchanged
• EPS guidance of c.40 cents maintained
• CET 1 >13.0%2,4 and Total capital ratio >15.0%2,4
• ~€2 bn organic NPE reduction; Cost of Risk <1%
• All targets and guidance continue to exclude the impact of any accelerated asset disposals
Positive
Performance in
1Q2018
Strong Liquidity
Position
Adequate Capital
Position
• Twelve consecutive quarters of organic NPE reduction
• NPEs reduced by €454 mn (5%) qoq to €8.3 bn (reduced by 44% since December 2014)
• NPE ratio at 45%; NPE coverage at 51%1
• Continue to explore other structured solutions to accelerate de-risking5
Continued
Progress on
Balance Sheet
Repair
(1) Including IFRS 9 First Time Adoption (FTA)
(2) Allowing for IFRS 9 transitional arrangements
(3) The local regulatory liquidity requirements set by the Central Bank of Cyprus (CBC) were abolished on 1 January 2018 and were replaced with a liquidity add-on requirement imposed on top of the
LCR of the Bank which became effective on 1 January 2018
(4) Including the impact of the adoption of the changes aligning the EBA CRR default definition with the NPE definition
(5) The Group’s financial results for the 1Q2018 and all targets and guidance do not include any material impact from any accelerated asset disposals. The financial results of subsequent quarters may
be affected, as transaction execution and any financial consequences become more certain.

49
133
156
255
192
0
127
127
127
0
153
204
191
191
191
203
224
230
234
234
234
0
97
114
Group Loan Portfolio and Asset Quality
3

49
133
156
255
192
0
127
127
127
0
153
204
191
191
191
203
224
230
234
234
234
0
97
114
10.50 10.50 9.88 8.93 8.47 8.47 8.47 8.48 8.09 8.00 8.00
0.72 (1.34) (0.95)
(0.46) 0.14 (0.13) (0.39) (0.09)
Dec 2016 Inflows Curing ofrestructuredloans andcollections
Write-offs Foreclosures Dec 2017 Inflows Curing ofrestructuredloans andcollections
Write-offs Foreclosures Mar 20184
Organic NPE reduction on track with our guidance
4
(1) Value of on-boarded assets is set at a conservative 25%-30% discount from open market valuations, by two independent sources
(2) Includes consensual (debt for asset swaps, DFAS) and non consensual foreclosures and debt for equity swaps
(3) Quarterly 2017 inflows and curing of restructured loans and collections of NPEs include loans of €209 mn which exited NPE via curing 1Q2017 but then had to be re-included in 4Q2017 as NPE
waiting to exit due to technical parameters changes (previously restructured corporate exposures re-classified into NPEs during 4Q2017)
(4) Write offs in 1Q2018 include a net impact of c.€11 mn of IFRS 9 grossing up and set offs
(5) Percentage points
(6) Excluding the impact of any accelerated asset disposals
1,2
2018 Target6
Unchanged
~ €2 bn organic
Group NPE reduction
Cyprus operations
1,2 3 3
15.0 15.2 14.8 14.2 14.0 13.3 12.5 11.9 11.0 10.4 9.8 9.2 8.8 8.3
62.9% 63.0% 61.9% 62.2% 61.8% 61.0%
59.3% 57.8% 54.8%
51.8% 50.0%
47.6% 46.9% 44.9%
Dec 2014 Mar 2015 Jun 2015 Sep 2015 Dec 2015 Mar 2016 Jun 2016 Sep 2016 Dec 2016 Mar 2017 Jun 2017 Sep 2017 Dec 2017 Mar 2018
NPEs (€ bn) NPE ratio NPEs with forbearance measures, no arrears
• NPEs reduced by
€6.7 bn (44%) since
Dec 2014
• NPE ratio reduced by
c.18 p.p5 since Dec
2014
44% drop since Dec 14
5% drop qoq;
1.6
NPEs down by €454 mn or 5% in 1Q2018
Organic reduction continues through curing of restructured loans, collections, write offs and foreclosures
1.5
-€2.03 bn -€474 mn

49
133
156
255
192
0
127
127
127
0
153
204
191
191
191
203
224
230
234
234
234
0
97
114 0.6
0.3
0.3 0.4
2.0
2.0
1.3 1.1
Dec-15 Dec-16 Dec-17 Mar-18
Core NPE risk at €6.8 bn down by c.40% since 2015 and 58% covered
(1) In pipeline to exit NPEs subject to meeting all exit criteria
(2) Analysis based on account basis
(3) An internal reorganisation of RRD took place in 4Q2017. €400 mn were transferred from SMEs to Corporate (€300 mn) and Retail (€100 mn). For more information please refer to slide 29 5
€14.0 bn
€8.8 bn
€11.0 bn
€8.3 bn
11.4
8.7 7.2 Core NPEs
Non Core
NPEs
50% of Gross
Loans
Coverage 36%
Non Core NPEs (€ bn) Dec-15 Dec-16 Dec-17
Dec-17
After RRD
reorganisation3
Mar-18
Corporate 1.5 1.2 0.9 0.9 0.8
SMEs 0.4 0.6 0.4 0.4 0.3
Retail 0.7 0.5 0.3 0.3 0.4
Total Non Core NPEs 2.6 2.3 1.6 1.6 1.5
Core NPEs (€ bn) Δ since
2015
Corporate 5.7 3.8 2.7 3.0 2.6 -3.1
SMEs 3.1 2.6 2,1 1.7 1.8 -1.3
Retail 2.6 2.4 2.4 2.5 2.4 -0.2
Total Core NPEs 11.4 8.7 7.2 7.2 6.8 -4.6
0.1 0.1
0.3 0.1 0.1
0.1
0.1 0.1
0.1 0.2
0.1
0.1 0.5
0.4
0.6
2018 2019 2020+
No arrears but Impaired Retail SME Corporate
Exit dates for non core NPEs
€1.5 bn forborne NPEs with no arrears1,2
€ bn
6.8
43% of Gross
Loans
Coverage 49%
38% of Gross
Loans
Coverage 54%
37% of Gross
Loans
Coverage 58%
Forborne
No impairments
No arrears1,2
No arrears
but impaired
NPEs
8% of Gross
Loans
Coverage 18%
49
133
156
255
192
0
127
127
127
0
153
204
191
191
191
203
224
230
234
234
234
0
97
114
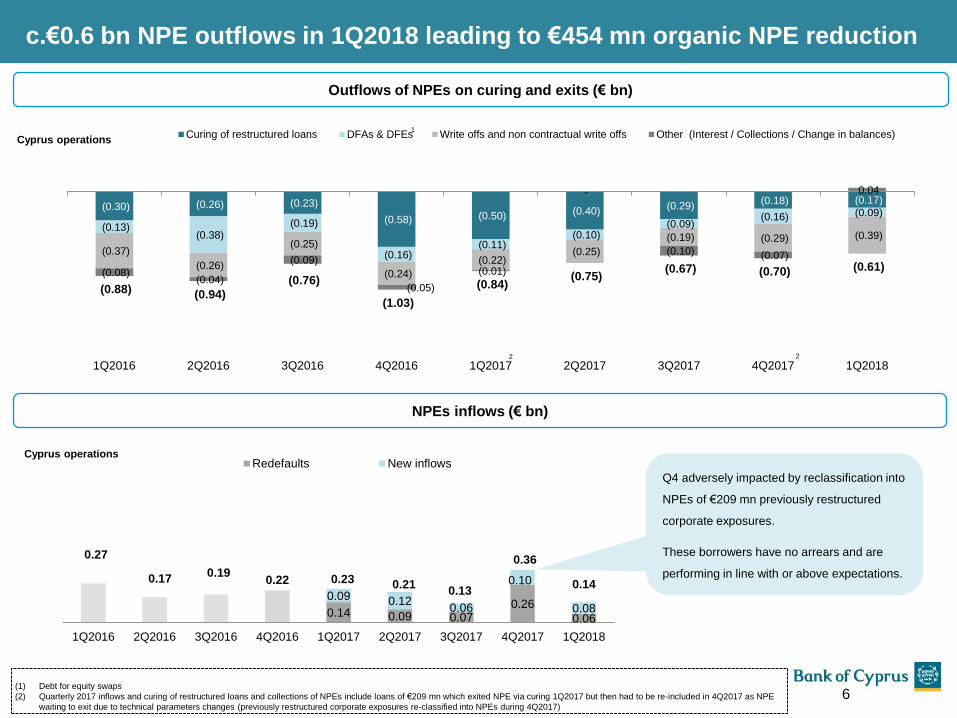
0.14 0.09 0.07 0.26
0.06
0.09 0.12 0.06
0.10
0.08
0.27
0.17 0.19
0.22 0.23 0.21 0.13
0.36
0.14
1Q2016 2Q2016 3Q2016 4Q2016 1Q2017 2Q2017 3Q2017 4Q2017 1Q2018
Redefaults New inflows
(0.30) (0.26) (0.23)
(0.58) (0.50) (0.40) (0.29)
(0.18) (0.17)
(0.13) (0.38)
(0.19)
(0.16) (0.11)
(0.10) (0.09)
(0.16) (0.09)
(0.37)
(0.26)
(0.25)
(0.24)
(0.22) (0.25)
(0.19) (0.29) (0.39)
(0.08) (0.04)
(0.09)
(0.05)
(0.01)
-
(0.10) (0.07)
0.04
(0.88) (0.94)
(0.76)
(1.03)
(0.84) (0.75)
(0.67) (0.70) (0.61)
1Q2016 2Q2016 3Q2016 4Q2016 1Q2017 2Q2017 3Q2017 4Q2017 1Q2018
-1.30
-1.10
-0.90
-0.70
-0.50
-0.30
-0.10
0.10
0.30
0.50
Curing of restructured loans DFAs & DFEs Write offs and non contractual write offs Other (Interest / Collections / Change in balances)
6
2
c.€0.6 bn NPE outflows in 1Q2018 leading to €454 mn organic NPE reduction
(1) Debt for equity swaps
(2) Quarterly 2017 inflows and curing of restructured loans and collections of NPEs include loans of €209 mn which exited NPE via curing 1Q2017 but then had to be re-included in 4Q2017 as NPE
waiting to exit due to technical parameters changes (previously restructured corporate exposures re-classified into NPEs during 4Q2017)
1
Q4 adversely impacted by reclassification into
NPEs of €209 mn previously restructured
corporate exposures.
These borrowers have no arrears and are
performing in line with or above expectations.
Cyprus operations
Cyprus operations
2 2
Outflows of NPEs on curing and exits (€ bn)
NPEs inflows (€ bn)

49
133
156
255
192
0
127
127
127
0
153
204
191
191
191
203
224
230
234
234
234
0
97
114
68
%
63
%
63
%
62
%
60
%
59
%
59
%
55
%
53%
51
%
51
%
51
%
49%
47
%
45
%
44
%
43
%
42
%
39
%
36
%
33
%
32
%
32
%
30
%
29
%
29
%
29
%
29
%
27
%
23
%
44%
RO SI CZ HU SK PL HR BG AT BOC1Q2018
FR IT PT GR CY LU BE ES DE MT NO LV GB SE IE LT NL DK FI EE
EU average2
NPE provision coverage at 51%; Total Provision coverage at 119%
7
41%
48%
48%
51%
68%
66%
67%
68%
109%
114%
115%
119%
Dec 16 Jun-17 Dec-17 Mar-18
Loan loss reserves Tangible Collateral 4
(1) Provisions for impairment of customer loans and gains/(losses) on derecognition of loans and changes in expected cash flows on acquired loans over average gross loans. Additional provisions of c.€500 mn
charged in 2Q2017 are included in the calculation of Cost of Risk but are not annualised.
(2) Based on EBA Risk Dashboard as at 31 December 2017
(3) NPE Provision Coverage for BOC as at 31 March 2018
(4) Restricted to Gross IFRS balance
(5) Including IFRS 9 (FTA)
3,5
1.1%
1.8% 2.1% 2.0% 1.3% 1.4% 1.5%
1.1% 1.2% <1.00%
3.90%
1Q2016 2Q2016 3Q2016 4Q2016 1Q2017 2Q2017 3Q2017 4Q2017 1Q2018 2018Guidance
Quarterly Cost of Risk - Group (excluding additional provisions in 2Q17)
Quarterly Cost of Risk - Group (including additional provisions in 2Q17)
1
1
Quarterly CoR at 1.2% NPE total coverage at 119% when collateral included
NPE provision coverage above EU average
Additional provisions
of c.€500 mn
5
49
133
156
255
192
0
127
127
127
0
153
204
191
191
191
203
224
230
234
234
234
0
97
114
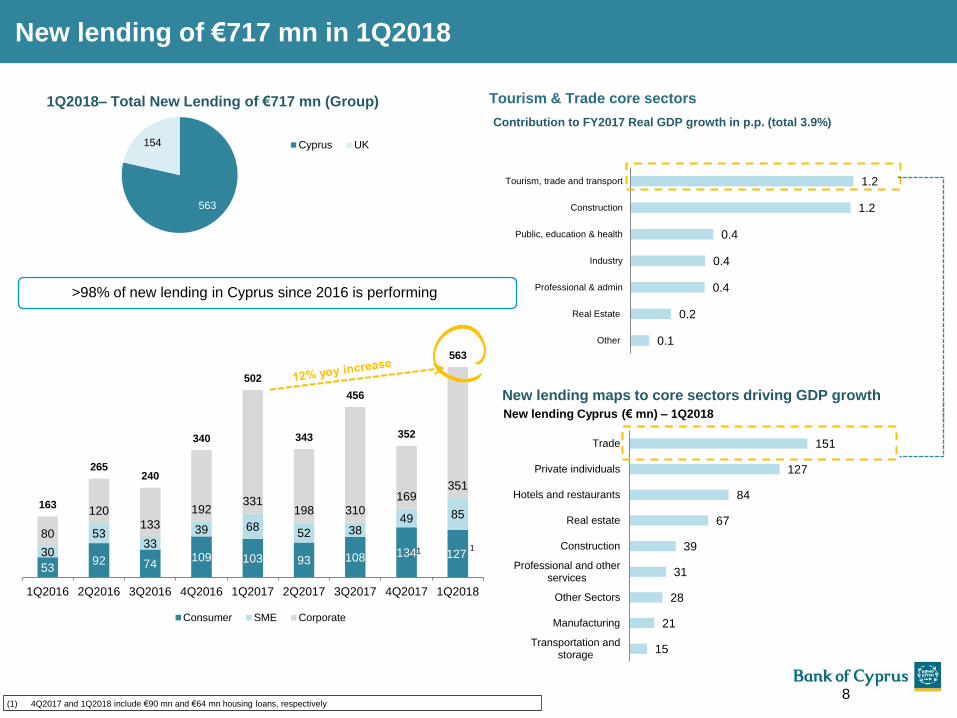
53 92 74
109 103 93 108 134 127 30
53 33
39 68 52 38
49 85
80
120 133
192 331
198 310 169
351
163
265 240
340
502
343
456
352
563
1Q2016 2Q2016 3Q2016 4Q2016 1Q2017 2Q2017 3Q2017 4Q2017 1Q2018
Consumer SME Corporate
0.1
0.2
0.4
0.4
0.4
1.2
1.2
Other
Real Estate
Professional & admin
Industry
Public, education & health
Construction
Tourism, trade and transport
New lending of €717 mn in 1Q2018
8
1Q2018– Total New Lending of €717 mn (Group)
563
154 Cyprus UK
Tourism & Trade core sectors
New lending maps to core sectors driving GDP growth
15
21
28
31
39
67
84
127
151
Transportation andstorage
Manufacturing
Other Sectors
Professional and otherservices
Construction
Real estate
Hotels and restaurants
Private individuals
Trade
New lending Cyprus (€ mn) – 1Q2018
Contribution to FY2017 Real GDP growth in p.p. (total 3.9%)
>98% of new lending in Cyprus since 2016 is performing
(1) 4Q2017 and 1Q2018 include €90 mn and €64 mn housing loans, respectively
1 1

49
133
156
255
192
0
127
127
127
0
153
204
191
191
191
203
224
230
234
234
234
0
97
114
REMU sale agreements of €114 mn YTD
€114 mn sales agreed ytd; REMU profit of €11 mn in 1Q2018
9
Sales achieved on average well above Book Value
97
17 12
9
59
0%
20%
40%
60%
80%
100%
Total Sales (YTD) Hotels Commercial Residential Land
Hotels Gross Proceeds / OMV Net Proceeds / BV2 1 3
119%
99%
104%
97%
108%
87%
124%
96%
126%
102%
• 123 properties sold in
1Q2018, representing c.5% of
total REMU properties
• SPAs signed for additional 170
properties
• Encouraging trends on real
estate market
• Property prices up 1.5% yoy5
• Sale contracts (excluding
DFAS) up 38% yoy6
• c.60% of properties sold (in
value) relate to land
(1) BV= book value = Carrying value prior to the sale of property; OMV = Open Market Value
(2) Proceeds before selling charge and other leakages
(3) Proceeds after selling charges and other leakages
(4) Amounts as per Sales purchase Agreements (SPAs)
(5) Based on Cyprus Central Bank report – Residential Prices Index
(6) Based on data from Land of Registry – Sales contracts
Sales contract prices4 (€ mn)
Sales contract prices4 (€ mn)
235
97
60
61
17
Offers accepted In process SPA in preparation SPA signed Sold
Total sale
agreements
€114 mn

49
133
156
255
192
0
127
127
127
0
153
204
191
191
191
203
224
230
234
234
234
0
97
114
Capital and Funding Position
10

49
133
156
255
192
0
127
127
127
0
153
204
191
191
191
203
224
230
234
234
234
0
97
114
RWA intensity3 at 77% mainly due to alignment of CRR DD5 with the
NPE definition
12.0% 12.0%
11.7% 11.7%
12.7%
0.6% (0.4%) (0.1%)
(0.2%)
(0.5%) (0.1%)
(0.3%)
CET 1(transitional) 31 Dec 2017
Operatingprofitability
Provisionsand other
impairments
IFRS 9 FTA DTA andother
Alignment ofCRR DD
RWA CET 1(transitional)31 Mar 2018
Deferred Tax CET 1 fullyloaded 31Mar 2018
2
1
1 5
As previously guided
9.375%
85% 85% 85% 83%
79% 76%
73%
77%
Dec 14 Dec 15 Dec 16 Mar 17 Jun 17 Sep 17 Dec 17 Mar 18
Capital ratios remain adequate
11
(1) Allowing for IFRS 9 transitional arrangements
(2) Phase-in adjustments of DTAs, and reserve movements
(3) Risk Weighted Assets over Total Assets
(4) Percentage points
(5) Default Definition
(6) IFRS 9 FTA impact of c.€300 mn
13.9
%
14.5
%
14.6
%
12.2
%
12.7
%
14.2
%
11.7
%
12.0
%
13.5
%
CET 1 fully loaded CET 1 ratio (transitional) Total capital ratio
Dec 2016 Dec 2017 Mar 2018
CET1 ratio at 12.0%, with organic capital generation offset by
previously guided impact of EBA CRR DD5 and DTA phasing in
12.875%
Evolution of Capital Ratios
9.375%
Organic capital rebuild expected through operating profitability
COR 2018 <1.0%
min SREP requirement
9.375%
Early adoption of changes to align EBA CRR
definition with NPE definition and IFRS 9 FTA6,
resulted in an increase in RWA intensity by c.4 p.p4
12.0%
CET 1 (transitional)31 Mar 2018
2018 Operatingprofitability
2018 Provisions,Impairments & RWAs
CET 1 (transitional)31 Dec 2018
>13%
9.375%
49
133
156
255
192
0
127
127
127
0
153
204
191
191
191
203
224
230
234
234
234
0
97
114
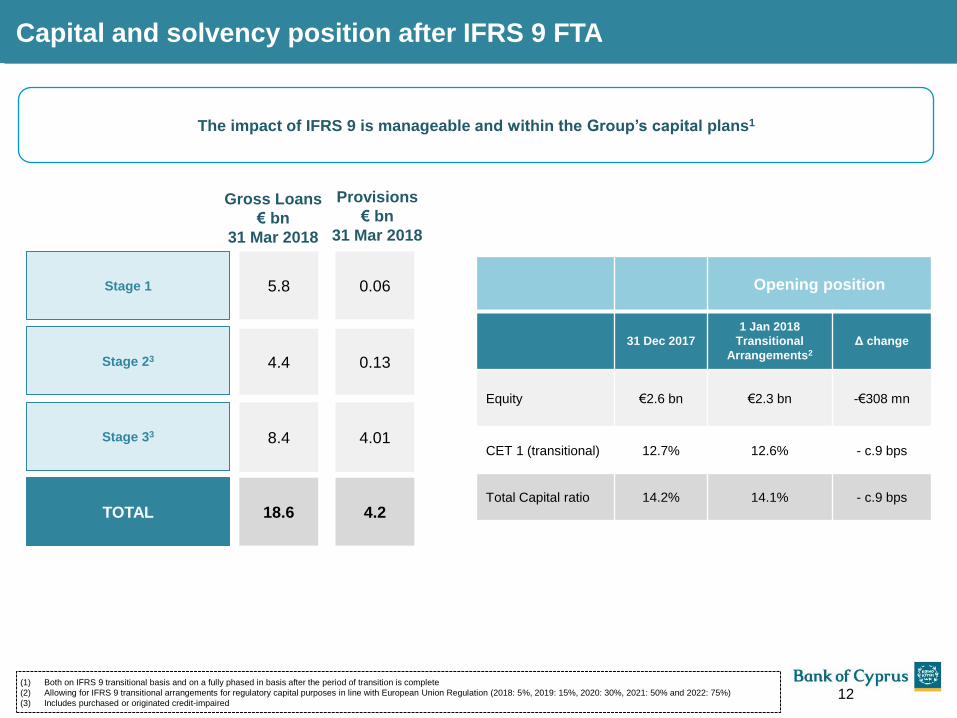
Capital and solvency position after IFRS 9 FTA
12
Stage 1
Stage 23
Stage 33
Provisions
€ bn
31 Mar 2018
0.06
0.13
4.01
TOTAL 4.2
Opening position
31 Dec 2017
1 Jan 2018
Transitional
Arrangements2
Δ change
Equity €2.6 bn
€2.3 bn
-€308 mn
CET 1 (transitional) 12.7% 12.6% - c.9 bps
Total Capital ratio 14.2% 14.1% - c.9 bps
5.8
4.4
8.4
18.6
Gross Loans
€ bn
31 Mar 2018
(1) Both on IFRS 9 transitional basis and on a fully phased in basis after the period of transition is complete
(2) Allowing for IFRS 9 transitional arrangements for regulatory capital purposes in line with European Union Regulation (2018: 5%, 2019: 15%, 2020: 30%, 2021: 50% and 2022: 75%)
(3) Includes purchased or originated credit-impaired
The impact of IFRS 9 is manageable and within the Group’s capital plans1

49
133
156
255
192
0
127
127
127
0
153
204
191
191
191
203
224
230
234
234
234
0
97
114
Deposits increased by c.1% qoq to €18.0 bn; Local deposits increased by €291 mn in 1Q2018
Full compliance with all liquidity requirements
13
(1) The local regulatory liquidity requirements set by the Central Bank of Cyprus (CBC) were abolished on 1 January 2018 and were replaced with a liquidity add-on requirement imposed on top of
LCR in the case of BOC PCL, which became effective on 1 January 2018. Currently the Group and BOC PCL are in compliance with the LCR, and BOC PCL is in compliance with the imposed
add-on.
(2) NSFR was not introduced on 1 January 2018, as opposed to what was expected. The NSFR is calculated as the amount of “available stable funding” (ASF) relative to the amount of “required
stable funding” (RSF), on the basis of Basel III standards. Its calculation is a SREP requirement. EBA is working on finalising the NSFR and enforcing it as a regulatory ratio.
(3) Division servicing exclusively international activity companies registered in Cyprus and abroad and not residents.
(4) Data used as at 30 April 2018. Origin is defined as the country of the passport of the Ultimately Beneficial Owner.
Liquidity ratio Minimum
required 31 Mar 2018 Surplus
NSFR2 100% 111% €1,764 mn
LCR (Group) 100% 229% €1,919 mn
LCR with add-on1
Group
BOC PCL
100%
100%
111%
109%
€325 mn
€282 mn
50% relaxation of LCR add-on rates expected on 1 Jul 2018
LCR add-on: lower
rates as from 1 July
2018
Group
BOC PCL
100%
100%
149%
147%
€1,122 mn
€1,079 mn
>2% qoq increase in local deposits, offsets the 4% qoq
reduction in IBU deposits
10.67 10.93 11.35 11.82 12.11
4.41 4.08 4.24
4.16 4.00
1.46 1.57
1.72 1.87 1.89 16.54 16.58
17.31 17.85 18.00
Mar 17 Jun 17 Sep 17 Dec 17 Mar-18
Cyprus non-IBU Cyprus IBU UK3
63%
21%
4% 6%
6%
Cyprus
Other EU
Other European Countriesexcluding RussiaRussia
Other Countries
Cyprus deposits by
passport origin4
Cyprus deposits by geography
49
133
156
255
192
0
127
127
127
0
153
204
191
191
191
203
224
230
234
234
234
0
97
114
Operating Performance
14
49
133
156
255
192
0
127
127
127
0
153
204
191
191
191
203
224
230
234
234
234
0
97
114
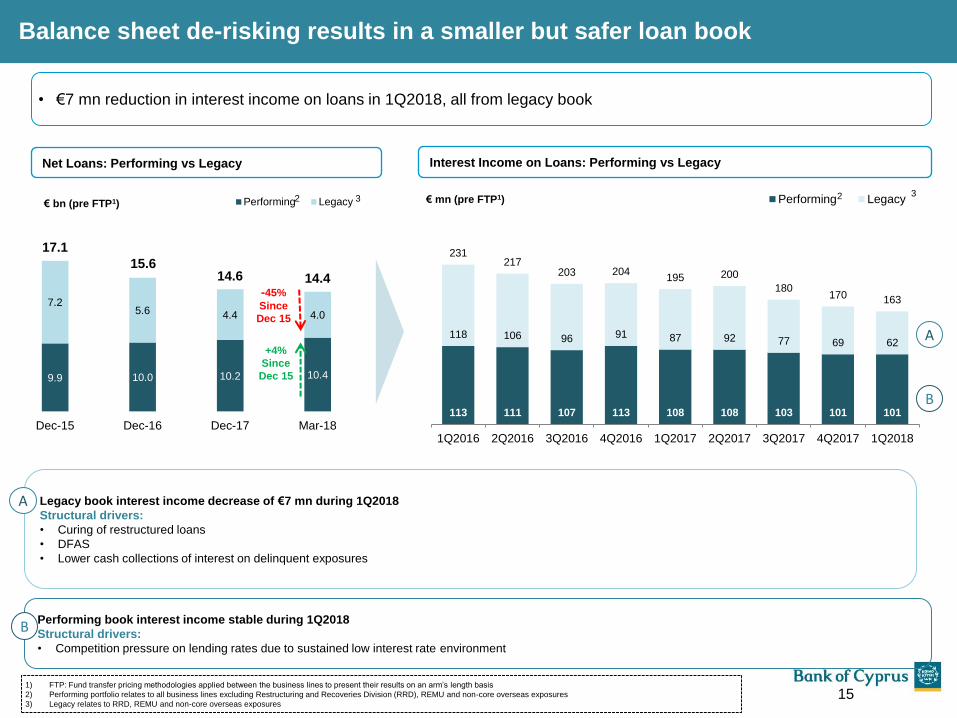
9.9 10.0 10.2 10.4
7.2 5.6 4.4 4.0
17.1
15.6 14.6 14.4
Dec-15 Dec-16 Dec-17 Mar-18
Performing Legacy€ bn (pre FTP1)
Legacy book interest income decrease of €7 mn during 1Q2018
Structural drivers:
• Curing of restructured loans
• DFAS
• Lower cash collections of interest on delinquent exposures
Performing book interest income stable during 1Q2018
Structural drivers:
• Competition pressure on lending rates due to sustained low interest rate environment
B
Balance sheet de-risking results in a smaller but safer loan book
15
113 111 107 113 108 108 103 101 101
118 106 96 91 87 92 77 69 62
231 217
203 204 195 200
180 170 163
1Q2016 2Q2016 3Q2016 4Q2016 1Q2017 2Q2017 3Q2017 4Q2017 1Q2018
Performing Legacy2 3
1) FTP: Fund transfer pricing methodologies applied between the business lines to present their results on an arm’s length basis
2) Performing portfolio relates to all business lines excluding Restructuring and Recoveries Division (RRD), REMU and non-core overseas exposures
3) Legacy relates to RRD, REMU and non-core overseas exposures
B
A
€ mn (pre FTP1)
A
+4%
Since
Dec 15
-45%
Since
Dec 15
2 3
Interest Income on Loans: Performing vs Legacy Net Loans: Performing vs Legacy
• €7 mn reduction in interest income on loans in 1Q2018, all from legacy book

49
133
156
255
192
0
127
127
127
0
153
204
191
191
191
203
224
230
234
234
234
0
97
114
Pro
fita
bil
ity
Interest Income on
loans (€ mn) (pre FTP)1
Provisions
(€ mn)
Interest Income net of
provisions (€ mn)
Cost of Risk
Effective Yield2
Risk adjusted Yield3
1Q2018
101
(7)
94
0.3%
3.94%
3.66%
1Q2018
62
(51)
11
2.6%
5.93%
1.05%
1Q2018
163
(58)
105
1.2%
4.52%
2.91%
14,446
77%
Performing Legacy Group
1) FTP: Fund transfer pricing methodologies applied between the business lines to present their results on an arm’s length basis
2) Interest Income on Loans/Net Loans
3) Interest Income on Loans net of provisions/Net Loans
4) International Banking Services, Wealth & Markets
5) Restructuring and Recoveries Division
6) Relates to Head Office
Risk adjusted yield will rise as Legacy book reduces
Corporate
IBS4
WBAM4
SME and
Retail
Banking
Insurance
and Other6
UK
Subsidiary
RRD5 Overseas
non core
REMU
16
Cap
ital
&
Bala
nc
e
Sh
eet
Average Net Loans
(€ mn)
RWA Intensity
4,185
118%
10,261
63%
• Performing Book is expected to grow
and to increasingly drive Group results
• Legacy book revenues predominantly
driven by provisioning unwinding (but
largely offset via provisions for neutral
P&L impact)
• Risk adjusted yield strong in Performing
book, low in Legacy due to high
provisions
• As Legacy book reduces:
Group risk adjusted yield
expected to rise
Group Risk intensity expected to
fall supporting CET1 ratio build
49
133
156
255
192
0
127
127
127
0
153
204
191
191
191
203
224
230
234
234
234
0
97
114
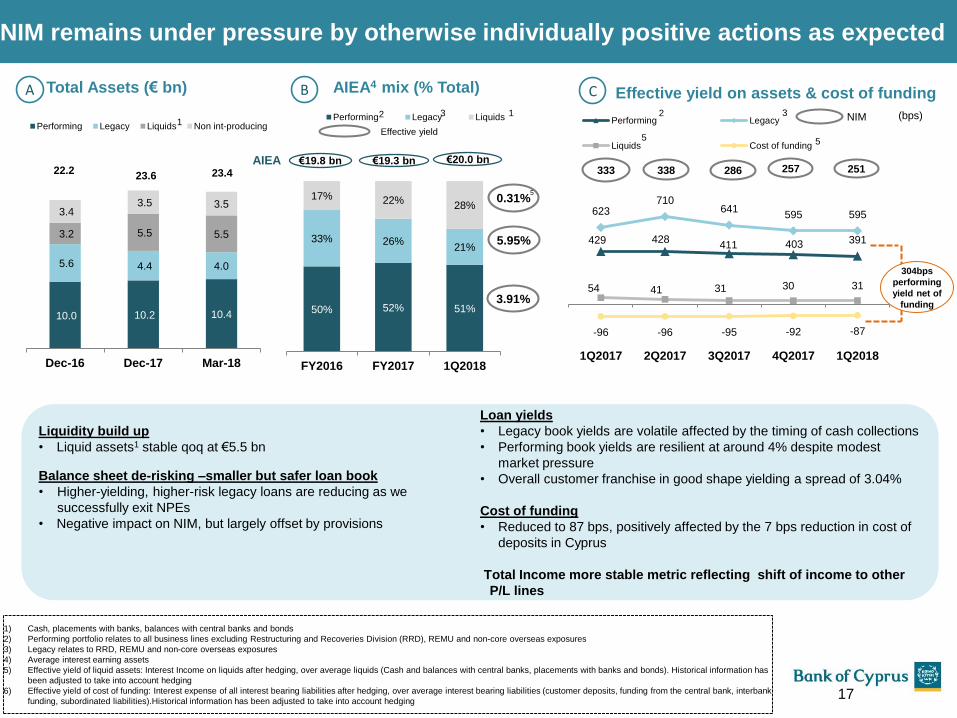
429 428 411 403 391
623 710
641 595 595
54 41 31 30 31
-96 -96 -95 -92 -87
1Q2017 2Q2017 3Q2017 4Q2017 1Q2018
Performing Legacy
Liquids Cost of funding
A
NIM remains under pressure by otherwise individually positive actions as expected
50% 52% 51%
33% 26% 21%
17% 22% 28%
FY2016 FY2017 1Q2018
Performing Legacy Liquids 1
AIEA4 mix (% Total)
0.31%
5.95%
3.91%
Effective yield
Effective yield on assets & cost of funding Total Assets (€ bn) B C
Liquidity build up
• Liquid assets1 stable qoq at €5.5 bn
Balance sheet de-risking –smaller but safer loan book
• Higher-yielding, higher-risk legacy loans are reducing as we
successfully exit NPEs
• Negative impact on NIM, but largely offset by provisions
Loan yields
• Legacy book yields are volatile affected by the timing of cash collections
• Performing book yields are resilient at around 4% despite modest
market pressure
• Overall customer franchise in good shape yielding a spread of 3.04%
Cost of funding
• Reduced to 87 bps, positively affected by the 7 bps reduction in cost of
deposits in Cyprus
Total Income more stable metric reflecting shift of income to other
P/L lines
10.0 10.2 10.4
5.6 4.4 4.0
3.2 5.5 5.5
3.4 3.5 3.5
Dec-16 Dec-17 Mar-18
Performing Legacy Liquids Non int-producing1
333 338 286 257
NIM
€19.8 bn €19.3 bn AIEA
304bps
performing
yield net of
funding
(bps)
17
1) Cash, placements with banks, balances with central banks and bonds
2) Performing portfolio relates to all business lines excluding Restructuring and Recoveries Division (RRD), REMU and non-core overseas exposures
3) Legacy relates to RRD, REMU and non-core overseas exposures
4) Average interest earning assets
5) Effective yield of liquid assets: Interest Income on liquids after hedging, over average liquids (Cash and balances with central banks, placements with banks and bonds). Historical information has
been adjusted to take into account hedging
6) Effective yield of cost of funding: Interest expense of all interest bearing liabilities after hedging, over average interest bearing liabilities (customer deposits, funding from the central bank, interbank
funding, subordinated liabilities).Historical information has been adjusted to take into account hedging
2
5
2 3
5
3
€20.0 bn 251 22.2
23.6 23.4
5

49
133
156
255
192
0
127
127
127
0
153
204
191
191
191
203
224
230
234
234
234
0
97
114
38 38 48 43 45 45 47 41
11 10 9
10 15 14 11
12 1 1
4 9
1 12
5 19 13 22
16 15 16 14 22
35 63
71 77 77 77
85 85
107
2Q2016 3Q2016 4Q2016 1Q2017 2Q2017 3Q2017 4Q2017 1Q2018
Net FX gains/(losses) & Net gains/(losses) on other financial instruments, and other income
Gains/(losses) from revaluation and disposal of investment properties and on disposal of stock of properties
Insurance income net of insurance claims
Net fee and commission income
16% 20% 16% 19% 19% 20% 22% 18%
% Net fee and commission
income % Total income
18
Non interest income of €107 mn
1) Excluding non-recurring fees of approximately €7 mn
2) Gains/(losses) from revaluation and disposal of investment properties and on disposal of stock of properties
3) Net FX gains/(losses) & Net gains/(losses) on other financial instruments, and other income
• Recurring income of €53 mn for 1Q2018, down by 9% qoq mainly. The qoq reduction is mainly due to the implementation of
IFRS 9 under which certain commission income types are not recognised on Stage 3 loans
• Net fee and commission income accounts for 18% of total income as at 31 March 2018 compared to 22% the previous quarter
• Net gains2 amounted to €19 mn, comprising REMU gains from disposal of properties of €11 mn and a valuation gain of €8 mn
following the reclassification of CyREIT properties from stock of properties to investment properties
• Net gains on other financial instruments3 increased by 56% qoq positively affected by non recurring treasury gains from the sale
of bonds of €19 mn
1
Analysis of Non Interest Income (€ mn) – Quarterly
49 57 53 60
59 58 53
Recurring income
48
49
133
156
255
192
0
127
127
127
0
153
204
191
191
191
203
224
230
234
234
234
0
97
114
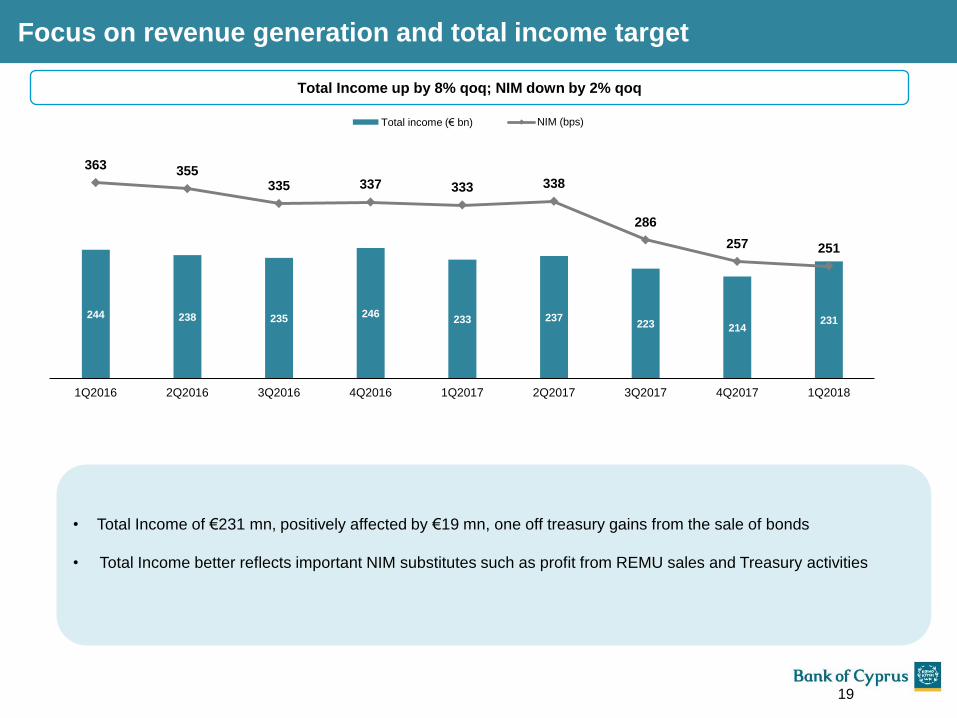
244 238 235 246 233 237
223 214 231
363 355 335 337 333 338
286
257 251
100
150
200
250
300
350
1Q2016 2Q2016 3Q2016 4Q2016 1Q2017 2Q2017 3Q2017 4Q2017 1Q2018
Total income (€ bn) NIM (bps)
Focus on revenue generation and total income target
19
Total Income up by 8% qoq; NIM down by 2% qoq
• Total Income of €231 mn, positively affected by €19 mn, one off treasury gains from the sale of bonds
• Total Income better reflects important NIM substitutes such as profit from REMU sales and Treasury activities
49
133
156
255
192
0
127
127
127
0
153
204
191
191
191
203
224
230
234
234
234
0
97
114
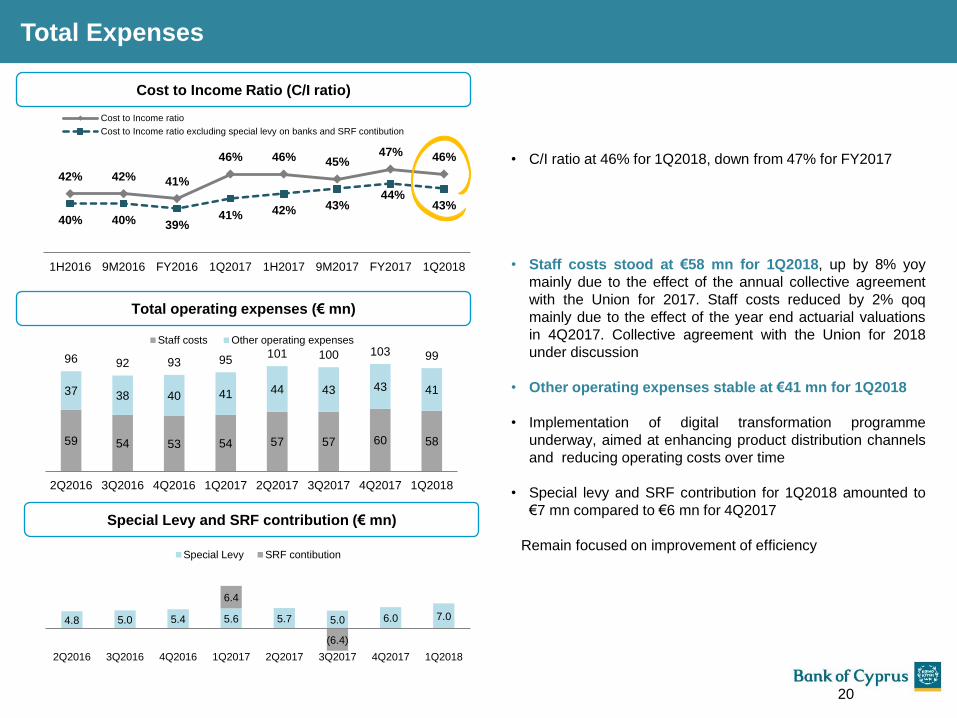
42% 42% 41%
46% 46% 45% 47% 46%
40% 40% 39% 41% 42% 43%
44% 43%
1H2016 9M2016 FY2016 1Q2017 1H2017 9M2017 FY2017 1Q2018
Cost to Income ratio
Cost to Income ratio excluding special levy on banks and SRF contibution
Total Expenses
20
59 54 53 54 57 57 60 58
37 38 40 41 44 43 43 41
96 92 93 95 101 100 103 99
2Q2016 3Q2016 4Q2016 1Q2017 2Q2017 3Q2017 4Q2017 1Q2018
Staff costs Other operating expenses
4.8 5.0 5.4 5.6 5.7 5.0 6.0 7.0
6.4
(6.4)
2Q2016 3Q2016 4Q2016 1Q2017 2Q2017 3Q2017 4Q2017 1Q2018
Special Levy SRF contibution
• C/I ratio at 46% for 1Q2018, down from 47% for FY2017
• Staff costs stood at €58 mn for 1Q2018, up by 8% yoy
mainly due to the effect of the annual collective agreement
with the Union for 2017. Staff costs reduced by 2% qoq
mainly due to the effect of the year end actuarial valuations
in 4Q2017. Collective agreement with the Union for 2018
under discussion
• Other operating expenses stable at €41 mn for 1Q2018
• Implementation of digital transformation programme
underway, aimed at enhancing product distribution channels
and reducing operating costs over time
• Special levy and SRF contribution for 1Q2018 amounted to
€7 mn compared to €6 mn for 4Q2017
Remain focused on improvement of efficiency
Cost to Income Ratio (C/I ratio)
Total operating expenses (€ mn)
Special Levy and SRF contribution (€ mn)

49
133
156
255
192
0
127
127
127
0
153
204
191
191
191
203
224
230
234
234
234
0
97
114
€ mn 1Q2018 1Q2017 4Q2017 qoq % yoy%
Net Interest Income 124 156 129 -3% -21%
Non interest income 107 77 85 25% 39%
Total income 231 233 214 8% -1%
Total expenses (106) (107) (109) -2% -1%
Profit before provisions and impairments1 125 126 105 18% -1%
Loan loss provisions2 (58) (64) (50) 16% -9%
Impairments of other financial and non financial
instruments (7) (32) (27) -75% -78%
Provision for litigation and regulatory matters (2) (17) (25) -93% -90%
Total Provisions and impairments (67) (113) (102) -35% -40%
Profit before tax and restructuring costs 59 15 7 731% 271%
Profit after tax and before restr. Costs 57 9 9 496% 503%
Profit after tax 43 2 1 - -
Net interest margin 2.51% 3.33% 2.57% -6 bps -82 bps
Cost-to-Income ratio 46% 46% 51% -5 p.p. -
Cost-to-Income ratio adjusted for the special levy and
SRF contribution 43% 41% 48% -5 p.p. +2 p.p.
Cost of Risk 1.2% 1.3% 1.1% +0.1 p.p -0.1 p.p
Income Statement Review
1) Profit before provisions and impairments, gains/(losses) on derecognition of loans and changes in expected cash flows on acquired loans , restructuring costs and discontinued operations
2) Provisions for impairment of customer loans and gains /(losses) on derecognition of loans and changes in expected cash flows on acquired loans
3) Excludes the impact of any accelerated asset disposals
Key Highlights
21
• NII for 1Q2018 amounted to
€124 mn, compared to €129 mn
for 4Q2017
• Non-interest income of €107
mn, including non recurring
treasury gains of €19 mn, profit
from REMU sales of €11 mn and
a valuation gain of €8 mn
• Provisions for 1Q2018 stood at
€58 mn, with Cost of Risk at 1.2%
• Impairments of other financial
and non-financial assets in
1Q2018 totalled €7 mn,
compared to €27 mn in 4Q2017.
4Q2017 included an additional
impairment loss on legacy
properties in Cyprus and Greece
• Profit after tax of €43 mn for
1Q2018, in line with 2018
Target3
• EPS of 10 cents in 1Q2018

49
133
156
255
192
0
127
127
127
0
153
204
191
191
191
203
224
230
234
234
234
0
97
114
Guidance
22

49
133
156
255
192
0
127
127
127
0
153
204
191
191
191
203
224
230
234
234
234
0
97
114 Type
Key performance
indicators Dec-17 Mar-186
2018
Target
(excluding impact of any
accelerated asset disposals)6
Medium Term
Guidance
(excluding impact of any
accelerated asset disposals)6
Asset
quality
NPEs ratio 47% 45% <40%, ~ €2 bn organic reduction <25%
NPEs coverage ratio 48% 51% >50% >50%
Cost of Risk1 4.0%1 1.2% <1.0% <1.0%
Capital
CET1 ratio 12.7% 12.0% >13%2,4 >13%2,4
Total capital ratio 14.2% 13.5% >15%2,4 >15%2,4
Profitability
Total Income €907 mn €231 mn >€800 mn
Total income to grow in excess of
cost3
Cost to income ratio 47%5 46%5 <50%3
Net fee and commission
income/total income 20% 18% >20% >20%
Balance
Sheet Total assets €23.6 bn €23.4 bn ~€23 bn >€25 bn
EPS EPS (cents) (€123.7) 10 ~40
2018 Targets and Medium Target Guidance
23
1) Provisions for impairment of customer loans and gains /(losses) on derecognition of loans and changes in expected cash flows on acquired loans over average gross loans. An amount of c.€500 mn
reflecting the one-off effect of the change in the provisioning assumptions in FY2017 is included in the cost of risk.
2) Allowing for IFRS 9 transitional arrangements for regulatory capital purposes in line with European Union Regulation (2018: 5%, 2019: 15%, 2020: 30%, 2021: 50% and 2022: 75%)
3) Target excluding special levy and SRF contribution
4) Including the impact of the adoption of the changes aligning the EBA CRR default definition with the NPE definition
5) Adjusted for the special levy and SRF contribution, the cost to income ratio for FY2017 was 44% and for 1Q2018 was 43%
6) The Group’s financial results for the 1Q2018 and all targets and guidance do not include any material impact from any accelerated asset disposals. The financial results of subsequent quarters may
be affected, as transaction execution and any financial consequences become more certain.

Credit Ratings:
Standard & Poor’s Global Ratings:
Long-term issuer credit rating: Assigned at B on 23 October 2017 (positive outlook)
Short-term issuer credit rating: Assigned at B on 23 October 2017
Fitch Ratings:
Long-term Issuer Default Rating: Affirmed at “B-" on 29 March 2018 (stable outlook)
Short-term Issuer Default Rating: Affirmed at “B" on 29 March 2018
Viability Rating: Affirmed at “b-” on 29 March 2018
Moody’s Investors Service:
Baseline Credit Assessment: Upgraded to caa1 on 23 June 2017
Short-term deposit rating: Affirmed at "Not Prime" on 23 June 2017
Long-term deposit rating: Upgraded to Caa1 on 23 June 2017(positive outlook)
Counterparty Risk Assessment: Assigned at B1(cr) / Not-Prime (cr) on 23 June 2017
Listing:
LSE – BOCH, CSE – BOCH/ΤΡΚΗ, ISIN IE00BD5B1Y92
Visit our website at: www.bankofcyprus.com
Tel: +35722122239, Email: [email protected]
Annita Pavlou Investor Relations Manager, Tel: +357 22 122740, Email: [email protected]
Elena Hadjikyriacou ([email protected]) Marina Ioannou ([email protected])
Styliani Nicolaou ([email protected]) Andri Rousou ([email protected])
Investor Relations
Contacts
Finance Director Eliza Livadiotou, Tel: +35722 122344, Email: [email protected]
Key Information and Contact Details
24

49
133
156
255
192
0
127
127
127
0
153
204
191
191
191
203
224
230
234
234
234
0
97
114
Appendix – Macroeconomic overview
25
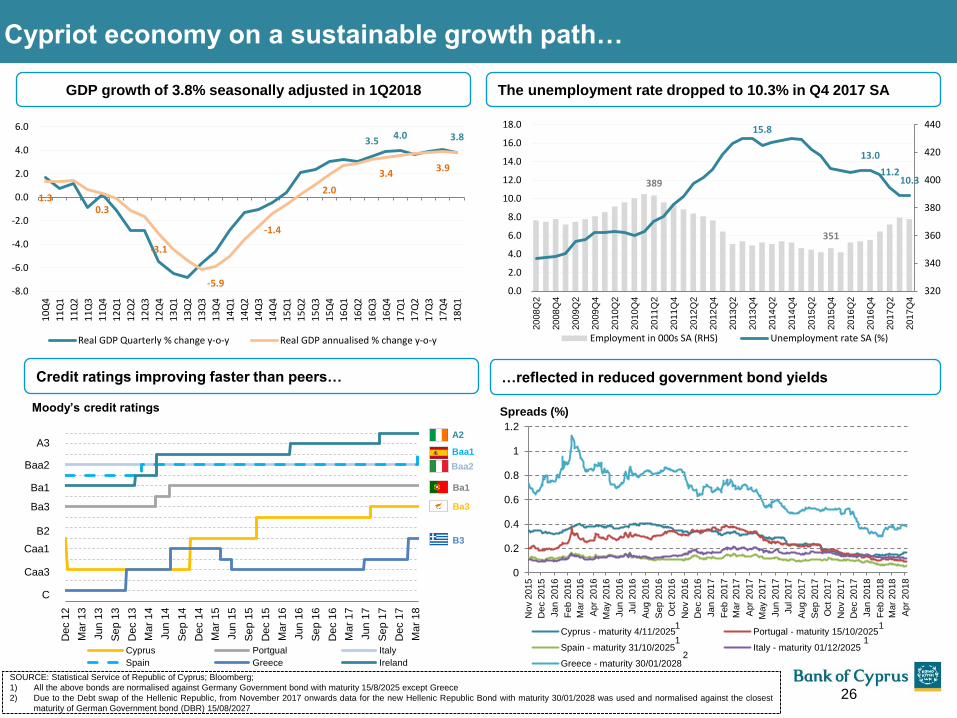
SOURCE: Statistical Service of Republic of Cyprus; Bloomberg;
1) All the above bonds are normalised against Germany Government bond with maturity 15/8/2025 except Greece
2) Due to the Debt swap of the Hellenic Republic, from November 2017 onwards data for the new Hellenic Republic Bond with maturity 30/01/2028 was used and normalised against the closest
maturity of German Government bond (DBR) 15/08/2027
26
Cypriot economy on a sustainable growth path…
A2
Ba3
Ba1
Baa1
B3
Baa2
Ba1
Ba3
B2
Caa1
Caa3
A3
C
Baa2
Moody’s credit ratings
0
0.2
0.4
0.6
0.8
1
1.2
No
v 2
015
De
c 2
015
Ja
n 2
01
6
Feb
20
16
Mar
20
16
Apr
20
16
May 2
01
6
Ju
n 2
01
6
Ju
l 20
16
Aug
2016
Sep
2016
Oct 20
16
No
v 2
016
De
c 2
016
Ja
n 2
01
7
Feb
20
17
Mar
20
17
Apr
20
17
May 2
01
7
Ju
n 2
01
7
Ju
l 20
17
Aug
2017
Sep
2017
Oct 20
17
No
v 2
017
De
c 2
017
Ja
n 2
01
8
Feb
20
18
Mar
20
18
Apr
20
18
Cyprus - maturity 4/11/2025 Portugal - maturity 15/10/2025
Spain - maturity 31/10/2025 Italy - maturity 01/12/2025
Greece - maturity 30/01/2028
1 1
1 1
2
Dec 1
2
Ma
r 1
3
Jun
13
Se
p 1
3
Dec 1
3
Ma
r 1
4
Jun
14
Se
p 1
4
Dec 1
4
Ma
r 1
5
Jun
15
Se
p 1
5
Dec 1
5
Ma
r 1
6
Jun
16
Se
p 1
6
Dec 1
6
Ma
r 1
7
Jun
17
Se
p 1
7
Dec 1
7
Ma
r 1
8
Cyprus Portgual Italy
Spain Greece Ireland
Spreads (%)
3.5 4.0 3.8
1.3 0.3
-3.1
-5.9
-1.4
2.0
3.4 3.9
-8.0
-6.0
-4.0
-2.0
0.0
2.0
4.0
6.0
10
Q4
11
Q1
11
Q2
11
Q3
11
Q4
12
Q1
12
Q2
12
Q3
12
Q4
13
Q1
13
Q2
13
Q3
13
Q4
14
Q1
14
Q2
14
Q3
14
Q4
15
Q1
15
Q2
15
Q3
15
Q4
16
Q1
16
Q2
16
Q3
16
Q4
17
Q1
17
Q2
17
Q3
17
Q4
18
Q1
Real GDP Quarterly % change y-o-y Real GDP annualised % change y-o-y
389
351
15.8
13.0
11.2 10.3
320
340
360
380
400
420
440
0.0
2.0
4.0
6.0
8.0
10.0
12.0
14.0
16.0
18.0
20
08
Q2
20
08
Q4
20
09
Q2
20
09
Q4
20
10
Q2
20
10
Q4
20
11
Q2
20
11
Q4
20
12
Q2
20
12
Q4
20
13
Q2
20
13
Q4
20
14
Q2
20
14
Q4
20
15
Q2
20
15
Q4
20
16
Q2
20
16
Q4
20
17
Q2
20
17
Q4
Employment in 000s SA (RHS) Unemployment rate SA (%)
GDP growth of 3.8% seasonally adjusted in 1Q2018 The unemployment rate dropped to 10.3% in Q4 2017 SA
Credit ratings improving faster than peers… …reflected in reduced government bond yields

2.1 2.2 2.4 2.5 2.4 2.4
2.7
3.2
3.7
0.00
0.50
1.00
1.50
2.00
2.50
3.00
3.50
4.00
2009 2010 2011 2012 2013 2014 2015 2016 2017
27 SOURCES: Statistical Service of Republic of Cyprus, Eurostat; Calculations by BOC Economic Research
…on the back of improving macro fundamentals
Economic activity has been broadly based
with main drivers tourism and construction Tourism arrivals (mn)
1.5
1.9 2.1 2.0 2.1
2.4
2.6
8.0%
9.9%
11.5% 11.5% 11.9% 13.0%
13.7%
2009 2012 2013 2014 2015 2016 2017
€ bn % of GDP
Tourism Revenues
Construction activity - signs of recovery
0.0
0.4
1.2 1.2
0.4
0.1
(0,1)
0.4 0.3
Ag
riculture
Industr
y
Constr
uctio
n
To
ur.
& tra
de
Pro
f. &
ad
min
Info
rma
tio
n
Fin
ancia
l
Pu
bl./e
du/h
ea
lth
Oth
er
Contribution to growth of real GVA 2017 in
percentage points (total 3.9%)
-50.0-40.0-30.0-20.0-10.0
0.010.020.030.040.050.060.0
20
04Q
4
20
05Q
2
20
05Q
4
20
06Q
2
20
06Q
4
20
07Q
2
20
07Q
4
20
08Q
2
20
08Q
4
20
09Q
2
20
09Q
4
20
10Q
2
20
10Q
4
20
11Q
2
20
11Q
4
20
12Q
2
20
12Q
4
20
13Q
2
20
13Q
4
20
14Q
2
20
14Q
4
20
15Q
2
20
15Q
4
20
16Q
2
20
16Q
4
20
17Q
2
20
17Q
4
% changes year-on-year of yearly (4 quarter) moving averages
Production index in construction Building permits volume
33.3%
29.8%
29.0%
25.0%
24.0%
21.0%
19.0%
12.5%
12.5%
Corporate tax rate (2017)
Double taxation
avoidance
treaties with more
than 60 countries
Support from key business enablers
37.9%
39.0%
23.1%
Upper secondary
Less than
Upper secondary
Tertiary
Level of education 2017, age 15-64
Cyprus has the highest number of
university graduates in the population
in the EU after the UK and Ireland

49
133
156
255
192
0
127
127
127
0
153
204
191
191
191
203
224
230
234
234
234
0
97
114
Appendix – Additional asset quality slides
28
As from 1 January 2018 and following IFRS 9 implementation, the Bank’s disclosure in relation to the loan portfolio quality is based on Non Performing
Exposures (NPEs), in line with the EBA standards and ECB NPEs Guidance to the banks. Exposures that meet the NPE definition are considered to be in
default and hence credit-impaired and are classified in Stage 3 under IFRS 9 staging classification. Such loans are also considered to be in default for
credit risk management purposes.

49
133
156
255
192
0
127
127
127
0
153
204
191
191
191
203
224
230
234
234
234
0
97
114
2.7 3.0
2.1 1.7
2.4 2.5
0.3 0.3
1.3 1.3
8.8 8.8
Dec-17 before
RRD reorganisation
Dec-17after
RRD reorganisation
Movement of NPEs
within RRD
Movement of NPEs within business lines following RRD reorganisation
(1) Restructuring and Recoveries Division 29
Group NPEs
Forborne
No impairments
No arrears1,2
Retail NPEs
SMEs NPEs
Corporate
NPEs
No arrears but
impaired NPEs
Total € bn
€+0.1 mn
€-0.4 mn
€+0.3 mn
4Q2017
Reporting as from 31 December 2017 includes transfers within RRD1 business lines following an internal reorganisation of RRD1 in 4Q2017

49
133
156
255
192
0
127
127
127
0
153
204
191
191
191
203
224
230
234
234
234
0
97
114
59%
60
%
80%
77%
86%
63%
64%
48%
62%
74%
71%
77%
NO ARREARS
100%
98%
77
%
80%
71
%
84
%
57
%
94%
8
4%
99%
78%
79%
0%
20%
40%
60%
80%
100%
NO ARREARS
1Q2015 2Q2015 3Q2015 4Q2015 1Q2016 2Q2016 3Q2016 4Q2016 1Q2017 2Q2017 3Q2017 4Q2017
88%
0.69 0.81
1.33 1.50
1.26
0.68 0.53 0.42 0.56
0.24 0.31 0.27
0.4
0.3
0.2 0.2
0.2 0.2
0.2 0.3 0.4
0.3
0.4
0.2 0.2
0.1 0.1
0.1 0.2 0.1
0.7 0.8
1.3
2.2 2.0
1.1 0.9
0.7 0.9
0.5 0.8 0.8
2Q2015 3Q2015 4Q2015 1Q2016 2Q2016 3Q2016 4Q2016 1Q2017 2Q2017 3Q2017 4Q2017 1Q2018
Restructured loans Write offs & non contractual write offs DFAs1
(1) Restructuring activity within quarter as recorded at each quarter end and includes restructurings of 90+ DPD, NPEs, performing loans and re-restructurings
(2) Loans together with the associated provisions are written off when there is no realistic prospect of future recovery. Partial write-offs, including non-contractual write-offs, may occur when it is considered that
there is no realistic prospect for the recovery of the contractual cash flows. In addition, write-offs may reflect restructuring activity with customers and are part of the terms of the agreement and subject to
satisfactory performance.
(3) Restructured loans post 31 December 2013 excluding write offs & non contractual write offs and DFAs and terminated accounts
(4) The performance of loans restructured during 1Q2018 is not presented in this graph as it is too early to assess
(5) Restructuring and Recoveries Division
(6) Write offs in 1Q2018 include a net impact of (c.€11 mn) of IFRS 9 grossing up and set offs.
Restructuring efforts continue; re-default level stable
30
2
Corporate SMEs Retail
64%
71%
75%
74%
71%
65
%
62%
64%
61%
60
%
62
% 7
8%
NO ARREARS
67 %
65%
83%
73%
77%
76%
72%
70%
61%
82%
74%
87%
69%
78%
NO ARREARS
77%
Total Bank – Cyprus
Quarterly evolution of restructuring activity (€ bn) (Cy operations)
Cohort analysis of restructured 3,4 loans; 77% of restructured loans present no arrears
6

49
133
156
255
192
0
127
127
127
0
153
204
191
191
191
203
224
230
234
234
234
0
97
114
62 96 109 103 64
592
73 50 58
38% 39% 40% 41% 42%
48% 49% 48% 51%
0%
10%
20%
30%
40%
50%
60%
1Q2016 2Q2016 3Q2016 4Q2016 1Q2017 2Q2017 3Q2017 4Q2017 1Q2018
Quarterly Provisions for impairment of customer loans (€ mn) NPEs provision coverage1
Adequacy of provisions with NPE provision coverage at 51%
31
Quarter
Gross Contractual
Balance
€ mn
Surplus/(Gap) in
provisions
€ mn
No. of Customers
1Q2015 6.0 1.4 148
2Q2015 79.2 16.0 242
3Q2015 20.2 0.0 441
4Q2015 65.7 -2.1 551
1Q2016 158.3 0.5 1,276
2Q2016 266.9 12.1 2,298
3Q2016 124.5 13.9 115
4Q2016 71.9 -1.1 2,343
1Q2017 119.2 1.1 2,194
2Q2017 200.9 7.5 2,369
3Q2017 75.7 7.8 1,081
4Q2017 137.6 1.8 498
1Q2018 71.7 -3.9 427
1,397.9 55.1 13,983
• Resolution of cases within provisions continued in 1Q2018
• Back-testing of c.14k fully settled exposures over last 13
quarters on average within c.10% surplus over net book
value
1) Provisions for impairment of customer loans and gains/(losses) on derecognition of loans and changes in expected cash flows on acquired loans.
NPE coverage at 51% after IFRS 9 FTA
Back-testing of provisions supports past provision adequacy
49
133
156
255
192
0
127
127
127
0
153
204
191
191
191
203
224
230
234
234
234
0
97
114
Terminated Retail 1.367
Retail 1.389
Terminated SMEs 1.142
SME 1.016
Terminated Corporate
1.205
Corporate 1.875
Mar 2018
NPEs (Cy) €8.00 bn
2.16
2.12
1.96
2.00
1.84
1.84
2.96
0.04
0.17
(0.05)
0.16
(0.72) (0.40)
Mar 18
Inflows
IFRS 9 adjustments
Exits
Dec 17
Inflows
Exits
Dec-16
€3.08 bn
€2.16 bn
€2.76 bn
NPE ratio
3.08
3.26
3.68
3.24
4.51
0.05
(0.23)
(0.42)
0.14
(1.27)
0.3
Mar 18
Inflows
IFRS 9 adjustments
Exits
Dec 17
Inflows
Exits
Dec-16
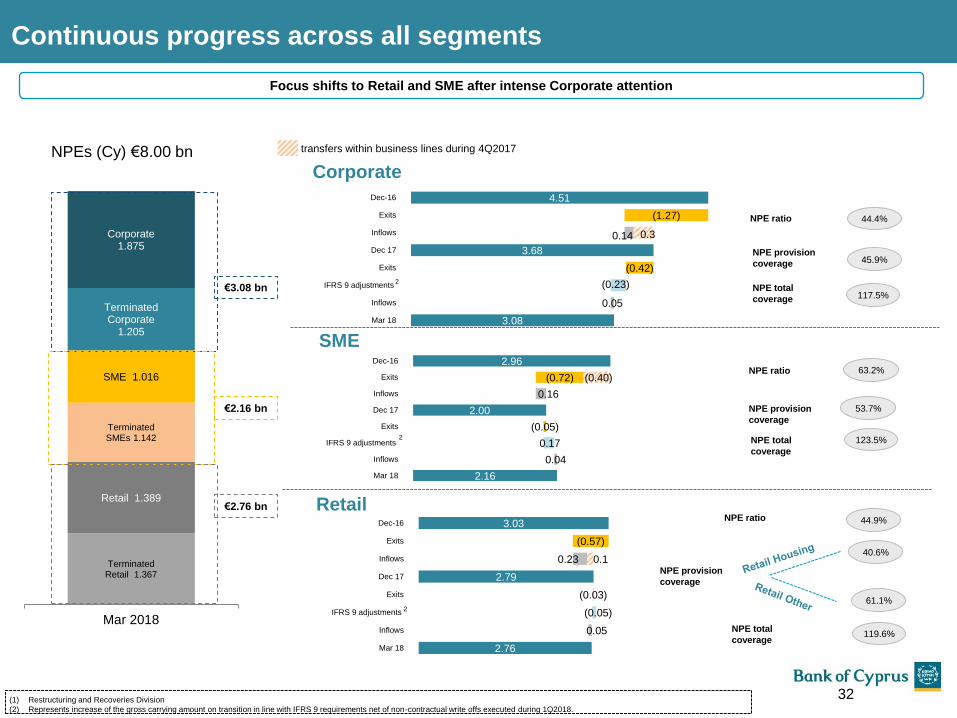
44.4%
NPE ratio 44.9%
NPE ratio 63.2%
Corporate
SME
Retail
NPE provision
coverage 45.9%
61.1%
53.7% NPE provision
coverage
NPE provision
coverage
Continuous progress across all segments
NPE total
coverage 117.5%
NPE total
coverage
123.5%
NPE total
coverage 119.6%
Focus shifts to Retail and SME after intense Corporate attention
40.6%
2.76
2.78
2.79
2.46
3.03
0.05
(0.05)
(0.03)
0.23
(0.57)
0.1
Mar 18
Inflows
IFRS 9 adjustments
Exits
Dec 17
Inflows
Exits
Dec-16
(1) Restructuring and Recoveries Division
(2) Represents increase of the gross carrying amount on transition in line with IFRS 9 requirements net of non-contractual write offs executed during 1Q2018.
transfers within business lines during 4Q2017
32
2
2
2

49
133
156
255
192
0
127
127
127
0
153
204
191
191
191
203
224
230
234
234
234
0
97
114
19.27 18.77 18.27 18.06 17.69 17.41 16.81 16.48
1.18 1.23 1.30 1.44 1.43 1.51 1.62 1.76
0.63 0.60 0.56 0.51 0.38 0.33 0.32 0.35
21.08 20.60 20.13 20.01 19.50 19.25 18.75 18.59
Jun-16 Sep-16 Dec-16 Mar-17 Jun-17 Sep 17 Dec 17 Mar-18
Other countries
UK
Cyprus
1
Total
(€ bn)
Gross loans by Geography and by Customer Type
88.7%
1.8% 9.5%
Cyprus UK Other countries2
10.13 9.78 9.47 9.35 9.14 9.04 9.01 8.65
4.55 4.47 4.35 4.29 4.15 4.03 3.51 3.66
4.27 4.24 4.22 4.19 4.15 4.12 4.17 4.27
2.13 2.11 2.09 2.19 2.06 2.06 2.06 2.01
21.08 20.60 20.13 20.01 19.50 19.25 18.75 18.59
Jun-16 Sep-16 Dec-16 Mar-17 Jun-17 Sep-17 Dec-17 Mar-18
Retail other
Retail Housing
SMEs
Corporate
(€ bn)
Total
46.5%
19.7%
23.0%
10.8%
Corporate SME
Retail Housing Retail Other
33
Gross loans by geography 31 March 2018 (%)
Gross loans by customer type 31 March 2018 (%)
1) Other countries: Greece, Russia and Romania
2) Reporting as at 31 December 2017 includes transfers within Restructuring and Recoveries Division (RRD) business lines following an internal reorganisation of RRD in 4Q2017
2

49
133
156
255
192
0
127
127
127
0
153
204
191
191
191
203
224
230
234
234
234
0
97
114
11.87 10.50 9.89 9.35 8.81 8.47 8.00
0.05
0.02 0.02 0.02
0.02 0.02 0.01
0.57
0.51 0.46
0.38 0.33
0.31 0.34
12.49
11.03 10.37
9.75 9.16 8.80
8.35
Jun-16 Dec-16 Mar-17 Jun-17 Sep 17 Dec 17 Mar 18
Other countries
UK
Cyprus
1
NPEs by geography
Total
(€ bn)
1) Other countries: Greece, Russia and Romania
2) Reporting from 31 December 2017 includes transfers within Restructuring and Recoveries Division (RRD) business lines following an internal reorganisation of RRD in 4Q2017
NPEs by Geography and by Customer Type
95.8%
0.1% 4.1%
Cyprus UK Other countries1
40.8%
26.1%
19.1%
14.0%
Corporate SME
Retail Housing Retail Other
5.98 5.00 4.53 4.13 3.81 3.99 3.41
3.25
2.99 2.88
2.70 2.54 2.02 2.18
1.93
1.77 1.72
1.69 1.61 1.57 1.59
1.33
1.27 1.24
1.23 1.20 1.22 1.17
12.49
11.03 10.37
9.75 9.16 8.80
8.35
Jun-16 Dec-16 Mar-17 Jun-17 Sep 17 Dec 17 Mar 18
Retail Other
Retail Housing
SMEs
Corporate
Total
(€ bn)
34
31 March 2018 (%)
31 March 2018 (%)
NPEs by customer type
2
49
133
156
255
192
0
127
127
127
0
153
204
191
191
191
203
224
230
234
234
234
0
97
114
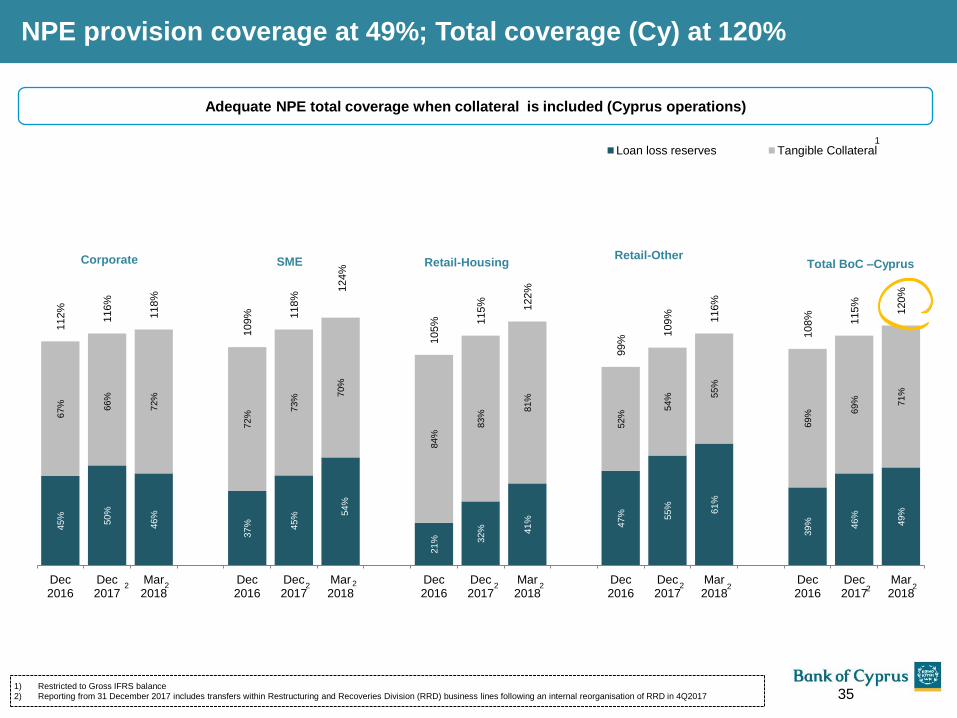
NPE provision coverage at 49%; Total coverage (Cy) at 120%
35
45%
50%
46%
37%
45%
54%
21%
32%
41%
47%
55%
61%
39%
46%
49%
67%
66%
72%
72%
73%
70%
84%
83%
81%
52%
54%
55%
69%
69%
71%
112%
116%
118%
109%
118%
124%
105%
115%
122%
99%
109%
116%
108%
115%
120%
Dec2016
Dec2017
Mar2018
Dec2016
Dec2017
Mar2018
Dec2016
Dec2017
Mar2018
Dec2016
Dec2017
Mar2018
Dec2016
Dec2017
Mar2018
Loan loss reserves Tangible Collateral
Total BoC –Cyprus Corporate SME Retail-Housing Retail-Other
1
1) Restricted to Gross IFRS balance 2) Reporting from 31 December 2017 includes transfers within Restructuring and Recoveries Division (RRD) business lines following an internal reorganisation of RRD in 4Q2017
2 2 2 2 2
Adequate NPE total coverage when collateral is included (Cyprus operations)
2 2 2 2 2

49
133
156
255
192
0
127
127
127
0
153
204
191
191
191
203
224
230
234
234
234
0
97
114
Asset Quality- NPEs analysis
(€ mn) Mar-18
Dec-17 Sep-17 Jun-17 Mar-17
A. Gross Loans after Fair value on Initial recognition 18,020 18,087 18,532 18,693 19,142
Fair value on Initial recognition 566 668 721 812 869
B. Gross Loans 18,586 18,755 19,253 19,505 20,011
B1. Loans with no arrears 9,922 9,565 9,645 9,537 9,269
B2. Loans with arrears but not NPEs 315 386 444 396 370
1-30 DPD 229 312 371 325 287
31-90 DPD 86 74 73 71 83
B3. NPEs 8,349 8,804 9,164 9,752 10,372
With no arrears 1,951 2,033 1,876 2,139 2,167
Up to 30 DPD 155 197 209 201 235
31-90 DPD 296 211 254 270 392
91-180 DPD 168 151 177 262 215
181-365 DPD 242 324 359 292 244
Over 1 year DPD 5,537 5,888 6,289 6,588 7,119
NPE ratio (NPEs / Gross Loans) 45% 47% 48% 50% 52%
Accumulated provisions (including fair value adjustment on
initial recognition1 ) 4,245 4,204 4,470 4,638 4,334
Gross loans provision coverage 23% 22% 23% 24% 22%
NPEs provision coverage 51% 48% 49% 48% 42%
1) Comprise (i) provisions for impairment of customer loans and advances, (ii) the fair value adjustment on initial recognition of loans acquired from Laiki Bank and on loans classified at FVPL,
and (iii) provisions for off-balance sheet exposures disclosed on the balance sheet within other liabilities. 36

49
133
156
255
192
0
127
127
127
0
153
204
191
191
191
203
224
230
234
234
234
0
97
114
21%
31%
35%
42%
68%
81%
93%
100%
100%
20%
29%
35%
41%
73%
80%
91%
100%
100%
18%
25%
31%
38%
75%
71%
89%
100%
100%
18%
24%
30%
34%
73%
70%
87%
100%
100%
14%
21%
20%
27%
72%
70%
84%
99%
100%
100%
12%
15%
17%
24%
68%
68%
83%
99%
100%
100%
12%
12%
16%
24%
69%
82%
82%
98%
100%
100%
12%
12%
15%
24%
72%
83%
83%
98%
100%
100%
Corporate SMEs Housing Consumer Credit RRD-MidCorporates
RRD-MajorCorporations
RRD-SMEs RRD-Retail RRD-Recoveriescorporates
RRD-RecoveriesSMEs and Retail
30.06.16 30.09.16 31.12.16 31.03.17 30.06.17 30.09.17 31.12.17 31.03.18
4.1
0
1.7
4
3.6
1
1.3
8
1.3
7 2
.53
1.3
0 2.1
3
2.9
2
4.3
1
1.7
1
3.5
8
1.3
6
1.0
9 2
.34
1.2
6
2.0
4 2.9
1
4.4
0
1.6
2
3.5
4
1.3
4
1.0
1 2
.12
1.2
2
1.9
5 2.9
3
5.0
2
1.6
4
3.5
1
1.4
4
0.9
5
1.5
2
1.1
9
1.8
6 2.8
8
5.0
2
1.5
9
3.0
9
1.1
2
0.9
2
1.5
0
1.1
5
0.5
9 1
.71 2
.81
5.0
9
1.5
1
3.0
2
1.1
2
0.8
5
1.4
6
1.1
8
0.6
7 1.6
4 2.7
1
5.1
7
1.4
7
3.0
8
1.1
0
0.7
8
1.3
3
1.0
9
0.6
6 1.7
3
2.3
4
5.4
8
1.4
7
3.1
4
1.1
1
0.7
4
1.2
1
1.0
5
0.6
6
1.2
2 2
.51
Corporate SMEs Housing Consumer Credit RRD-MidCorporates
RRD-MajorCorporations
RRD-SMEs RRD-Retail RRD-Recoveriescorporates
RRD-RecoveriesSMEs and Retail
30.06.16 30.09.16 31.12.16 31.03.17 30.06.17 30.09.17 31.12.17 31.03.18
% of total
1) As part of the restructuring of the Group, management is currently monitoring the loan portfolio of the Group using new business line definitions. An important component of the
Group’s new operational structure is the establishment of the RRD for the purposes of centralising and streamlining the management of its delinquent loans
2) Reporting as at 31 December 2017 includes transfers within RRD business lines following an internal reorganisation of RRD in 4Q2017
3) New business lines established in April 2017. RRD-Retail includes RRD Retail Housing and Retail Other
28% 8% 17% 4% 7% 6%
Analysis of Loans and NPEs ratios by Business Line1
6% 6% 14%
37
4%
3
3
Gross loans by business line2 (€ bn)
NPEs ratios by business line2

49
133
156
255
192
0
127
127
127
0
153
204
191
191
191
203
224
230
234
234
234
0
97
114
53%
64%
57%
82%
51%
52%
65%
64%
52%
61%
57%
81%
49%
52%
58%
64%
52%
58%
52%
77%
44%
50%
58%
63%
49%
58%
51%
72%
38%
48%
56%
67%
49%
55%
38%
73%
36%
48%
54%
59%
45%
54%
34%
71%
34%
47%
51%
54%
45%
53%
32%
76%
33%
45%
52%
51%
43%
53%
27%
73%
31%
44%
51%
50%
30.06.16 30.09.16 31.12.16 31.03.17 30.06.17 30.09.17 31.12.17 31.03.18
Trade Manufacturing Hotels &
Restaurants
Construction Real estate Private
Individuals Professional &
other services Other sectors
Analysis of Loans and NPEs ratios by Economic Activity
38
2.2
6
0.8
2
1.4
7 3
.92
3.3
2
7.2
5
1.6
4
1.1
7
2.2
3
0.8
0
1.4
5 3.4
3
3.3
3
7.1
7
1.5
5
1.1
2
2.1
9
0.7
1
1.4
2 3.2
2
3.3
0
7.1
1
1.4
8
1.1
7
2.1
2
0.7
0
1.4
2
2.9
7
3.3
0
7.0
3
1.5
0
1.0
9
2.1
6
0.7
0
1.4
2
2.8
8
3.3
6
7.0
9
1.4
7
0.9
3
2.1
4
0.6
9
1.5
2
2.6
1
3.2
8
6.8
8
1.3
7
1.0
1
2.1
2
0.6
8
1.4
5
2.5
0
3.2
4
6.8
3
1.3
3
1.1
0
2.0
4
0.6
6
1.3
9
2.3
4
3.2
0
6.7
7
1.3
1
1.0
4
2.0
2
0.6
8
1.4
0
2.1
1
3.2
9
6.8
2
1.2
3
1.0
4
31.03.16 31.06.16 30.09.16 31.12.16 31.03.17 30.06.17 30.09.17 31.12.17 31.03.18
Trade Manufacturing Hotels &
Restaurants Construction Real estate
Private
Individuals
Professional &
other services Other sectors
16% 11% 35% 7% 6% % of
total 15% 7% 3% 18% 11% 36% 7% 6%
% of
total 11% 7% 4%
Gross loans by economic activity (€ bn)
NPEs ratios by economic activity

49
133
156
255
192
0
127
127
127
0
153
204
191
191
191
203
224
230
234
234
234
0
97
114
Rescheduled Loans for the Cyprus Operations
4.0 3.8 3.4 3.2 3.2 3.0 3.0 2.7
1.8 1.7 1.7 1.6 1.6 1.6 1.3 1.3
0.6 0.6 0.6 0.6 0.5 0.6 0.6
0.5
1.7 1.7 1.7 1.7 1.6 1.5
1.4 1.4
8.1 7.8 7.4 7.1 6.9 6.7
6.3 5.9
30.06.16 30.09.16 31.12.16 31.03.17 30.06.17 30.09.17 31.12.17 31.03.18
Retail housing Retail consumer SMEs Corporate
1) Reporting as at 31 December 2017 includes transfers within RRD business lines following an internal reorganisation of RRD in 4Q2017
2) Gross loans are reported before the fair value adjustment on initial recognition relating to loans acquired from Laiki Bank (calculated as the difference between the outstanding contractual
amount and the fair value of loans acquired) and on loans classified at FVPL, amounting to €566 mn at 31 March 2018 and to €286 mn for rescheduled loans (compared to €668 mn and €312
mn respectively at 31 December 2017), including loans of discontinued operations/disposal group held for sale
47%
41%
41%
27%
46%
41%
42%
28%
44%
41%
40%
27%
42%
41%
39%
26%
42%
42%
38%
27%
41%
42%
37%
26%
40%
40%
35%
27%
39%
38%
33%
27%
Corporate SMES Retail housing Retail Consumer
30.06.16 30.09.16 31.12.16 31.03.17 30.06.17 30.09.17 31.12.17 31.03.18
39
Rescheduled Loans1 by customer type (€ bn)
Rescheduled loans1 % gross loans2 by customer type
49
133
156
255
192
0
127
127
127
0
153
204
191
191
191
203
224
230
234
234
234
0
97
114
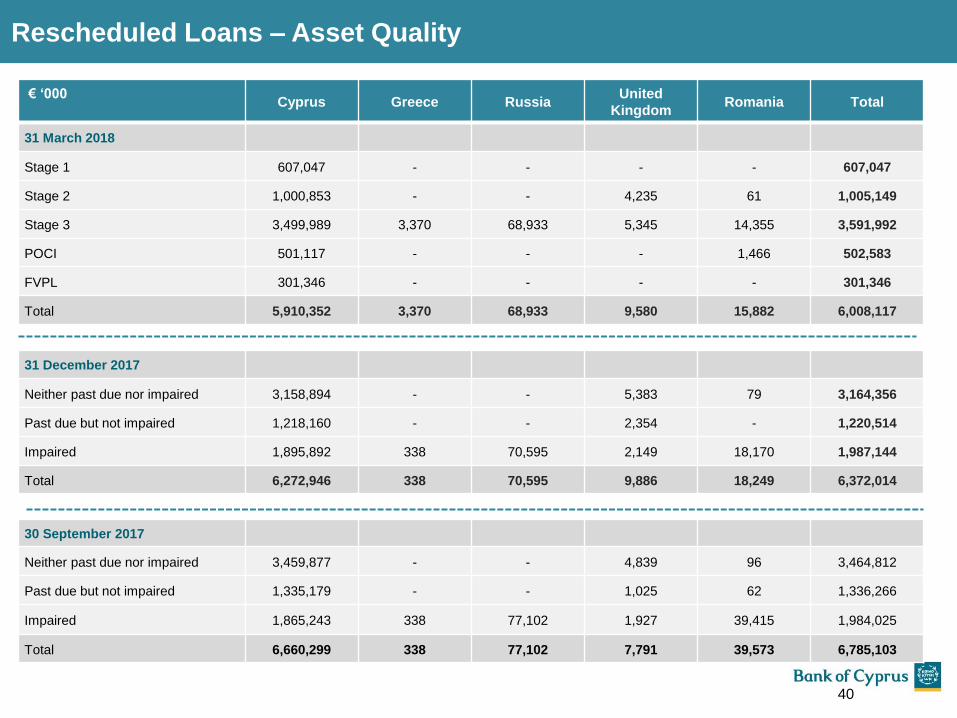
Rescheduled Loans – Asset Quality
40
€ ‘000 Cyprus Greece Russia
United
Kingdom Romania Total
31 March 2018
Stage 1 607,047 - - - - 607,047
Stage 2 1,000,853 - - 4,235 61 1,005,149
Stage 3 3,499,989 3,370 68,933 5,345 14,355 3,591,992
POCI 501,117 - - - 1,466 502,583
FVPL 301,346 - - - - 301,346
Total 5,910,352 3,370 68,933 9,580 15,882 6,008,117
31 December 2017
Neither past due nor impaired 3,158,894 - - 5,383 79 3,164,356
Past due but not impaired 1,218,160 - - 2,354 - 1,220,514
Impaired 1,895,892 338 70,595 2,149 18,170 1,987,144
Total 6,272,946 338 70,595 9,886 18,249 6,372,014
30 September 2017
Neither past due nor impaired 3,459,877 - - 4,839 96 3,464,812
Past due but not impaired 1,335,179 - - 1,025 62 1,336,266
Impaired 1,865,243 338 77,102 1,927 39,415 1,984,025
Total 6,660,299 338 77,102 7,791 39,573 6,785,103

49
133
156
255
192
0
127
127
127
0
153
204
191
191
191
203
224
230
234
234
234
0
97
114
1,641
1.554 1.549 1.549 1,552
134
(55)
(166)
(5) 3
Stock as at 31 Dec 2017 Additions Sales Transfer to InvestmentProperties
Impairment loss Foreign exchange andother movements
Stock as at 31 March2018
€ mn
BV1
159 229 94 57 566 265 60 122
Residential Offices and other commercial properties Manufacturing and industrial Hotels Land and Plots Golf Under construction Greece and Romania
€ mn
Assets #
Total
1) BV= Book value = Carrying value prior to the sale of property
2) Total stock as at 31 March 2018 excludes investment properties and investment properties held for sale
3) Assets in REMU on boarded at conservative prices c.25%-30% discount to open market value (OMV)
REMU – the engine for dealing with foreclosed assets
2,3
41
Cyprus: €1,552 mn
€1,552 mn
#2,640
#1261 #45 #487 #195 #3 #10 #43 #596
REMU focus now on sales (Group)
Property stock split as at 31 March 2018– on boarded at conservative carrying value3 (Group)

49
133
156
255
192
0
127
127
127
0
153
204
191
191
191
203
224
230
234
234
234
0
97
114
SOURCE: Central Bank of Cyprus, Cyprus Land Registry
REMU – the engine for dealing with foreclosed assets
42
48 46
16
56
110
40
64 60 55
27
1Q2016 2Q2016 3Q2016 4Q2016 1Q2017 2Q2017 3Q2017 4Q2017 1Q2018 post1Q2018
82
16
11
7
48
0%
20%
40%
60%
80%
100%
Total Sales(2018 YTD)
Hotels Commercial Residential Land
Hotels Commercial Residential Land
2018 ytd
€82 mn
Encouraging trends in Real Estate Market; Property prices up 1.5% yoy; Sale contracts (excluding DFAS) up 38% yoy
12.664
21.245
3.767 4.527
4.952 7.063
8.734
2.784
0
5.000
10.000
15.000
20.000
25.000
30.000
20
00
20
01
20
02
20
03
20
04
20
05
20
06
20
07
20
08
20
09
20
10
20
11
20
12
20
13
20
14
20
15
20
16
20
17
20
18
Jan
-Ap
r
Sales to Cypriots Sales to Non-Cypriots
Sales contracts – Excluding DFAs
73.2 74.6
0.2 1.1 1.4
1.5
-10.0
-8.0
-6.0
-4.0
-2.0
0.0
2.0
4.0
30.0
50.0
70.0
90.0
110.0
201
0Q1
201
0Q2
201
0Q3
201
0Q4
201
1Q1
201
1Q2
201
1Q3
201
1Q4
201
2Q1
201
2Q2
201
2Q3
201
2Q4
201
3Q1
201
3Q2
201
3Q3
201
3Q4
201
4Q1
201
4Q2
201
4Q3
201
4Q4
201
5Q1
201
5Q2
201
5Q3
201
5Q4
201
6Q1
201
6Q2
201
6Q3
201
6Q4
201
7Q1
201
7Q2
201
7Q3
201
7Q4
Central Bank Residential Property Price index
Residential Propert Price index (2010Q1=100) % change y-o-y (RHS)
Book Value sales by type (Group) Book Value Sales of €82 mn in 2018 (Group)
(1) 2Q2017 sales include a disposal of a property (€10 mn) which was classified in investment properties held for disposal
(2) 4Q2017 sales include a disposal of a property (€7.5 mn) which was classified in investment properties held for disposal
1 2

49
133
156
255
192
0
127
127
127
0
153
204
191
191
191
203
224
230
234
234
234
0
97
114 Loans and advances to customers
31 Mar 2018
(€ mn)
Cash 361
Securities 272
Letters of credit / guarantee 249
Property 21,505
Other 900
Surplus collateral (10,309)
Net collateral 12,978
Fair value of collateral and credit enhancements held by the Group
43

49
133
156
255
192
0
127
127
127
0
153
204
191
191
191
203
224
230
234
234
234
0
97
114
Appendix – Additional financial information
44

49
133
156
255
192
0
127
127
127
0
153
204
191
191
191
203
224
230
234
234
234
0
97
114
Assets (€ mn) %
change 31.03.18 31.12.17
Cash and balances with
Central Banks -3% 3,281 3,394
Loans and advances to
banks 18% 1,413 1,193
Debt securities, treasury bills
and equity investments -12% 988 1,121
Net loans and advances to
customers -2% 14,373 14,602
Stock of property -5% 1,552 1,641
Other assets 10% 1,806 1,648
Total assets -1% 23,413 23,599
Liability and Equity (€ mn) %
change 31.03.18 31.12.17
Deposits by banks -12% 436 495
Funding from central banks 1% 940 930
Repurchase agreements 1% 260 257
Customer deposits 1% 17,996 17,850
Subordinated loan stock -6% 286 302
Other liabilities 1% 1,154 1,148
Total liabilities 0% 21,072 20,982
Shareholders’ equity -11% 2,298 2,586
Non controlling interests 38% 43 31
Total equity -11% 2,341 2,617
Total liabilities and equity -1% 23,413 23,599
Consolidated Balance Sheet
45
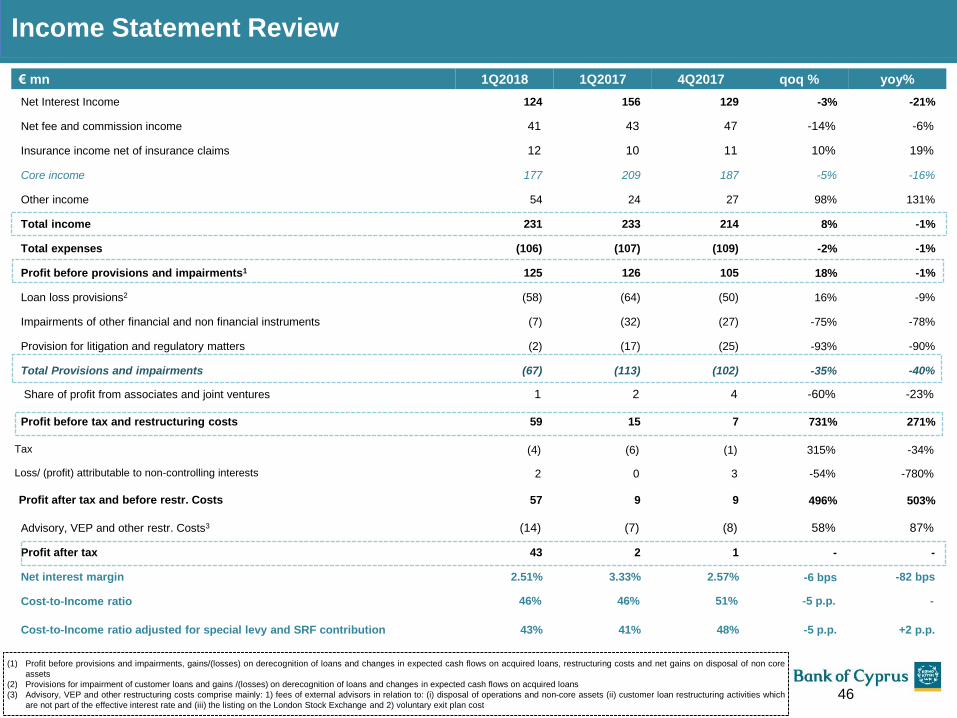
49
133
156
255
192
0
127
127
127
0
153
204
191
191
191
203
224
230
234
234
234
0
97
114
€ mn 1Q2018 1Q2017 4Q2017 qoq % yoy%
Net Interest Income 124 156 129 -3% -21%
Net fee and commission income 41 43 47 -14% -6%
Insurance income net of insurance claims 12 10 11 10% 19%
Core income 177 209 187 -5% -16%
Other income 54 24 27 98% 131%
Total income 231 233 214 8% -1%
Total expenses (106) (107) (109) -2% -1%
Profit before provisions and impairments1 125 126 105 18% -1%
Loan loss provisions2 (58) (64) (50) 16% -9%
Impairments of other financial and non financial instruments (7) (32) (27) -75% -78%
Provision for litigation and regulatory matters (2) (17) (25) -93% -90%
Total Provisions and impairments (67) (113) (102) -35% -40%
Share of profit from associates and joint ventures 1 2 4 -60% -23%
Profit before tax and restructuring costs 59 15 7 731% 271%
Tax (4) (6) (1) 315% -34%
Loss/ (profit) attributable to non-controlling interests 2 0 3 -54% -780%
Profit after tax and before restr. Costs 57 9 9 496% 503%
Advisory, VEP and other restr. Costs3 (14) (7) (8) 58% 87%
Profit after tax 43 2 1 - -
Net interest margin 2.51% 3.33% 2.57% -6 bps -82 bps
Cost-to-Income ratio 46% 46% 51% -5 p.p. -
Cost-to-Income ratio adjusted for special levy and SRF contribution 43% 41% 48% -5 p.p. +2 p.p.
Income Statement Review
46
(1) Profit before provisions and impairments, gains/(losses) on derecognition of loans and changes in expected cash flows on acquired loans, restructuring costs and net gains on disposal of non core
assets
(2) Provisions for impairment of customer loans and gains /(losses) on derecognition of loans and changes in expected cash flows on acquired loans
(3) Advisory, VEP and other restructuring costs comprise mainly: 1) fees of external advisors in relation to: (i) disposal of operations and non-core assets (ii) customer loan restructuring activities which
are not part of the effective interest rate and (iii) the listing on the London Stock Exchange and 2) voluntary exit plan cost
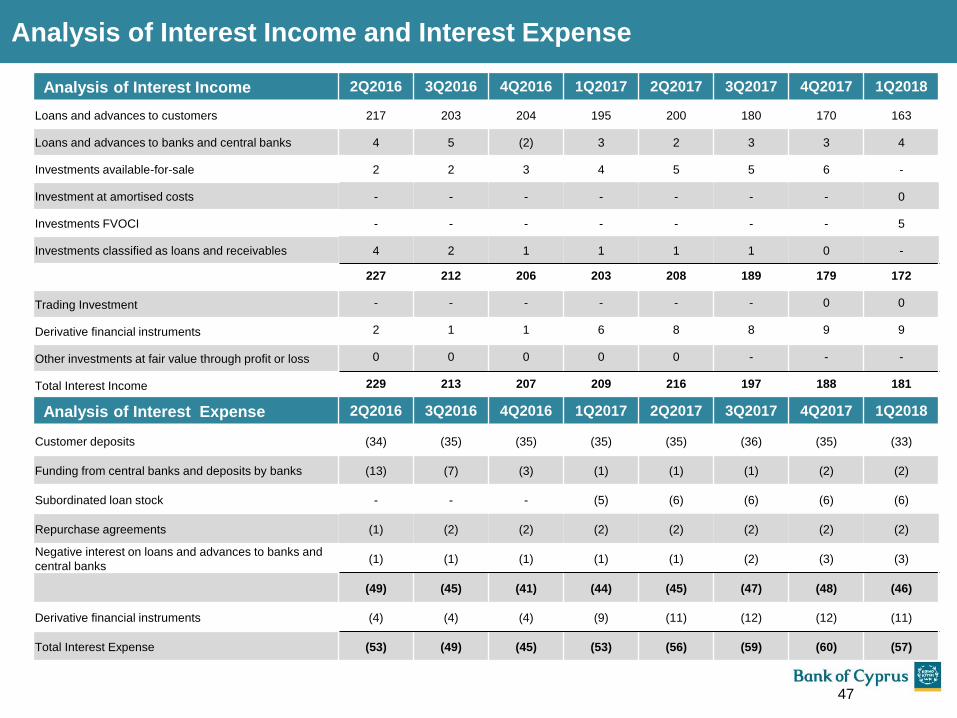
49
133
156
255
192
0
127
127
127
0
153
204
191
191
191
203
224
230
234
234
234
0
97
114
Analysis of Interest Income and Interest Expense
47
Analysis of Interest Income 2Q2016 3Q2016 4Q2016 1Q2017 2Q2017 3Q2017 4Q2017 1Q2018
Loans and advances to customers 217 203 204 195 200 180 170 163
Loans and advances to banks and central banks 4 5 (2) 3 2 3 3 4
Investments available-for-sale 2 2 3 4 5 5 6 -
Investment at amortised costs - - - - - - - 0
Investments FVOCI - - - - - - - 5
Investments classified as loans and receivables 4 2 1 1 1 1 0 -
227 212 206 203 208 189 179 172
Trading Investment - - - - - - 0 0
Derivative financial instruments 2 1 1 6 8 8 9 9
Other investments at fair value through profit or loss 0 0 0 0 0 - - -
Total Interest Income 229 213 207 209 216 197 188 181
Analysis of Interest Expense 2Q2016 3Q2016 4Q2016 1Q2017 2Q2017 3Q2017 4Q2017 1Q2018
Customer deposits (34) (35) (35) (35) (35) (36) (35) (33)
Funding from central banks and deposits by banks (13) (7) (3) (1) (1) (1) (2) (2)
Subordinated loan stock - - - (5) (6) (6) (6) (6)
Repurchase agreements (1) (2) (2) (2) (2) (2) (2) (2)
Negative interest on loans and advances to banks and
central banks (1) (1) (1) (1) (1) (2) (3) (3)
(49) (45) (41) (44) (45) (47) (48) (46)
Derivative financial instruments (4) (4) (4) (9) (11) (12) (12) (11)
Total Interest Expense (53) (49) (45) (53) (56) (59) (60) (57)
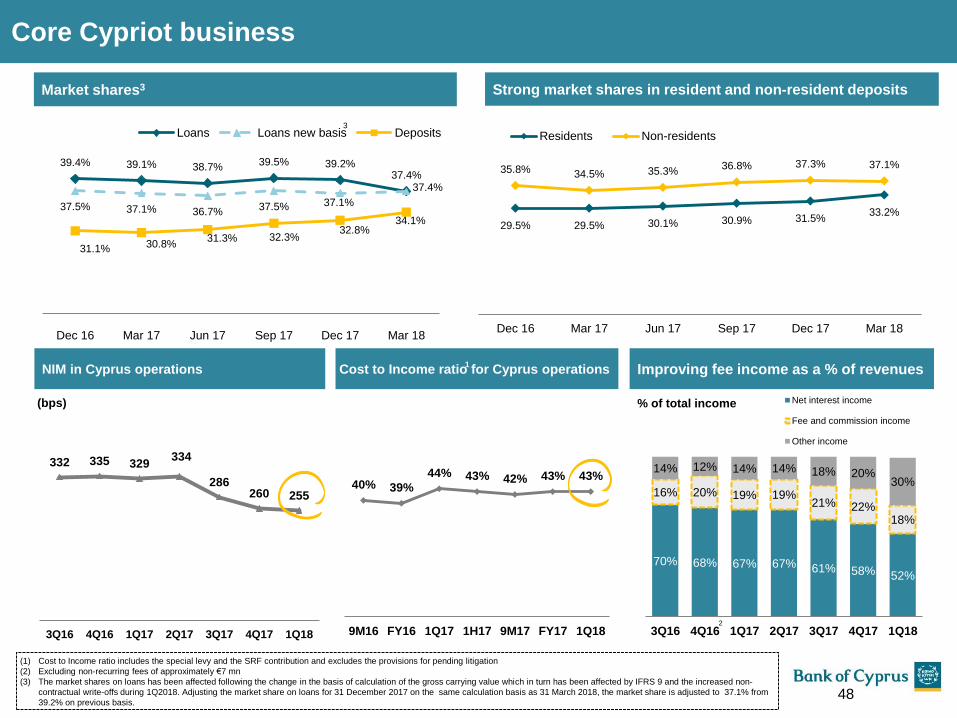
49
133
156
255
192
0
127
127
127
0
153
204
191
191
191
203
224
230
234
234
234
0
97
114
39.4% 39.1% 38.7% 39.5% 39.2%
37.4%
37.5% 37.1% 36.7% 37.5% 37.1%
37.4%
31.1% 30.8% 31.3% 32.3%
32.8% 34.1%
Dec 16 Mar 17 Jun 17 Sep 17 Dec 17 Mar 18
Loans Loans new basis Deposits
Core Cypriot business
48
(1) Cost to Income ratio includes the special levy and the SRF contribution and excludes the provisions for pending litigation
(2) Excluding non-recurring fees of approximately €7 mn
(3) The market shares on loans has been affected following the change in the basis of calculation of the gross carrying value which in turn has been affected by IFRS 9 and the increased non-
contractual write-offs during 1Q2018. Adjusting the market share on loans for 31 December 2017 on the same calculation basis as 31 March 2018, the market share is adjusted to 37.1% from
39.2% on previous basis.
NIM in Cyprus operations Cost to Income ratio for Cyprus operations
332 335 329 334
286 260 255
3Q16 4Q16 1Q17 2Q17 3Q17 4Q17 1Q18
40% 39%
44% 43% 42% 43% 43%
9M16 FY16 1Q17 1H17 9M17 FY17 1Q18
(bps)
70% 68% 67% 67% 61% 58% 52%
16% 20% 19% 19% 21% 22%
18%
14% 12% 14% 14% 18% 20% 30%
3Q16 4Q16 1Q17 2Q17 3Q17 4Q17 1Q18
Net interest income
Fee and commission income
Other income
% of total income
Improving fee income as a % of revenues
2
1
Market shares3 Strong market shares in resident and non-resident deposits
29.5% 29.5% 30.1% 30.9% 31.5% 33.2%
35.8% 34.5% 35.3% 36.8% 37.3% 37.1%
Dec 16 Mar 17 Jun 17 Sep 17 Dec 17 Mar 18
Residents Non-residents3

49
133
156
255
192
0
127
127
127
0
153
204
191
191
191
203
224
230
234
234
234
0
97
114
€ mn Underlying basis Reclassification Statutory Basis
Net interest income 124 (1) 123
Net fee and commission income 41 41
Net foreign exchange gains and net gains on other financial instruments and disposal/ dissolution of
subsidiaries 29 (2) 27
Insurance income net of insurance claims 12 12
Net gains from revaluations/disposals of investment properties 19 19
Other income 6 6
Total income 231 (3) 228
Total expenses (106) (16) (122)
Profit before provisions and impairments, gains/(losses) on derecognition of loans and
changes in expected cash flows and restructuring costs 125 (19) 106
Provisions for impairment of customer loans and Gains on derecognition of loans and changes in
expected cash flows (58) 3 (55)
Impairments of other financial and non-financial assets (7) (7)
Provision for litigation and regulatory matters (2) 2 -
Share of profit from associates 1 1
Profit before tax, restructuring costs and discontinued operations 59 (14) 45
Tax (4) (4)
Loss attributable to non-controlling interests 2 2
Profit after tax and before restructuring costs, discontinued operations and net profit from
disposal of non-core assets 57 (14) 43
Advisory and other restructuring costs2 (14) 14 -
Profit after tax 43 43
Income Statement bridge1 for 1Q2018
(1) The reclassification differences between the underlying and statutory bases relate to: €1mn net interest income from FVPL financial instruments not disclosed within net interest income per IFRS 9 on
the statutory basis, €3 mn fair value changes on FVPL financial instruments disclosed within net income/gains on financial instruments on the statutory basis and €16 mn expenses (€2 mn relate to
Provisions for litigation and regulatory matters and €14 mn relate to Advisory and other restructuring costs), which are monitored and reported below the operating profit for management reporting
purposes.
(2) Advisory and other restructuring costs comprise mainly: 1) fees of external advisors in relation to: (i) customer loan restructuring activities which are not part of the effective interest rate and (ii) the
listing on the London stock exchange 49

49
133
156
255
192
0
127
127
127
0
153
204
191
191
191
203
224
230
234
234
234
0
97
114
€ mn Consumer
Banking
SME
Banking
Corporate
Banking
International
Banking
Wealth &
Markets RRD REMU Insurance Other
Total
Cyprus
Net interest income 48 10 25 14 2 28 (5) 0 (6) 116
Net fee & commission income 12 3 4 15 1 2 0 (1) 3 39
Other income 1 0 0 2 1 0 24 11 26 65
Total income 61 13 29 31 4 30 19 10 23 220
Total expenses (27) (3) (3) (7) (1) (9) (1) (4) (40) (95)
Profit/(loss) before provisions
and impairments 34 10 26 24 3 21 18 6 (17) 125
Provisions for impairment of
customer loans net of
gains/(losses) on derecognition
of loans and changes in
expected cash flows
(1) (5) 3 (3) (2) (51) - 0 1 (58)
Impairment of other financial
and non financial instruments - - - - - - (3) - (2) (5)
Provision for litigation and
regulatory matters - - - - - - - - (1) (1)
Share of profits from associates - - - - - - - - 1 1
Profit/(loss) before tax 33 5 29 21 1 (30) 15 6 (18) 62
Tax (4) (1) (3) (3) 0 5 (2) (1) 6 (3)
Profit attributable to non
controlling interest - - - - - - - - 2 2
Profit/(loss) after tax and
before one off items 29 4 26 18 1 (25) 13 5 (10) 61
Cyprus: Income Statement by business line for 1Q2018
50

49
133
156
255
192
0
127
127
127
0
153
204
191
191
191
203
224
230
234
234
234
0
97
114
1.6
(2.4)
(29.6)
(4.7)
2.3
1Q17 2Q17 3Q17 4Q17 1Q18
Loss after tax negatively
affected by legal and
regulatory redress
provision charges
1.04 1.13
1.26 1.38
1.52 1.66 1.66
Dec 2015 Jun 2016 Dec 2016 Jun 2017 Sep 2017 Dec 2017 Mar 2018
Gross loans and customer deposits Loans by sector at 31 March 2018
0.83 0.93
1.09
1.24 1.32
1.41 1.52
Dec 2015 Jun 2016 Dec 2016 Jun 2017 Sep 2017 Dec 2017 Mar 2018
BOC UK operations
79%
13%
1%
7%
Corporate
SMEs
Consumer credit
Housing
51
Gross loans (£ bn)
Customer deposits (£ bn)
1.8 1.8
2.2
(0.9)
2.4
1Q17 2Q17 3Q17 4Q17 1Q18
Core operating profitability
Operating profit (£ mn)
• Gross loans and customer deposits in the UK increased by 84% and 60% since Dec 15 to £1.52 bn and to £1.66 bn, respectively
• New lending of £135 mn during 1Q2018
• Profit after tax of £2.3 mn for the 1Q2018
(Loss)/profit after tax (£ mn)
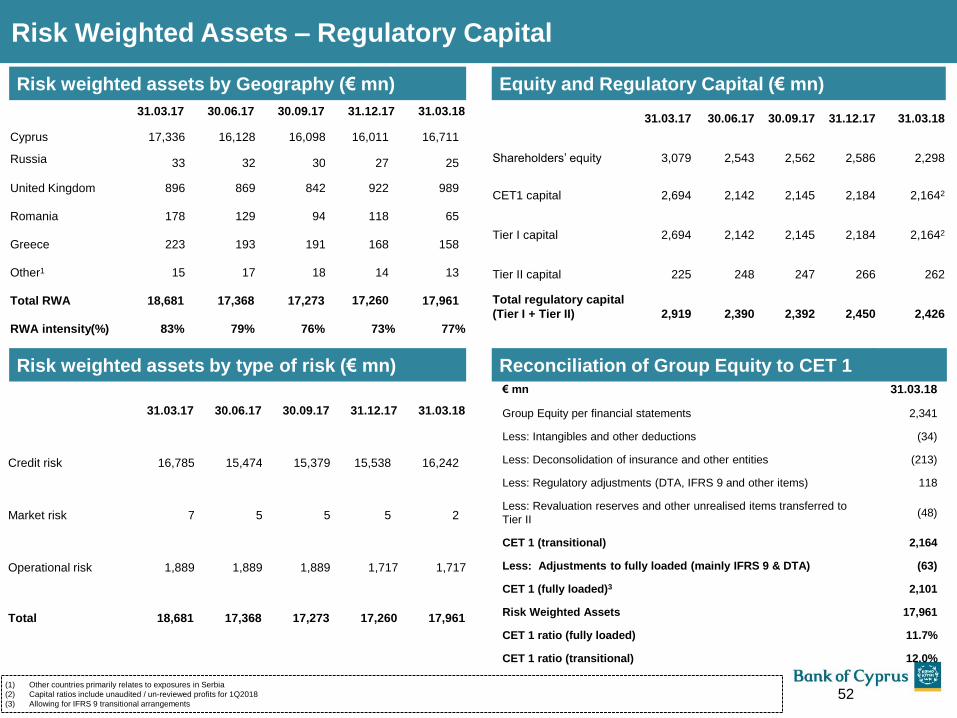
49
133
156
255
192
0
127
127
127
0
153
204
191
191
191
203
224
230
234
234
234
0
97
114
€ mn 31.03.18
Group Equity per financial statements 2,341
Less: Intangibles and other deductions (34)
Less: Deconsolidation of insurance and other entities (213)
Less: Regulatory adjustments (DTA, IFRS 9 and other items) 118
Less: Revaluation reserves and other unrealised items transferred to
Tier II (48)
CET 1 (transitional) 2,164
Less: Adjustments to fully loaded (mainly IFRS 9 & DTA) (63)
CET 1 (fully loaded)3 2,101
Risk Weighted Assets 17,961
CET 1 ratio (fully loaded) 11.7%
CET 1 ratio (transitional) 12.0%
Risk Weighted Assets – Regulatory Capital
Equity and Regulatory Capital (€ mn)
31.03.17 30.06.17 30.09.17 31.12.17 31.03.18
Shareholders’ equity 3,079 2,543 2,562 2,586 2,298
CET1 capital 2,694 2,142 2,145 2,184 2,1642
Tier I capital 2,694 2,142 2,145 2,184 2,1642
Tier II capital 225 248 247 266 262
Total regulatory capital
(Tier I + Tier II) 2,919 2,390 2,392 2,450 2,426
`
52 (1) Other countries primarily relates to exposures in Serbia
(2) Capital ratios include unaudited / un-reviewed profits for 1Q2018
(3) Allowing for IFRS 9 transitional arrangements
Risk weighted assets by type of risk (€ mn)
31.03.17 30.06.17 30.09.17 31.12.17 31.03.18
Credit risk 16,785 15,474 15,379 15,538 16,242
Market risk 7 5 5 5 2
Operational risk 1,889 1,889 1,889 1,717 1,717
Total 18,681 17,368 17,273 17,260 17,961
Risk weighted assets by Geography (€ mn)
31.03.17 30.06.17 30.09.17 31.12.17 31.03.18
Cyprus 17,336 16,128 16,098 16,011 16,711
Russia 33 32 30 27 25
United Kingdom 896 869 842 922 989
Romania 178 129 94 118 65
Greece 223 193 191 168 158
Other1 15 17 18 14 13
Total RWA 18,681 17,368 17,273 17,260 17,961
RWA intensity(%) 83% 79% 76% 73% 77%
Reconciliation of Group Equity to CET 1
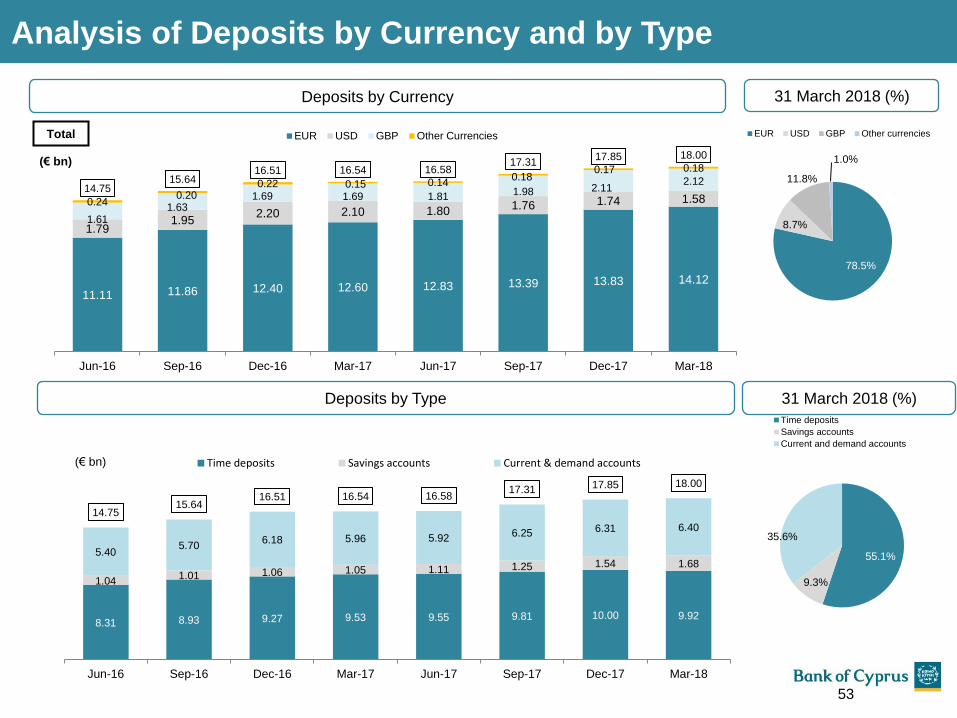
49
133
156
255
192
0
127
127
127
0
153
204
191
191
191
203
224
230
234
234
234
0
97
114 Total
(€ bn)
Analysis of Deposits by Currency and by Type
78.5%
8.7%
11.8%
1.0%
EUR USD GBP Other currencies
53
11.11 11.86 12.40 12.60 12.83 13.39 13.83 14.12
1.79 1.95
2.20 2.10 1.80 1.76 1.74 1.58
1.61 1.63
1.69 1.69 1.81 1.98 2.11 2.12
0.24 0.20
0.22 0.15 0.14 0.18
0.17 0.18
14.75 15.64
16.51 16.54 16.58 17.31
17.85 18.00
Jun-16 Sep-16 Dec-16 Mar-17 Jun-17 Sep-17 Dec-17 Mar-18
EUR USD GBP Other Currencies
Deposits by Currency 31 March 2018 (%)
31 March 2018 (%)
55.1%
9.3%
35.6%
Time deposits
Savings accounts
Current and demand accounts
8.31 8.93 9.27 9.53 9.55 9.81 10.00 9.92
1.04 1.01 1.06 1.05 1.11 1.25 1.54 1.68
5.40 5.70
6.18 5.96 5.92 6.25 6.31 6.40
14.75 15.64
16.51 16.54 16.58 17.31 17.85 18.00
Jun-16 Sep-16 Dec-16 Mar-17 Jun-17 Sep-17 Dec-17 Mar-18
Time deposits Savings accounts Current & demand accounts(€ bn)
Deposits by Type
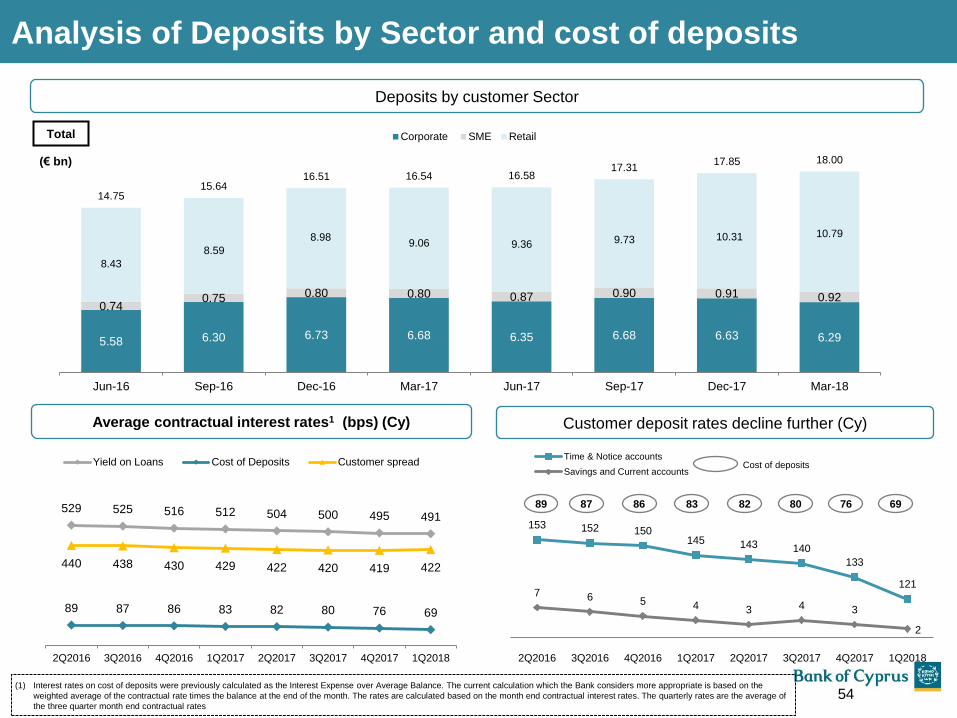
49
133
156
255
192
0
127
127
127
0
153
204
191
191
191
203
224
230
234
234
234
0
97
114 Total
(€ bn)
Analysis of Deposits by Sector and cost of deposits
54
5.58 6.30 6.73 6.68 6.35 6.68 6.63 6.29
0.74 0.75 0.80 0.80 0.87 0.90 0.91 0.92
8.43
8.59
8.98 9.06 9.36 9.73 10.31 10.79
14.75 15.64
16.51 16.54 16.58 17.31
17.85 18.00
Jun-16 Sep-16 Dec-16 Mar-17 Jun-17 Sep-17 Dec-17 Mar-18
Corporate SME Retail
Deposits by customer Sector
153 152 150 145 143 140
133
121 7 6 5 4 3 4 3
2 0
5
10
15
20
25
30
2Q2016 3Q2016 4Q2016 1Q2017 2Q2017 3Q2017 4Q2017 1Q2018
Time & Notice accounts
Savings and Current accounts
86 83 87 89 82 80
Cost of deposits
76 69
Customer deposit rates decline further (Cy)
529 525 516 512 504 500 495 491
89 87 86 83 82 80 76 69
440 438 430 429 422 420 419 422
2Q2016 3Q2016 4Q2016 1Q2017 2Q2017 3Q2017 4Q2017 1Q2018
Yield on Loans Cost of Deposits Customer spread
Average contractual interest rates1 (bps) (Cy)
(1) Interest rates on cost of deposits were previously calculated as the Interest Expense over Average Balance. The current calculation which the Bank considers more appropriate is based on the
weighted average of the contractual rate times the balance at the end of the month. The rates are calculated based on the month end contractual interest rates. The quarterly rates are the average of
the three quarter month end contractual rates

49
133
156
255
192
0
127
127
127
0
153
204
191
191
191
203
224
230
234
234
234
0
97
114
Reduction in Overseas Non-Core Exposures
Overseas non-core exposures1 (€ mn)
(1) Comparatives excluding core exposures
(2) Lending exposures to Greek entities in the normal course of business in Cyprus and lending exposures in Cyprus with collaterals in Greece
45 45 44 39 38 37 31 28
205 164 149
111 108 91 79 77
42
42 42
9 9 9
9 7
296
288 283
248 240 214
193 184
588
539 518
407 395
351
312 296
Jun 2016 Sep 2016 Dec 2016 Mar 2017 Jun 2017 Sep 2017 Dec 2017 Mar 2018
Russia: Net exposure Romania: Net exposure
Serbia: Net exposure Greece: Net exposure
55
• In addition, at 31 March 2018, there were €184 mn2
of overseas exposures in Greece (€168 mn as at 31
December 2017) not identified as non-core
exposures
• In accordance with the Group’s strategy to exit from
overseas non-core operations, the operations of the
branch in Romania are expected to be terminated,
subject to the completion of deregistration
formalities with respective authorities. Most of
the remaining assets and liabilities of the branch
in Romania with third parties have been
transferred to other entities of the Group.
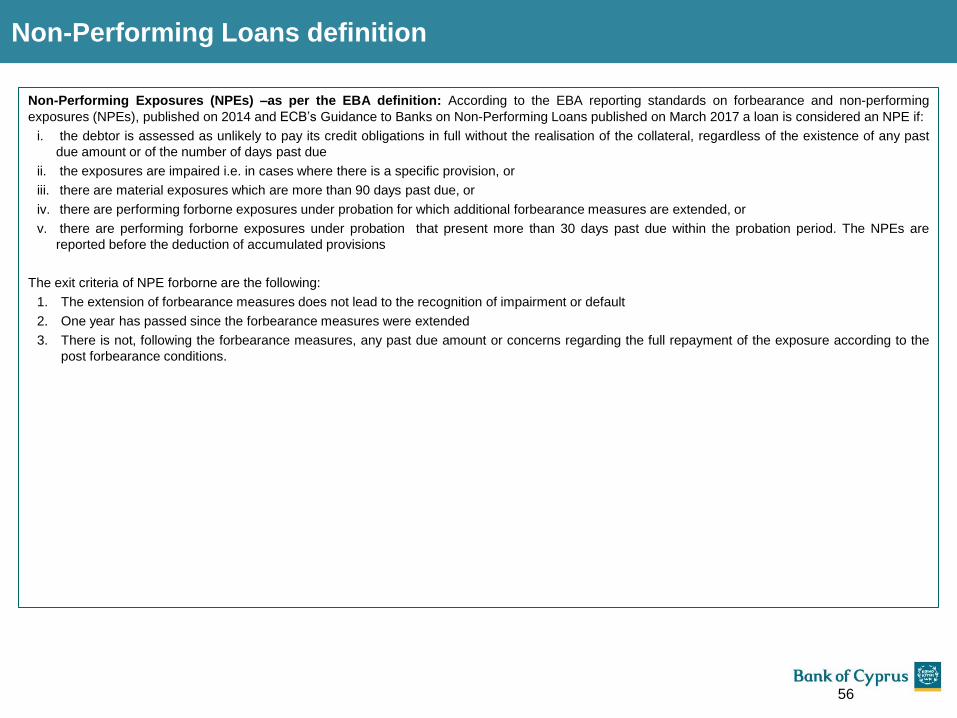
49
133
156
255
192
0
127
127
127
0
153
204
191
191
191
203
224
230
234
234
234
0
97
114
Non-Performing Loans definition
Non-Performing Exposures (NPEs) –as per the EBA definition: According to the EBA reporting standards on forbearance and non-performing
exposures (NPEs), published on 2014 and ECB’s Guidance to Banks on Non-Performing Loans published on March 2017 a loan is considered an NPE if:
i. the debtor is assessed as unlikely to pay its credit obligations in full without the realisation of the collateral, regardless of the existence of any past
due amount or of the number of days past due
ii. the exposures are impaired i.e. in cases where there is a specific provision, or
iii. there are material exposures which are more than 90 days past due, or
iv. there are performing forborne exposures under probation for which additional forbearance measures are extended, or
v. there are performing forborne exposures under probation that present more than 30 days past due within the probation period. The NPEs are
reported before the deduction of accumulated provisions
The exit criteria of NPE forborne are the following:
1. The extension of forbearance measures does not lead to the recognition of impairment or default
2. One year has passed since the forbearance measures were extended
3. There is not, following the forbearance measures, any past due amount or concerns regarding the full repayment of the exposure according to the
post forbearance conditions.
56

49
133
156
255
192
0
127
127
127
0
153
204
191
191
191
203
224
230
234
234
234
0
97
114
This document contains certain forward-looking statements which can usually be identified by terms used such as “expect”,
“should be”, “will be” and similar expressions or variations thereof. These forward-looking statements include, but are not
limited to, statements relating to the Group’s intentions, beliefs or current expectations and projections about the Group’s
future results of operations, financial condition, liquidity, performance, prospects, anticipated growth, provisions, impairments,
strategies and opportunities. By their nature, forward-looking statements involve risk and uncertainty because they relate to
events, and depend upon circumstances, that will or may occur in the future. Factors that could cause actual business,
strategy and/or results to differ materially from the plans, objectives, expectations, estimates and intentions expressed in such
forward-looking statements made by the Group include, but are not limited to: general economic and political conditions in
Cyprus and other EU Member States, interest rate and foreign exchange fluctuations, legislative, fiscal and regulatory
developments and information technology, litigation and other operational risks. Should any one or more of these or other
factors materialise, or should any underlying assumptions prove to be incorrect, the actual results or events could differ
materially from those currently being anticipated as reflected in such forward looking statements. The forward-looking
statements made in this document are only applicable as from the date of publication of this document. Except as required by
any applicable law or regulation, the Group expressly disclaims any obligation or undertaking to release publicly any updates
or revisions to any forward looking statement contained in this document to reflect any change in the Group’s expectations or
any change in events, conditions or circumstances on which any statement is based. This presentation does not constitute an
offer to sell, or a solicitation of an offer to buy, any security in any jurisdiction in the United States, to United States Domiciles
or otherwise. Some of the information in the presentation is derived from publicly available information from sources such as
the Central Bank of Cyprus, the Statistical Services of the Cyprus Ministry of Finance, the IMF, Bloomberg and Company
Reports and the Bank makes no representation or warranty as to the accuracy of that information. The delivery of this
presentation shall under no circumstances imply that there has been no change in the affairs of the Group or that the
information set forth herein is complete or correct as of any date. This presentation shall not be used in connection with any
investment decision regarding any of our securities, which should only be made based on expressly authorised materials from
us identified as such, nor in connection with any decision whether or how to vote on any matter submitted to our stockholders.
The securities issued by Bank of Cyprus Public Company Limited and the Bank of Cyprus Holdings Public Limited Company
have not been, and will not be, registered under the US Securities Act of 1933 (“the Securities Act”), or under the applicable
securities laws of Canada, Australia or Japan.
Disclaimer
57
Top Related