


Languages
Pages
Legal

This paper presents preliminary findings and is being distributed to economists
and other interested readers solely to stimulate discussion and elicit comments.
The views expressed in this paper are those of the author and are not necessarily
reflective of views at the Federal Reserve Bank of New York or the Federal
Reserve System. Any errors or omissions are the responsibility of the author.
Federal Reserve Bank of New York
Staff Reports
Bank Holding Company Dividends and
Repurchases during the Financial Crisis
Beverly Hirtle
Staff Report No. 666
March 2014
Revised April 2016

Bank Holding Company Dividends and Repurchases during the Financial Crisis
Beverly Hirtle
Federal Reserve Bank of New York Staff Reports, no. 666
March 2014; revised April 2016
JEL classification: G01, G21, G28, G35
Abstract
Many large U.S. bank holding companies (BHCs) continued to pay dividends during the 2007-09
financial crisis, even as financial market conditions deteriorated, large losses accumulated, and
emergency capital and liquidity were being provided by the official sector. In contrast, share
repurchases by these BHCs dropped sharply in the early part of the crisis. Documenting this
divergent behavior is one of the key contributions of this paper. The paper also examines the role
that repurchases played in large BHCs’ decisions to reduce or eliminate dividends. The key
findings are that smaller BHCs in the sample with higher levels of repurchases before the
financial crisis reduced dividends later and by less than BHCs with lower pre‐crisis repurchases,
suggesting that repurchases may have served as a cushion against cutting dividends. In contrast,
there is only a weak relationship between pre‐crisis repurchases and the timing and extent of
dividend reductions for the larger BHCs, even though these BHCs were more likely overall to
reduce or eliminate dividends during the crisis.
Key words: bank capital, stock repurchases, bank dividends, financial crisis
_________________
Hirtle: Federal Reserve Bank of New York (e-mail: [email protected]). The author would
like to thank Fang Du, Mark Flannery, Linda Goldberg, Hamid Mehran, João Santos, and James
Vickery for helpful comments and suggestions, and Eric Lewin, Phoebe White, and Samantha
Zeller for assistance in preparing the data set used in this paper. The views expressed in this paper
are those of the author and do not necessarily reflect the position of the Federal Reserve Bank of
New York or the Federal Reserve System.
[1]
Bank Holding Company Dividends and Repurchases During the Financial Crisis
1. Introduction Many large U.S. bank holding companies (BHCs) continued to pay dividends during the recent
financial crisis, even as financial market conditions deteriorated, large losses accumulated, and
emergency capital and liquidity were being provided by the official sector. These continued dividend
payments have been the subject of critical commentary because they drained capital from individual
banking companies and from the banking system in a time of extreme stress (see, for example, Acharya
et al. 2012, Rosengren 2010, Scharfstein and Stein 2008). Some have also argued that continued
dividend payments were a means of shifting value from BHC debt holders and creditors (including other
banking companies) to equity holders (Srivastav et al. 2014, Acharya et al. 2014). The phenomenon was
striking enough that bank supervisors subsequently adopted regulations and supervisory programs
intended to limit dividend payments and other capital distributions when capital comes under stress.
These measures include Basel III’s capital conservation buffer and the Federal Reserve’s Comprehensive
Capital Analysis and Review (CCAR).
Dividends are only part of the story, however. Before the financial crisis, BHCs also made
substantial common stock share repurchases, frequently in amounts that rivaled the size of dividend
payments. Share repurchases are similar to dividends in their impact on capital and the balance sheet;
both involve a reduction in capital and a transfer of cash from the firm to shareholders. In contrast to
dividend payments, share repurchases by large BHCs dropped sharply in the early part of the financial
crisis, reaching de minimis levels by mid‐2008. Many BHCs that had reduced share repurchases to zero
continued to pay dividends at pre‐financial‐crisis levels for several quarters. In some cases, more than a
year elapsed between the time a BHC stopped doing share repurchases and when it reduced or
eliminated its dividend. Documenting this divergent behavior is one of the key contributions of this
paper, as previous analysis of the banking industry has tended to focus on dividend payments alone.
What accounts for this difference in the timing of dividend and share repurchase reductions? To
a large extent, the contrast may reflect well‐documented differences in the way that firms use dividends
and repurchases. Dividends are generally stable and increases or decreases are typically interpreted as
signals of long‐run changes in firm profitability. Reductions in dividends are generally associated with a
negative stock price reaction, since they can be seen a signal of lower future profits (Ghosh and
Woolridge 1998, Denis et al. 1994, Bessler and Nohel 1996, 2000). During the financial crisis, concern
about negative signals from a dividend cut may have been heightened, given the uncertainty and lack of

[2]
transparency about growing losses at individual financial firms. These concerns may have made BHCs
even more reluctant to reduce dividends, despite the growing stress.
In contrast, share repurchases are more variable and tend to be used in periods when income is
temporarily high, both by non‐financial firms (Jagannathan et al. 2000) and by banking companies (Hirtle
2004). In the banking industry, dividends are generally paid on a regular, quarterly basis after having
been approved by the firm’s board of directors and publicly disclosed by the firm. Repurchases are
made more irregularly over time, without public announcement at the time they are executed.1 For
these reasons, BHCs may have been more willing to reduce repurchases quickly as the financial crisis
developed and uncertainty about its depth and severity intensified. The ability to reduce repurchases
may have served as cushion that allowed BHCs to reduce payouts, at least for a time, without subjecting
themselves to the negative market signal from reducing or eliminating their dividends.
This paper examines the timing and extent of dividend payment reductions by a set of large
BHCs during the financial crisis. In particular, the paper examines the role that repurchases played in a
BHC’s decision to reduce or eliminate dividends. Did BHCs with a high level of repurchases prior to the
financial crisis cut dividends later, or by less, than BHCs with lower levels of pre‐crisis repurchases? In
other words, did the ability to reduce high levels of pre‐crisis repurchases “cushion” BHCs against the
necessity to reduce or eliminate dividends during the financial crisis? Or are higher levels of pre‐crisis
repurchases associated with more rapid dividend reductions during the crisis, perhaps because BHCs
with repurchases had more volatile income, which fell more sharply during the crisis?
The key findings of the paper are that smaller BHCs with higher levels of repurchases before the
financial crisis reduced dividends later and by less, on average, than smaller BHCs with lower pre‐crisis
repurchases. In contrast, the results suggest only a weak relationship between pre‐crisis repurchase
activity and the timing or size of dividend reductions for larger BHCs, even though these institutions
were more likely to reduce or eliminate dividends than smaller firms. For both larger and smaller BHCs,
higher overall payouts (repurchases plus dividends) before the crisis are associated with quicker
dividend reductions during the crisis. The key findings about the timing of dividend reductions are
robust to several alternative specifications of the model, including controlling for expectations of losses
during the financial crisis and for the extent of market scrutiny. Thus, the ability to cut repurchases
1Firms generally announce their intention to repurchase shares by disclosing a repurchase program that outlines the dollar amount and/or number of share they intend to repurchase over a particular time period. However, there is no obligation for a firm to actually make the repurchases it has announced, nor is there any commitment about the timing of repurchases it actually does (Jagannathan et al. 2000). Since 2004, firms have been required to disclose the number of shares and average price of repurchased shares in subsequent quarterly and annual financial filings (Bonaimé 2012).
[3]
appears to have had a cushioning effect against the timing of a dividend cut and the cumulative amount
of the dividend reduction, though primarily for the smaller BHCs in the sample.
These findings are consistent with a precautionary view of bank capital, in which BHCs were
attempting to balance the desire to retain capital within the firm during a period of increasing stress
against a concern about sending a negative and possibly destabilizing signal to the market by reducing or
eliminating dividends. The results seem less consistent with a risk‐shifting view of dividends, in which
dividend payments are intended to shift value from creditors to equity holders. Risk‐shifting of this type
could also have been accomplished via share repurchases, which dropped quickly during the early
phases of the crisis.
From a policy perspective, the results suggest that BHCs could be encouraged to make more of
their capital distributions in the form of share repurchases, due to the greater flexibility and market
tolerance for variability in this form of distribution. The Federal Reserve’s CCAR program – which
evaluates large BHCs’ proposed dividend payments and share repurchases – takes this view, as under
the program, BHCs planning to make dividend payments exceeding 30 percent of after‐tax net income
receive particularly close scrutiny, but there is no additional scrutiny related to share repurchases (Board
of Governors of the Federal Reserve System 2016). A key question is whether sharp reductions in share
repurchases would again be tolerated by market participants during times of stress if there is increased
emphasis on repurchases as the means of shareholder payouts. In other words, would there be more
scrutiny of actual share repurchases such that reductions in these repurchases might send the same kind
of market signal as dividend reductions during periods of stress?
The remainder of this paper is organized as follows. Section 2 presents information on dividend
payments and share repurchases by large BHCs prior to and during the financial crisis and relates this
information to the previous literature on dividends and repurchases by non‐financial firms and in the
banking industry. Section 3 describes the data used in the paper. Section 4 presents the empirical
specification and results, including analysis of the timing and size of dividend reductions by bank holding
companies. Section 5 contains a summary and conclusions.
2. BHC Dividends and Repurchases during the Financial Crisis
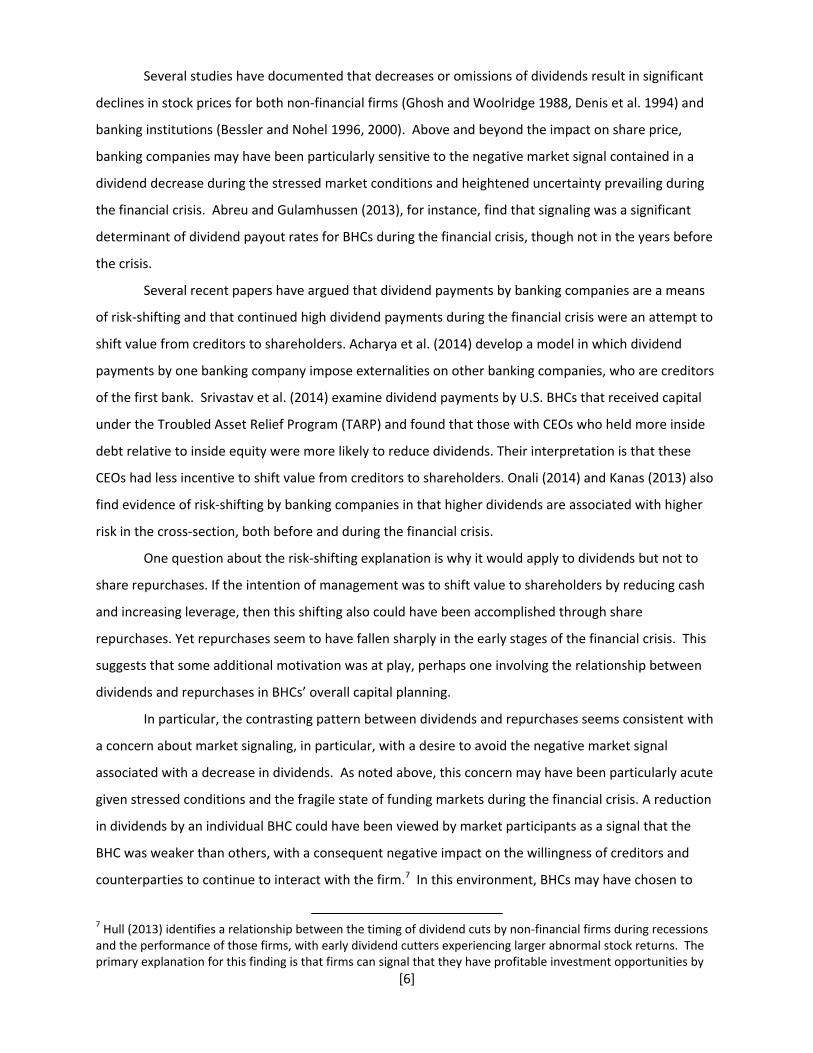
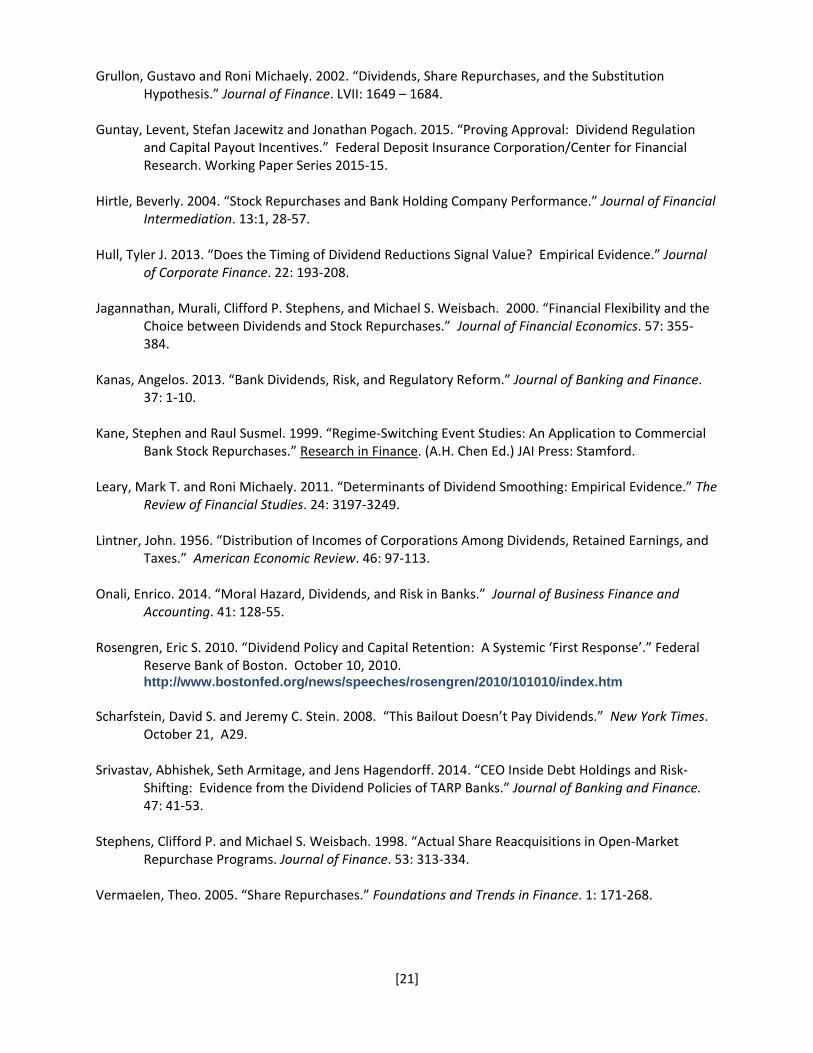
Figure 1 shows dividend payments by large BHCs – those with assets exceeding $5 billion – from
2005 to 2009, as reported on the Federal Reserve Y‐9C regulatory reports.2 As noted in previous papers
(Acharya et al. 2012, Kanas 2013), BHCs continued to pay dividends well after the onset of the 2007 to
2 For consistency over the sample period, the figure omits the large non‐bank financial companies that became bank holding companies in early 2009. If these firms were included and dividend payments were scaled by assets, the patterns reported in Figure 1 and Figure 2 would be substantially similar.

[4]
2009 financial crisis. Aggregate dividends averaged more than $10 billion per quarter in 2005 to 2006,
and did not fall below this level until the end of 2008. Dividends paid by these large BHCs did not
decline to the very low levels that eventually prevailed until mid‐2009. The continued high level of
dividends through the first part of the financial crisis was particularly striking as these payments
occurred during a period of severe market stress and while the official sector was providing extensive
support to the banking industry, including liquidity provisions and capital infusions (Rosengren 2010,
Scharfstein and Stein 2008).
Focusing just on dividends misses an important part of the story, however. Stock repurchases –
when a company buys back its own common stock – are another important way that a firm can return
capital to shareholders. Like dividend payments, stock repurchases disperse cash from the company to
shareholders. Moreover, repurchases reduce the amount of common stock outstanding one‐for‐one,
just as dividend payments do. Dividend payments reduce retained earnings and thus reduce (potential)
common equity, while stock repurchases are a direction reduction in the outstanding amount of
common equity.3
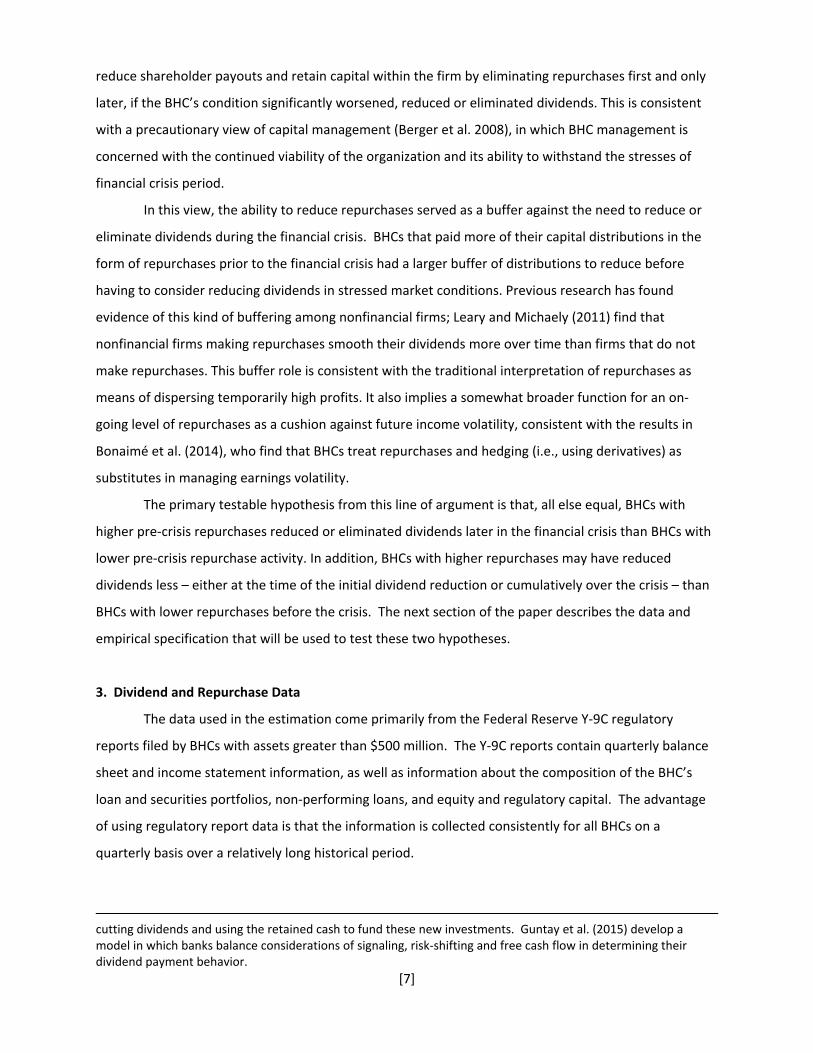
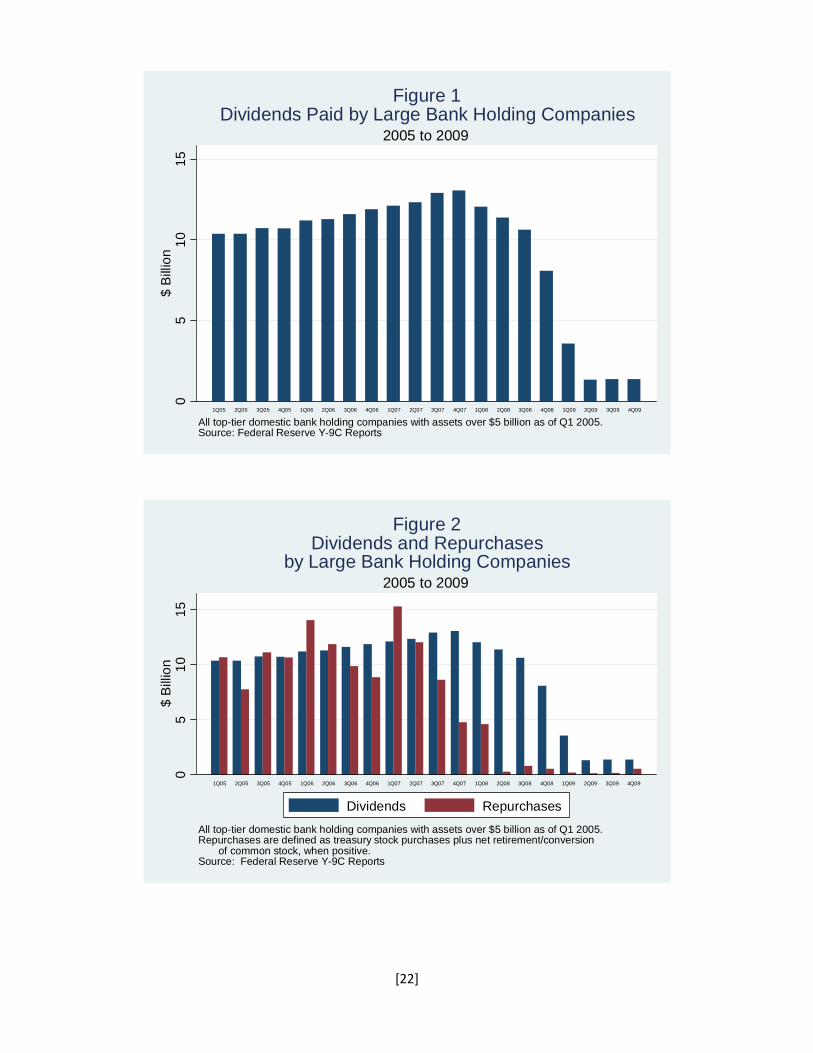
Figure 2 updates Figure 1 to include common stock repurchases for the sample of large BHCs,
based on information in the Federal Reserve Y‐9C regulatory reports.4 As previously documented (Hirtle
2004), repurchases by large BHCs can be substantial; during the two years immediately preceding the
financial crisis (2005 and 2006), repurchases by these BHCs often equaled or exceeded the amount of
dividend payments. Unlike dividends, however, repurchases dropped sharply relatively early in the
financial crisis. By late 2007, repurchases by these large BHCs had fallen to about half their pre‐crisis
level and by mid‐2008, they had fallen to negligible amounts. Repurchases thus fell to de minimis levels
nearly a year before dividends were similarly reduced.5
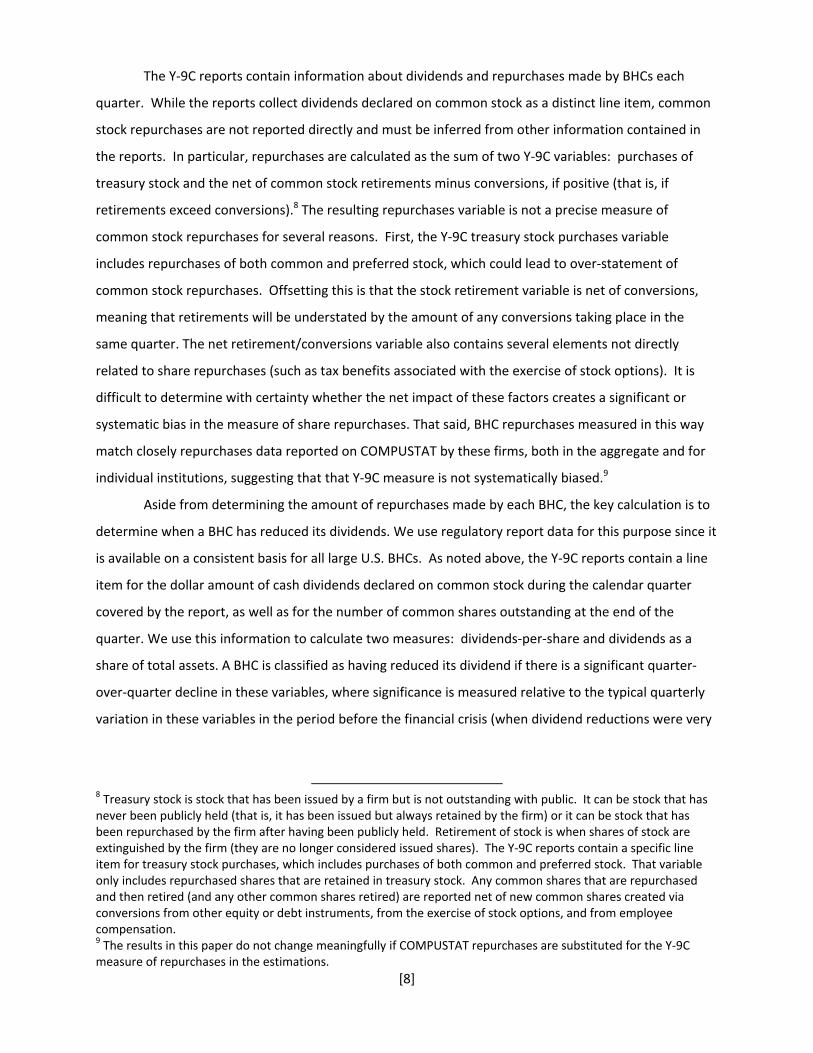
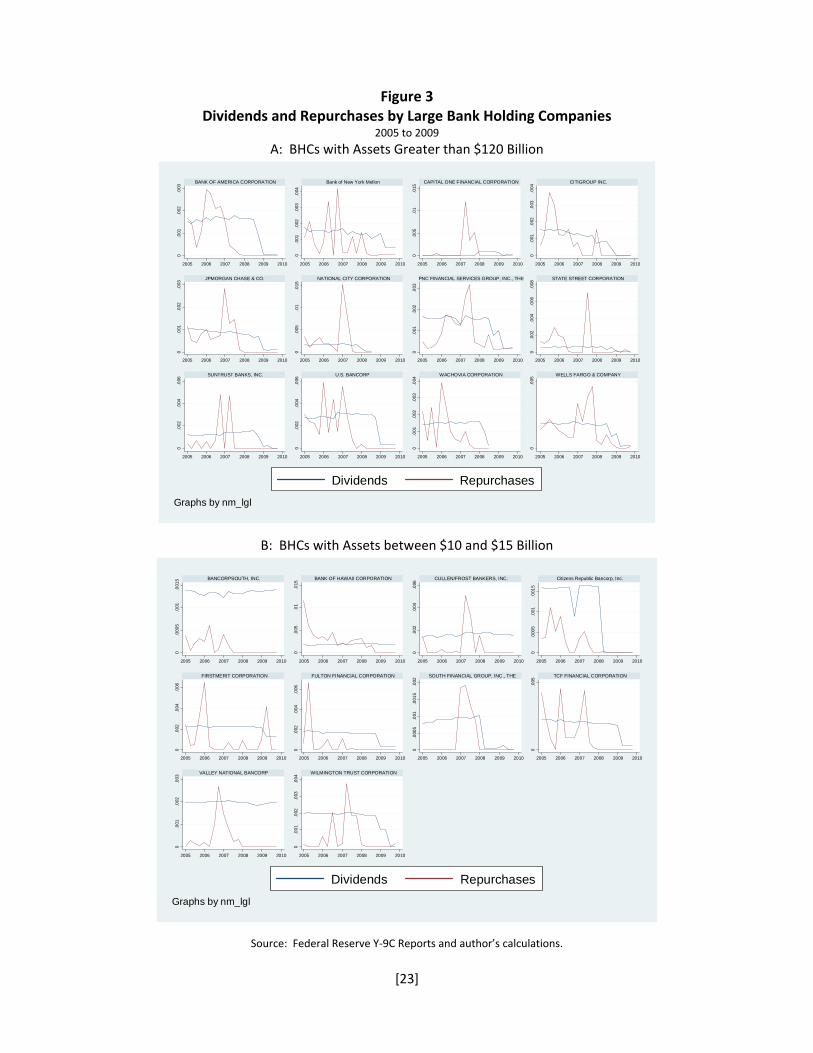
Figure 3 presents the same information for a selection of individual BHCs. Panel A of the figure
shows dividends and repurchases for very large BHCs (those with assets exceeding $120 billion in Q1
2005), while Panel B contains results for a set of smaller BHCs (those with assets between $10 and $15
billion). For comparability purposes, dividends and repurchases are scaled by total BHC assets. While
the results are not identical across BHCs, there is a consistent pattern of repurchases declining well
before dividends are reduced. This pattern is evident for both the very large and the smaller BHCs in the
3 See Jagannathan et al. (2000) for a more detailed discussion of the role of repurchases in firm payout policies. Grullon and Michaely (2002) document that non‐financial firms increasingly substituted repurchases for dividends through the 1990s. 4 Repurchases are measured as treasury stock purchases plus the net of common stock retired over common stock conversions. Section 3 discusses this definition in greater detail. 5 Bliss et al. (2015) find that while dividend reductions by non‐financial firms were more common during the financial crisis than in previous periods, the overall reduction in shareholder payouts by these firms was driven primarily by reductions in share repurchases.
[5]
sample. The figure also illustrates that the timing of dividend and repurchase reductions differs across
BHCs, with some cutting payouts earlier in the financial crisis than others.
What explains the difference in timing between the reduction in dividends and the reduction in
share repurchases? Some part of the explanation likely owes to the different roles that dividends and
repurchases play in firms’ corporate payout strategies. As first described by Lintner (1956), firm
managers appear to set dividends under the assumption that investors prefer stable and growing
dividends, rather than dividends that fluctuate over time. An increase in dividends is thus generally
perceived as a signal of increased sustainable profitability, while a decrease in dividends is taken as a
signal of a long‐term decline in profits. Consistent with this assertion, previous research has shown that
a firm’s cash flow volatility is negatively related to both the probability and size of dividend payments
(Chay and Suh 2009). In addition, DeAngelo et al. (2006) finds that dividend payments are more
common among older, well‐established firms with high amounts of retained earnings and that those
with low or negative retained earnings have a very low propensity to pay dividends.
In contrast to dividends, repurchases are variable over time and tend to be used when profits
are temporarily high (Jagannathan et al. 2000). Repurchases are less publicly observable than dividend
payments. Firms typically announce repurchase programs in which they specify the amount of
repurchases they intend to do over a specified future time period, but there is no obligation for the firm
to actually follow through on that intention. Previous research (Stephens and Weisbach 1998, Bonaimé
2012) has shown that “completion rates” (amount repurchases relative to the announced size of the
program) for share repurchase programs average about 80% and that a measurable portion of firms
purchase few or no shares following the announcement of a repurchase program. For those firms that
do reacquire shares under a repurchase program, the timing and amount of those repurchases is up to
management discretion. For these reasons, a firm can increase or decrease its actual repurchases
without necessarily attracting immediate public attention and sending a signal about future
profitability.6 While firms are required to disclose the number of shares and average price of shares
repurchased under publicly announced repurchase programs in their quarterly and annual financial
statements (Bonaimé 2012), these disclosures come after the repurchases have been executed. This
stands in contrast to dividend payments, which in the banking industry are typically approved by a BHC’s
board of directors on a quarterly basis and disclosed via a press release.
6 It is well documented, however, that announcements of repurchase programs are associated with increases in stock prices (Vermaelen 2005, Bonaimé 2012), including in the banking industry (Kane and Susmel 1999). Stephens and Weisbach (1998) show that actual repurchases are negatively related to past stock performance, suggesting that firms may be more likely to make repurchases when management believes that the firm is undervalued.
[6]
Several studies have documented that decreases or omissions of dividends result in significant
declines in stock prices for both non‐financial firms (Ghosh and Woolridge 1988, Denis et al. 1994) and
banking institutions (Bessler and Nohel 1996, 2000). Above and beyond the impact on share price,
banking companies may have been particularly sensitive to the negative market signal contained in a
dividend decrease during the stressed market conditions and heightened uncertainty prevailing during
the financial crisis. Abreu and Gulamhussen (2013), for instance, find that signaling was a significant
determinant of dividend payout rates for BHCs during the financial crisis, though not in the years before
the crisis.
Several recent papers have argued that dividend payments by banking companies are a means
of risk‐shifting and that continued high dividend payments during the financial crisis were an attempt to
shift value from creditors to shareholders. Acharya et al. (2014) develop a model in which dividend
payments by one banking company impose externalities on other banking companies, who are creditors
of the first bank. Srivastav et al. (2014) examine dividend payments by U.S. BHCs that received capital
under the Troubled Asset Relief Program (TARP) and found that those with CEOs who held more inside
debt relative to inside equity were more likely to reduce dividends. Their interpretation is that these
CEOs had less incentive to shift value from creditors to shareholders. Onali (2014) and Kanas (2013) also
find evidence of risk‐shifting by banking companies in that higher dividends are associated with higher
risk in the cross‐section, both before and during the financial crisis.
One question about the risk‐shifting explanation is why it would apply to dividends but not to
share repurchases. If the intention of management was to shift value to shareholders by reducing cash
and increasing leverage, then this shifting also could have been accomplished through share
repurchases. Yet repurchases seem to have fallen sharply in the early stages of the financial crisis. This
suggests that some additional motivation was at play, perhaps one involving the relationship between
dividends and repurchases in BHCs’ overall capital planning.
In particular, the contrasting pattern between dividends and repurchases seems consistent with
a concern about market signaling, in particular, with a desire to avoid the negative market signal
associated with a decrease in dividends. As noted above, this concern may have been particularly acute
given stressed conditions and the fragile state of funding markets during the financial crisis. A reduction
in dividends by an individual BHC could have been viewed by market participants as a signal that the
BHC was weaker than others, with a consequent negative impact on the willingness of creditors and
counterparties to continue to interact with the firm.7 In this environment, BHCs may have chosen to
7 Hull (2013) identifies a relationship between the timing of dividend cuts by non‐financial firms during recessions and the performance of those firms, with early dividend cutters experiencing larger abnormal stock returns. The primary explanation for this finding is that firms can signal that they have profitable investment opportunities by
[7]
reduce shareholder payouts and retain capital within the firm by eliminating repurchases first and only
later, if the BHC’s condition significantly worsened, reduced or eliminated dividends. This is consistent
with a precautionary view of capital management (Berger et al. 2008), in which BHC management is
concerned with the continued viability of the organization and its ability to withstand the stresses of
financial crisis period.
In this view, the ability to reduce repurchases served as a buffer against the need to reduce or
eliminate dividends during the financial crisis. BHCs that paid more of their capital distributions in the
form of repurchases prior to the financial crisis had a larger buffer of distributions to reduce before
having to consider reducing dividends in stressed market conditions. Previous research has found
evidence of this kind of buffering among nonfinancial firms; Leary and Michaely (2011) find that
nonfinancial firms making repurchases smooth their dividends more over time than firms that do not
make repurchases. This buffer role is consistent with the traditional interpretation of repurchases as
means of dispersing temporarily high profits. It also implies a somewhat broader function for an on‐
going level of repurchases as a cushion against future income volatility, consistent with the results in
Bonaimé et al. (2014), who find that BHCs treat repurchases and hedging (i.e., using derivatives) as
substitutes in managing earnings volatility.
The primary testable hypothesis from this line of argument is that, all else equal, BHCs with
higher pre‐crisis repurchases reduced or eliminated dividends later in the financial crisis than BHCs with
lower pre‐crisis repurchase activity. In addition, BHCs with higher repurchases may have reduced
dividends less – either at the time of the initial dividend reduction or cumulatively over the crisis – than
BHCs with lower repurchases before the crisis. The next section of the paper describes the data and
empirical specification that will be used to test these two hypotheses.
3. Dividend and Repurchase Data
The data used in the estimation come primarily from the Federal Reserve Y‐9C regulatory
reports filed by BHCs with assets greater than $500 million. The Y‐9C reports contain quarterly balance
sheet and income statement information, as well as information about the composition of the BHC’s
loan and securities portfolios, non‐performing loans, and equity and regulatory capital. The advantage
of using regulatory report data is that the information is collected consistently for all BHCs on a
quarterly basis over a relatively long historical period.
cutting dividends and using the retained cash to fund these new investments. Guntay et al. (2015) develop a model in which banks balance considerations of signaling, risk‐shifting and free cash flow in determining their dividend payment behavior.
[8]
The Y‐9C reports contain information about dividends and repurchases made by BHCs each
quarter. While the reports collect dividends declared on common stock as a distinct line item, common
stock repurchases are not reported directly and must be inferred from other information contained in
the reports. In particular, repurchases are calculated as the sum of two Y‐9C variables: purchases of
treasury stock and the net of common stock retirements minus conversions, if positive (that is, if
retirements exceed conversions).8 The resulting repurchases variable is not a precise measure of
common stock repurchases for several reasons. First, the Y‐9C treasury stock purchases variable
includes repurchases of both common and preferred stock, which could lead to over‐statement of
common stock repurchases. Offsetting this is that the stock retirement variable is net of conversions,
meaning that retirements will be understated by the amount of any conversions taking place in the
same quarter. The net retirement/conversions variable also contains several elements not directly
related to share repurchases (such as tax benefits associated with the exercise of stock options). It is
difficult to determine with certainty whether the net impact of these factors creates a significant or
systematic bias in the measure of share repurchases. That said, BHC repurchases measured in this way
match closely repurchases data reported on COMPUSTAT by these firms, both in the aggregate and for
individual institutions, suggesting that that Y‐9C measure is not systematically biased.9
Aside from determining the amount of repurchases made by each BHC, the key calculation is to
determine when a BHC has reduced its dividends. We use regulatory report data for this purpose since it
is available on a consistent basis for all large U.S. BHCs. As noted above, the Y‐9C reports contain a line
item for the dollar amount of cash dividends declared on common stock during the calendar quarter
covered by the report, as well as for the number of common shares outstanding at the end of the
quarter. We use this information to calculate two measures: dividends‐per‐share and dividends as a
share of total assets. A BHC is classified as having reduced its dividend if there is a significant quarter‐
over‐quarter decline in these variables, where significance is measured relative to the typical quarterly
variation in these variables in the period before the financial crisis (when dividend reductions were very
8 Treasury stock is stock that has been issued by a firm but is not outstanding with public. It can be stock that has never been publicly held (that is, it has been issued but always retained by the firm) or it can be stock that has been repurchased by the firm after having been publicly held. Retirement of stock is when shares of stock are extinguished by the firm (they are no longer considered issued shares). The Y‐9C reports contain a specific line item for treasury stock purchases, which includes purchases of both common and preferred stock. That variable only includes repurchased shares that are retained in treasury stock. Any common shares that are repurchased and then retired (and any other common shares retired) are reported net of new common shares created via conversions from other equity or debt instruments, from the exercise of stock options, and from employee compensation. 9 The results in this paper do not change meaningfully if COMPUSTAT repurchases are substituted for the Y‐9C measure of repurchases in the estimations.
[9]
rare).10 This screen is intended to ensure that declines in the ratios reflect true dividend decreases and
not random variation in the measures. The results were checked against public dividend announcements
for the BHCs and adjusted in a limited number of cases where those announcements suggested that
dividends had not in fact been reduced.
The empirical work that follows focuses on two dividend reduction events: the first time a BHC
reduced its dividend during the financial crisis years of 2007 to 2009 and the point at which the BHC
eliminated its dividend, which for purposes of this analysis, is defined as the first quarter in which the
BHC reduced its dividend to zero or a penny.11 We focus on these two events because they represent
distinct points in the evolution of dividend payments during the financial crisis. The first time a BHC
reduced its dividend is an important initial signal to the market and to its counterparties that profits are
likely to be lower over the long run and that the BHC is attempting to retain capital within the firm. The
point at which BHCs eliminated their dividends altogether is also a significant event, since it is the end‐
point of the dividend reduction process and also the point at which capitalization of the BHC could no
longer be bolstered by reducing distributions. In fact, many BHCs reduced dividends several times during
the financial crisis years. Of the sample BHCs that reduced dividends, 60% reduced them more than
once between 2007 and 2009 and 16% reduced them three or more times.
The estimation sample consists of top‐tier U.S.‐owned BHCs with assets exceeding $5 billion as
of the beginning of 2005 and that file regulatory reports at least until the first quarter of 2007, the start
of the crisis period. There are 84 such BHCs. The sample is limited to these large BHCs to generate a
sample with common stock publicly traded on a major exchange, as a rough control over differences in
the extent to which the BHCs are subject to external monitoring and in the liquidity of their common
stock. Since the estimation is focused on the timing of dividend reductions, BHCs that pay annual or
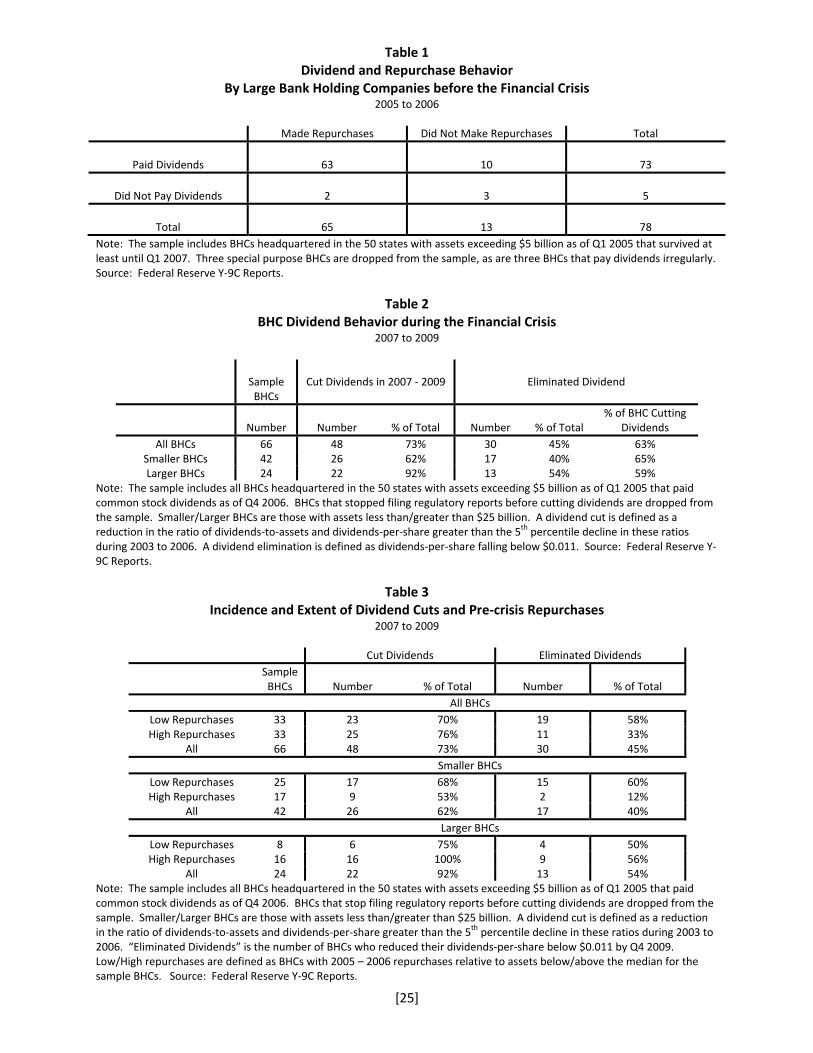
semi‐annual dividends are dropped from the sample, as are a small number of special purpose BHCs. As
illustrated in Table 1, nearly all (73 of 78) of the remaining BHCs paid dividends at some point during the
pre‐crisis period (2005 to 2006). A high but smaller share (65 of 78) made repurchases during this
period. About 80% of the BHCs (63 of 78) made both dividend payments and repurchases.
10Specifically, a BHC is classified as having reduced its dividend if dividends per share and dividends as a share of assets decline by more than an amount approximately equal to the 5th percentile lower tail of changes in these variables during 2003 to 2006. The results were also adjusted to account for instances in which a BHC appears to have declared two dividends in a single quarter, followed or preceded by a quarter in which no dividends were reported and for cases in which dividend rise sharply in a single quarter and then return to their previous level the following quarter, perhaps due a special dividend. Such cases are not treated as dividend reductions in the data. 11 Dividends were deemed to have been reduced to zero or a penny in the first quarter in which if dividends‐per‐share were less than or equal to $0.011. The cut‐off was set slightly higher than a penny to account for variability in the measure of dividends‐per‐share.
[10]
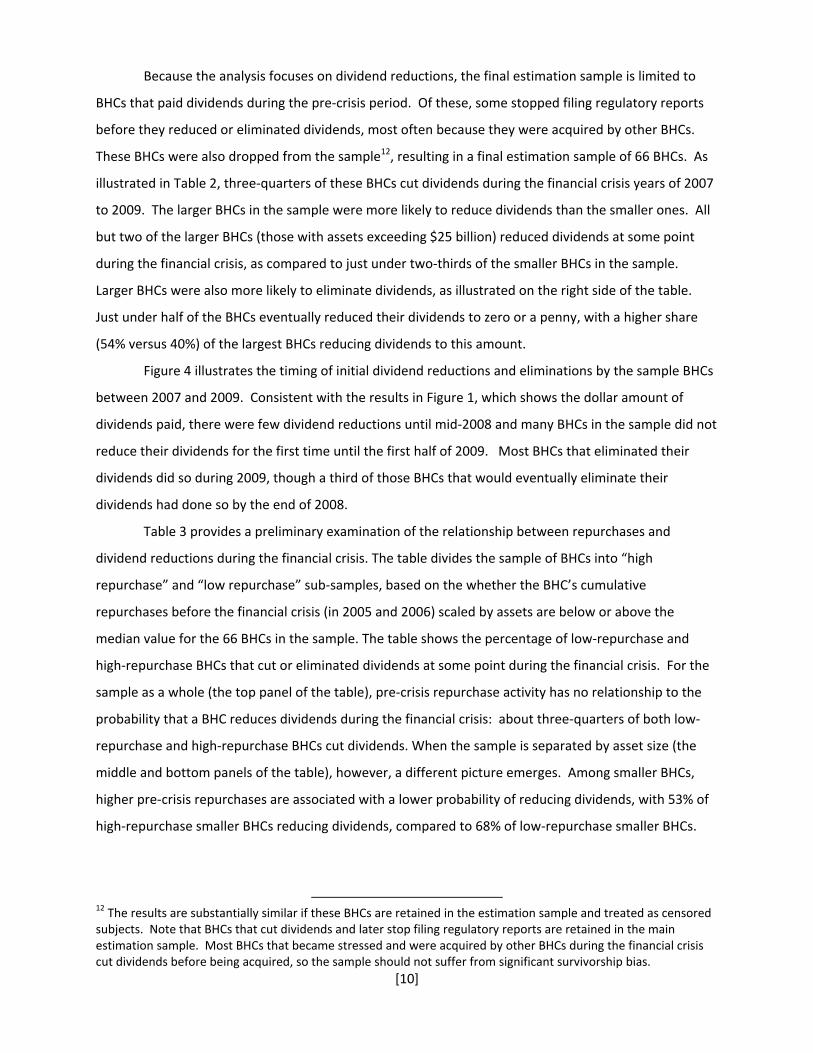
Because the analysis focuses on dividend reductions, the final estimation sample is limited to
BHCs that paid dividends during the pre‐crisis period. Of these, some stopped filing regulatory reports
before they reduced or eliminated dividends, most often because they were acquired by other BHCs.
These BHCs were also dropped from the sample12, resulting in a final estimation sample of 66 BHCs. As
illustrated in Table 2, three‐quarters of these BHCs cut dividends during the financial crisis years of 2007
to 2009. The larger BHCs in the sample were more likely to reduce dividends than the smaller ones. All
but two of the larger BHCs (those with assets exceeding $25 billion) reduced dividends at some point
during the financial crisis, as compared to just under two‐thirds of the smaller BHCs in the sample.
Larger BHCs were also more likely to eliminate dividends, as illustrated on the right side of the table.
Just under half of the BHCs eventually reduced their dividends to zero or a penny, with a higher share
(54% versus 40%) of the largest BHCs reducing dividends to this amount.
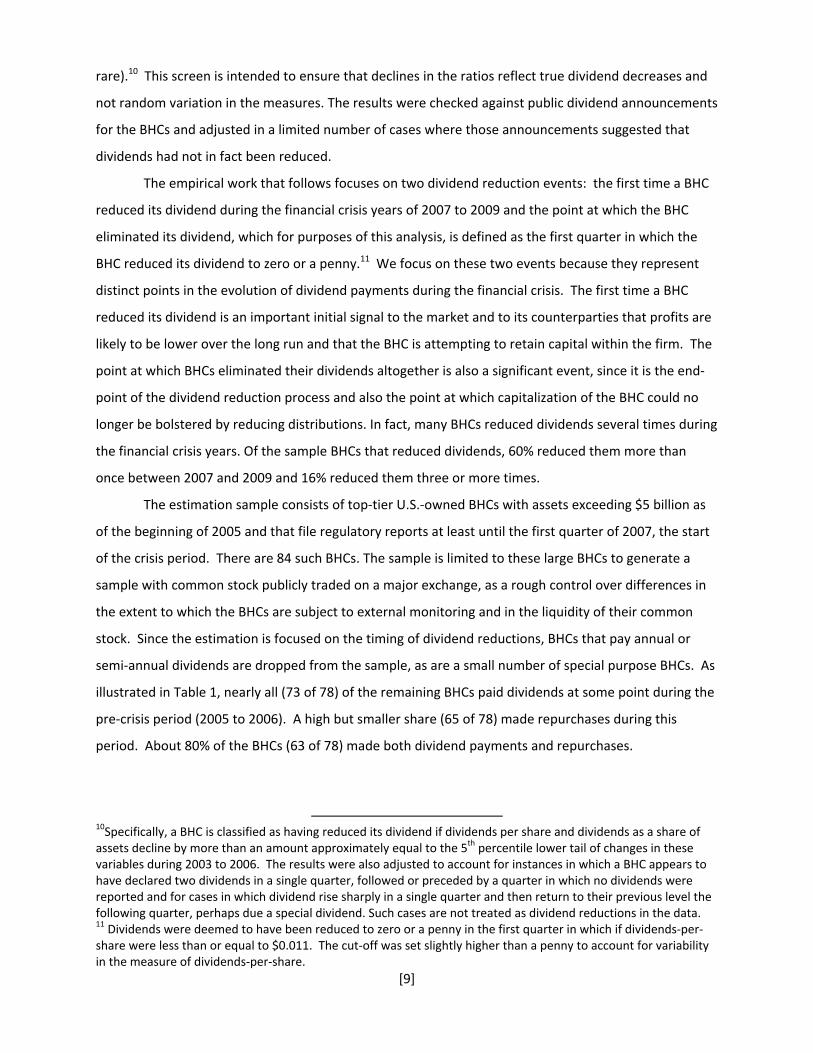
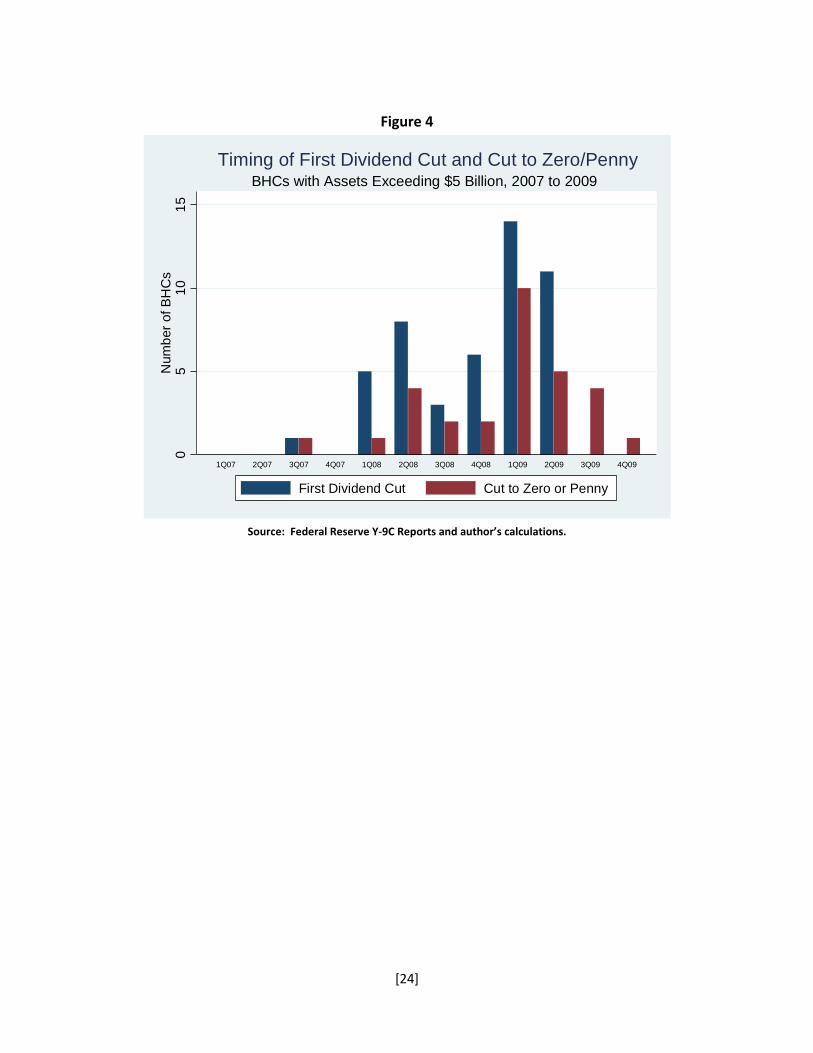
Figure 4 illustrates the timing of initial dividend reductions and eliminations by the sample BHCs
between 2007 and 2009. Consistent with the results in Figure 1, which shows the dollar amount of
dividends paid, there were few dividend reductions until mid‐2008 and many BHCs in the sample did not
reduce their dividends for the first time until the first half of 2009. Most BHCs that eliminated their
dividends did so during 2009, though a third of those BHCs that would eventually eliminate their
dividends had done so by the end of 2008.
Table 3 provides a preliminary examination of the relationship between repurchases and
dividend reductions during the financial crisis. The table divides the sample of BHCs into “high
repurchase” and “low repurchase” sub‐samples, based on the whether the BHC’s cumulative
repurchases before the financial crisis (in 2005 and 2006) scaled by assets are below or above the
median value for the 66 BHCs in the sample. The table shows the percentage of low‐repurchase and
high‐repurchase BHCs that cut or eliminated dividends at some point during the financial crisis. For the
sample as a whole (the top panel of the table), pre‐crisis repurchase activity has no relationship to the
probability that a BHC reduces dividends during the financial crisis: about three‐quarters of both low‐
repurchase and high‐repurchase BHCs cut dividends. When the sample is separated by asset size (the
middle and bottom panels of the table), however, a different picture emerges. Among smaller BHCs,
higher pre‐crisis repurchases are associated with a lower probability of reducing dividends, with 53% of
high‐repurchase smaller BHCs reducing dividends, compared to 68% of low‐repurchase smaller BHCs.
12 The results are substantially similar if these BHCs are retained in the estimation sample and treated as censored subjects. Note that BHCs that cut dividends and later stop filing regulatory reports are retained in the main estimation sample. Most BHCs that became stressed and were acquired by other BHCs during the financial crisis cut dividends before being acquired, so the sample should not suffer from significant survivorship bias.

[11]
Among the larger BHCs, the opposite relationship seems to hold, though since all but two of these BHCs
cut their dividends during the crisis, the difference is difficult to interpret.
The right side of the table shows the relationship between pre‐crisis repurchases and reductions
in dividends to zero or a penny. The extent of pre‐crisis repurchases seems to be associated with
whether a BHC eventually eliminated its dividend. BHCs that were more active repurchasers prior to the
financial crisis were less likely to reduce dividends to zero or penny, with 33% of high‐repurchase BHCs
eliminating dividends as compared to 58% of low‐repurchase BHCs. Similar to general dividend
reductions, there are differences in this relationship by BHC asset size. Among smaller BHCs, high pre‐
crisis repurchases are associated with a lower probability of eliminating dividends, while among larger
institutions, there is no strong relationship between pre‐crisis repurchases and dividend elimination
during the financial crisis. As noted, the larger BHCs in the sample were more likely to eliminate
dividends than the smaller BHCs.
4. Empirical Specification and Estimation Results
The Timing of Dividend Reductions
The information in Table 3 is consistent with the idea that the ability to reduce repurchases
served as a buffer against the need for BHCs to reduce or eliminate dividends during the financial crisis,
at least for the smaller institutions in the sample. This section presents results that explore these
relationships in a more rigorous way. These results are based on estimation of a Cox proportional
hazard model:
∗ exp ⋯ ,
where h0(t) is the baseline hazard for period t, hi(t) is the period t hazard for BHC i, and Xβ is a vector of
BHC‐specific variables (xi) and associated coefficients (β). In the Cox model, the BHC‐specific variables
shift the BHC‐specific hazard up or down proportionately to the baseline hazard and the regression
coefficients (the βs) show the estimated impact of each variable on the amount and direction of this
shift. A positive coefficient β indicates that a higher value of the variable increases the BHC‐specific
hazard. As noted above, the two hazard events examined in the analysis are the first time a BHC
reduced its dividend during 2007 to 2009 and the point at which the BHC eliminated its dividend during
this period.
The variables in the model specification include a series of control variables suggested by
previous research as factors that affect corporate dividend payout policies (Abreu and Gulamhussen
2013, Hull 2013, Kanas 2013, Onali 2014, Srivastav et al. 2014). These factors include firm size (log of
total assets) and profitability (return on assets, calculated as after tax net income divided by total
[12]
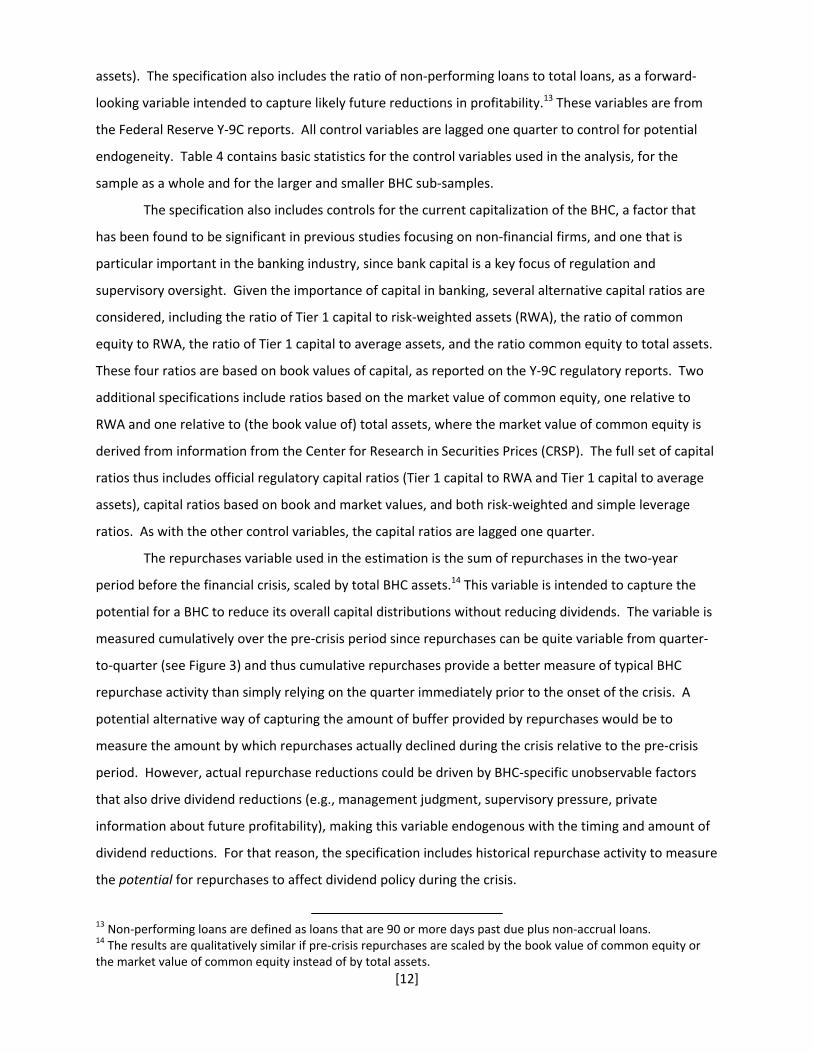
assets). The specification also includes the ratio of non‐performing loans to total loans, as a forward‐
looking variable intended to capture likely future reductions in profitability.13 These variables are from
the Federal Reserve Y‐9C reports. All control variables are lagged one quarter to control for potential
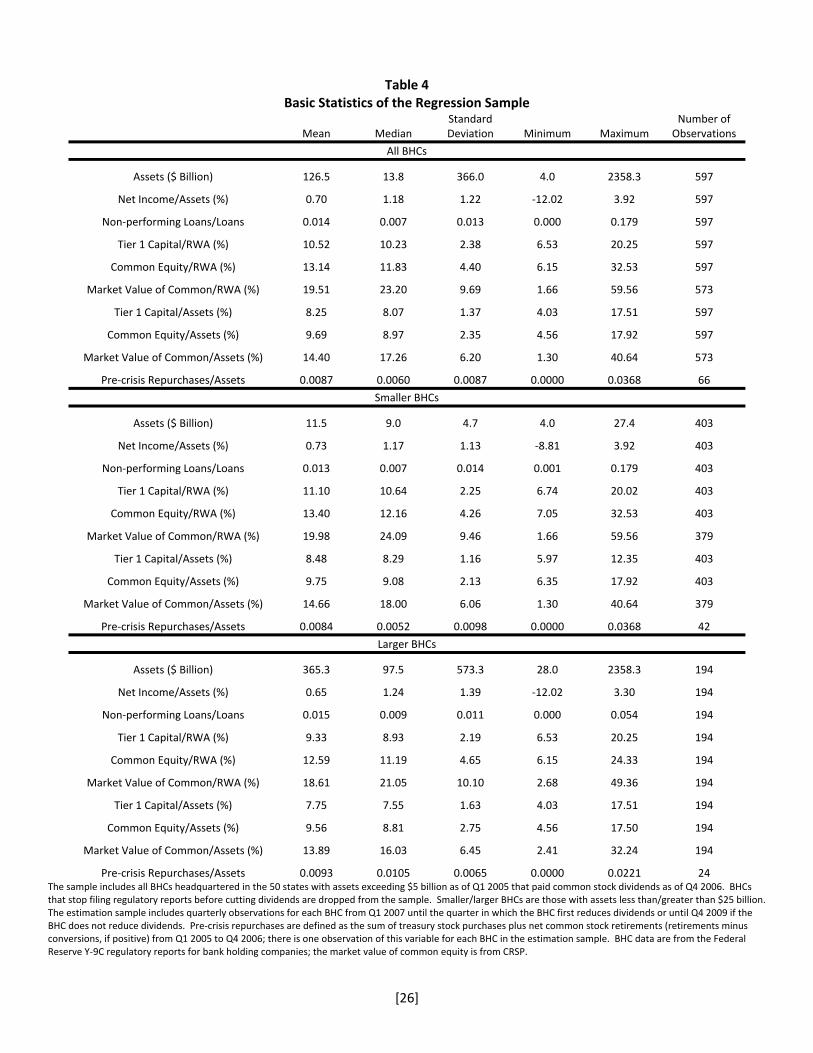
endogeneity. Table 4 contains basic statistics for the control variables used in the analysis, for the
sample as a whole and for the larger and smaller BHC sub‐samples.
The specification also includes controls for the current capitalization of the BHC, a factor that
has been found to be significant in previous studies focusing on non‐financial firms, and one that is
particular important in the banking industry, since bank capital is a key focus of regulation and
supervisory oversight. Given the importance of capital in banking, several alternative capital ratios are
considered, including the ratio of Tier 1 capital to risk‐weighted assets (RWA), the ratio of common
equity to RWA, the ratio of Tier 1 capital to average assets, and the ratio common equity to total assets.
These four ratios are based on book values of capital, as reported on the Y‐9C regulatory reports. Two
additional specifications include ratios based on the market value of common equity, one relative to
RWA and one relative to (the book value of) total assets, where the market value of common equity is
derived from information from the Center for Research in Securities Prices (CRSP). The full set of capital
ratios thus includes official regulatory capital ratios (Tier 1 capital to RWA and Tier 1 capital to average
assets), capital ratios based on book and market values, and both risk‐weighted and simple leverage
ratios. As with the other control variables, the capital ratios are lagged one quarter.
The repurchases variable used in the estimation is the sum of repurchases in the two‐year
period before the financial crisis, scaled by total BHC assets.14 This variable is intended to capture the
potential for a BHC to reduce its overall capital distributions without reducing dividends. The variable is
measured cumulatively over the pre‐crisis period since repurchases can be quite variable from quarter‐
to‐quarter (see Figure 3) and thus cumulative repurchases provide a better measure of typical BHC
repurchase activity than simply relying on the quarter immediately prior to the onset of the crisis. A
potential alternative way of capturing the amount of buffer provided by repurchases would be to
measure the amount by which repurchases actually declined during the crisis relative to the pre‐crisis
period. However, actual repurchase reductions could be driven by BHC‐specific unobservable factors
that also drive dividend reductions (e.g., management judgment, supervisory pressure, private
information about future profitability), making this variable endogenous with the timing and amount of
dividend reductions. For that reason, the specification includes historical repurchase activity to measure
the potential for repurchases to affect dividend policy during the crisis.
13 Non‐performing loans are defined as loans that are 90 or more days past due plus non‐accrual loans. 14 The results are qualitatively similar if pre‐crisis repurchases are scaled by the book value of common equity or the market value of common equity instead of by total assets.
[13]
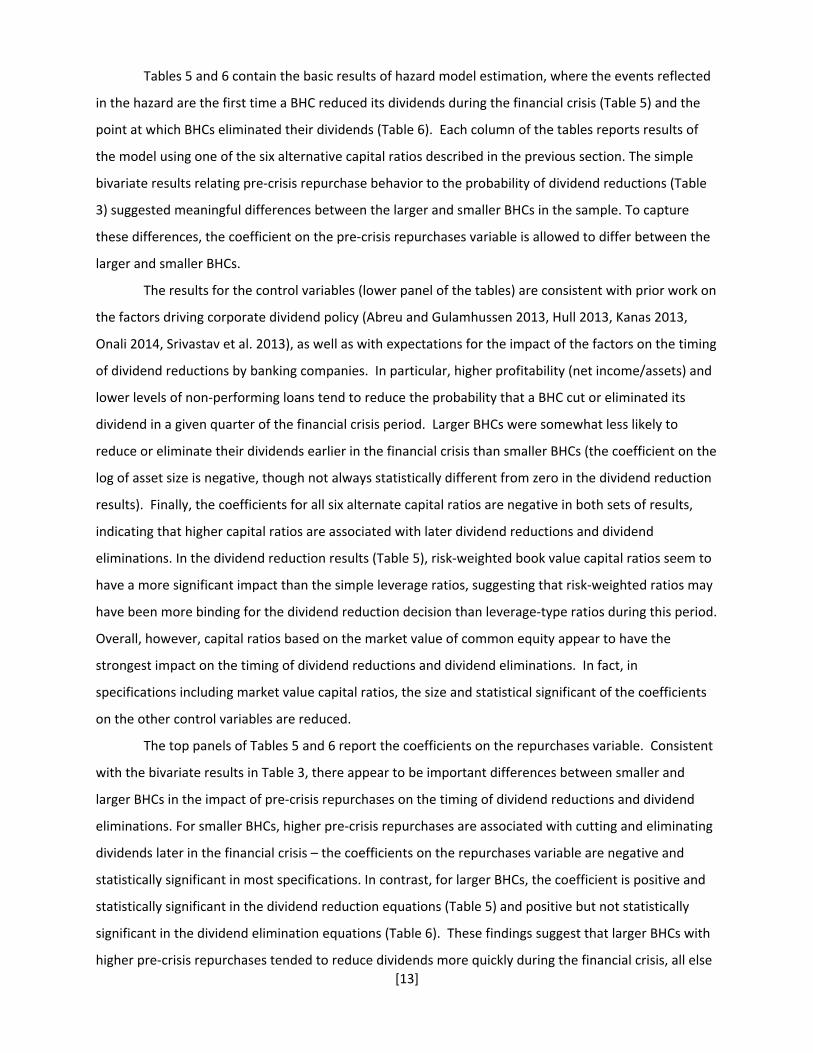
Tables 5 and 6 contain the basic results of hazard model estimation, where the events reflected
in the hazard are the first time a BHC reduced its dividends during the financial crisis (Table 5) and the
point at which BHCs eliminated their dividends (Table 6). Each column of the tables reports results of
the model using one of the six alternative capital ratios described in the previous section. The simple
bivariate results relating pre‐crisis repurchase behavior to the probability of dividend reductions (Table
3) suggested meaningful differences between the larger and smaller BHCs in the sample. To capture
these differences, the coefficient on the pre‐crisis repurchases variable is allowed to differ between the
larger and smaller BHCs.
The results for the control variables (lower panel of the tables) are consistent with prior work on
the factors driving corporate dividend policy (Abreu and Gulamhussen 2013, Hull 2013, Kanas 2013,
Onali 2014, Srivastav et al. 2013), as well as with expectations for the impact of the factors on the timing
of dividend reductions by banking companies. In particular, higher profitability (net income/assets) and
lower levels of non‐performing loans tend to reduce the probability that a BHC cut or eliminated its
dividend in a given quarter of the financial crisis period. Larger BHCs were somewhat less likely to
reduce or eliminate their dividends earlier in the financial crisis than smaller BHCs (the coefficient on the
log of asset size is negative, though not always statistically different from zero in the dividend reduction
results). Finally, the coefficients for all six alternate capital ratios are negative in both sets of results,
indicating that higher capital ratios are associated with later dividend reductions and dividend
eliminations. In the dividend reduction results (Table 5), risk‐weighted book value capital ratios seem to
have a more significant impact than the simple leverage ratios, suggesting that risk‐weighted ratios may
have been more binding for the dividend reduction decision than leverage‐type ratios during this period.
Overall, however, capital ratios based on the market value of common equity appear to have the
strongest impact on the timing of dividend reductions and dividend eliminations. In fact, in
specifications including market value capital ratios, the size and statistical significant of the coefficients
on the other control variables are reduced.
The top panels of Tables 5 and 6 report the coefficients on the repurchases variable. Consistent
with the bivariate results in Table 3, there appear to be important differences between smaller and
larger BHCs in the impact of pre‐crisis repurchases on the timing of dividend reductions and dividend
eliminations. For smaller BHCs, higher pre‐crisis repurchases are associated with cutting and eliminating
dividends later in the financial crisis – the coefficients on the repurchases variable are negative and
statistically significant in most specifications. In contrast, for larger BHCs, the coefficient is positive and
statistically significant in the dividend reduction equations (Table 5) and positive but not statistically
significant in the dividend elimination equations (Table 6). These findings suggest that larger BHCs with
higher pre‐crisis repurchases tended to reduce dividends more quickly during the financial crisis, all else
[14]
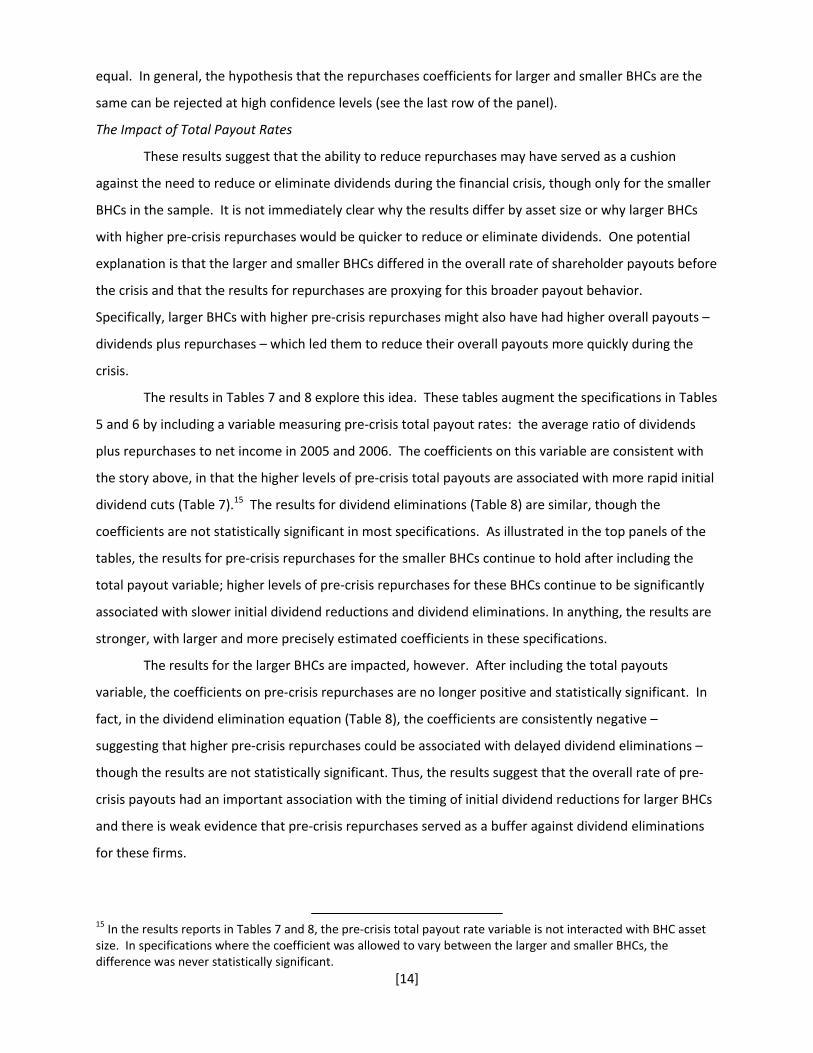
equal. In general, the hypothesis that the repurchases coefficients for larger and smaller BHCs are the
same can be rejected at high confidence levels (see the last row of the panel).
The Impact of Total Payout Rates
These results suggest that the ability to reduce repurchases may have served as a cushion
against the need to reduce or eliminate dividends during the financial crisis, though only for the smaller
BHCs in the sample. It is not immediately clear why the results differ by asset size or why larger BHCs
with higher pre‐crisis repurchases would be quicker to reduce or eliminate dividends. One potential
explanation is that the larger and smaller BHCs differed in the overall rate of shareholder payouts before
the crisis and that the results for repurchases are proxying for this broader payout behavior.
Specifically, larger BHCs with higher pre‐crisis repurchases might also have had higher overall payouts –
dividends plus repurchases – which led them to reduce their overall payouts more quickly during the
crisis.
The results in Tables 7 and 8 explore this idea. These tables augment the specifications in Tables
5 and 6 by including a variable measuring pre‐crisis total payout rates: the average ratio of dividends
plus repurchases to net income in 2005 and 2006. The coefficients on this variable are consistent with
the story above, in that the higher levels of pre‐crisis total payouts are associated with more rapid initial
dividend cuts (Table 7).15 The results for dividend eliminations (Table 8) are similar, though the
coefficients are not statistically significant in most specifications. As illustrated in the top panels of the
tables, the results for pre‐crisis repurchases for the smaller BHCs continue to hold after including the
total payout variable; higher levels of pre‐crisis repurchases for these BHCs continue to be significantly
associated with slower initial dividend reductions and dividend eliminations. In anything, the results are
stronger, with larger and more precisely estimated coefficients in these specifications.
The results for the larger BHCs are impacted, however. After including the total payouts
variable, the coefficients on pre‐crisis repurchases are no longer positive and statistically significant. In
fact, in the dividend elimination equation (Table 8), the coefficients are consistently negative –
suggesting that higher pre‐crisis repurchases could be associated with delayed dividend eliminations –
though the results are not statistically significant. Thus, the results suggest that the overall rate of pre‐
crisis payouts had an important association with the timing of initial dividend reductions for larger BHCs
and there is weak evidence that pre‐crisis repurchases served as a buffer against dividend eliminations
for these firms.
15 In the results reports in Tables 7 and 8, the pre‐crisis total payout rate variable is not interacted with BHC asset size. In specifications where the coefficient was allowed to vary between the larger and smaller BHCs, the difference was never statistically significant.

[15]
Robustness: Expectations of Crisis Performance and Market Discipline
An important assumption underlying the analysis thus far is that the size of pre‐crisis
repurchases is not endogenously related to the performance of these BHCs during the crisis. This need
be the case. For instance, it could be that higher pre‐crisis repurchases were driven by higher income
volatility, this higher volatility in turn resulted in those BHCs experiencing sharper declines in profits and
capital during the financial crisis, and that these declines simply overwhelmed any cushioning effect of
the higher repurchases. While the estimates control for BHC performance during the crisis by including
return on assets and the non‐performing loan rate in the specification, these variables capture
performance to date rather than expectations of all‐in performance during the crisis (although the non‐
performing loan rate has a forward‐looking aspect). To the extent that BHC management anticipated
large losses in future quarters of the crisis, this could have led to earlier dividend reductions given
performance to date.
The results in Tables 9 and 10 explore this possibility. The tables present extensions of the
hazard model specification including variables that capture expectations of future performance by the
BHCs during the financial crisis. The tables show the results of including three different measures of
expected BHC performance during the crisis: average realized ROA during the crisis (a perfect‐foresight
expectations measure), the ratio to market to book value of common stock (a market‐based measure),
and the median one‐quarter‐ahead analysts’ forecast of earnings‐per‐share (EPS).16 Table 9 reports
results for initial dividend reductions, while Table 10 reports results for dividend eliminations. For
conciseness, both tables just report coefficient estimates on the repurchases variable, the pre‐crisis total
payout rate, and the three different expectations variables, though the equations contain the full set of
variables reported in Tables 7 and 8.
Overall, the findings do not change substantively when these crisis performance expectations
measures are included in the specifications. The coefficients on each of the three crisis expectations
measures enter the equations with the expected sign for both larger and smaller BHCs (indicating that
expectations of better crisis performance were associated with later dividend cuts and dividend
eliminations), and are statistically significant in most specifications.17 In general, the results continue to
suggest that higher pre‐crisis repurchases are associated with later dividend cuts and eliminations for
the smaller BHCs; the coefficients on pre‐crisis repurchases continue to be negative and statistically
16 The median EPS forecast is scaled by the average one‐quarter‐ahead EPS forecast during 2005 and 2006 so that the measure is comparable across BHCs. 17 The coefficients are least precisely estimated in the equations involving the market value capital ratios. In addition, the coefficient on the crisis ROA variable for smaller BHCs is not statistically significant in most of the specifications of the dividend elimination equation, though it generally has the expected sign.
[16]
significant. For the larger BHCs, the coefficients on pre‐crisis repurchases are again not statistically
significant, though they are consistently negative in the dividend elimination equations (Table 10). Thus,
the results for the larger BHCs do not appear to be driven by expectations of larger losses during the
crisis over‐whelming any cushion provided by the ability to reduce repurchases.
An alternative explanation for the larger BHC result is that, among the larger BHCs, those with
higher repurchases prior to the financial crisis received greater market scrutiny and were thus subject to
more intensive market discipline, which caused BHC management to reduce dividends more quickly as
financial market conditions deteriorated.
Table 11 reports results of the hazard models including a variable proxying for differences in
market scrutiny across BHCs: the number of analysts reporting EPS projections for the BHC in each
quarter. The results suggest that BHCs covered by more analysts reduced dividends more quickly during
the financial crisis, and that the impact of additional analyst coverage was greatest for the smaller BHCs
in the sample. The results suggest a significant relationship between analyst coverage and the timing of
dividend eliminations only for smaller BHCs (bottom panel of Table 11). In no case, however, does
including the analyst coverage variables alter the results relating pre‐crisis repurchases and the timing of
dividend reductions and eliminations.
The Size of Dividend Reductions
The results thus far have focused on the timing of dividend reductions and eliminations during
the financial crisis. A related question is whether pre‐crisis repurchases affected not just the timing, but
also the size, of dividend reductions. Were BHCs with higher repurchases during the financial crisis able
to reduce their dividends by smaller amounts, once those reductions occurred?
As a first step in addressing this question, Table 12 presents some basic information on the size
of dividend reductions. The top panel of the table shows the percent change in dividends‐per‐share the
first time a BHC reduced its dividends between Q1 2007 and Q4 2009, while the bottom panel shows the
size of the total dividend‐per‐share reduction over this period. Each panel splits the sample into “low
repurchase” and “high repurchase” BHCs, where, as before, low and high repurchase BHCs are defined
by whether cumulative pre‐crisis repurchases scaled by assets are below or above the median value for
the 66 BHCs in the sample.
The average initial reduction in dividends‐per‐share was just under 65% for all BHCs, while the
average total reduction over the crisis period was more than 90%.18 As the first column of the table
shows, there is no significant difference in the size of the initial dividend reduction between low
repurchase and high repurchase BHCs for the sample as a whole, though high repurchase BHCs appear
18 The numbers in Table 12 are for the 48 BHCs that reduced dividends. The results presented in Table 13 take account of potential biases from the selection process between BHCs that did and did not reduce dividends.
[17]
to have experienced smaller total dividend reductions (bottom panel). The remaining columns of the
table show the difference in initial and total dividend reductions by BHC asset size. While there is no
meaningful difference in the size of the initial dividend reduction between high repurchase and low
repurchase BHCs for either asset size category, total dividend reductions by low repurchase smaller
BHCs were significantly larger than for high repurchase smaller BHCs. Total dividend reductions were
also larger for low repurchase larger BHCs, but the difference is significant only at the 16% level.
To explore these findings further, Table 13 presents results of multivariate analysis of the size of
BHCs’ initial and total dividend reductions. Since not all BHCs reduced dividends during the crisis, the
analysis is based on a two‐step Heckman selection model to take account of potential selection bias. The
first step assesses the probability that a BHC reduced dividends, using the control variables from the
hazard model analysis of the timing of dividend reductions (log of total assets, net income scaled by
assets, the non‐performing loan share, and either the ratio of the market value or book value of
common equity to risk‐weighted assets). As illustrated in columns labeled “selection equation,” these
variables enter with the expected signs and with coefficients that are statistically significant, except for
net income.
The bottom panel of the tables show the results explaining the size of the initial and total
dividend reductions, after controlling for the selection correction term. Drawing on the hazard rate
results discussed above, these second‐stage equations contain the pre‐crisis total payout rate and pre‐
crisis repurchases interacted with BHC size group. The results of the multivariate analysis mirror those
for the bivariate results presented in Table 12. There is no statistically significant relationship between
the extent of repurchases before the financial crisis and the size of the initial dividend reduction, for
either larger or smaller BHCs (left‐hand side of Table 13). The coefficients on the repurchase variables
are never statistically significant. In contrast, the results for total dividend reductions (right‐hand side of
the table) suggest that higher levels of pre‐crisis repurchases are associated with lower total dividend
reductions over the crisis period for smaller BHCs (the positive impact of higher repurchases offsetting
the negatively‐valued reductions). The coefficients on pre‐crisis repurchases are also positive for the
larger BHCs, but they are not statistically significant.
Overall, the results suggest that repurchase behavior prior to the financial crisis had an impact
on the overall size of dividend reductions during the financial crisis, especially for the smaller BHCs in the
sample. There is no evidence that pre‐crisis repurchase behavior had an impact on the size of initial
dividend reductions, even though it appears to be associated with differences in the timing of those
reductions for the smaller BHCs.
[18]
5. Summary and Conclusions
This paper has examined the relationship between repurchases and dividends by large BHCs
during the financial crisis. The motivation for examining this relationship is the observation that while
BHCs continued to pay dividends at pre‐crisis levels well after the onset of the financial crisis, they
reduced share repurchases relatively quickly. Documenting this divergent behavior is an important
contribution of this paper, as previous commentary and analysis has tended to focus on dividend
payments alone. Much of that analysis has focused on the drain of capital from the banking system
during a time a severe stress, including theoretical work suggesting that BHCs’ continued dividend
payments may have been motivated by a desire to shift value from creditors to shareholders.
The findings in this paper suggest a somewhat different interpretation, however. Among the
BHCs in the sample, smaller institutions with higher levels of repurchases before the financial crisis were
slower to reduce and eliminate dividends during the financial crisis than similar BHCs with lower pre‐
crisis repurchases. These BHCs not only reduced their dividends later in the crisis than similar BHCs with
lower pre‐crisis repurchases, but also reduced their dividends by smaller amounts. For these BHCs, the
ability to reduce repurchases may have served as a kind of buffer, allowing them to reduce shareholder
payouts and retain capital within the firm without undergoing the immediate negative public signal
associated with a dividend reduction. This behavior is more consistent with a precautionary view of bank
capital, in which these BHCs were attempting to manage their capital resources to ensure the continued
viability of the firm. In considering the significance of these findings, it is important to remember that all
the BHCs are in the sample are relatively large financial institutions, so the behavior of even the smaller
ones is meaningful for the stability and performance of the overall U.S. banking system.
The results suggest that the impact of repurchases at the larger BHCs in the sample differed
significantly from the impact at the smaller BHCs. There is limited evidence that larger BHCs with higher
pre‐crisis repurchases were slower to reduce to dividends earlier in the crisis, once pre‐crisis total
payout behavior is accounted for. One possible explanation is that the larger BHCs were subject to more
intensive market discipline, which drove their payout behavior, and thus their dividend reductions were
not as affected by any buffering impact of repurchases. In fact, nearly all of largest BHCs (more than
90%) reduced their dividends during the financial crisis, as compared to less than two‐thirds of the
smaller BHCs. The largest BHCs were also somewhat more likely to eliminate their dividends than the
smaller BHCs. However, including variables designed to capture potential differences in the extent of
market scrutiny across larger BHCs does not alter the finding that larger BHCs with higher repurchases
before the crisis did not tend to reduce dividends more slowly during the financial crisis.
Overall, the findings suggest a complex, dynamic relationship between overall payout rates and
the split of those payouts between dividends and repurchases. Understanding this relationship is

[19]
particularly critical in the banking industry, given the important role of bank capital in financial stability
and the primacy of capital regulation in the oversight of these institutions. On the one hand, supervisory
measures encouraging BHCs to rely more on repurchases could enhance the stability of individual BHCs
and of the banking system if these distributions can be reduced without sending potentially destabilizing
signals to market participants. On the other hand, increased emphasis on repurchases could foster
increased scrutiny and market monitoring of these transactions, reducing BHCs’ flexibility to change
these actions over time. Additional research on the determinants of shareholder payouts in the banking
industry could help shed light on which of these forces is more likely to prevail and, thus, whether
policymakers should emphasize repurchases as the preferred means for BHCs to return capital to
shareholders.
[20]
References
Abreu, Filipe José and Mohamed Azzim Gulamhussen. 2013. Journal of Corporate Finance. 22: 54‐65. Acharya, Viral, Irvind Gujral, Nirupama Kulkarni and Hyun Song Shin. 2012. “Dividends and Bank Capital
in the Financial Crisis of 2007‐2009.” CEPR Discussion Paper No. 8801. February 2012. Acharya, Viral, Hanh Le, and Hyun Song Shin. 2014. “Bank Capital and Dividend Externalities.”
Manuscript. CEPR Discussion Paper No. 9865. Berger, Allen N., Robert DeYoung, Mark J. Flannery, David Lee and Ozde Oztekin. 2008. “How Do Large
Banking Organizations Manage Their Capital Ratios?” Journal of Financial Services Research. 34: 123‐149.
Bessler, Wolfgang and Tom Nohel. 1996. “The Stock‐Market Reaction to Dividend Cuts and Omissions
by Commercial Banks.” Journal of Banking and Finance. 20: 1485‐1508. _________. 2000. “Asymmetric Information, Dividend Reductions, and Contagion Effects in Bank Stock
Returns.” Journal of Banking and Finance. 24: 1831‐1848. Bliss, Barbara A., Yingmei Cheng, and David J. Denis. 2015. “Corporate Payout, Cash Retention, and the
Supply of Credit: Evidence from the 2008‐09 Credit Crisis.” Journal of Financial Economics. 115: 521‐40.
Board of Governors of the Federal Reserve System. 2016. “Comprehensive Capital Analysis and Review
2016 Summary Instructions.” January 2016. http://www.federalreserve.gov/newsevents/press/bcreg/bcreg20160128a1.pdf
Bonaimé, Alice Adams. 2012. “Repurchases, Reputation, and Returns.” Journal of Financial and
Quantitative Analysis. 47: 469‐491. Bonaimé, Alice Adams, Kristine Watson Hankins and Jarrad Harford. 2014. “Financial Flexibility, Risk
Management, and Payout Choices.” The Review of Financial Studies. Forthcoming. Chuy, J.B. and Jungwon Suh. 2009. “Payout Policy and Cash‐Flow Uncertainty.” Journal of Financial
Economics. 93: 88‐107. DeAngelo, Harry, Linda DeAngelo, and René M. Stulz. 2006. “Dividend Policy and the
Earned/Contributed Capital Mix: A Test of the Life‐Cycle Theory.” Journal of Financial Economics. 81: 227‐254.
Denis, David J., Diane K. Denis and Atulya Sarin. 1994. “The Information Content of Dividend Changes:
Cash Flow Signaling, Overinvestment, and Dividend Clienteles.” Journal of Financial and Quantitative Analysis. 29: 567‐587.
Ghosh, Chinmoy and J. Randall Woolridge. 1988. “An Analysis of Shareholder Reaction to Dividend Cuts
and Omissions.” The Journal of Financial Research. XI: 281‐294.
[21]
Grullon, Gustavo and Roni Michaely. 2002. “Dividends, Share Repurchases, and the Substitution Hypothesis.” Journal of Finance. LVII: 1649 – 1684.
Guntay, Levent, Stefan Jacewitz and Jonathan Pogach. 2015. “Proving Approval: Dividend Regulation
and Capital Payout Incentives.” Federal Deposit Insurance Corporation/Center for Financial Research. Working Paper Series 2015‐15.
Hirtle, Beverly. 2004. “Stock Repurchases and Bank Holding Company Performance.” Journal of Financial
Intermediation. 13:1, 28‐57. Hull, Tyler J. 2013. “Does the Timing of Dividend Reductions Signal Value? Empirical Evidence.” Journal
of Corporate Finance. 22: 193‐208. Jagannathan, Murali, Clifford P. Stephens, and Michael S. Weisbach. 2000. “Financial Flexibility and the
Choice between Dividends and Stock Repurchases.” Journal of Financial Economics. 57: 355‐384.
Kanas, Angelos. 2013. “Bank Dividends, Risk, and Regulatory Reform.” Journal of Banking and Finance.
37: 1‐10. Kane, Stephen and Raul Susmel. 1999. “Regime‐Switching Event Studies: An Application to Commercial
Bank Stock Repurchases.” Research in Finance. (A.H. Chen Ed.) JAI Press: Stamford. Leary, Mark T. and Roni Michaely. 2011. “Determinants of Dividend Smoothing: Empirical Evidence.” The
Review of Financial Studies. 24: 3197‐3249. Lintner, John. 1956. “Distribution of Incomes of Corporations Among Dividends, Retained Earnings, and
Taxes.” American Economic Review. 46: 97‐113. Onali, Enrico. 2014. “Moral Hazard, Dividends, and Risk in Banks.” Journal of Business Finance and
Accounting. 41: 128‐55. Rosengren, Eric S. 2010. “Dividend Policy and Capital Retention: A Systemic ‘First Response’.” Federal
Reserve Bank of Boston. October 10, 2010. http://www.bostonfed.org/news/speeches/rosengren/2010/101010/index.htm
Scharfstein, David S. and Jeremy C. Stein. 2008. “This Bailout Doesn’t Pay Dividends.” New York Times.
October 21, A29. Srivastav, Abhishek, Seth Armitage, and Jens Hagendorff. 2014. “CEO Inside Debt Holdings and Risk‐
Shifting: Evidence from the Dividend Policies of TARP Banks.” Journal of Banking and Finance. 47: 41‐53.
Stephens, Clifford P. and Michael S. Weisbach. 1998. “Actual Share Reacquisitions in Open‐Market
Repurchase Programs. Journal of Finance. 53: 313‐334. Vermaelen, Theo. 2005. “Share Repurchases.” Foundations and Trends in Finance. 1: 171‐268.
[22]
05
10
15
$ B
illio
n
1Q05 2Q05 3Q05 4Q05 1Q06 2Q06 3Q06 4Q06 1Q07 2Q07 3Q07 4Q07 1Q08 2Q08 3Q08 4Q08 1Q09 2Q09 3Q09 4Q09
All top-tier domestic bank holding companies with assets over $5 billion as of Q1 2005.Source: Federal Reserve Y-9C Reports
2005 to 2009
Figure 1Dividends Paid by Large Bank Holding Companies
05
10
15
$ B
illio
n
1Q05 2Q05 3Q05 4Q05 1Q06 2Q06 3Q06 4Q06 1Q07 2Q07 3Q07 4Q07 1Q08 2Q08 3Q08 4Q08 1Q09 2Q09 3Q09 4Q09
All top-tier domestic bank holding companies with assets over $5 billion as of Q1 2005.Repurchases are defined as treasury stock purchases plus net retirement/conversion of common stock, when positive.Source: Federal Reserve Y-9C Reports
2005 to 2009
Figure 2Dividends and Repurchases
by Large Bank Holding Companies
Dividends Repurchases
[23]
Figure 3
Dividends and Repurchases by Large Bank Holding Companies 2005 to 2009
A: BHCs with Assets Greater than $120 Billion
B: BHCs with Assets between $10 and $15 Billion
Source: Federal Reserve Y‐9C Reports and author’s calculations.
0.0
01.0
02.0
03
0.0
01.0
02.0
03.0
04
0.0
05.0
1.0
15
0.0
01.0
02.0
03.0
04
0.0
01.0
02.0
03
0.0
05.0
1.0
15
0.0
01.0
02.0
03
0.0
02.0
04.0
06.0
08
0.0
02.0
04.0
06
0.0
02.0
04.0
06
0.0
01.0
02.0
03.0
04
0.0
05
2005 2006 2007 2008 2009 2010 2005 2006 2007 2008 2009 2010 2005 2006 2007 2008 2009 2010 2005 2006 2007 2008 2009 2010
2005 2006 2007 2008 2009 2010 2005 2006 2007 2008 2009 2010 2005 2006 2007 2008 2009 2010 2005 2006 2007 2008 2009 2010
2005 2006 2007 2008 2009 2010 2005 2006 2007 2008 2009 2010 2005 2006 2007 2008 2009 2010 2005 2006 2007 2008 2009 2010
BANK OF AMERICA CORPORATION Bank of New York Mellon CAPITAL ONE FINANCIAL CORPORATION CITIGROUP INC.
JPMORGAN CHASE & CO. NATIONAL CITY CORPORATION PNC FINANCIAL SERVICES GROUP, INC., THE STATE STREET CORPORATION
SUNTRUST BANKS, INC. U.S. BANCORP WACHOVIA CORPORATION WELLS FARGO & COMPANY
Dividends Repurchases
Graphs by nm_lgl
0.0
005
.001
.001
5
0.0
05.0
1.0
15
0.0
02.0
04.0
06
0.0
005
.001
.001
5
0.0
02.0
04.0
06
0.0
02.0
04.0
06
0.0
005
.001
.001
5.0
02
0.0
05
0.0
01.0
02.0
03
0.0
01.0
02.0
03.0
04
2005 2006 2007 2008 2009 2010 2005 2006 2007 2008 2009 2010 2005 2006 2007 2008 2009 2010 2005 2006 2007 2008 2009 2010
2005 2006 2007 2008 2009 2010 2005 2006 2007 2008 2009 2010 2005 2006 2007 2008 2009 2010 2005 2006 2007 2008 2009 2010
2005 2006 2007 2008 2009 2010 2005 2006 2007 2008 2009 2010
BANCORPSOUTH, INC. BANK OF HAWAII CORPORATION CULLEN/FROST BANKERS, INC. Citizens Republic Bancorp, Inc.
FIRSTMERIT CORPORATION FULTON FINANCIAL CORPORATION SOUTH FINANCIAL GROUP, INC., THE TCF FINANCIAL CORPORATION
VALLEY NATIONAL BANCORP WILMINGTON TRUST CORPORATION
Dividends Repurchases
Graphs by nm_lgl
[24]
Figure 4
Source: Federal Reserve Y‐9C Reports and author’s calculations.
05
10
15
Num
ber
of B
HC
s
1Q07 2Q07 3Q07 4Q07 1Q08 2Q08 3Q08 4Q08 1Q09 2Q09 3Q09 4Q09
BHCs with Assets Exceeding $5 Billion, 2007 to 2009Timing of First Dividend Cut and Cut to Zero/Penny
First Dividend Cut Cut to Zero or Penny
[25]
Table 1 Dividend and Repurchase Behavior
By Large Bank Holding Companies before the Financial Crisis 2005 to 2006
Made Repurchases Did Not Make Repurchases Total
Paid Dividends
63
10
73
Did Not Pay Dividends
2
3
5
Total
65
13
78
Note: The sample includes BHCs headquartered in the 50 states with assets exceeding $5 billion as of Q1 2005 that survived at least until Q1 2007. Three special purpose BHCs are dropped from the sample, as are three BHCs that pay dividends irregularly. Source: Federal Reserve Y‐9C Reports.
Table 2 BHC Dividend Behavior during the Financial Crisis
2007 to 2009
Sample BHCs
Cut Dividends in 2007 ‐ 2009
Eliminated Dividend
Number
Number
% of Total
Number
% of Total
% of BHC Cutting Dividends
All BHCs 66 48 73% 30 45% 63% Smaller BHCs 42 26 62% 17 40% 65% Larger BHCs 24 22 92% 13 54% 59%
Note: The sample includes all BHCs headquartered in the 50 states with assets exceeding $5 billion as of Q1 2005 that paid common stock dividends as of Q4 2006. BHCs that stopped filing regulatory reports before cutting dividends are dropped from the sample. Smaller/Larger BHCs are those with assets less than/greater than $25 billion. A dividend cut is defined as a reduction in the ratio of dividends‐to‐assets and dividends‐per‐share greater than the 5
th percentile decline in these ratios during 2003 to 2006. A dividend elimination is defined as dividends‐per‐share falling below $0.011. Source: Federal Reserve Y‐9C Reports.
Table 3 Incidence and Extent of Dividend Cuts and Pre‐crisis Repurchases
2007 to 2009
Cut Dividends Eliminated Dividends
Sample BHCs
Number
% of Total
Number
% of Total
All BHCs
Low Repurchases 33 23 70% 19 58% High Repurchases 33 25 76% 11 33%
All 66 48 73% 30 45%
Smaller BHCs
Low Repurchases 25 17 68% 15 60% High Repurchases 17 9 53% 2 12%
All 42 26 62% 17 40%
Larger BHCs
Low Repurchases 8 6 75% 4 50% High Repurchases 16 16 100% 9 56%
All 24 22 92% 13 54% Note: The sample includes all BHCs headquartered in the 50 states with assets exceeding $5 billion as of Q1 2005 that paid common stock dividends as of Q4 2006. BHCs that stop filing regulatory reports before cutting dividends are dropped from the sample. Smaller/Larger BHCs are those with assets less than/greater than $25 billion. A dividend cut is defined as a reduction in the ratio of dividends‐to‐assets and dividends‐per‐share greater than the 5th percentile decline in these ratios during 2003 to 2006. “Eliminated Dividends” is the number of BHCs who reduced their dividends‐per‐share below $0.011 by Q4 2009. Low/High repurchases are defined as BHCs with 2005 – 2006 repurchases relative to assets below/above the median for the sample BHCs. Source: Federal Reserve Y‐9C Reports.
[26]
Table 4
Basic Statistics of the Regression Sample
Mean
Median Standard Deviation
Minimum
Maximum
Number of Observations
All BHCs
Assets ($ Billion) 126.5 13.8 366.0 4.0 2358.3 597
Net Income/Assets (%) 0.70 1.18 1.22 ‐12.02 3.92 597
Non‐performing Loans/Loans 0.014 0.007 0.013 0.000 0.179 597
Tier 1 Capital/RWA (%) 10.52 10.23 2.38 6.53 20.25 597
Common Equity/RWA (%) 13.14 11.83 4.40 6.15 32.53 597
Market Value of Common/RWA (%) 19.51 23.20 9.69 1.66 59.56 573
Tier 1 Capital/Assets (%) 8.25 8.07 1.37 4.03 17.51 597
Common Equity/Assets (%) 9.69 8.97 2.35 4.56 17.92 597
Market Value of Common/Assets (%) 14.40 17.26 6.20 1.30 40.64 573
Pre‐crisis Repurchases/Assets 0.0087 0.0060 0.0087 0.0000 0.0368 66
Smaller BHCs
Assets ($ Billion) 11.5 9.0 4.7 4.0 27.4 403
Net Income/Assets (%) 0.73 1.17 1.13 ‐8.81 3.92 403
Non‐performing Loans/Loans 0.013 0.007 0.014 0.001 0.179 403
Tier 1 Capital/RWA (%) 11.10 10.64 2.25 6.74 20.02 403
Common Equity/RWA (%) 13.40 12.16 4.26 7.05 32.53 403
Market Value of Common/RWA (%) 19.98 24.09 9.46 1.66 59.56 379
Tier 1 Capital/Assets (%) 8.48 8.29 1.16 5.97 12.35 403
Common Equity/Assets (%) 9.75 9.08 2.13 6.35 17.92 403
Market Value of Common/Assets (%) 14.66 18.00 6.06 1.30 40.64 379
Pre‐crisis Repurchases/Assets 0.0084 0.0052 0.0098 0.0000 0.0368 42
Larger BHCs
Assets ($ Billion) 365.3 97.5 573.3 28.0 2358.3 194
Net Income/Assets (%) 0.65 1.24 1.39 ‐12.02 3.30 194
Non‐performing Loans/Loans 0.015 0.009 0.011 0.000 0.054 194
Tier 1 Capital/RWA (%) 9.33 8.93 2.19 6.53 20.25 194
Common Equity/RWA (%) 12.59 11.19 4.65 6.15 24.33 194
Market Value of Common/RWA (%) 18.61 21.05 10.10 2.68 49.36 194
Tier 1 Capital/Assets (%) 7.75 7.55 1.63 4.03 17.51 194
Common Equity/Assets (%) 9.56 8.81 2.75 4.56 17.50 194
Market Value of Common/Assets (%) 13.89 16.03 6.45 2.41 32.24 194
Pre‐crisis Repurchases/Assets 0.0093 0.0105 0.0065 0.0000 0.0221 24 The sample includes all BHCs headquartered in the 50 states with assets exceeding $5 billion as of Q1 2005 that paid common stock dividends as of Q4 2006. BHCs that stop filing regulatory reports before cutting dividends are dropped from the sample. Smaller/larger BHCs are those with assets less than/greater than $25 billion. The estimation sample includes quarterly observations for each BHC from Q1 2007 until the quarter in which the BHC first reduces dividends or until Q4 2009 if the BHC does not reduce dividends. Pre‐crisis repurchases are defined as the sum of treasury stock purchases plus net common stock retirements (retirements minus conversions, if positive) from Q1 2005 to Q4 2006; there is one observation of this variable for each BHC in the estimation sample. BHC data are from the Federal Reserve Y‐9C regulatory reports for bank holding companies; the market value of common equity is from CRSP.
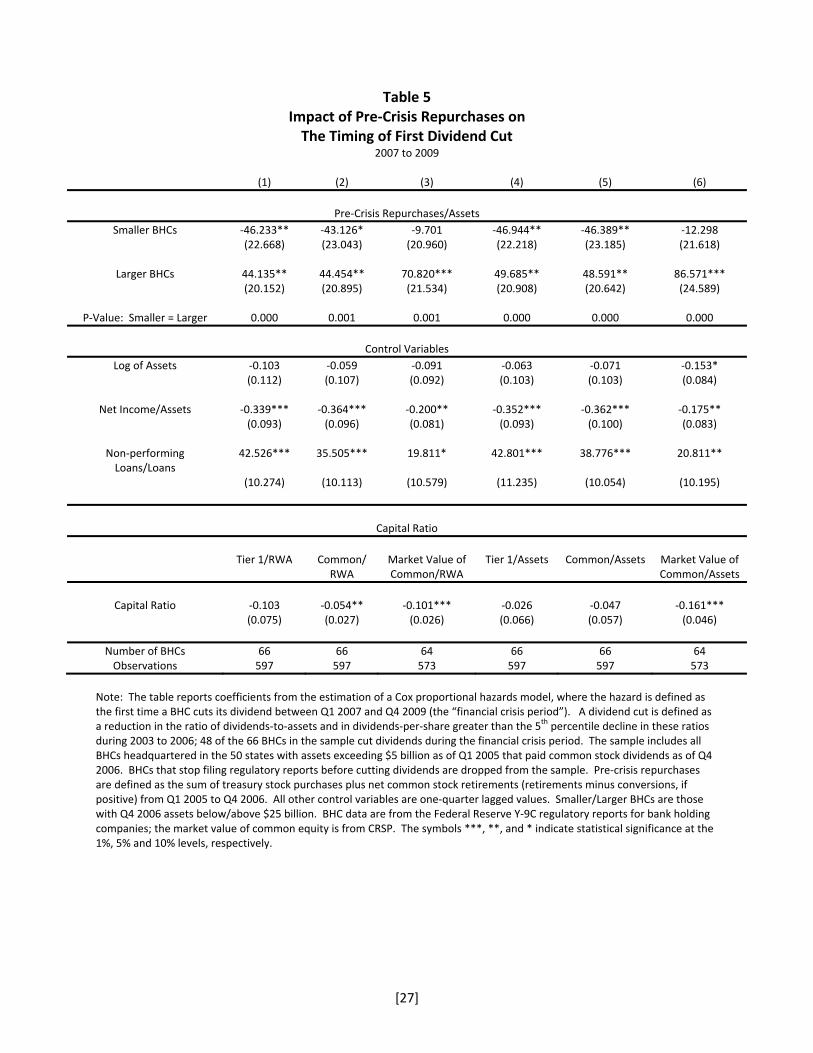
[27]
Table 5 Impact of Pre‐Crisis Repurchases on The Timing of First Dividend Cut
2007 to 2009
(1) (2) (3) (4) (5) (6)
Pre‐Crisis Repurchases/Assets
Smaller BHCs ‐46.233** ‐43.126* ‐9.701 ‐46.944** ‐46.389** ‐12.298 (22.668)
(23.043) (20.960) (22.218) (23.185) (21.618)
Larger BHCs 44.135** 44.454** 70.820*** 49.685** 48.591** 86.571*** (20.152)
(20.895) (21.534) (20.908) (20.642) (24.589)
P‐Value: Smaller = Larger 0.000 0.001 0.001 0.000 0.000 0.000
Control Variables
Log of Assets ‐0.103 ‐0.059 ‐0.091 ‐0.063 ‐0.071 ‐0.153* (0.112)
(0.107) (0.092) (0.103) (0.103) (0.084)
Net Income/Assets ‐0.339*** ‐0.364*** ‐0.200** ‐0.352*** ‐0.362*** ‐0.175** (0.093)
(0.096) (0.081) (0.093) (0.100) (0.083)
Non‐performing Loans/Loans
42.526*** 35.505*** 19.811* 42.801*** 38.776*** 20.811**
(10.274)
(10.113) (10.579) (11.235) (10.054) (10.195)
Capital Ratio
Tier 1/RWA
Common/
RWA
Market Value of Common/RWA
Tier 1/Assets
Common/Assets
Market Value of Common/Assets
Capital Ratio
‐0.103
‐0.054**
‐0.101***
‐0.026
‐0.047
‐0.161***
(0.075) (0.027) (0.026) (0.066) (0.057) (0.046)
Number of BHCs 66 66 64 66 66 64 Observations 597 597 573 597 597 573
Note: The table reports coefficients from the estimation of a Cox proportional hazards model, where the hazard is defined as the first time a BHC cuts its dividend between Q1 2007 and Q4 2009 (the “financial crisis period”). A dividend cut is defined as a reduction in the ratio of dividends‐to‐assets and in dividends‐per‐share greater than the 5th percentile decline in these ratios during 2003 to 2006; 48 of the 66 BHCs in the sample cut dividends during the financial crisis period. The sample includes all BHCs headquartered in the 50 states with assets exceeding $5 billion as of Q1 2005 that paid common stock dividends as of Q4 2006. BHCs that stop filing regulatory reports before cutting dividends are dropped from the sample. Pre‐crisis repurchases are defined as the sum of treasury stock purchases plus net common stock retirements (retirements minus conversions, if positive) from Q1 2005 to Q4 2006. All other control variables are one‐quarter lagged values. Smaller/Larger BHCs are those with Q4 2006 assets below/above $25 billion. BHC data are from the Federal Reserve Y‐9C regulatory reports for bank holding companies; the market value of common equity is from CRSP. The symbols ***, **, and * indicate statistical significance at the 1%, 5% and 10% levels, respectively.

[28]
Table 6
Impact of Pre‐Crisis Repurchases on The Timing of Dividend Elimination
2007 to 2009
(1) (2) (3) (4) (5) (6)
Pre‐Crisis Repurchases/Assets
Smaller BHCs ‐132.420*** ‐129.087*** ‐51.874 ‐133.389*** ‐134.777*** ‐33.026 (48.450)
(49.608) (47.447) (50.051) (51.595) (30.394)
Larger BHCs 18.472 14.656 1.480 18.893 17.439 5.334 (37.472)
(38.164) (37.661) (37.485) (39.577) (37.023)
P‐Value: Smaller = Larger 0.013 0.021 0.395 0.015 0.018 0.408
Control Variables
Log of Assets ‐0.310 ‐0.307* ‐0.309* ‐0.314* ‐0.331** ‐0.364** (0.201)
(0.177) (0.183) (0.174) (0.169) (0.163)
Net Income/Assets ‐0.166*** ‐0.165*** ‐0.092*** ‐0.165*** ‐0.168*** ‐0.060* (0.033)
(0.033) (0.034) (0.034) (0.032) (0.032)
Non‐performing Loans/Loans
61.445*** 58.771*** 37.480*** 61.835*** 57.548*** 26.775**
(14.329)
(11.869) (12.631) (13.558) (12.329) (13.530)
Capital Ratio
Tier 1/RWA
Common/ RWA
Market Value of Common/RWA
Tier 1/Assets
Common/Assets
Market Value of Common/Assets
Capital Ratio
‐0.002
‐0.040
‐0.156**
‐0.013
‐0.101
‐0.319***
(0.154) (0.057) (0.068) (0.134) (0.095) (0.066)
Number of BHCs 64 64 62 64 64 62 Observations 666 666 642 666 666 642
Note: The table reports coefficients from the estimation of a Cox proportional hazards model, where the hazard is defined as the BHC eliminating its dividend between Q1 2007 and Q4 2009 (the “financial crisis period”). A dividend elimination is defined as dividends‐per‐share falling below $0.011 (to zero or a penny); 30 of the 66 BHCs in the sample eliminated their dividends during the financial crisis period. The sample includes all BHCs headquartered in the 50 states with assets exceeding $5 billion as of Q1 2005 that paid common stock dividends as of Q4 2006. BHCs that stop filing regulatory reports before cutting dividends are dropped from the sample. Pre‐crisis repurchases are defined as the sum of treasury stock purchases plus net common stock retirements (retirements minus conversions, if positive) from Q1 2005 to Q4 2006. All other control variables are one‐quarter lagged values. Smaller/Larger BHCs are those with Q4 2006 assets below/above $25 billion. BHC data are from the Federal Reserve Y‐9C regulatory reports for bank holding companies; the market value of common equity is from CRSP. The symbols ***, **, and * indicate statistical significance at the 1%, 5% and 10% levels, respectively.
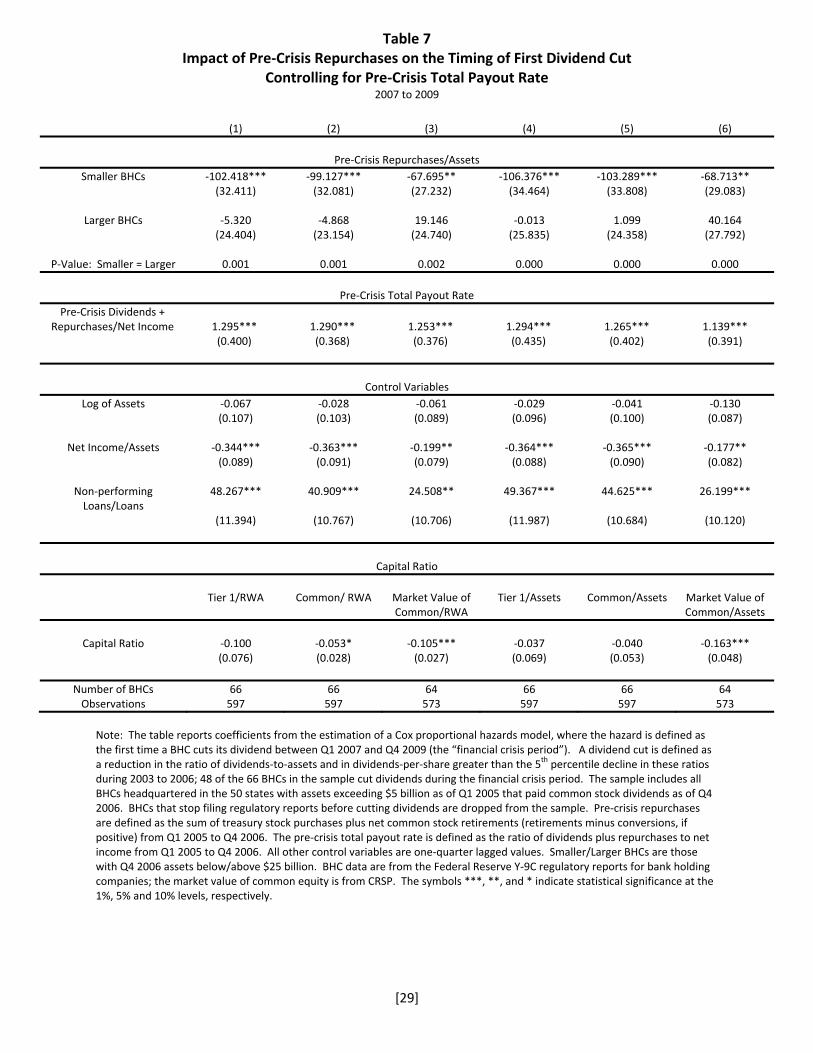
[29]
Table 7 Impact of Pre‐Crisis Repurchases on the Timing of First Dividend Cut
Controlling for Pre‐Crisis Total Payout Rate 2007 to 2009
(1) (2) (3) (4) (5) (6)
Pre‐Crisis Repurchases/Assets
Smaller BHCs ‐102.418*** ‐99.127*** ‐67.695** ‐106.376*** ‐103.289*** ‐68.713** (32.411)
(32.081) (27.232) (34.464) (33.808) (29.083)
Larger BHCs ‐5.320 ‐4.868 19.146 ‐0.013 1.099 40.164 (24.404)
(23.154) (24.740) (25.835) (24.358) (27.792)
P‐Value: Smaller = Larger 0.001 0.001 0.002 0.000 0.000 0.000
Pre‐Crisis Total Payout Rate
Pre‐Crisis Dividends + Repurchases/Net Income
1.295***
1.290***
1.253***
1.294***
1.265***
1.139***
(0.400)
(0.368) (0.376) (0.435) (0.402) (0.391)
Control Variables
Log of Assets ‐0.067 ‐0.028 ‐0.061 ‐0.029 ‐0.041 ‐0.130 (0.107)
(0.103) (0.089) (0.096) (0.100) (0.087)
Net Income/Assets ‐0.344*** ‐0.363*** ‐0.199** ‐0.364*** ‐0.365*** ‐0.177** (0.089)
(0.091) (0.079) (0.088) (0.090) (0.082)
Non‐performing Loans/Loans
48.267*** 40.909*** 24.508** 49.367*** 44.625*** 26.199***
(11.394)
(10.767) (10.706) (11.987) (10.684) (10.120)
Capital Ratio
Tier 1/RWA
Common/ RWA
Market Value of Common/RWA
Tier 1/Assets
Common/Assets
Market Value of Common/Assets
Capital Ratio
‐0.100
‐0.053*
‐0.105***
‐0.037
‐0.040
‐0.163***
(0.076) (0.028) (0.027) (0.069) (0.053) (0.048)
Number of BHCs 66 66 64 66 66 64 Observations 597 597 573 597 597 573
Note: The table reports coefficients from the estimation of a Cox proportional hazards model, where the hazard is defined as the first time a BHC cuts its dividend between Q1 2007 and Q4 2009 (the “financial crisis period”). A dividend cut is defined as a reduction in the ratio of dividends‐to‐assets and in dividends‐per‐share greater than the 5th percentile decline in these ratios during 2003 to 2006; 48 of the 66 BHCs in the sample cut dividends during the financial crisis period. The sample includes all BHCs headquartered in the 50 states with assets exceeding $5 billion as of Q1 2005 that paid common stock dividends as of Q4 2006. BHCs that stop filing regulatory reports before cutting dividends are dropped from the sample. Pre‐crisis repurchases are defined as the sum of treasury stock purchases plus net common stock retirements (retirements minus conversions, if positive) from Q1 2005 to Q4 2006. The pre‐crisis total payout rate is defined as the ratio of dividends plus repurchases to net income from Q1 2005 to Q4 2006. All other control variables are one‐quarter lagged values. Smaller/Larger BHCs are those with Q4 2006 assets below/above $25 billion. BHC data are from the Federal Reserve Y‐9C regulatory reports for bank holding companies; the market value of common equity is from CRSP. The symbols ***, **, and * indicate statistical significance at the 1%, 5% and 10% levels, respectively.
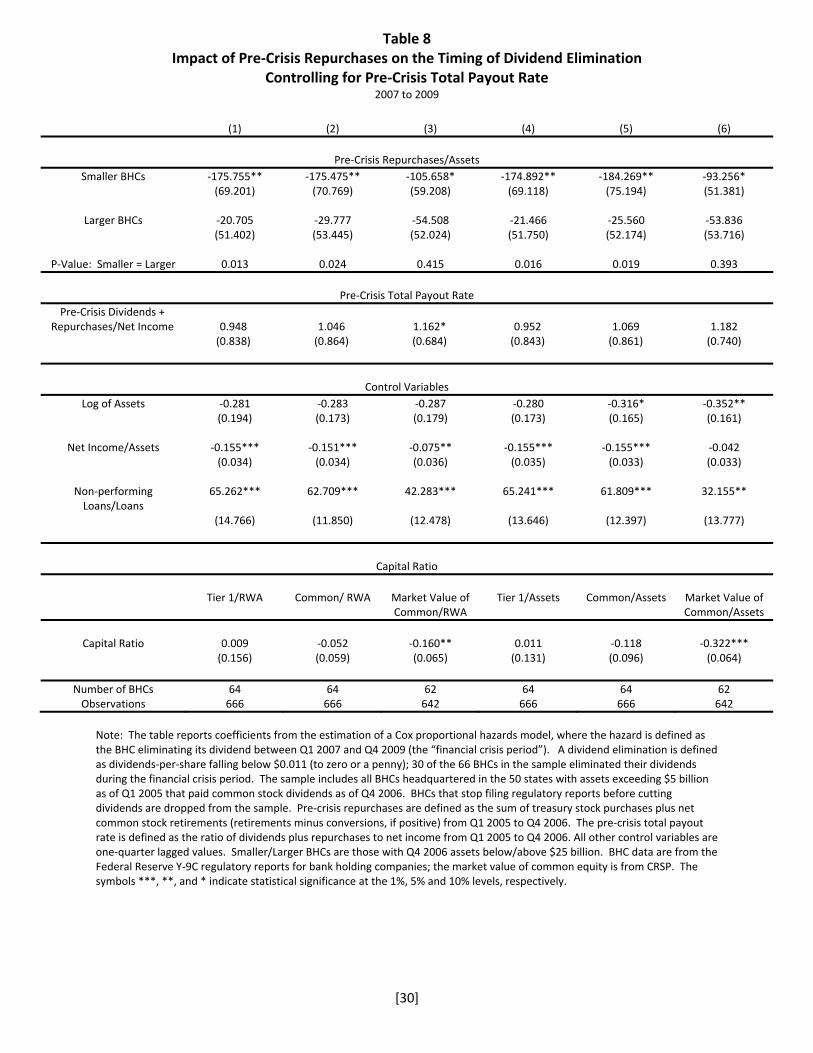
[30]
Table 8 Impact of Pre‐Crisis Repurchases on the Timing of Dividend Elimination
Controlling for Pre‐Crisis Total Payout Rate 2007 to 2009
(1) (2) (3) (4) (5) (6)
Pre‐Crisis Repurchases/Assets
Smaller BHCs ‐175.755** ‐175.475** ‐105.658* ‐174.892** ‐184.269** ‐93.256* (69.201)
(70.769) (59.208) (69.118) (75.194) (51.381)
Larger BHCs ‐20.705 ‐29.777 ‐54.508 ‐21.466 ‐25.560 ‐53.836 (51.402)
(53.445) (52.024) (51.750) (52.174) (53.716)
P‐Value: Smaller = Larger 0.013 0.024 0.415 0.016 0.019 0.393
Pre‐Crisis Total Payout Rate
Pre‐Crisis Dividends + Repurchases/Net Income
0.948
1.046
1.162*
0.952
1.069
1.182
(0.838)
(0.864) (0.684) (0.843) (0.861) (0.740)
Control Variables
Log of Assets ‐0.281 ‐0.283 ‐0.287 ‐0.280 ‐0.316* ‐0.352** (0.194)
(0.173) (0.179) (0.173) (0.165) (0.161)
Net Income/Assets ‐0.155*** ‐0.151*** ‐0.075** ‐0.155*** ‐0.155*** ‐0.042 (0.034)
(0.034) (0.036) (0.035) (0.033) (0.033)
Non‐performing Loans/Loans
65.262*** 62.709*** 42.283*** 65.241*** 61.809*** 32.155**
(14.766)
(11.850) (12.478) (13.646) (12.397) (13.777)
Capital Ratio
Tier 1/RWA
Common/ RWA
Market Value of Common/RWA
Tier 1/Assets
Common/Assets
Market Value of Common/Assets
Capital Ratio
0.009
‐0.052
‐0.160**
0.011
‐0.118
‐0.322***
(0.156) (0.059) (0.065) (0.131) (0.096) (0.064)
Number of BHCs 64 64 62 64 64 62 Observations 666 666 642 666 666 642
Note: The table reports coefficients from the estimation of a Cox proportional hazards model, where the hazard is defined as the BHC eliminating its dividend between Q1 2007 and Q4 2009 (the “financial crisis period”). A dividend elimination is defined as dividends‐per‐share falling below $0.011 (to zero or a penny); 30 of the 66 BHCs in the sample eliminated their dividends during the financial crisis period. The sample includes all BHCs headquartered in the 50 states with assets exceeding $5 billion as of Q1 2005 that paid common stock dividends as of Q4 2006. BHCs that stop filing regulatory reports before cutting dividends are dropped from the sample. Pre‐crisis repurchases are defined as the sum of treasury stock purchases plus net common stock retirements (retirements minus conversions, if positive) from Q1 2005 to Q4 2006. The pre‐crisis total payout rate is defined as the ratio of dividends plus repurchases to net income from Q1 2005 to Q4 2006. All other control variables are one‐quarter lagged values. Smaller/Larger BHCs are those with Q4 2006 assets below/above $25 billion. BHC data are from the Federal Reserve Y‐9C regulatory reports for bank holding companies; the market value of common equity is from CRSP. The symbols ***, **, and * indicate statistical significance at the 1%, 5% and 10% levels, respectively.
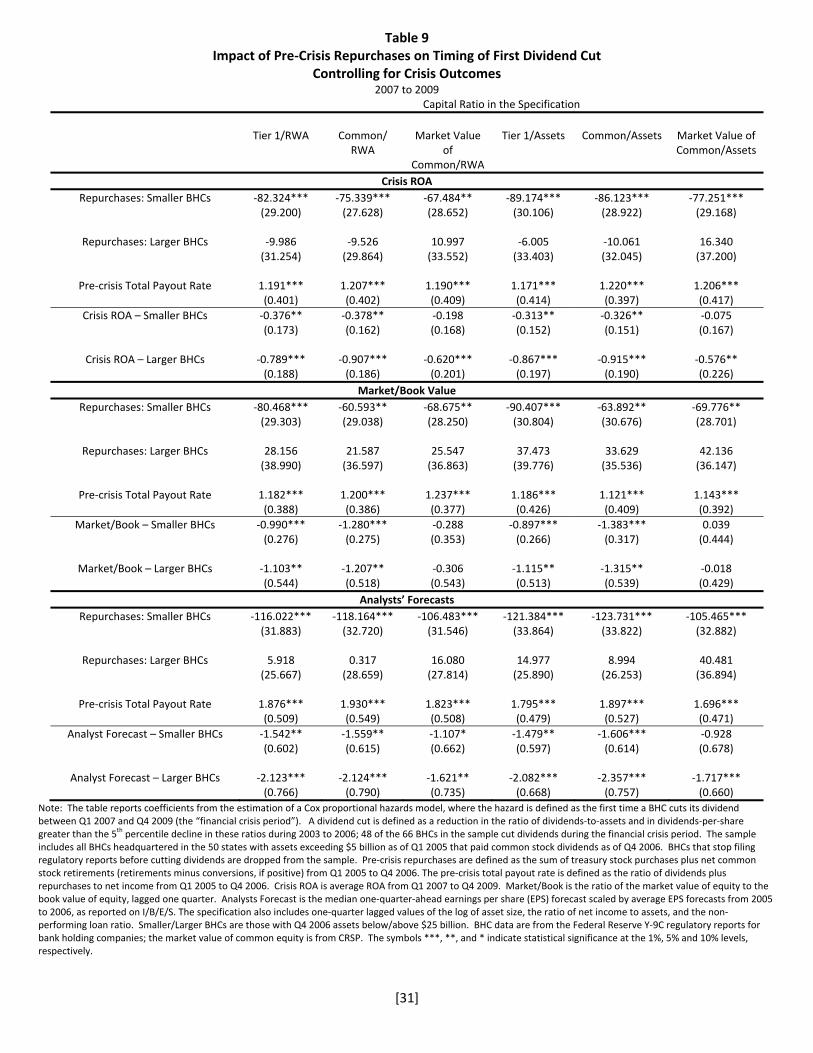
[31]
Table 9 Impact of Pre‐Crisis Repurchases on Timing of First Dividend Cut
Controlling for Crisis Outcomes 2007 to 2009
Capital Ratio in the Specification
Tier 1/RWA
Common/
RWA
Market Value
of Common/RWA
Tier 1/Assets
Common/Assets
Market Value of Common/Assets
Crisis ROA
Repurchases: Smaller BHCs ‐82.324*** ‐75.339*** ‐67.484** ‐89.174*** ‐86.123*** ‐77.251*** (29.200)
(27.628) (28.652) (30.106) (28.922) (29.168)
Repurchases: Larger BHCs ‐9.986 ‐9.526 10.997 ‐6.005 ‐10.061 16.340 (31.254)
(29.864) (33.552) (33.403) (32.045) (37.200)
Pre‐crisis Total Payout Rate 1.191*** 1.207*** 1.190*** 1.171*** 1.220*** 1.206*** (0.401) (0.402) (0.409) (0.414) (0.397) (0.417)
Crisis ROA – Smaller BHCs ‐0.376** ‐0.378** ‐0.198 ‐0.313** ‐0.326** ‐0.075 (0.173)
(0.162) (0.168) (0.152) (0.151) (0.167)
Crisis ROA – Larger BHCs ‐0.789*** ‐0.907*** ‐0.620*** ‐0.867*** ‐0.915*** ‐0.576** (0.188) (0.186) (0.201) (0.197) (0.190) (0.226)
Market/Book Value
Repurchases: Smaller BHCs ‐80.468*** ‐60.593** ‐68.675** ‐90.407*** ‐63.892** ‐69.776** (29.303)
(29.038) (28.250) (30.804) (30.676) (28.701)
Repurchases: Larger BHCs 28.156 21.587 25.547 37.473 33.629 42.136 (38.990)
(36.597) (36.863) (39.776) (35.536) (36.147)
Pre‐crisis Total Payout Rate 1.182*** 1.200*** 1.237*** 1.186*** 1.121*** 1.143*** (0.388) (0.386) (0.377) (0.426) (0.409) (0.392)
Market/Book – Smaller BHCs ‐0.990*** ‐1.280*** ‐0.288 ‐0.897*** ‐1.383*** 0.039 (0.276)
(0.275) (0.353) (0.266) (0.317) (0.444)
Market/Book – Larger BHCs ‐1.103** ‐1.207** ‐0.306 ‐1.115** ‐1.315** ‐0.018 (0.544) (0.518) (0.543) (0.513) (0.539) (0.429)
Analysts’ Forecasts
Repurchases: Smaller BHCs ‐116.022*** ‐118.164*** ‐106.483*** ‐121.384*** ‐123.731*** ‐105.465*** (31.883)
(32.720) (31.546) (33.864) (33.822) (32.882)
Repurchases: Larger BHCs 5.918 0.317 16.080 14.977 8.994 40.481 (25.667)
(28.659) (27.814) (25.890) (26.253) (36.894)
Pre‐crisis Total Payout Rate 1.876*** 1.930*** 1.823*** 1.795*** 1.897*** 1.696*** (0.509) (0.549) (0.508) (0.479) (0.527) (0.471)
Analyst Forecast – Smaller BHCs ‐1.542** ‐1.559** ‐1.107* ‐1.479** ‐1.606*** ‐0.928 (0.602)
(0.615) (0.662) (0.597) (0.614) (0.678)
Analyst Forecast – Larger BHCs ‐2.123*** ‐2.124*** ‐1.621** ‐2.082*** ‐2.357*** ‐1.717*** (0.766) (0.790) (0.735) (0.668) (0.757) (0.660)
Note: The table reports coefficients from the estimation of a Cox proportional hazards model, where the hazard is defined as the first time a BHC cuts its dividend between Q1 2007 and Q4 2009 (the “financial crisis period”). A dividend cut is defined as a reduction in the ratio of dividends‐to‐assets and in dividends‐per‐share greater than the 5
th percentile decline in these ratios during 2003 to 2006; 48 of the 66 BHCs in the sample cut dividends during the financial crisis period. The sample
includes all BHCs headquartered in the 50 states with assets exceeding $5 billion as of Q1 2005 that paid common stock dividends as of Q4 2006. BHCs that stop filing regulatory reports before cutting dividends are dropped from the sample. Pre‐crisis repurchases are defined as the sum of treasury stock purchases plus net common stock retirements (retirements minus conversions, if positive) from Q1 2005 to Q4 2006. The pre‐crisis total payout rate is defined as the ratio of dividends plus repurchases to net income from Q1 2005 to Q4 2006. Crisis ROA is average ROA from Q1 2007 to Q4 2009. Market/Book is the ratio of the market value of equity to the book value of equity, lagged one quarter. Analysts Forecast is the median one‐quarter‐ahead earnings per share (EPS) forecast scaled by average EPS forecasts from 2005 to 2006, as reported on I/B/E/S. The specification also includes one‐quarter lagged values of the log of asset size, the ratio of net income to assets, and the non‐performing loan ratio. Smaller/Larger BHCs are those with Q4 2006 assets below/above $25 billion. BHC data are from the Federal Reserve Y‐9C regulatory reports for bank holding companies; the market value of common equity is from CRSP. The symbols ***, **, and * indicate statistical significance at the 1%, 5% and 10% levels, respectively.
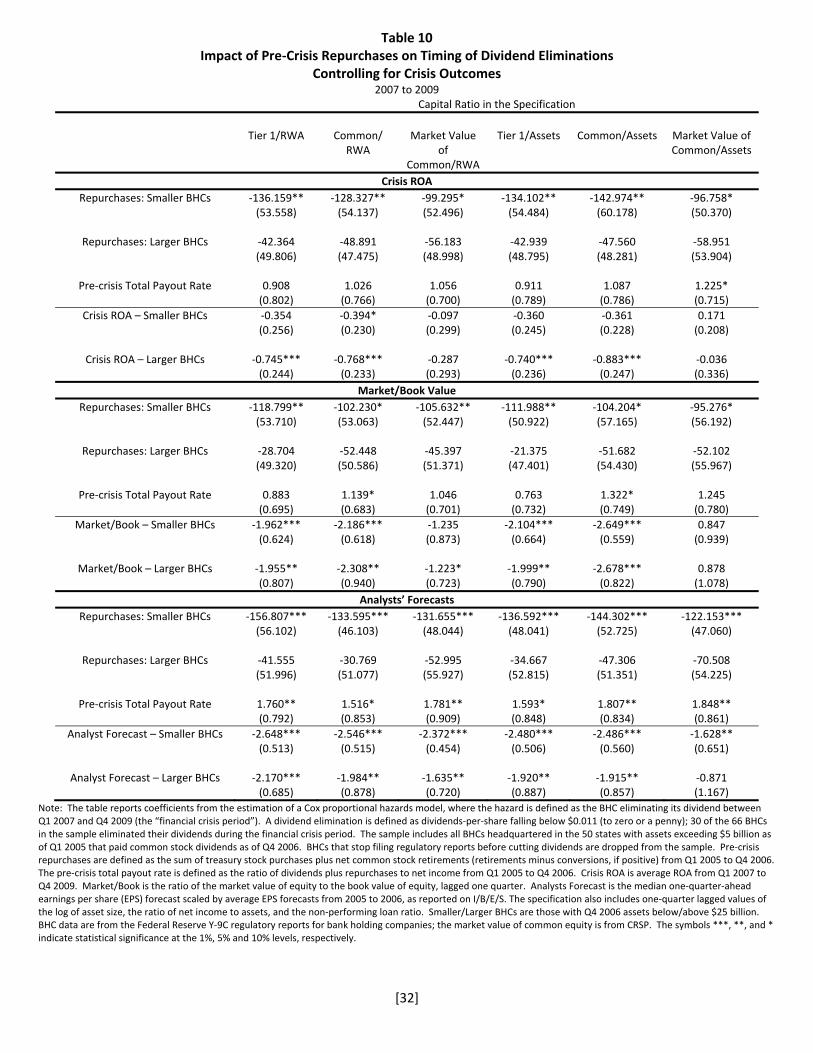
[32]
Table 10 Impact of Pre‐Crisis Repurchases on Timing of Dividend Eliminations
Controlling for Crisis Outcomes 2007 to 2009
Capital Ratio in the Specification
Tier 1/RWA
Common/
RWA
Market Value
of Common/RWA
Tier 1/Assets
Common/Assets
Market Value of Common/Assets
Crisis ROA
Repurchases: Smaller BHCs ‐136.159** ‐128.327** ‐99.295* ‐134.102** ‐142.974** ‐96.758* (53.558)
(54.137) (52.496) (54.484) (60.178) (50.370)
Repurchases: Larger BHCs ‐42.364 ‐48.891 ‐56.183 ‐42.939 ‐47.560 ‐58.951 (49.806)
(47.475) (48.998) (48.795) (48.281) (53.904)
Pre‐crisis Total Payout Rate 0.908 1.026 1.056 0.911 1.087 1.225* (0.802) (0.766) (0.700) (0.789) (0.786) (0.715)
Crisis ROA – Smaller BHCs ‐0.354 ‐0.394* ‐0.097 ‐0.360 ‐0.361 0.171 (0.256)
(0.230) (0.299) (0.245) (0.228) (0.208)
Crisis ROA – Larger BHCs ‐0.745*** ‐0.768*** ‐0.287 ‐0.740*** ‐0.883*** ‐0.036 (0.244) (0.233) (0.293) (0.236) (0.247) (0.336)
Market/Book Value
Repurchases: Smaller BHCs ‐118.799** ‐102.230* ‐105.632** ‐111.988** ‐104.204* ‐95.276* (53.710)
(53.063) (52.447) (50.922) (57.165) (56.192)
Repurchases: Larger BHCs ‐28.704 ‐52.448 ‐45.397 ‐21.375 ‐51.682 ‐52.102 (49.320)
(50.586) (51.371) (47.401) (54.430) (55.967)
Pre‐crisis Total Payout Rate 0.883 1.139* 1.046 0.763 1.322* 1.245 (0.695) (0.683) (0.701) (0.732) (0.749) (0.780)
Market/Book – Smaller BHCs ‐1.962*** ‐2.186*** ‐1.235 ‐2.104*** ‐2.649*** 0.847 (0.624)
(0.618) (0.873) (0.664) (0.559) (0.939)
Market/Book – Larger BHCs ‐1.955** ‐2.308** ‐1.223* ‐1.999** ‐2.678*** 0.878 (0.807) (0.940) (0.723) (0.790) (0.822) (1.078)
Analysts’ Forecasts
Repurchases: Smaller BHCs ‐156.807*** ‐133.595*** ‐131.655*** ‐136.592*** ‐144.302*** ‐122.153*** (56.102)
(46.103) (48.044) (48.041) (52.725) (47.060)
Repurchases: Larger BHCs ‐41.555 ‐30.769 ‐52.995 ‐34.667 ‐47.306 ‐70.508 (51.996)
(51.077) (55.927) (52.815) (51.351) (54.225)
Pre‐crisis Total Payout Rate 1.760** 1.516* 1.781** 1.593* 1.807** 1.848** (0.792) (0.853) (0.909) (0.848) (0.834) (0.861)
Analyst Forecast – Smaller BHCs ‐2.648*** ‐2.546*** ‐2.372*** ‐2.480*** ‐2.486*** ‐1.628** (0.513)
(0.515) (0.454) (0.506) (0.560) (0.651)
Analyst Forecast – Larger BHCs ‐2.170*** ‐1.984** ‐1.635** ‐1.920** ‐1.915** ‐0.871 (0.685) (0.878) (0.720) (0.887) (0.857) (1.167)
Note: The table reports coefficients from the estimation of a Cox proportional hazards model, where the hazard is defined as the BHC eliminating its dividend between Q1 2007 and Q4 2009 (the “financial crisis period”). A dividend elimination is defined as dividends‐per‐share falling below $0.011 (to zero or a penny); 30 of the 66 BHCs in the sample eliminated their dividends during the financial crisis period. The sample includes all BHCs headquartered in the 50 states with assets exceeding $5 billion as of Q1 2005 that paid common stock dividends as of Q4 2006. BHCs that stop filing regulatory reports before cutting dividends are dropped from the sample. Pre‐crisis repurchases are defined as the sum of treasury stock purchases plus net common stock retirements (retirements minus conversions, if positive) from Q1 2005 to Q4 2006. The pre‐crisis total payout rate is defined as the ratio of dividends plus repurchases to net income from Q1 2005 to Q4 2006. Crisis ROA is average ROA from Q1 2007 to Q4 2009. Market/Book is the ratio of the market value of equity to the book value of equity, lagged one quarter. Analysts Forecast is the median one‐quarter‐ahead earnings per share (EPS) forecast scaled by average EPS forecasts from 2005 to 2006, as reported on I/B/E/S. The specification also includes one‐quarter lagged values of the log of asset size, the ratio of net income to assets, and the non‐performing loan ratio. Smaller/Larger BHCs are those with Q4 2006 assets below/above $25 billion. BHC data are from the Federal Reserve Y‐9C regulatory reports for bank holding companies; the market value of common equity is from CRSP. The symbols ***, **, and * indicate statistical significance at the 1%, 5% and 10% levels, respectively.

[33]
Table 11 Impact of Pre‐Crisis Repurchases on
The Timing of First Dividend Cut and Dividend Elimination Controlling for Analyst Coverage
By BHC Asset Size, 2007 to 2009
Capital Ratio in the Specification
Tier 1/RWA
Common/ RWA
Market Value of Common/RWA
Tier 1/Assets
Common/Assets
Market Value of Common/Assets
First Dividend Cut:Pre‐Crisis Repurchases and Dividends as Share of Assets
Repurchases: Smaller BHCs ‐139.945*** ‐137.328*** ‐97.723*** ‐148.873*** ‐140.769*** ‐96.429*** (32.020)
(33.285) (34.808) (36.097) (33.455) (34.955)
Repurchases: Larger BHCs ‐24.909 ‐28.849 4.189 ‐25.585 ‐27.452 20.414 (34.878)
(33.677) (36.231) (31.107) (32.111) (39.278)
Pre‐crisis Total Payout Rate 2.094*** 2.090*** 1.689*** 2.177*** 2.085*** 1.587*** (0.540)
(0.522) (0.552) (0.581) (0.518) (0.533)
Analyst Coverage – Smaller BHCs 0.195*** 0.191*** 0.114* 0.204*** 0.198*** 0.118** (0.046)
(0.047) (0.059) (0.049) (0.045) (0.057)
Analyst Coverage – Larger BHCs 0.085* 0.086** 0.042 0.085** 0.092** 0.049 (0.044) (0.043) (0.047) (0.040) (0.042) (0.046)
Number of BHCs
63
63
63
63
63
63
Dividend Elimination:Pre‐Crisis Repurchases and Dividends as Share of Assets
Repurchases: Smaller BHCs ‐239.885*** ‐241.556*** ‐146.083* ‐234.869*** ‐257.888*** ‐117.140 (85.684)
(92.184) (85.447) (87.055) (98.640) (76.530)
Repurchases: Larger BHCs ‐28.078 ‐37.842 ‐41.786 ‐28.502 ‐39.312 ‐38.876 (55.398)
(58.933) (52.114) (54.592) (55.692) (53.542)
Pre‐crisis Total Payout Rate 1.807* 1.939 1.419 1.772 2.181* 1.214 (1.093)
(1.203) (1.080) (1.090) (1.218) (1.163)
Analyst Coverage – Smaller BHCs 0.174** 0.168** 0.056 0.165** 0.191** 0.027 (0.077)
(0.084) (0.082) (0.084) (0.088) (0.091)
Analyst Coverage – Larger BHCs 0.035 0.026 ‐0.032 0.027 0.045 ‐0.029 (0.041) (0.041) (0.037) (0.048) (0.041) (0.040)
Number of BHCs
61
61
61
61
61
61
Note: The table reports coefficients from the estimation of a Cox proportional hazards model, where the hazard in the top panel is defined as the first time a BHC cuts its dividend between Q1 2007 and Q4 2009 (the “financial crisis period”) and the hazard in the bottom panel hazard is the BHC eliminating its dividend during this period. A dividend cut is defined as a reduction in the ratio of dividends‐to‐assets and in dividends‐per‐share greater than the 5th percentile decline in these ratios during 2003 to 2006; 48 of the 66 BHCs in the sample cut dividends during the financial crisis period. A dividend elimination is defined as dividends‐per‐share falling below $0.011 (to zero or a penny); 30 of the 66 BHCs in the sample eliminated their dividends during the financial crisis period. The sample includes all BHCs headquartered in the 50 states with assets exceeding $5 billion as of Q1 2005 that paid common stock dividends as of Q4 2006. BHCs that stop filing regulatory reports before cutting dividends are dropped from the sample. Pre‐crisis repurchases are defined as the sum of treasury stock purchases plus net common stock retirements (retirements minus conversions, if positive) from Q1 2005 to Q4 2006. The pre‐crisis total payout rate is defined as the ratio of dividends plus repurchases to net income from Q1 2005 to Q4 2006. Analyst Coverage is the number of unique analysts reporting one‐quarter ahead earnings per share (EPS) forecasts during the previous quarter, as reported on I/B/E/S. The specification also includes one‐quarter lagged values of the log of asset size, the ratio of net income to assets, and the non‐performing loan ratio. Smaller/Larger BHCs are those with Q4 2006 assets below/above $25 billion. BHC data are from the Federal Reserve Y‐9C regulatory reports for bank holding companies; the market value of common equity is from CRSP. The symbols ***, **, and * indicate statistical significance at the 1%, 5% and 10% levels, respectively.
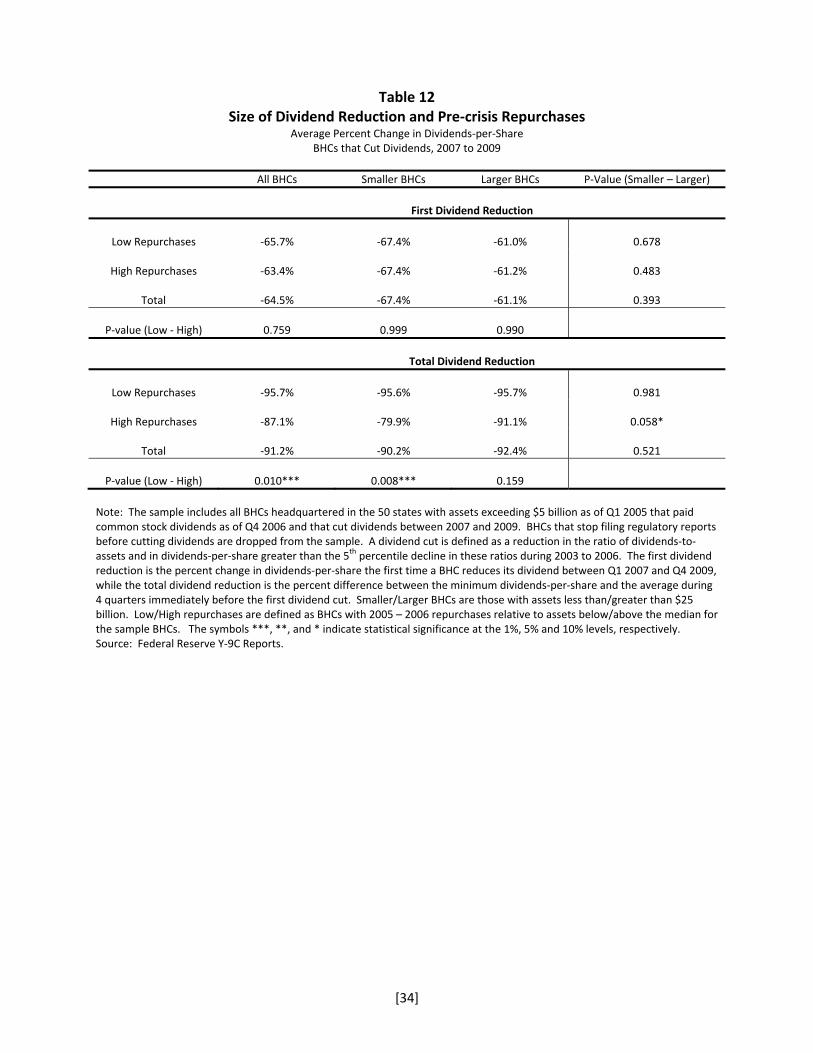
[34]
Table 12 Size of Dividend Reduction and Pre‐crisis Repurchases
Average Percent Change in Dividends‐per‐Share BHCs that Cut Dividends, 2007 to 2009
All BHCs Smaller BHCs Larger BHCs P‐Value (Smaller – Larger)
First Dividend Reduction
Low Repurchases
‐65.7%
‐67.4%
‐61.0%
0.678
High Repurchases
‐63.4%
‐67.4%
‐61.2%
0.483
Total
‐64.5%
‐67.4%
‐61.1%
0.393
P‐value (Low ‐ High)
0.759
0.999
0.990
Total Dividend Reduction
Low Repurchases
‐95.7%
‐95.6%
‐95.7%
0.981
High Repurchases
‐87.1%
‐79.9%
‐91.1%
0.058*
Total
‐91.2%
‐90.2%
‐92.4%
0.521
P‐value (Low ‐ High)
0.010***
0.008***
0.159
Note: The sample includes all BHCs headquartered in the 50 states with assets exceeding $5 billion as of Q1 2005 that paid common stock dividends as of Q4 2006 and that cut dividends between 2007 and 2009. BHCs that stop filing regulatory reports before cutting dividends are dropped from the sample. A dividend cut is defined as a reduction in the ratio of dividends‐to‐assets and in dividends‐per‐share greater than the 5
th percentile decline in these ratios during 2003 to 2006. The first dividend reduction is the percent change in dividends‐per‐share the first time a BHC reduces its dividend between Q1 2007 and Q4 2009, while the total dividend reduction is the percent difference between the minimum dividends‐per‐share and the average during 4 quarters immediately before the first dividend cut. Smaller/Larger BHCs are those with assets less than/greater than $25 billion. Low/High repurchases are defined as BHCs with 2005 – 2006 repurchases relative to assets below/above the median for the sample BHCs. The symbols ***, **, and * indicate statistical significance at the 1%, 5% and 10% levels, respectively. Source: Federal Reserve Y‐9C Reports.
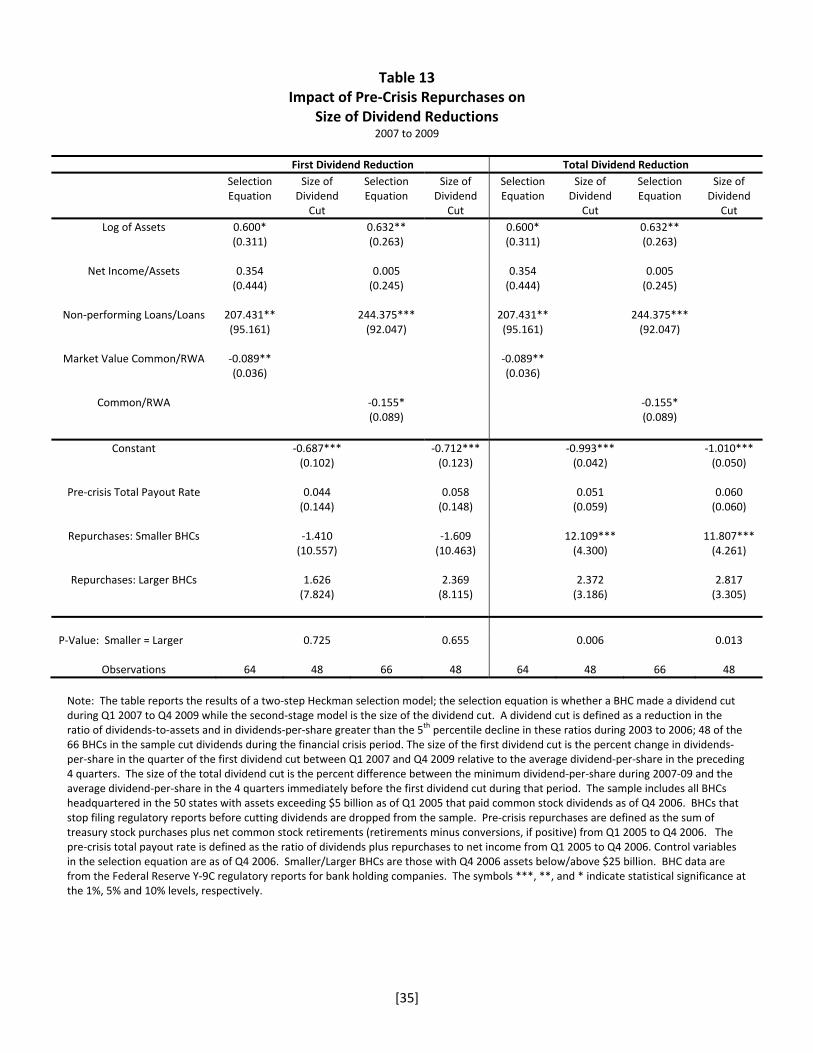
[35]
Table 13 Impact of Pre‐Crisis Repurchases on
Size of Dividend Reductions 2007 to 2009
First Dividend Reduction Total Dividend Reduction
Selection Equation
Size of Dividend
Cut
Selection Equation
Size of Dividend
Cut
Selection Equation
Size of Dividend
Cut
Selection Equation
Size of Dividend
Cut
Log of Assets 0.600* 0.632** 0.600* 0.632** (0.311)
(0.263)
(0.311)
(0.263)
Net Income/Assets 0.354 0.005 0.354 0.005 (0.444)
(0.245)
(0.444)
(0.245)
Non‐performing Loans/Loans 207.431** 244.375*** 207.431** 244.375*** (95.161)
(92.047)
(95.161)
(92.047)
Market Value Common/RWA ‐0.089** ‐0.089** (0.036)
(0.036)
Common/RWA ‐0.155* ‐0.155* (0.089)
(0.089)
Constant ‐0.687*** ‐0.712*** ‐0.993*** ‐1.010*** (0.102)
(0.123) (0.042) (0.050)
Pre‐crisis Total Payout Rate 0.044 0.058 0.051 0.060 (0.144)
(0.148) (0.059) (0.060)
Repurchases: Smaller BHCs ‐1.410 ‐1.609 12.109*** 11.807*** (10.557)
(10.463)
(4.300)
(4.261)
Repurchases: Larger BHCs 1.626 2.369 2.372 2.817
(7.824)
(8.115) (3.186)
(3.305)
P‐Value: Smaller = Larger 0.725
0.655 0.006 0.013
Observations 64 48 66 48 64 48 66 48
Note: The table reports the results of a two‐step Heckman selection model; the selection equation is whether a BHC made a dividend cut during Q1 2007 to Q4 2009 while the second‐stage model is the size of the dividend cut. A dividend cut is defined as a reduction in the ratio of dividends‐to‐assets and in dividends‐per‐share greater than the 5th percentile decline in these ratios during 2003 to 2006; 48 of the 66 BHCs in the sample cut dividends during the financial crisis period. The size of the first dividend cut is the percent change in dividends‐per‐share in the quarter of the first dividend cut between Q1 2007 and Q4 2009 relative to the average dividend‐per‐share in the preceding 4 quarters. The size of the total dividend cut is the percent difference between the minimum dividend‐per‐share during 2007‐09 and the average dividend‐per‐share in the 4 quarters immediately before the first dividend cut during that period. The sample includes all BHCs headquartered in the 50 states with assets exceeding $5 billion as of Q1 2005 that paid common stock dividends as of Q4 2006. BHCs that stop filing regulatory reports before cutting dividends are dropped from the sample. Pre‐crisis repurchases are defined as the sum of treasury stock purchases plus net common stock retirements (retirements minus conversions, if positive) from Q1 2005 to Q4 2006. The pre‐crisis total payout rate is defined as the ratio of dividends plus repurchases to net income from Q1 2005 to Q4 2006. Control variables in the selection equation are as of Q4 2006. Smaller/Larger BHCs are those with Q4 2006 assets below/above $25 billion. BHC data are from the Federal Reserve Y‐9C regulatory reports for bank holding companies. The symbols ***, **, and * indicate statistical significance at the 1%, 5% and 10% levels, respectively.
Top Related