

Languages
Pages
Legal

AVATARAcademic Vertical Alignment Training
and Renewal
AVATAR Team Members Sandra Rippstein, Secondary Teacher, Calallen
ISD Faye Wilson, Secondary Teacher, Calallen ISD Dr. Melana Silva, P-12 Math/Science Curriculum
Specialist, Calallen ISD Paul Johnson, Math Instructor, Del Mar College Dr. Faye Bruun, Department of Curriculum &
Instruction, Texas A&M-Corpus Christi Toni Norrell, Math Curriculum Consultant, ESC2 Melissa Morin, Research Planning, and
Initiatives Consultant, ESC2 Dr. Janet Cunningham, Executive Director,
P-16 Council

Expand awareness of and create regional vertical alignment initiatives to prepare and support students who are college and career ready.
Identify and implement strategies to close regional curriculum gaps.
Identify processes to assess and celebrate regional progress in preparing college and career readied students.
Share best practices.
AVATAR PROJECT GOALS
Explore system differences.
Develop greater awareness and understanding of current and new state standards in mathematics.
Review assessments, including those that are being used for placement, to determine ways to better prepare students.
Develop greater understanding of the College and Career Readiness Standards.
Team Project Goals:

Total Students: 3,836Ethic Distribution
*African American – 57 *Am Indian - 20*Hispanic – 2,073 *Asian - 25*White – 1,620 *Pacific Islander - 7
*Two or More Races - 34Students by Grade
*Grade 9 – 335*Grade 11 - 304
*Grade 10 – 277 *Grade 12 – 282
Economically Disadvantaged: 1,728Limited English Proficient (LEP): 83At-Risk: 1,301
Calallen ISD School Data – 2010-11
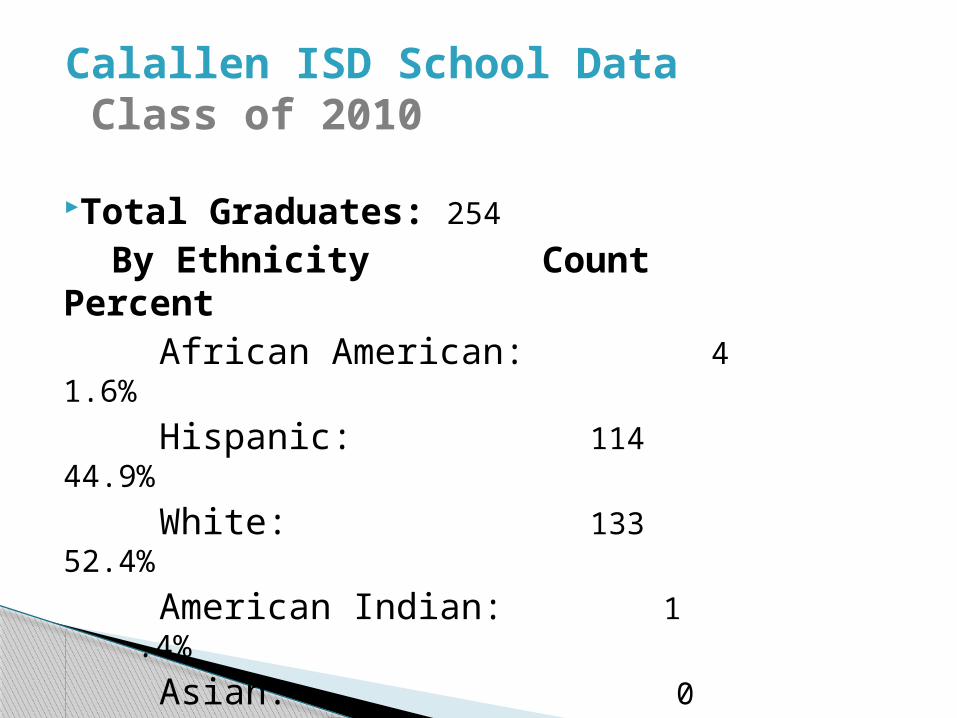
Total Graduates: 254
By Ethnicity CountPercent
African American: 4 1.6%
Hispanic: 11444.9%
White: 133 52.4%
American Indian: 1 .4%
Asian: 0 0%
Pacific Islander: 00%
Two or More Races: 2 .8%
Calallen ISD School Data Class of 2010
St. ESC CHS
AA His Whi SpE EcD AtR
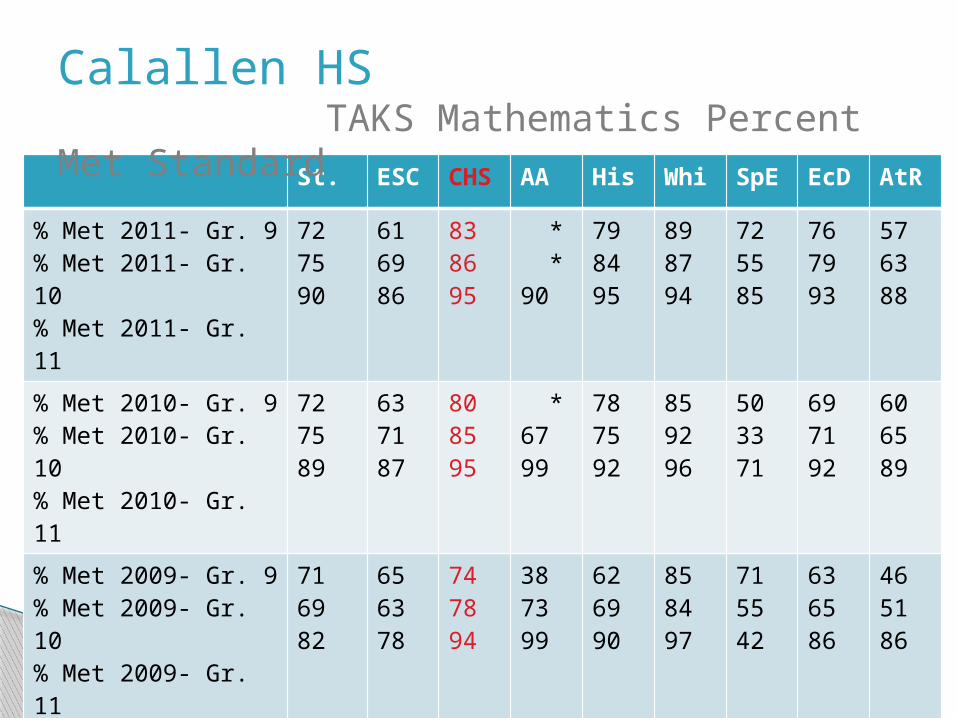
% Met 2011- Gr. 9% Met 2011- Gr. 10% Met 2011- Gr. 11
727590
616986
838695
* *90
798495
898794
725585
767993
576388
% Met 2010- Gr. 9% Met 2010- Gr. 10% Met 2010- Gr. 11
727589
637187
808595
*6799
787592
859296
503371
697192
606589
% Met 2009- Gr. 9% Met 2009- Gr. 10% Met 2009- Gr. 11
716982
656378
747894
387399
626990
858497
715542
636586
465186
Calallen HS TAKS Mathematics Percent Met Standard
St. ESC CHS
AA His Whi SpE EcD AtR
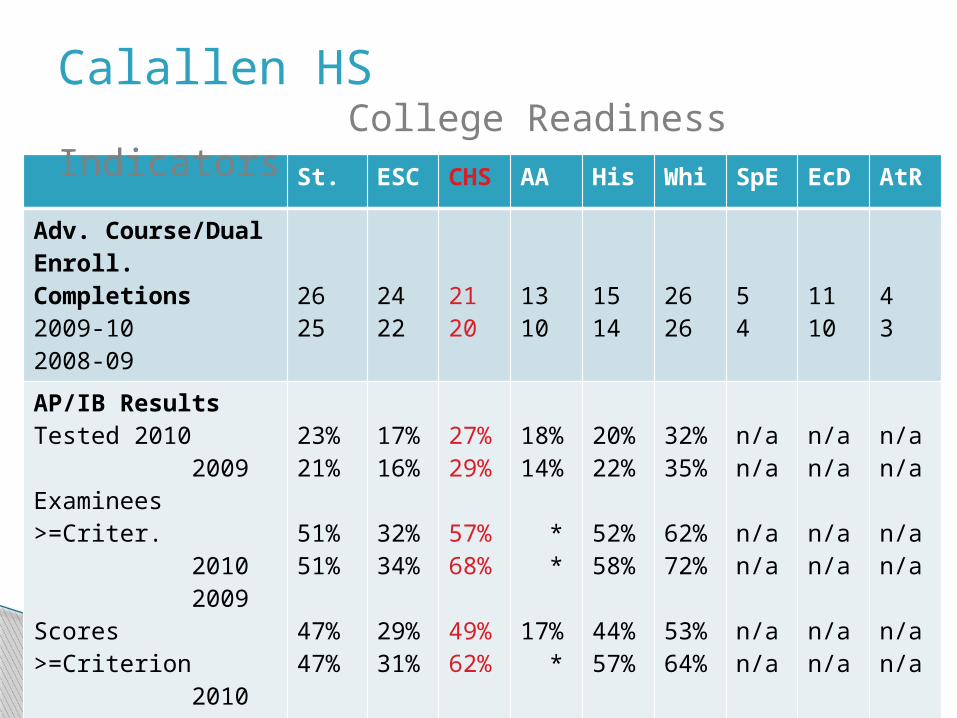
Adv. Course/Dual Enroll. Completions2009-102008-09
2625
2422
2120
1310
1514
2626
54
1110
43
AP/IB ResultsTested 2010 2009Examinees >=Criter. 2010 2009Scores >=Criterion 2010 2009
23%21%
51%51%
47%47%
17%16%
32%34%
29%31%
27%29%
57%68%
49%62%
18%14%
* *
17% *
20%22%
52%58%
44%57%
32%35%
62%72%
53%64%
n/an/a
n/an/a
n/an/a
n/an/a
n/an/a
n/an/a
n/an/a
n/an/a
n/an/a
Calallen HS College Readiness Indicators
St. ESC CHS
AA His Whi SpE EcD AtR
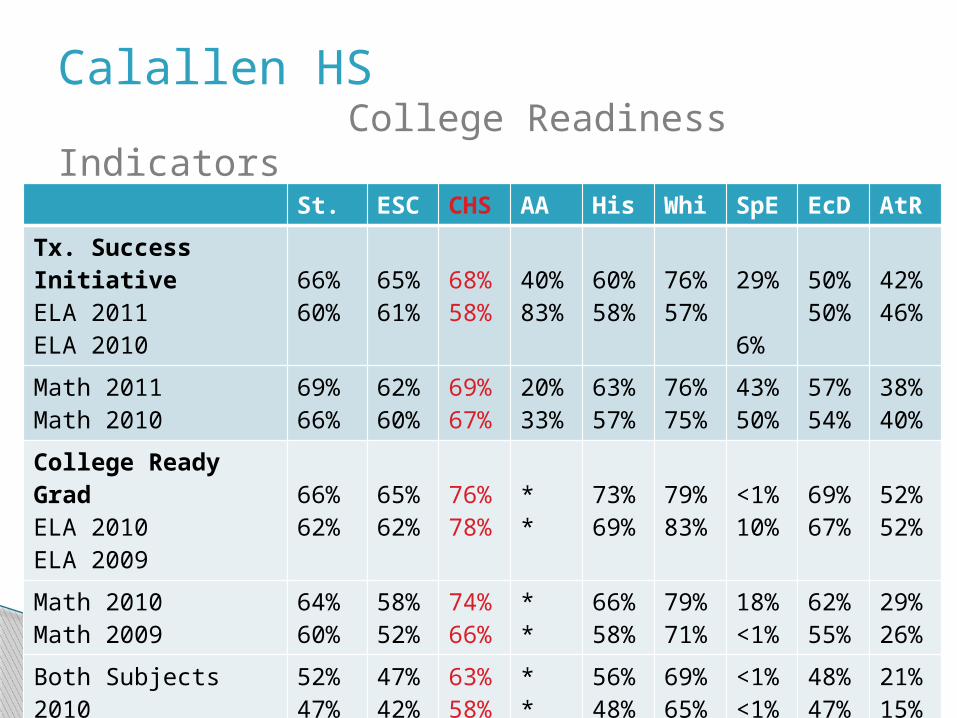
Tx. Success InitiativeELA 2011ELA 2010
66%60%
65%61%
68%58%
40%83%
60%58%
76%57%
29% 6%
50%50%
42%46%
Math 2011Math 2010
69%66%
62%60%
69%67%
20%33%
63%57%
76%75%
43%50%
57%54%
38%40%
College Ready GradELA 2010ELA 2009
66%62%
65%62%
76%78%
**
73%69%
79%83%
<1%10%
69%67%
52%52%
Math 2010Math 2009
64%60%
58%52%
74%66%
**
66%58%
79%71%
18% <1%
62%55%
29%26%
Both Subjects 2010Both Subjects 2009
52%47%
47%42%
63%58%
**
56%48%
69%65%
<1%<1%
48%47%
21%15%
Calallen HS College Readiness Indicators

Del Mar College 56 Texas A&M-CC 18 Texas A&M-Kingsville 17 UT-San Antonio 13 Texas A&M 9 Texas State U. 8 Blinn 6 Texas Tech 5 UT Austin 5 Other Public 4-year 20 Other Public 2-year 7 Not trackable 2 Not found 116 Total H.S. graduates 282
Calallen HS – 2011 Graduates Enrollment by Institution – Fall 2011
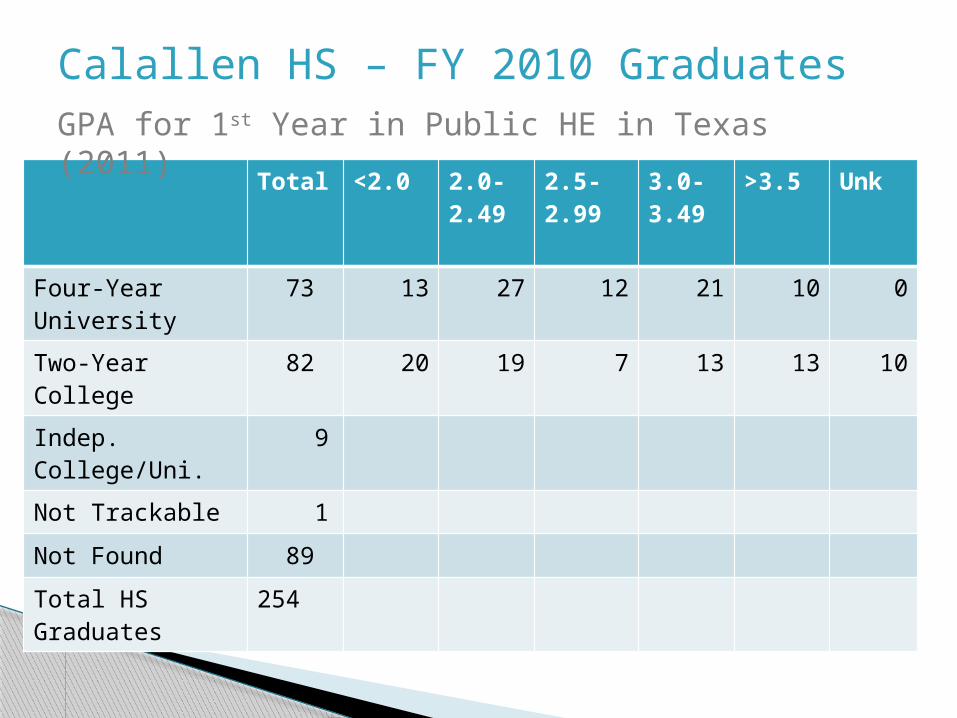
Total <2.0 2.0-2.49
2.5-2.99
3.0-3.49
>3.5 Unk
Four-Year University
73 13 27 12 21 10 0
Two-Year College 82 20 19 7 13 13 10
Indep. College/Uni.
9
Not Trackable 1
Not Found 89
Total HS Graduates
254
Calallen HS – FY 2010 GraduatesGPA for 1st Year in Public HE in Texas (2011)
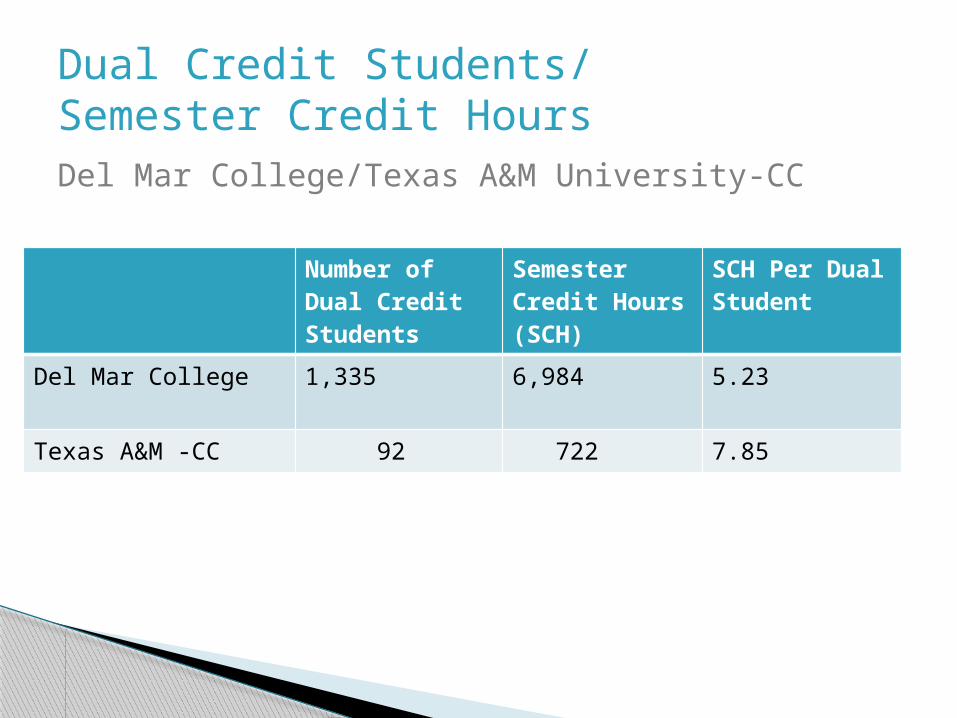
Number of Dual Credit Students
Semester Credit Hours(SCH)
SCH Per Dual Student
Del Mar College 1,335 6,984 5.23
Texas A&M -CC 92 722 7.85
Dual Credit Students/ Semester Credit HoursDel Mar College/Texas A&M University-CC
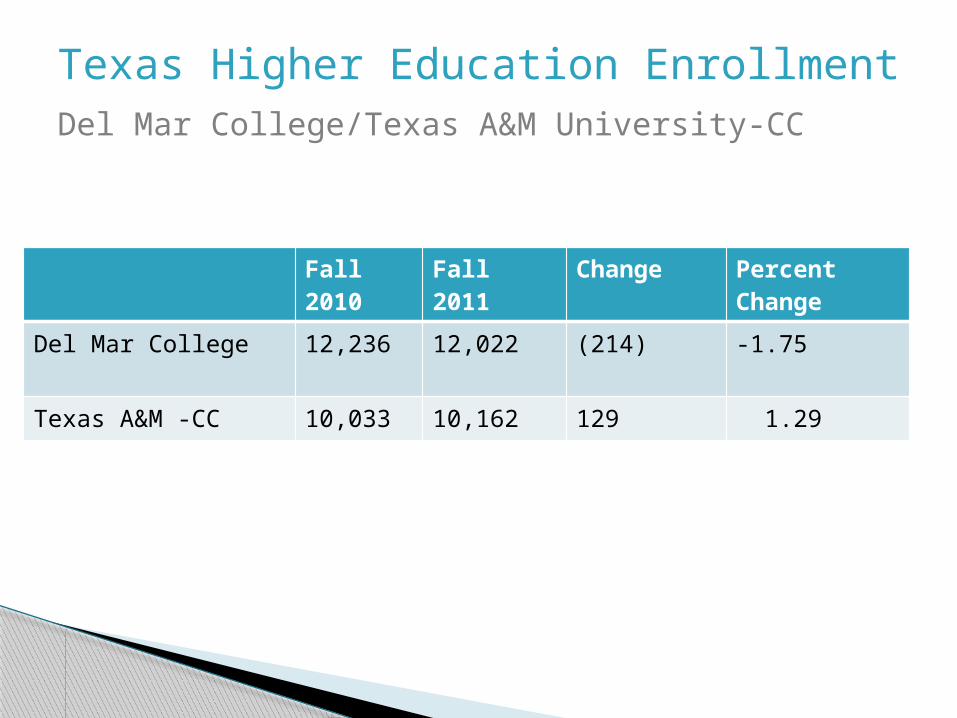
Fall 2010
Fall 2011 Change Percent Change
Del Mar College 12,236 12,022 (214) -1.75
Texas A&M -CC 10,033 10,162 129 1.29
Texas Higher Education EnrollmentDel Mar College/Texas A&M University-CC
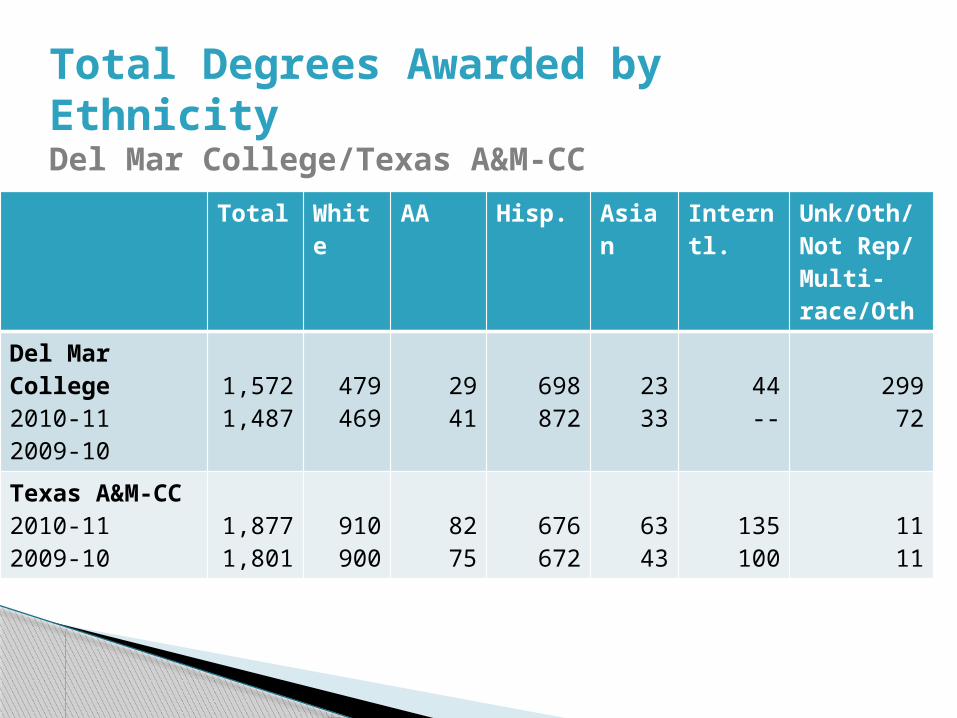
Total White
AA Hisp. Asian
Interntl.
Unk/Oth/Not Rep/Multi-race/Oth
Del Mar College2010-112009-10
1,5721,487
479469
2941
698872
2333
44 --
299 72
Texas A&M-CC2010-112009-10
1,8771,801
910900
8275
676672
6343
135100
11 11
Total Degrees Awarded by EthnicityDel Mar College/Texas A&M-CC

TotalCounts(a)
Pre-Matr.Credit(b)
College Course Completion(c)
Total Course Completions(b+c)/(a)
Number FTIC 1,548
Met All Areas 349
DNM in 1,2,or 3 1,176
Met in MathMet in ReadingMet in Writing
442700727
53120
70272278
17%43.3%
41%
DNM in MathDNM in ReadingDNM in Writing
1083825798
n/an/an/a
65192211
6%23.3%26.4%
Del Mar College – Fall 2010 (tracked 1 yr)
Prepared/underprepared students who complete a college-level course (R, W, M)
TotalCounts(a)
Pre-Matr.Credit(b)
College Course Completion(c)
Total Course Completions(b+c)/(a)
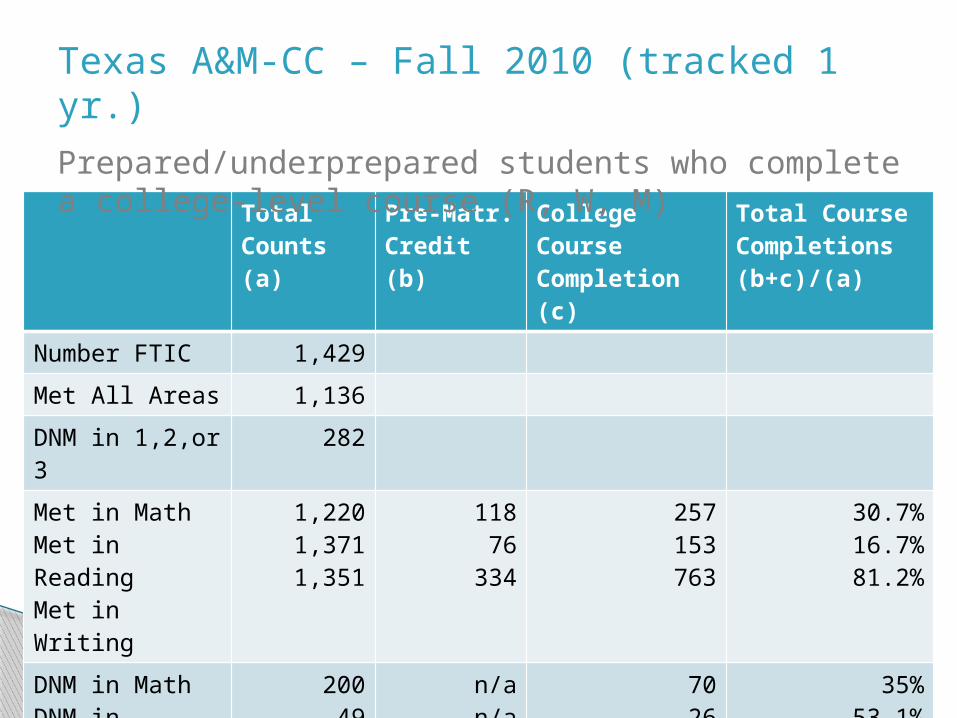
Number FTIC 1,429
Met All Areas 1,136
DNM in 1,2,or 3 282
Met in MathMet in ReadingMet in Writing
1,2201,3711,351
11876
334
257153763
30.7%16.7%81.2%
DNM in MathDNM in ReadingDNM in Writing
2004967
n/an/an/a
702647
35%53.1%70.1%
Texas A&M-CC – Fall 2010 (tracked 1 yr.)
Prepared/underprepared students who complete a college-level course (R, W, M)
TotalCounts
Number returning Fall 2010
PercentReturningFall 2010
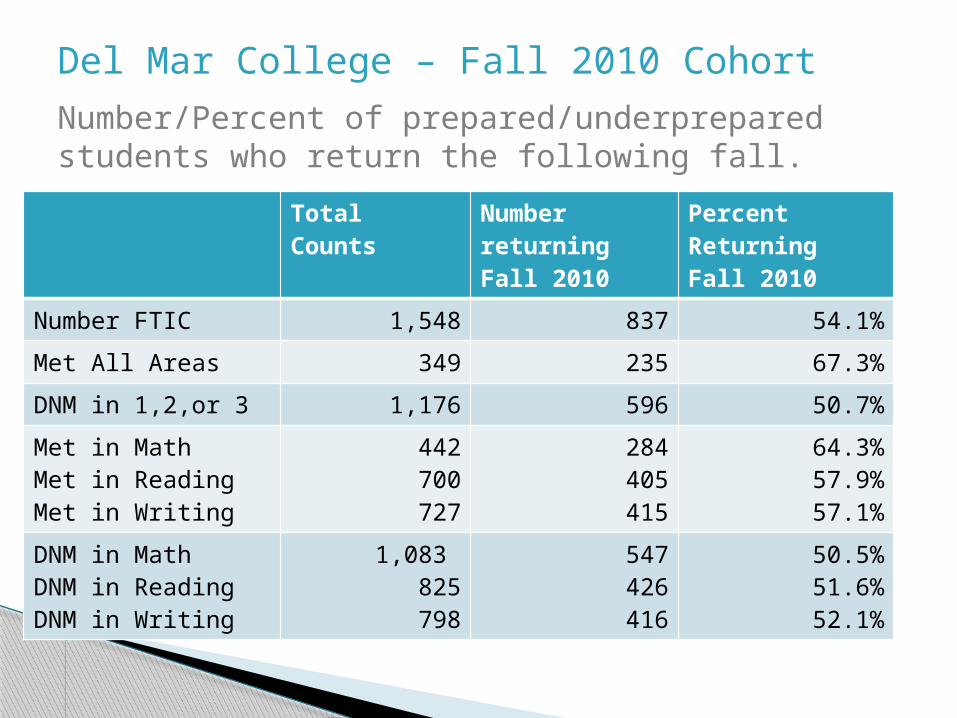
Number FTIC 1,548 837 54.1%
Met All Areas 349 235 67.3%
DNM in 1,2,or 3 1,176 596 50.7%
Met in MathMet in ReadingMet in Writing
442700727
284405415
64.3%57.9%57.1%
DNM in MathDNM in ReadingDNM in Writing
1,083 825798
547426416
50.5%51.6%52.1%
Del Mar College – Fall 2010 Cohort
Number/Percent of prepared/underprepared students who return the following fall.
TotalCounts
Number returning Fall 2010
PercentReturningFall 2010
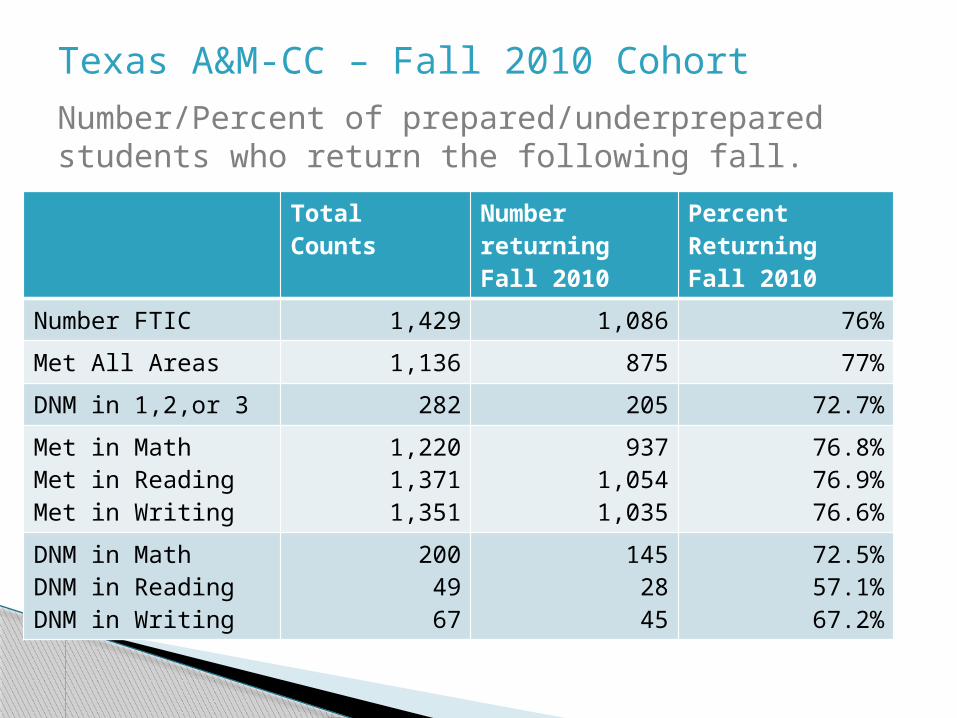
Number FTIC 1,429 1,086 76%
Met All Areas 1,136 875 77%
DNM in 1,2,or 3 282 205 72.7%
Met in MathMet in ReadingMet in Writing
1,2201,3711,351
9371,0541,035
76.8%76.9%76.6%
DNM in MathDNM in ReadingDNM in Writing
2004967
1452845
72.5%57.1%67.2%
Texas A&M-CC – Fall 2010 Cohort
Number/Percent of prepared/underprepared students who return the following fall.
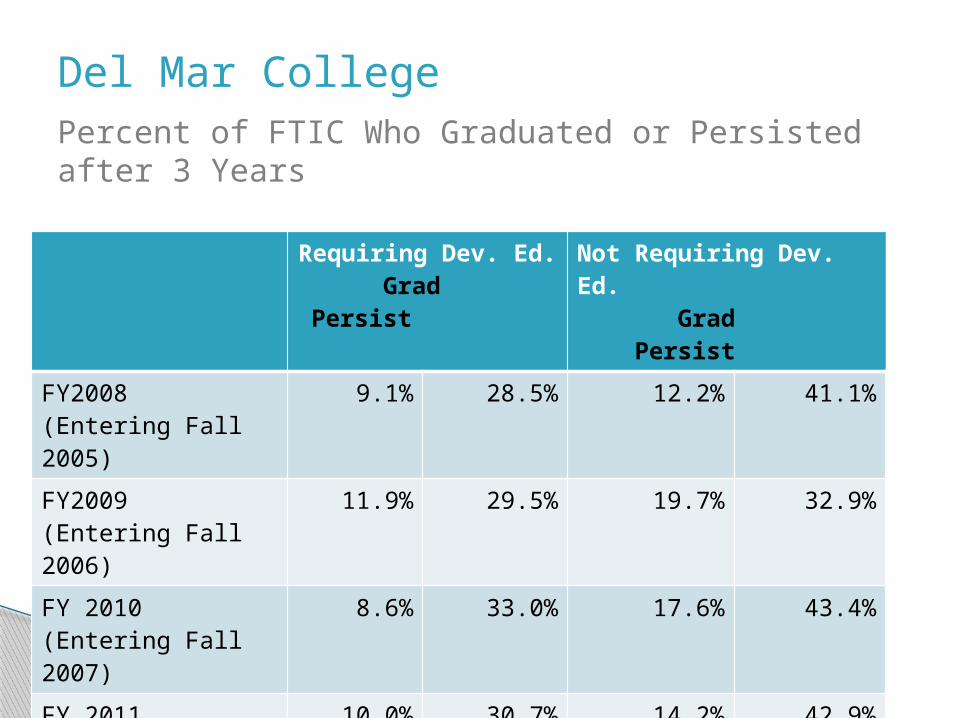
Requiring Dev. Ed. Grad Persist
Not Requiring Dev. Ed. Grad Persist
FY2008(Entering Fall 2005)
9.1% 28.5% 12.2% 41.1%
FY2009(Entering Fall 2006)
11.9% 29.5% 19.7% 32.9%
FY 2010(Entering Fall 2007)
8.6% 33.0% 17.6% 43.4%
FY 2011(Entering Fall 2008)
10.0% 30.7% 14.2% 42.9%
Del Mar CollegePercent of FTIC Who Graduated or Persisted after 3 Years
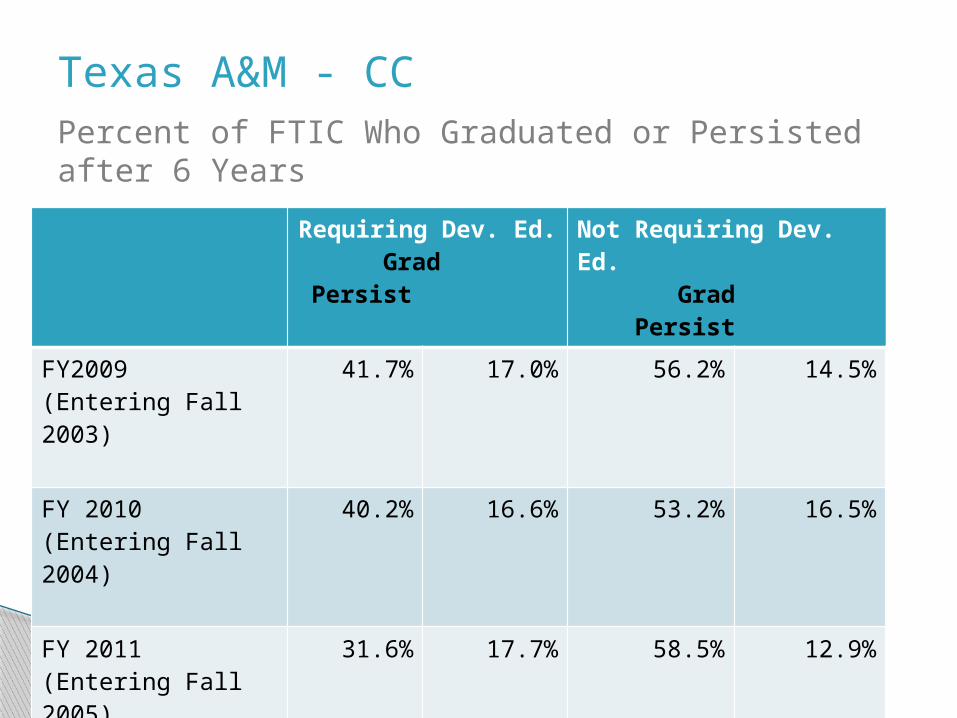
Requiring Dev. Ed. Grad Persist
Not Requiring Dev. Ed. Grad Persist
FY2009(Entering Fall 2003)
41.7% 17.0% 56.2% 14.5%
FY 2010(Entering Fall 2004)
40.2% 16.6% 53.2% 16.5%
FY 2011(Entering Fall 2005)
31.6% 17.7% 58.5% 12.9%
Texas A&M - CCPercent of FTIC Who Graduated or Persisted after 6 Years
Top Related