


Languages
Pages
Legal


J A C C : C A R D I O V A S C U L A R I M A G I N G V O L . 8 , N O . 9 , 2 0 1 5
ª 2 0 1 5 B Y T H E AM E R I C A N C O L L E G E O F C A R D I O L O G Y F O U N DA T I O N I S S N 1 9 3 6 - 8 7 8 X / $ 3 6 . 0 0
P U B L I S H E D B Y E L S E V I E R I N C . h t t p : / / d x . d o i . o r g / 1 0 . 1 0 1 6 / j . j c m g . 2 0 1 5 . 0 2 . 0 2 9
ORIGINAL RESEARCH
Assessment of Post-ProceduralAortic Regurgitation After TAVRAn Intraprocedural TEE Study
Hirotsugu Mihara, MD,* Kentaro Shibayama, MD,* Hasan Jilaihawi, MD,* Yuji Itabashi, MD,* Javier Berdejo, MD,*Hiroto Utsunomiya, MD,* Robert J. Siegel, MD,*y Raj R. Makkar, MD,* Takahiro Shiota, MD*y
ABSTRACT
Fro
Lo
Dr
res
Ed
the
Ma
OBJECTIVES The purpose of this study was to determine which echocardiographic parameters, including holodiastolic
flow reversal (HDFR) in the descending aorta, were useful for grading of post-procedural aortic regurgitation (PAR) after
transcatheter aortic valve replacement (TAVR) using intraprocedural transesophageal echocardiography.
BACKGROUND Reliable assessment of PAR in a catheterization laboratory is essential for an optimal outcome after
TAVR; however, such an assessment has not been determined.
METHODS Three hundred eighty patients who underwent TAVRwith the Edwards (Irvine, California) balloon-expandable
transcatheter heart valve were retrospectively assessed by intraprocedural transesophageal echocardiography. PAR was
evaluated by 2-dimensional color Doppler and pulse-wave Doppler in the descending aorta. Using 2-dimensional color
Doppler, we measured the cross-sectional area of the vena contracta, the circumferential extent at the aortic annular
plane, the longitudinal jet length, and the jet extent (with a mosaic pattern in the left ventricular outflow tract) compared
with the location of the tip of the anterior mitral leaflet (AML). Grading of PAR was determined using the following vena
contracta cutoffs: mild #9 mm2; moderate 10 to 29 mm2; and severe $30 mm2. Significant PAR was defined as at least
moderate grade.
RESULTS All patients with consistent HDFR had significant PAR. By multivariable analysis, consistent HDFR and the jet
extent beyond the tip of AML were independent predictors of significant PAR. Consistent HDFR and jet extent beyond the
tip of AML predicted significant PAR with specificities of 100% and 97%, respectively. In contrast, patients with both
negative HDFR and a jet extent of less than halfway to the tip of AML had no significant PAR, with 97% specificity.
CONCLUSIONS The presence of consistent HDFR and jet extent beyond the tip of AML are indicative of significant PAR
after TAVR. (J Am Coll Cardiol Img 2015;8:993–1003) © 2015 by the American College of Cardiology Foundation.
T ranscatheter aortic valve replacement (TAVR)is an alternative to surgical aortic valvereplacement for inoperable or surgical high-
risk patients with severe aortic stenosis (1–3). Post-procedural aortic regurgitation (PAR) is a commoncomplication after TAVR. PAR has been reported in65% to 96% of TAVR cases (1,4–7). In most cases, the
m the *Noninvasive Cardiac Laboratory, Cedars-Sinai Heart Institute, Los
s Angeles, Los Angles, California. Dr. Jilaihawi is a consultant for Edwards
. Siegel is a consultant for Abbott; and is a member of the Speakers Bure
earch grants from Cordis, Edwards Lifesciences, Medtronic, Abbott Vascu
wards; and is a consultant for Medtronic. Dr. Shiota is a speaker for Phili
y have no relationships relevant to the contents of this paper to disclose
nuscript received September 15, 2014; revised manuscript received Janua
grade of regurgitation is usually only mild. However,moderate and severe grades of PAR occur in 2%to 24% of patients (1,4–7). Multiple studies havedemonstrated that moderate and severe grades ofPAR are associated with worse clinical outcomes(4,6). Furthermore, the 2-year follow-up of thePARTNER (Placement of Aortic Transcatheter Valves)
Angeles, California; and the yUniversity of California,
Lifesciences, St. Jude Medical, and Venus Medtech.
au for Philips Ultrasound. Dr. Makkar has received
lar, Capricor, and St. Jude Medical; is a proctor for
ps Ultrasound. All other authors have reported that
.
ry 30, 2015, accepted February 17, 2015.
ABBR EV I A T I ON S
AND ACRONYMS
2D = 2-dimensional
AML = anterior mitral leaflet
AR = aortic regurgitation
CE = circumferential extent
HDFR = holodiastolic flow
reversal
Lcirc = circumferential length
Lrad = radial length
PAR = post-procedural aortic
regurgitation
proxTHV = proximal edge of
the transcatheter heart valve
PWD = pulse-waved Doppler
ROC = receiver-operating
characteristic
TAVR = transcatheter aortic
valve replacement
TEE = transesophageal
echocardiography
THV = transcatheter heart
valve
VCA = cross-sectional area of
the vena contracta
Mihara et al. J A C C : C A R D I O V A S C U L A R I M A G I N G , V O L . 8 , N O . 9 , 2 0 1 5
TAVR PAR Assessment Study S E P T E M B E R 2 0 1 5 : 9 9 3 – 1 0 0 3
994
trial has suggested that even mild paravalvu-lar regurgitation has been associated withincreased mortality (3). However, reliablemethods to diagnose PAR severity have notbeen established.
The aortic regurgitation (AR) index is 1of the valuable prognostic parameters forPAR in a catheterization laboratory (8).However, the echocardiographic quantifica-tion of PAR after TAVR is challenging. Therecently updated VARC-2 (Valve AcademicResearch Consortium-2) criteria (9) recom-mend measuring the circumferential extent(CE) of the color jet at the level of the prox-imal edge of the transcatheter heart valve(THV) to assess the severity of paravalvularregurgitation. However, this approach has notbeen validated. Holodiastolic flow reversal(HDFR) in the descending aorta (10–12), asdetected by pulse-wave Doppler (PWD), hasbeen used to assess the severity of nativechronic AR. However, it has not been vali-dated in patients with TAVR. The aim of thisstudy was to investigate the diagnostic valueof several echocardiographic parameters for
PAR, including HDFR in the descending aorta, and topropose how these parameters should be used forgrading PAR using intraprocedural transesophagealechocardiography (TEE). Furthermore, in the substudyanalysis, we compared color Doppler parameters ofthe short-axis plane of the aortic valve between thelevel of the aortic annulus and proximal edge of thetranscatheter heart valve (proxTHV) to determinewhich level was the best to evaluate paravalvularregurgitation.
SEE PAGE 1004
METHODS
STUDY POPULATION. We retrospectively reviewed400 consecutive severe AS patients who underwentTAVR with a balloon-expandable Edwards Sapien orSapien XT THV (Edwards Lifesciences, Irvine, Califor-nia) using intraprocedural TEE from December 2010 toMay 2013 in our institute. We excluded 13 patients whounderwent the valve-in-valve procedure, 3 patientswith past mitral valve replacement using mechanicalvalves, and 4 patients who did not have TEE imagesafter TAVR. Thus, 380 patients were evaluated. Alldemographic characteristic data and procedural re-cords were retrieved from medical records. Thisstudy was approved by the institutional review board.
INTRAPROCEDURAL TEE. Intraprocedural TEE wasperformed under general anesthesia using an iE33
ultrasound system equipped with a X7-2t TEEultrasound probe (Philips Medical Systems, Andover,Massachusetts). PAR was assessed by intraproceduralTEE using 2-dimensional (2D) color Doppler and PWDin the descending aorta immediately after THVdeployment. If PAR was transvalvular regurgitation,PARwas re-evaluated after removal of the catheter andguidewire. Multiple color Doppler long- and short-axisimages of the aortic valve were recorded for PARassessmentwith aNyquist limit of>50 cm/s. Color gainsettings were optimized to eliminate random color inareas without flow. The aortic valve was maximallymagnified, and then the area of interest was set assmall as possible to obtain the highest spatial resolu-tion. For the PWD spectra from the descending aorta,the sample volume was placed to the center of theproximal descending aorta at the periphery of the 90�
imaging sector arc, proximally or distally to align asmuch as possible along the major axis of the aorta (11).The Doppler filter was decreased to its lowest setting toallow detection of low velocities. All images wererecorded by experienced echocardiographers with>4 years of experience in the assessment of TAVRechocardiograms.PAR JET MEASUREMENT. PAR was assessed by bothlong- and short-axis imaging of the aortic valve using2D color Doppler of the intraprocedural TEE. Themaximal longitudinal length of a PAR jet with amosaic pattern from the proxTHV in the left ventric-ular outflow tract was measured in long-axis imaging(Figure 1A). The qualitative grading for PAR wasdetermined by the maximal longitudinal jet extentwith a mosaic pattern (not laminar blue or red color)(Figure 1A) in the left ventricular outflow tractcompared with the location of the tip of the anteriormitral leaflet (AML) as follows: grade I: the extent ofthe jet is less than halfway to the tip of AML; grade II:the extent of the jet is greater than halfway but lessthan the full distance to the tip of AML; and grade III:the extent of the jet goes beyond the tip of AML(Figure 1A). If multiple PAR jets were observed, thelongest jet was used for those measurements.
In the short-axis imaging, the sum of the cross-sectional area of the vena contracta (VCA) wasmeasured at the aortic annular plane (Figure 1B). In thesame images, if PAR was paravalvular regurgitation,the circumferential length (Lcirc) and radial length(Lrad) weremeasured (Figure 1B). The CE of the PAR jetwas determined by the percentage of the angle of thevena contracta in the whole THV circumference ac-cording to the following formula: angle of the venacontracta O 360 � 100 (Figure 1B). These measure-ments were performed by paying meticulous atten-tion to identifying an optimal annular plane for the

FIGURE 1 PAR Jet Measurement
(A) Long-axis image, showing the jet length (red arrow) from the proximal edge of transcatheter heart valve and the jet extent compared with
the location of the tip of the anterior mitral leaflet (AML) with a mosaic pattern. (B) Short-axis image at the aortic annulus, showing the cross-
sectional area of the vena contracta (VCA) (dashed line), and the circumferential length and the radial length of post-procedural aortic
regurgitation (PAR) jet. The circumferential extent of the PAR jet was determined from the angle of the VCA (a, B).
J A C C : C A R D I O V A S C U L A R I M A G I N G , V O L . 8 , N O . 9 , 2 0 1 5 Mihara et al.S E P T E M B E R 2 0 1 5 : 9 9 3 – 1 0 0 3 TAVR PAR Assessment Study
995
measurement of the short-axis color Doppler param-eters of PAR and by using as many videos as possible.In addition, we analyzed multiple 2D color Dopplerimages from different probe locations with multipleangles and directions in patients with severe acousticshadowing, and measured the jet parameters inoptimal images for each of the regurgitant jets.
PWD MEASUREMENT OF HOLODIASTOLIC FLOW
REVERSAL IN THE DESCENDING AORTA. PWD spectrafrom the descending aorta were assessed for the pres-ence or absence of HDFR. Diastolic flow was consid-ered to be negative HDFR if flow was predominantlyanterograde or if only an early retrograde flow wasobserved. Positive HDFR was regarded as present if
FIGURE 2 Two Types of Positive HDFR
(A) Partial holodiastolic flow reversal (HDFR) and (B) consistent HDFR.
retrograde holodiastolic flowwas seen (11). We dividedthe patients with positive HDFR into 2 groups: a partialpositive group if retrograde holodiastolic flow wasseen in several beats, but was not seen in all cardiaccycles (Figure 2A); and a consistent positive group ifretrograde holodiastolic flow was seen with everycardiac cycle (Figure 2B).
HEMODYNAMIC AND ANGIOGRAPHIC PARAMETERS.
Simultaneous pressure measurements in the leftventricle and in the ascending aorta were performedwith fluid-filled catheters after TAVR. The AR indexwas calculated according to the following formula:(diastolic blood pressure � left ventricular end-diastolic pressure) O systolic blood pressure � 100)
bpm ¼ beats/min; TEE ¼ transesophageal echocardiography.
Mihara et al. J A C C : C A R D I O V A S C U L A R I M A G I N G , V O L . 8 , N O . 9 , 2 0 1 5
TAVR PAR Assessment Study S E P T E M B E R 2 0 1 5 : 9 9 3 – 1 0 0 3
996
(8). Angiographic assessment of the severity of ARwas performed by visual estimation of the concen-tration of contrast medium in the left ventricle, usingthe method by Sellers et al. (13).
GRADING OF PAR. Grading of PAR was determinedwith 2D color Doppler using intraprocedural TEE.At first, we classified PAR as none or trivial usingthe visual estimation with 2D color Doppler by 2independent experienced echocardiographers. Theother PAR grades were determined by VCA usingthe following cutoffs: mild: #9 mm2; moderate: 10 to29 mm2; and severe: $30 mm2 in accordance withthe cutoff values for effective regurgitant orificearea in the American Society of Echocardiographyguideline (14) and VARC-2 criteria (9). If the VCA was
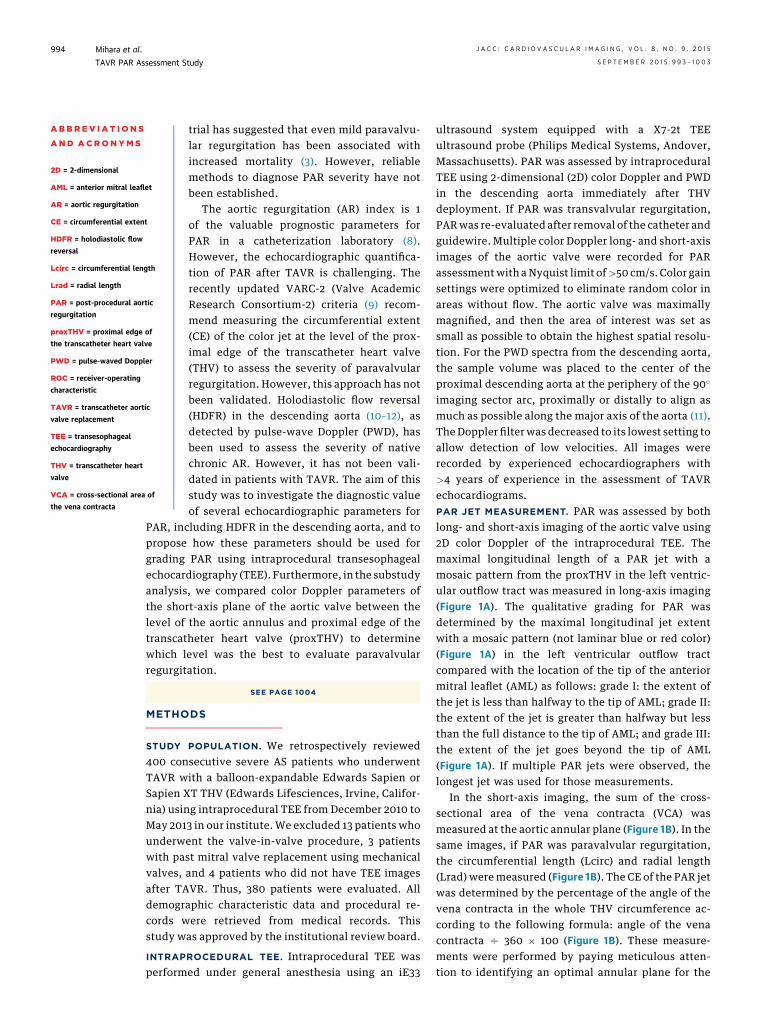
FIGURE 3 PAR Jet Measurement at the Annular and proxTHV Level
Simultaneous biplane color Doppler imaging for the (A) annular and (B)
simultaneous biplane imaging mode, the long-axis view was used as the
annulus and the left ventricular outflow tract just beneath the skirt of t
2 different short-axis planes. bpm ¼ beats/min; PAR ¼ post-procedural
not available, we excluded those patients fromfurther analysis. Significant PAR was defined as atleast a moderate grade. We investigated the con-sistency of PAR grading between 2D color DopplerTEE and aortography. All-cause death was investi-gated from the medical record and comparedbetween the no significant and significant PARgroups.
SUBSTUDY ANALYSIS FOR THE COMPARISON BETWEEN
THE ANNULUS AND proxTHV LEVEL. From the entirestudy population, we strictly selected patients withat least mild or more grade paravalvular regurgitationin whom post-procedural short-axis color Dopplerimages were available exactly at both the level ofthe aortic annulus and the proxTHV. Simultaneous
proximal edge of transcatheter heart valve (proxTHV) level. In the
primary plane with the orthogonal short-axis view placed at the
he transcatheter heart valve to ensure the optimal selection of these
aortic regurgitation.

J A C C : C A R D I O V A S C U L A R I M A G I N G , V O L . 8 , N O . 9 , 2 0 1 5 Mihara et al.S E P T E M B E R 2 0 1 5 : 9 9 3 – 1 0 0 3 TAVR PAR Assessment Study
997
biplane imaging was used to ensure the optimalselection of these planes using the long-axis view asthe primary plane with the orthogonal short-axis viewplaced at the annulus and the left ventricular outflowtract beneath the skirt of the THV (Figure 3). In thosepatients, we compared the cross-sectional area of theregurgitant jet, CE, Lcirc, and Lrad between these2 levels of the short-axis imaging.
INTRAOBSERVER AND INTEROBSERVER VARIABILITY. Forintraobserver and interobserver variability, 20 pa-tients were randomly selected and measured by anobserver at 2 separate times and also by another in-dependent observer, without knowledge of the re-sults obtained by the other observer.
TABLE 1 Baseline and Procedural Characteristics (n ¼ 380)
Female 161 (42)
Age, yrs 85 (79–92)
Height, cm 168 (160–175)
Body weight, kg 70 (62–83)
Body surface area, m2 1.8 � 0.2
History
Hypertension 340 (90)
Diabetes mellitus 130 (34)
Dyslipidemia 290 (76)
Atrial fibrillation 150 (40)
Chronic kidney disease 147 (39)
Chronic obstructive pulmonary disease 101 (27)
Coronary artery disease 244 (64)
Previous myocardial infarction 60 (16)
Previous percutaneous coronary intervention 115 (30)
Previous coronary artery bypass graft 123 (32)
Previous balloon aortic valve plasty 61 (16)
Symptom
Shortness of breath 366 (96)
NYHA functional class III or IV 313 (85)
Chest pain 59 (16)
Syncope 64 (17)
Congestive heart failure 268 (71)
Procedure
Access route
Femoral 324 (85)
Apical 31 (8)
Aortic 25 (7)
Prosthesis type
Sapien 255 (67)
Sapien XT 125 (33)
Prosthesis size
23 mm 148 (39)
26 mm 203 (53)
29 mm 29 (8)
Additional procedure
Post-balloon 22 (6)
Second prosthesis 13 (3)
Values are n (%), median (interquartile range), or mean � SD.
NYHA ¼ New York Heart Association.
STATISTICAL ANALYSIS. Data are presented asmean � SD when the Shapiro-Wilk test showed normaldistribution. When nonparametric statistical methodswere used, we summarized data with median andquartiles instead of means and SDs. Categorical vari-ables were analyzed as frequency or percentages, asappropriate. Differences between groups with andwithout significant PAR were assessed by unpairedStudent t test or Mann-Whitney U test for continuousvariables and by chi-square test or Fisher exact prob-ability test for categorical variables, as appropriate.Differences in the short-axis parameters between the2 levels of the short-axis in the substudy were assessedby a paired Student t test or a Wilcoxon signed ranktest, as appropriate. The associations among parame-ters for PAR and PAR grading were assessed bySpearman’s correlation coefficient. A kappa statisticwas used to determine the agreement on grading ofPAR severity between 2D color Doppler TEE andaortography. Using receiver-operating characteristics(ROC) analysis, we investigated which parameterscould estimate significant PAR and their cutoff values.The cutoff values were defined using these curves onthe basis of the highest sum of the sensitivity andspecificity for the prediction of significant PAR.
TABLE 2 PAR Parameters Between No Significant and Significant PAR Groups
ParametersNo Significant PAR
(n ¼ 257)Significant PAR
(n ¼ 95) p Value
Type of HDFR in the descending aorta 55 60 <0.001*
Negative 43 (78) 13 (22)
Partial HDFR 12 (22) 12 (20)
Consistent HDFR 0 (0) 35 (58)
Long-axis parameters 161 86
Jet length, mm 8.2 (4.9–12.3) 20.0 (12.9–25.4) <0.001*
Jet extent <0.001*
Grade I 134 (83) 16 (19)
Grade II 22 (14) 32 (37)
Grade III 5 (3) 38 (44)
Short-axis parameters 135 95
VCA, mm2 6 (3–8) 15 (12–18) <0.001*
Paravalvular regurgitation 121 91
CE, % 6.1 (4.4–8.3) 11.9 (9.2–15.8) <0.001*
Lcirc, mm 3.9 (2.9–5.8) 9.9 (7.1–13.2) <0.001*
Lrad, mm 1.8 (1.3–2.3) 2.7 (2.2–3.3) <0.001*
Hemodynamics 233 82
Systolic blood pressure, mm Hg 130 � 25 126 � 25 0.23
Diastolic blood pressure, mm Hg 50 (44–59) 47 (40–55) 0.013*
Left ventricular end-diastolicpressure, mm Hg
18 (13–23) 19 (15–24) 0.12
AR index 26.0 � 8.3 22.1 � 8.4 <0.001*
Values are n, n (%), median (interquartile range), or mean � SD. *p < 0.05 between the groups with and withoutsignificant PAR.
AR ¼ aortic regurgitation; CE ¼ circumferential extent; HDFR ¼ holodiastolic flow reversal; Lcirc ¼ circum-ferential length; Lrad ¼ radial length; PAR ¼ post-procedural aortic regurgitation; VCA ¼ cross-sectional area ofthe vena contracta.
Mihara et al. J A C C : C A R D I O V A S C U L A R I M A G I N G , V O L . 8 , N O . 9 , 2 0 1 5
TAVR PAR Assessment Study S E P T E M B E R 2 0 1 5 : 9 9 3 – 1 0 0 3
998
Significant variables in the univariable analysis wereincluded in a multivariable logistic regression analysiswith stepwise forward selection method to identifyindependent variables that predicted significant PAR.Survival curves for time-to-event variables were con-structed using Kaplan-Meier estimates and werecompared using the log-rank test. To study the effectof significant PAR on mortality, Cox proportionalhazards regression was performed. Two-tailedp values <0.05 were considered statistically signifi-cant. For color Doppler measurements, the intra-observer and interobserver reproducibility wereestimated using 1-way random double-measure and2-way random single-measure intraclass correlationcoefficients. Analyses were performed using SPSSversion 19.0 (IBM, Armonk, New York).
RESULTS
BASELINE CLINICAL CHARACTERISTICS AND TAVR
PROCEDURE. The data on the baseline clinical
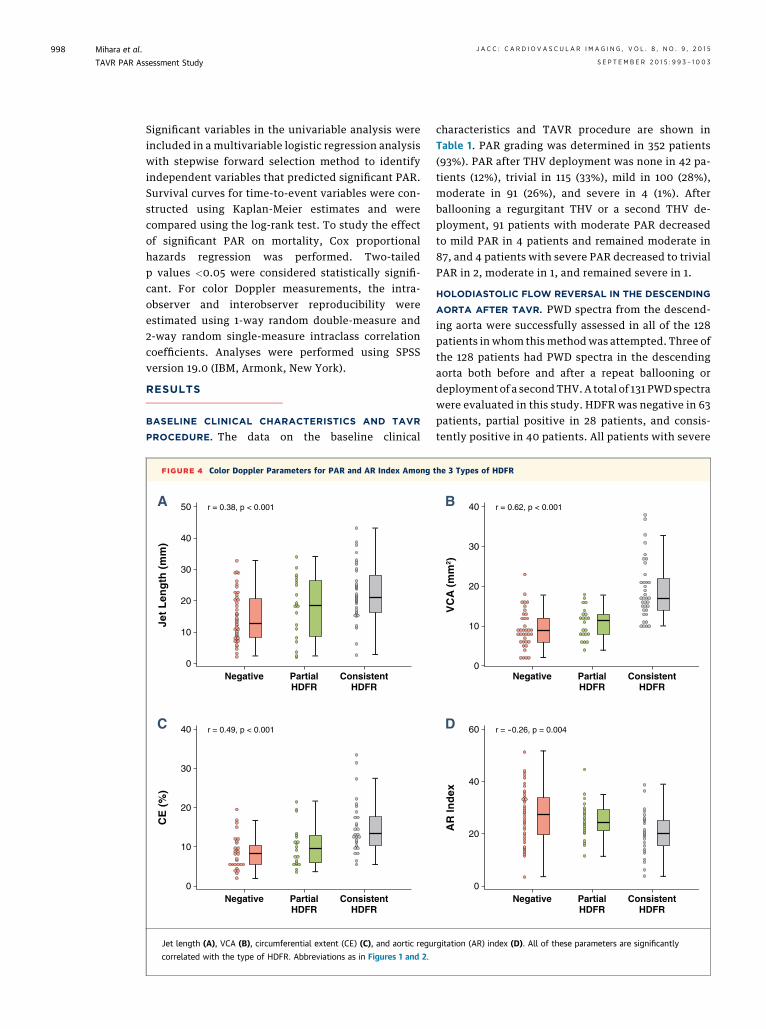
FIGURE 4 Color Doppler Parameters for PAR and AR Index Among
r = 0.38, p < 0.001
0
10
20
30
40
50
Jet
Len
gth
(m
m)
A
Negative PartialHDFR
ConsistentHDFR
r = 0.49, p < 0.001
0
10
20
30
40
CE
(%
)
C
Negative PartialHDFR
ConsistentHDFR
Jet length (A), VCA (B), circumferential extent (CE) (C), and aortic regu
correlated with the type of HDFR. Abbreviations as in Figures 1 and 2.
characteristics and TAVR procedure are shown inTable 1. PAR grading was determined in 352 patients(93%). PAR after THV deployment was none in 42 pa-tients (12%), trivial in 115 (33%), mild in 100 (28%),moderate in 91 (26%), and severe in 4 (1%). Afterballooning a regurgitant THV or a second THV de-ployment, 91 patients with moderate PAR decreasedto mild PAR in 4 patients and remained moderate in87, and 4 patients with severe PAR decreased to trivialPAR in 2, moderate in 1, and remained severe in 1.
HOLODIASTOLIC FLOW REVERSAL IN THE DESCENDING
AORTA AFTER TAVR. PWD spectra from the descend-ing aorta were successfully assessed in all of the 128patients in whom this methodwas attempted. Three ofthe 128 patients had PWD spectra in the descendingaorta both before and after a repeat ballooning ordeployment of a secondTHV. A total of 131 PWD spectrawere evaluated in this study. HDFR was negative in 63patients, partial positive in 28 patients, and consis-tently positive in 40 patients. All patients with severe
the 3 Types of HDFR
r = 0.62, p < 0.001
0
10
20
30
40
VC
A (
mm
2 )
B
Negative PartialHDFR
ConsistentHDFR
r = -0.26, p = 0.004
0
20
40
60
AR
Ind
ex
D
Negative PartialHDFR
ConsistentHDFR
rgitation (AR) index (D). All of these parameters are significantly

FIGURE 5 A Representative Case of Parallel Improvement of Both VCA and HDFR After Second THV Deployment
(A1 and A2) A short-axis color Doppler image and PWD spectra before second THV valve deployment. (B1 and B2) Images after second THV
valve deployment. After second THV valve deployment, VCA decreased from 27 to 16 mm2, and PWD tracings of the descending aorta showed
the change of HDFR type from consistent to partial HDFR. PWD ¼ pulse-waved Doppler; other abbreviations as in Figures 1 to 3.
FIGURE 6 Relationship Between Longitudinal Jet Extent and VCA
Jet Extent
Grade I Grade II Grade III0
10
20
30
40
r = 0.64, p < 0.001
VCA is significantly correlated with the grade of jet extent
(r ¼ 0.64; p < 0.001). In the patients with grade I jet extent,
90% of patients had VCA of #10 mm2, and all patients had VCA
of <20 mm2. In contrast, in patients with grade III jet extent,
88% of patients had VCA of $10 mm2. Abbreviations as in
Figure 1.
J A C C : C A R D I O V A S C U L A R I M A G I N G , V O L . 8 , N O . 9 , 2 0 1 5 Mihara et al.S E P T E M B E R 2 0 1 5 : 9 9 3 – 1 0 0 3 TAVR PAR Assessment Study
999
PAR had consistent HDFR. In 5 patients with consis-tent HDFR and 4 with partial HDFR, grading of PARwas not determined by VCA. In the remaining 35patients with consistent HDFR, all patients had sig-nificant PAR. Twelve (50%) of the remaining 24patients with partial HDFR had significant PAR(Table 2). Partial HDFR was observed in 2 patientswithout PAR. The types of HDFR were significantly
TABLE 3 ROC Curve Analyses for Estimating Significant PAR
AUC 95% CI p ValueCutoffValue Sensitivity Specificity
Color Doppler parameters
Jet length 0.83 0.77–0.89 <0.001 15.1 69.0 87.9
CE 0.87 0.82–0.92 <0.001 8.5 82.6 77.2
Lcirc 0.92 0.88–0.95 <0.001 6.4 85.9 80.8
Lrad 0.80 0.73–0.86 <0.001 2.2 82.6 68.3
Hemodynamic parameters
Diastolic bloodpressure
0.60 0.53–0.67 0.008 46.5 67.5 48.8
AR index 0.63 0.56–0.70 0.001 22.4 65.8 56.0
AUC ¼ area under the curve; CI ¼ confidence interval; ROC ¼ receiver-operating characteristic; otherabbreviations as in Table 2.

TABLE 4 Univariable and Multivariable Logistic Regression Analysis for Estimating
Significant PAR
Univariable Multivariable
OR 95% CI p Value OR 95% CI p Value
Consistent HDFR 25.1 7.1–88.0 <0.001 21.5 4.5–102.3 <0.001
Jet length >15.1 mm 14.7 8.0–27.1 <0.001 0.22
Grade III jet extent 19.5 8.3–45.9 <0.001 6.4 2.0–21.1 0.002
AR index <22.4 2.2 1.4–3.6 0.001 0.46
OR ¼ odds ratio; other abbreviations as in Tables 2 and 3.
TABLE 5 Prediction
For significant PAR
All positive HDFR
Consistent HDFR
Grade III jet extent
For no significant PAR
Negative HDFR
Grade I jet extent
Both negative HDFR
LR ¼ likelihood ratio; othe
Mihara et al. J A C C : C A R D I O V A S C U L A R I M A G I N G , V O L . 8 , N O . 9 , 2 0 1 5
TAVR PAR Assessment Study S E P T E M B E R 2 0 1 5 : 9 9 3 – 1 0 0 3
1000
correlated with jet length, VCA, CE, the AR index(Figure 4), and PAR grading (r ¼ 0.63; p < 0.001).
A representative case of parallel improvement ofboth VCA and HDFR after a second THV deploymentis shown in Figure 5.
COLOR DOPPLER PARAMETERS FOR PAR. In pa-tients with any grade of PAR, jet extent and VCA wereobtained in 80% and 74%, respectively (p ¼ 0.11). Jetlength, jet extent, VCA, CE, Lcirc, and Lrad weresignificantly greater in the significant PAR group thanin the group without significant PAR (Table 2). VCAsignificantly correlated with the grade of jet extent(r ¼ 0.64; p < 0.001) (Figure 6). In the patients withgrade I jet extent, 90% of the patients had VCA #10mm2, and all patients had VCA <20 mm2. In contrast,in patients with grade III jet extent, 88% of patientshad VCA of $10 mm2.
PREDICTION OF SIGNIFICANT PAR. ROC curve ana-lyses for predicting significant PAR are listed inTable 3. Using the cutoff values derived from ROCcurve analyses, only consistent HDFR and grade III jetextent were independent predictors of significantPAR by multivariable analysis (Table 4). The presenceof consistent HDFR and grade III jet extent estimatedsignificant PAR with specificities of 100% and 97%,respectively. In contrast, patients with both negativeHDFR and a grade I jet extent had no significant PAR,with 97% specificity (Table 5).
for Significant or No Significant PAR
Sensitivity SpecificityPositive
LRNegative
LRkappa
Statistic
78% 78% 3.6 0.3 0.56
58% 100% Infinite 0.4 0.57
44% 97% 14.2 0.6 0.47
78% 78% 3.6 0.3 0.56
83% 81% 4.5 0.2 0.63
and grade I jet extent 43% 97% 16.4 0.6 0.43
r abbreviations as in Table 2.
COMPARISON BETWEEN ECHOCARDIOGRAPHY
PARAMETERS AND OTHER PARAMETERS. The ARindex was obtained in 92% of patients. The type ofHDFR and all color Doppler parameters of the long-and short-axis views at the annulus were significantlycorrelated with the AR index as follows: type ofHDFR: r ¼ –0.26, p ¼ 0.004; jet length: r ¼ –0.22,p ¼ 0.002; jet extent grade: r ¼ –0.21, p ¼ 0.002; VCA:r ¼ –0.21, p ¼ 0.003; CE: r ¼ –0.16, p ¼ 0.03; Lcirc:r ¼ –0.23, p ¼ 0.002; and Lrad: r ¼ –0.16, p ¼ 0.03.
We found 45 patients who had aortography withadequate image quality for grading AR and hadechocardiographic PAR grading. In these 45 patients,PAR grading by 2D color Doppler TEE showed modestcorrelation with aortography (r ¼ 0.50; p < 0.001).PAR grading by 2D color Doppler TEE was inconsis-tent with that of aortography in 44.4%, was slightlyoverestimated in 42.2%, and was underestimated in13.3% compared with aortography (kappa statistic ¼0.20; p ¼ 0.01) (Table 6).
CLINICAL OUTCOME. The median clinical follow-upwas 255 days (interquartile range [IQR]: 71 to 742days) in the no significant PAR group and 141 days(IQR: 44 to 513 days) in the significant PAR group, andsurvival data were obtained in all patients. Kaplan-Meier survival estimates suggested that significantPAR was associated with increased late mortality(hazard ratio: 2.4; 95% confidence interval: 1.3 to 4.5;p ¼ 0.004) (Figure 7).
SUBSTUDY RESULTS FOR THE COMPARISON
BETWEEN THE ANNULUS AND PROXTHV LEVEL. Short-axis color Doppler parameters at both the annulusand proxTHV level were measured in 33 patients. Inthese patients, the ratios of the cross-sectional areaof the regurgitant jet, CE, Lcirc, and Lrad at theproxTHV level to the annular level were 2.6 (IQR:2.0 to 4.0), 1.5 (IQR: 1.0 to 2.0), 1.6 (IQR: 1.0 to 2.0),and 1.8 (IQR: 1.5 to 2.2), respectively, whereas theseratios varied widely depending on the PAR jetdirections (Table 7). In this substudy population,VCA and CE at the annulus were significantlycorrelated with the AR index (r ¼ –0.39, p ¼ 0.03and r ¼ –0.50, p ¼ 0.01, respectively), whereas thecross-sectional jet area and CE at proxTHV werenot correlated (r ¼ –0.09, p ¼ 0.44 and r ¼ –0.21,p ¼ 0.10, respectively).
REPRODUCIBILITY OF MEASUREMENTS. All patientswere classified into the same type of HDFR by 2different observers. Intraclass coefficients of themeasurement of the jet length, VCA, and CE were0.93, 0.96, and 0.88, respectively, for intraobservervariability and 0.94, 0.95, and 0.86, respectively, forinterobserver variability.
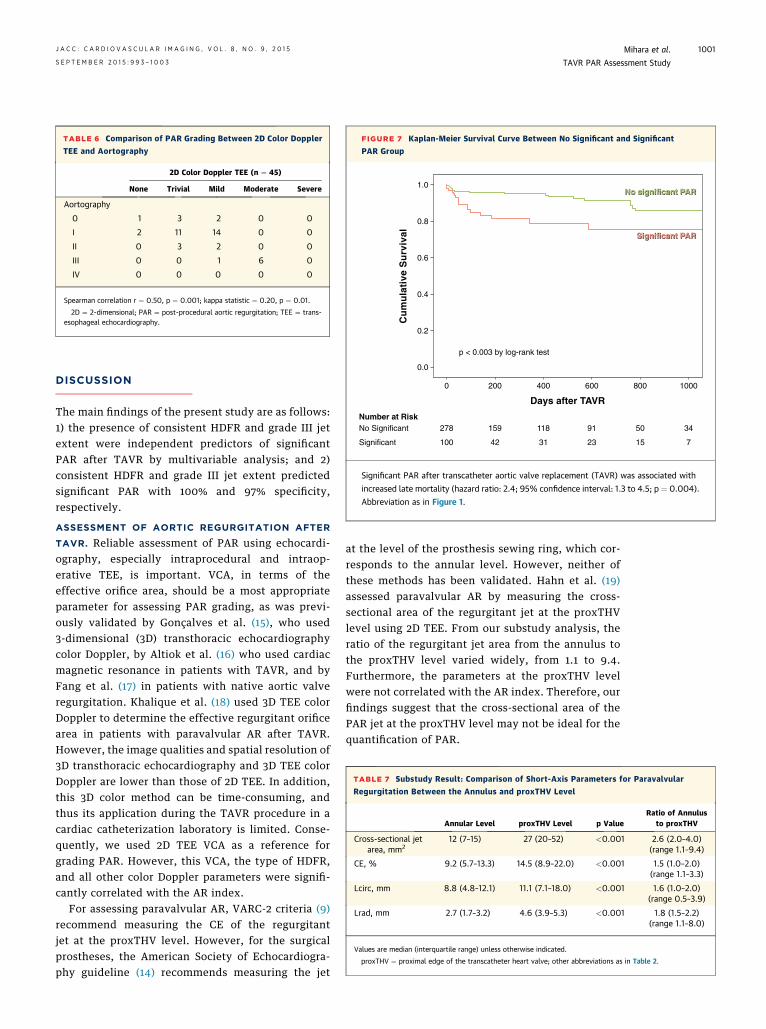
TABLE 6 Comparison of PAR Grading Between 2D Color Doppler
TEE and Aortography
2D Color Doppler TEE (n ¼ 45)
None Trivial Mild Moderate Severe
Aortography
0 1 3 2 0 0
I 2 11 14 0 0
II 0 3 2 0 0
III 0 0 1 6 0
IV 0 0 0 0 0
Spearman correlation r ¼ 0.50, p ¼ 0.001; kappa statistic ¼ 0.20, p ¼ 0.01.
2D ¼ 2-dimensional; PAR ¼ post-procedural aortic regurgitation; TEE ¼ trans-esophageal echocardiography.
FIGURE 7 Kaplan-Meier Survival Curve Between No Significant and Significant
PAR Group
Cu
mu
lati
ve S
urv
ival
Days after TAVR
0 200 400 600 800 1000
278 159 118 91 50 34
100
No SignificantNumber at Risk
751321324tnacifingiS
0.0
0.2
0.4
0.6
0.8
1.0
p < 0.003 by log-rank test
Significant PAR after transcatheter aortic valve replacement (TAVR) was associated with
increased late mortality (hazard ratio: 2.4; 95% confidence interval: 1.3 to 4.5; p ¼ 0.004).
Abbreviation as in Figure 1.
TABLE 7 Substudy Result: Comparison of Short-Axis Parameters for Paravalvular
Regurgitation Between the Annulus and proxTHV Level
Annular Level proxTHV Level p ValueRatio of Annulus
to proxTHV
Cross-sectional jetarea, mm2
12 (7–15) 27 (20–52) <0.001 2.6 (2.0–4.0)(range 1.1–9.4)
CE, % 9.2 (5.7–13.3) 14.5 (8.9–22.0) <0.001 1.5 (1.0–2.0)(range 1.1–3.3)
Lcirc, mm 8.8 (4.8–12.1) 11.1 (7.1–18.0) <0.001 1.6 (1.0–2.0)(range 0.5–3.9)
Lrad, mm 2.7 (1.7–3.2) 4.6 (3.9–5.3) <0.001 1.8 (1.5–2.2)(range 1.1–8.0)
Values are median (interquartile range) unless otherwise indicated.
proxTHV ¼ proximal edge of the transcatheter heart valve; other abbreviations as in Table 2.
J A C C : C A R D I O V A S C U L A R I M A G I N G , V O L . 8 , N O . 9 , 2 0 1 5 Mihara et al.S E P T E M B E R 2 0 1 5 : 9 9 3 – 1 0 0 3 TAVR PAR Assessment Study
1001
DISCUSSION
The main findings of the present study are as follows:1) the presence of consistent HDFR and grade III jetextent were independent predictors of significantPAR after TAVR by multivariable analysis; and 2)consistent HDFR and grade III jet extent predictedsignificant PAR with 100% and 97% specificity,respectively.
ASSESSMENT OF AORTIC REGURGITATION AFTER
TAVR. Reliable assessment of PAR using echocardi-ography, especially intraprocedural and intraop-erative TEE, is important. VCA, in terms of theeffective orifice area, should be a most appropriateparameter for assessing PAR grading, as was previ-ously validated by Gonçalves et al. (15), who used3-dimensional (3D) transthoracic echocardiographycolor Doppler, by Altiok et al. (16) who used cardiacmagnetic resonance in patients with TAVR, and byFang et al. (17) in patients with native aortic valveregurgitation. Khalique et al. (18) used 3D TEE colorDoppler to determine the effective regurgitant orificearea in patients with paravalvular AR after TAVR.However, the image qualities and spatial resolution of3D transthoracic echocardiography and 3D TEE colorDoppler are lower than those of 2D TEE. In addition,this 3D color method can be time-consuming, andthus its application during the TAVR procedure in acardiac catheterization laboratory is limited. Conse-quently, we used 2D TEE VCA as a reference forgrading PAR. However, this VCA, the type of HDFR,and all other color Doppler parameters were signifi-cantly correlated with the AR index.
For assessing paravalvular AR, VARC-2 criteria (9)recommend measuring the CE of the regurgitantjet at the proxTHV level. However, for the surgicalprostheses, the American Society of Echocardiogra-phy guideline (14) recommends measuring the jet
at the level of the prosthesis sewing ring, which cor-responds to the annular level. However, neither ofthese methods has been validated. Hahn et al. (19)assessed paravalvular AR by measuring the cross-sectional area of the regurgitant jet at the proxTHVlevel using 2D TEE. From our substudy analysis, theratio of the regurgitant jet area from the annulus tothe proxTHV level varied widely, from 1.1 to 9.4.Furthermore, the parameters at the proxTHV levelwere not correlated with the AR index. Therefore, ourfindings suggest that the cross-sectional area of thePAR jet at the proxTHV level may not be ideal for thequantification of PAR.

PERSPECTIVES
COMPETENCY IN MEDICAL KNOWLEDGE: PAR
after TAVR is a relatively common complication and
is associated with an increased risk for cardiovas-
cular mortality after TAVR. Reliable grading of PAR
in the catheterization laboratory is essential for an
optimal outcome after TAVR. This study explores
the utility of easily applicable semiquantitative
parameters of aortic regurgitation for grading PAR
during TAVR.
TRANSLATIONAL OUTLOOK: Techniques for
assessing PAR after TAVR require further standardi-
zation in multicenter settings, particularly for deter-
mining the threshold of PAR in which additional
intervention in the catheterization or hybrid labora-
tory leads to improvement in clinical outcomes
following TAVR.
Mihara et al. J A C C : C A R D I O V A S C U L A R I M A G I N G , V O L . 8 , N O . 9 , 2 0 1 5
TAVR PAR Assessment Study S E P T E M B E R 2 0 1 5 : 9 9 3 – 1 0 0 3
1002
HDFR IN THE DESCENDING AORTA. In our study, inaddition to the high diagnostic value of consistentHDFR for significant PAR, PWD in the descendingaorta was assessed in 100% of patients as opposed tothe VCA in 74% of patients. Furthermore, its evalu-ation was highly reproducible. Therefore, it is auseful parameter for PAR evaluation. In native valvechronic AR assessment, diastolic flow reversal inthe descending aorta has been used to determineseverity of AR by echocardiography (10–12) and bycardiac magnetic resonance (20). In most of theseprevious studies, transthoracic echocardiographywas used, which has a limited window from thesuprasternal notch, and sometimes has significantartifacts, leading to the inability to reliably detectend-diastolic reversal in the descending aorta. Inour study, we used intraoperative TEE, which has agreater Doppler angle with the descending flow.However, Sutton et al. (11) obtained adequatespectra from the proximal descending aorta usingTEE in >95% of patients, which is in line with ourresults.
CLINICAL IMPLICATIONS. A reliable intraproceduralechocardiographic grading of PAR is important foroptimizing the TAVR result. VCA can be used as areference for grading PAR. However, this method iscumbersome and needs experienced echocardiog-raphers for both imaging and analyzing due to thethrough-plane phenomenon in the short-axis view ofthe aortic valve, if this measurement was strictly doneat the exact annular level. We found that VCA could beobtained in only 74% of patients with PAR, whereaslongitudinal jet extent was reproducibly measured in80%, and PWD spectra in the descending aorta wereobtained in 100% of patients. Therefore, in additionto VCA assessment, we proposed here to assess HDFRin the descending aorta and “classical” longitudinaljet extent for grading of PAR. These methods areeasy to use, highly reproducible, and convenientintraprocedural parameters for PAR. Therefore, theycan serve as surrogates or alternatives when directvisualization of the PAR orifice is not optimal due tothe artifact.
STUDY LIMITATIONS. First, this was a retrospectivestudy. However, echocardiographic data were recor-ded by one of the most experienced echocardiogra-phy teams on TAVR. Second, the assessment of thedescending aorta flow by TEE had several limitations,such as recording during hemodynamic instability, alarge Doppler interrogation angle with the directionof the blood stream, reduced aortic compliance, andincreased heart rates. Nonetheless, the presence ofHDFR successfully predicted significant PAR. Third,
this VCA method for grading PAR by 2D color DopplerTEE was not strictly validated. However, this VCAmethod by 3D transthoracic echocardiography wasvalidated by other investigators (15,16). In addition,this VCA method by 3D color Doppler TEE was usedfor grading paravalvular regurgitation after TAVR inrecent studies (18,19). Fourth, eccentric or curved jetsmight be underestimated by the longitudinal jetlength and extent or overestimated by the VCA.Therefore, the direction of the regurgitant jet shouldbe taken into account for grading PAR using thesejet parameters. Fifth, we used VCA as a referencemethod. Therefore, short-axis parameters such as CE,Lcirc, and Lrad, which are part of the components ofVCA, should be excluded from the multivariableanalysis due to their mutual high correlation.
CONCLUSIONS
The presence of consistent HDFR and jet extentbeyond the tip of AML are indicative of significantPAR after TAVR.
ACKNOWLEDGMENTS The authors thank Dr. andMrs. Paul I. Terasaki for their kind support andencouragement.
REPRINT REQUESTS AND CORRESPONDENCE: Dr.Takahiro Shiota, Noninvasive Cardiac Laboratory,Cedars-Sinai Heart Institute, 127 South San VicenteBoulevard, A3411, Los Angeles, California 90048.E-mail: [email protected].

J A C C : C A R D I O V A S C U L A R I M A G I N G , V O L . 8 , N O . 9 , 2 0 1 5 Mihara et al.S E P T E M B E R 2 0 1 5 : 9 9 3 – 1 0 0 3 TAVR PAR Assessment Study
1003
RE F E RENCE S
1. Leon MB, Smith CR, Mack M, et al. Trans-catheter aortic-valve implantation for aortic ste-nosis in patients who cannot undergo surgery.N Engl J Med 2010;363:1597–607.
2. SmithCR, LeonMB,MackMJ, et al. Transcatheterversus surgical aortic-valve replacement in high-risk patients. N Engl J Med 2011;364:2187–98.
3. Kodali SK, Williams MR, Smith CR, et al. Two-year outcomes after transcatheter or surgicalaortic-valve replacement. N Engl J Med 2012;366:1686–95.
4. Athappan G, Patvardhan E, Tuzcu EM, et al.Incidence, predictors, and outcomes of aorticregurgitation after transcatheter aortic valvereplacement: meta-analysis and systematic reviewof literature. J Am Coll Cardiol 2013;61:1585–95.
5. Detaint D, Lepage L, Himbert D, et al. De-terminants of significant paravalvular regurgita-tion after transcatheter aortic valve: implantationimpact of device and annulus discongruence. J AmColl Cardiol Intv 2009;2:821–7.
6. Sinning JM, Vasa-Nicotera M, Chin D, et al.Evaluation and management of paravalvular aorticregurgitation after transcatheter aortic valvereplacement. J Am Coll Cardiol 2013;62:11–20.
7. Rajani R, Kakad M, Khawaja MZ, et al. Para-valvular regurgitation one year after transcatheteraortic valve implantation. Catheter CardiovascInterv 2010;75:868–72.
8. Sinning JM, Hammerstingl C, Vasa-Nicotera M,et al. Aortic regurgitation index defines severityof peri-prosthetic regurgitation and predictsoutcome in patients after transcatheter aortic valveimplantation. J Am Coll Cardiol 2012;59:1134–41.
9. Kappetein AP, Head SJ, Généreux P, et al.Updated standardized endpoint definitions for
transcatheter aortic valve implantation: the ValveAcademic Research Consortium-2 consensus docu-ment. J Thorac Cardiovasc Surg 2013;145:6–23.
10. Reimold SC, Maier SE, Aggarwal K, et al. Aorticflow velocity patterns in chronic aortic regurgita-tion: implications for Doppler echocardiography.J Am Soc Echocardiogr 1996;9:675–83.
11. Sutton DC, Kluger R, Ahmed SU, Reimold SC,Mark JB. Flow reversal in the descending aorta:a guide to intraoperative assessment of aorticregurgitation with transesophageal echocardi-ography. J Thorac Cardiovasc Surg 1994;108:576–82.
12. Tribouilloy C, Avinee P, Shen WF, Rey JL,Slama M, Lesbre JP. End diastolic flow velocityjust beneath the aortic isthmus assessed by pulsedDoppler echocardiography: a new predictor of theaortic regurgitant fraction. Heart 1991;65:37–40.
13. Sellers RD, Levy MJ, Amplatz K, Lillehei CW. Leftretrograde cardioangiography in acquired cardiacdisease: technic, indications and interpretations in700 cases. Am J Cardiol 1964;14:437–47.
14. Zoghbi WA, Chambers JB, Dumesnil JG, et al.Recommendations for evaluation of prostheticvalves with echocardiography and Doppler ultra-sound: a report from the American Society ofEchocardiography’s Guidelines and StandardsCommittee and the Task Force on ProstheticValves, developed in conjunction with the Amer-ican College of Cardiology Cardiovascular ImagingCommittee, Cardiac Imaging Committee of theAmerican Heart Association, the European Asso-ciation of Echocardiography, a registered branchof the European Society of Cardiology, the Japa-nese Society of Echocardiography and the Cana-dian Society of Echocardiography. J Am SocEchocardiogr 2009;22:975–1014, quiz 1082–4.
15. Gonçalves A, Almeria C, Marcos-Alberca P,et al. Three-dimensional echocardiography in pa-ravalvular aortic regurgitation assessment aftertranscatheter aortic valve implantation. J Am SocEchocardiogr 2012;25:47–55.
16. Altiok E, Frick M, Meyer CG, et al. Comparisonof two- and three-dimensional transthoracicechocardiography to cardiac magnetic resonanceimaging for assessment of paravalvular regurgi-tation after transcatheter aortic valve implanta-tion. Am J Cardiol 2014;113:1859–66.
17. Fang L, Hsiung MC, Miller AP, et al. Assessmentof aortic regurgitation by live three-dimensionaltransthoracic echocardiographic measurements ofvena contracta area: usefulness and validation.Echocardiography 2005;22:775–81.
18. Khalique OK, Kodali SK, Paradis JM, et al.Aortic annular sizing using a novel 3-dimensionalechocardiographic method: use and comparisonwith cardiac computed tomography. Circ Car-diovasc Img 2014;7:155–63.
19. Hahn RT, Khalique O, Williams MR, et al.Predicting paravalvular regurgitation followingtranscatheter valve replacement: utility of a novelmethod for three-dimensional echocardiographicmeasurements of the aortic annulus. J Am SocEchocardiogr 2013;26:1043–52.
20. Bolen MA, Popovic ZB, Rajiah P, et al. Car-diac MR assessment of aortic regurgitation: hol-odiastolic flow reversal in the descending aortahelps stratify severity. Radiology 2011;260:98–104.
KEY WORDS aortic stenosis, paravalvularregurgitation, transcatheter aortic valvereplacement, transesophagealechocardiography
Top Related