


Languages
Pages
Legal

LOGISTICS PERFORMANCE INDEX 2010:
THE ASIA-PACIFIC REGION
Findings based on the World Bank Report
Connecting to Compete 2010: Trade Logistics in the Global Economy
Credits for Photographs on the Cover (from left to right): Francis Dobbs (vendors in Vietnam), World Bank Photo
Library; Curt Carnemark (harbor of Hong Kong, China) from the World Bank Photo Library; and
Tran Thi Hoa (ground transportation in Vietnam) from the World Bank Photo Library.
Connecting to Compete in the Asia-Pacific
Logistics encompasses an array of essential activities for
trade—including transport, warehousing, cargo
consolidation, border clearance, distribution, and
payment systems. Competitive trade logistics is a
fundamental building block of trade and economic
development, and more so in a global economy that has
become increasingly interconnected and interdependent.
Better logistics have a greater effect on trade promotion
than tariff cuts. They lower prices for consumers and
support diversification into higher value-added exports.
Global production chains, a key feature of the Asia-Pacific
regional economy, also depend on a robust logistics
sector. Coordinating the various stages of product
development, component production, and final assembly
requires the ability to move goods across borders quickly,
reliably, and at low cost.
Logistics Performance Index 2010
The World Bank’s Logistics Performance Index (LPI)
2010 is a comprehensive index of logistics performance
in 155 economies. The LPI covers the entire supply chain
and is based on a survey of nearly 1,000 logistics
professionals worldwide. It is a useful tool in comparing
logistics performance across economies and identifying
key reform priorities within economies.
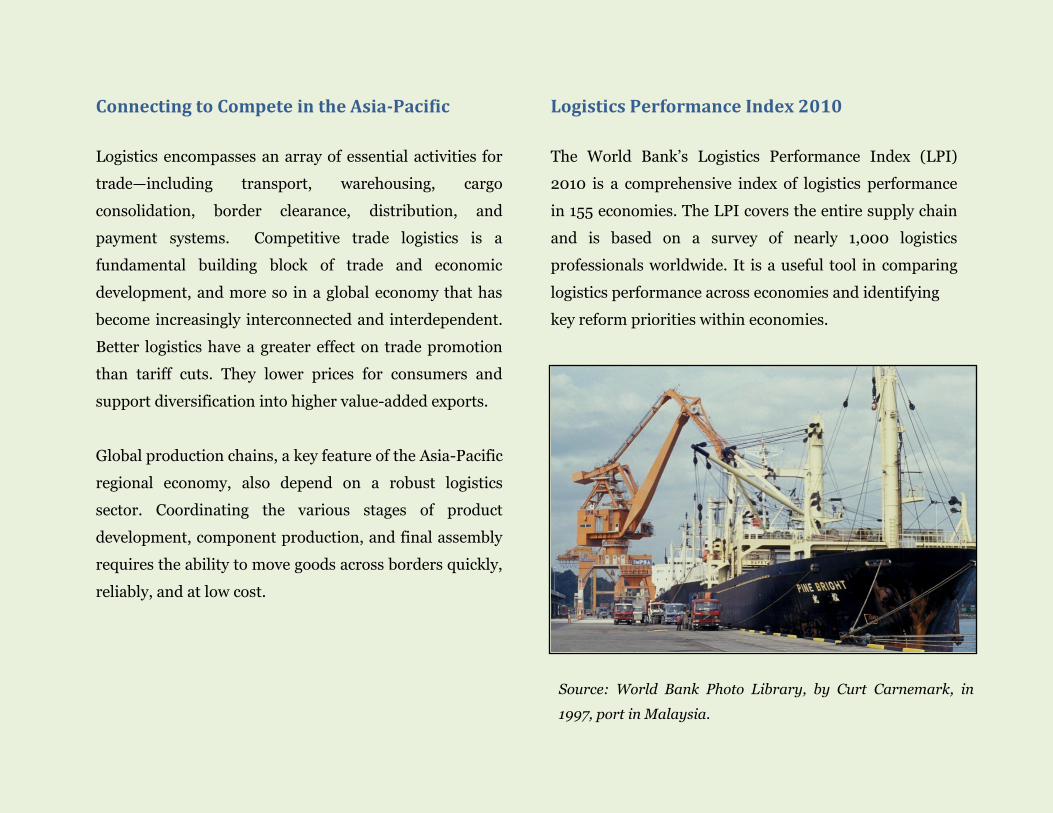
Source: World Bank Photo Library, by Curt Carnemark, in
1997, port in Malaysia.
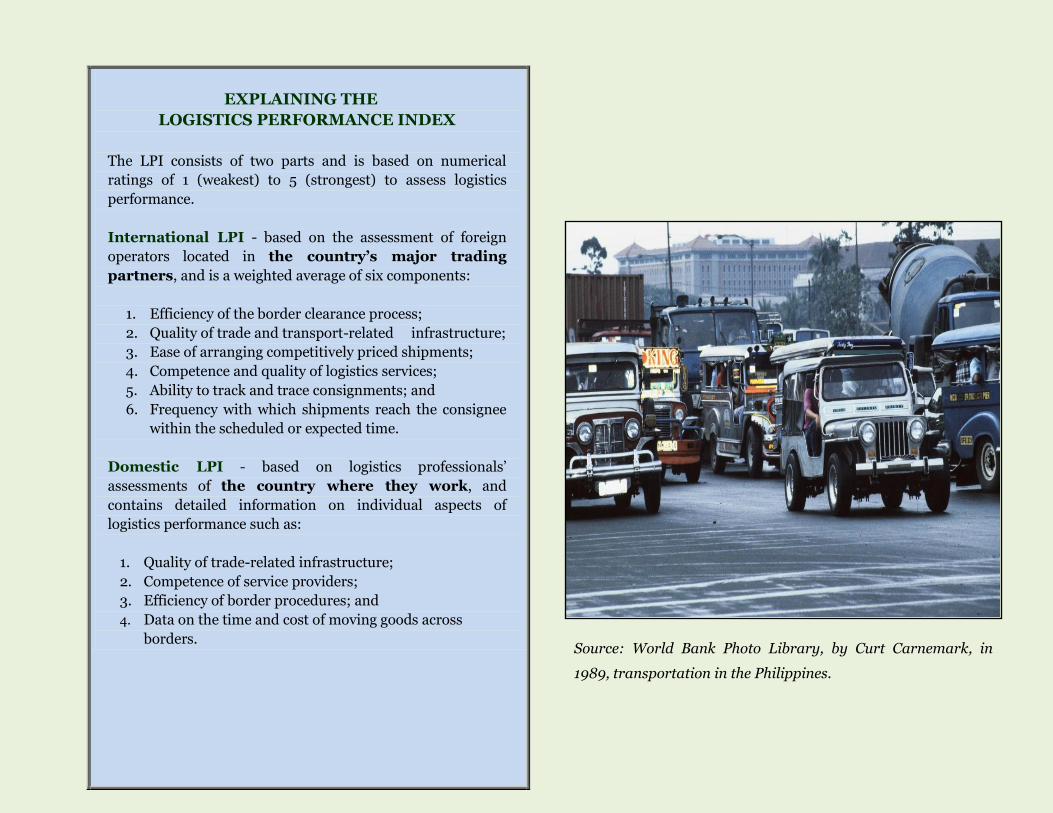
EXPLAINING THE
LOGISTICS PERFORMANCE INDEX
The LPI consists of two parts and is based on numerical
ratings of 1 (weakest) to 5 (strongest) to assess logistics
performance.
International LPI - based on the assessment of foreign
operators located in the country’s major trading
partners, and is a weighted average of six components:
1. Efficiency of the border clearance process;
2. Quality of trade and transport-related infrastructure;
3. Ease of arranging competitively priced shipments;
4. Competence and quality of logistics services;
5. Ability to track and trace consignments; and
6. Frequency with which shipments reach the consignee
within the scheduled or expected time.
Domestic LPI - based on logistics professionals’
assessments of the country where they work, and
contains detailed information on individual aspects of
logistics performance such as:
1. Quality of trade-related infrastructure;
2. Competence of service providers;
3. Efficiency of border procedures; and
4. Data on the time and cost of moving goods across
borders. Source: World Bank Photo Library, by Curt Carnemark, in
1989, transportation in the Philippines.
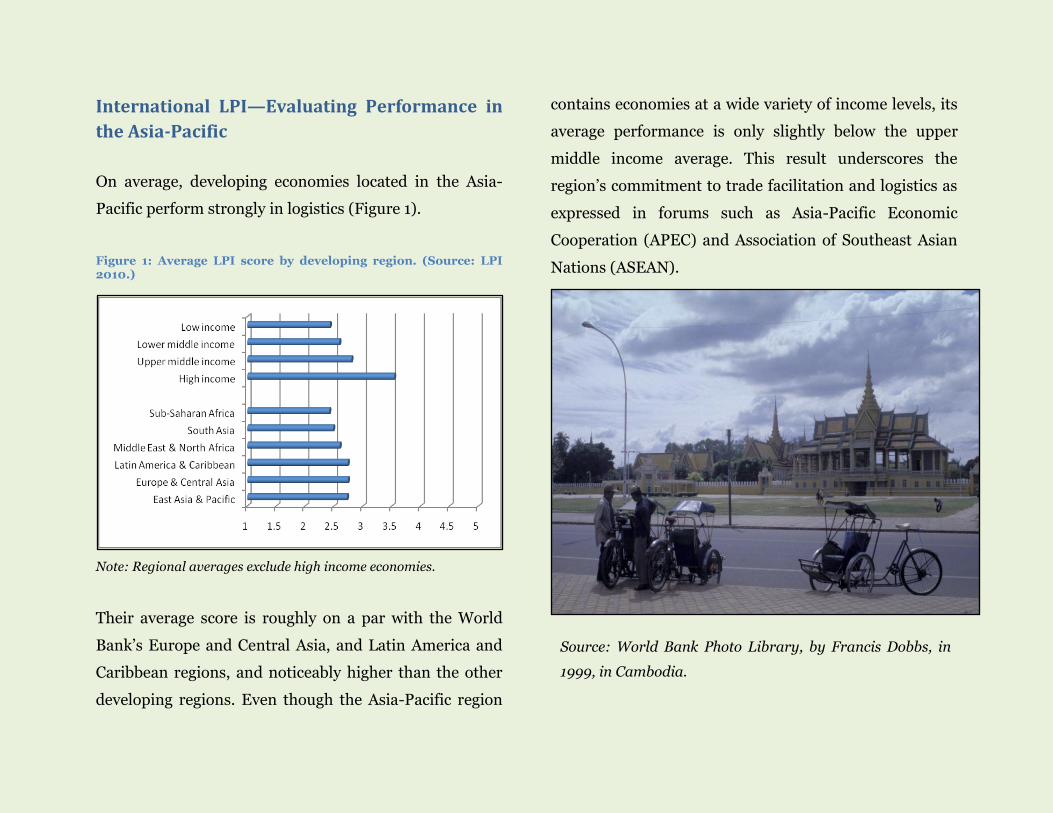
International LPI—Evaluating Performance in
the Asia-Pacific
On average, developing economies located in the Asia-
Pacific perform strongly in logistics (Figure 1).
Figure 1: Average LPI score by developing region. (Source: LPI 2010.)
Note: Regional averages exclude high income economies.
Their average score is roughly on a par with the World
Bank’s Europe and Central Asia, and Latin America and
Caribbean regions, and noticeably higher than the other
developing regions. Even though the Asia-Pacific region
contains economies at a wide variety of income levels, its
average performance is only slightly below the upper
middle income average. This result underscores the
region’s commitment to trade facilitation and logistics as
expressed in forums such as Asia-Pacific Economic
Cooperation (APEC) and Association of Southeast Asian
Nations (ASEAN).
Source: World Bank Photo Library, by Francis Dobbs, in
1999, in Cambodia.
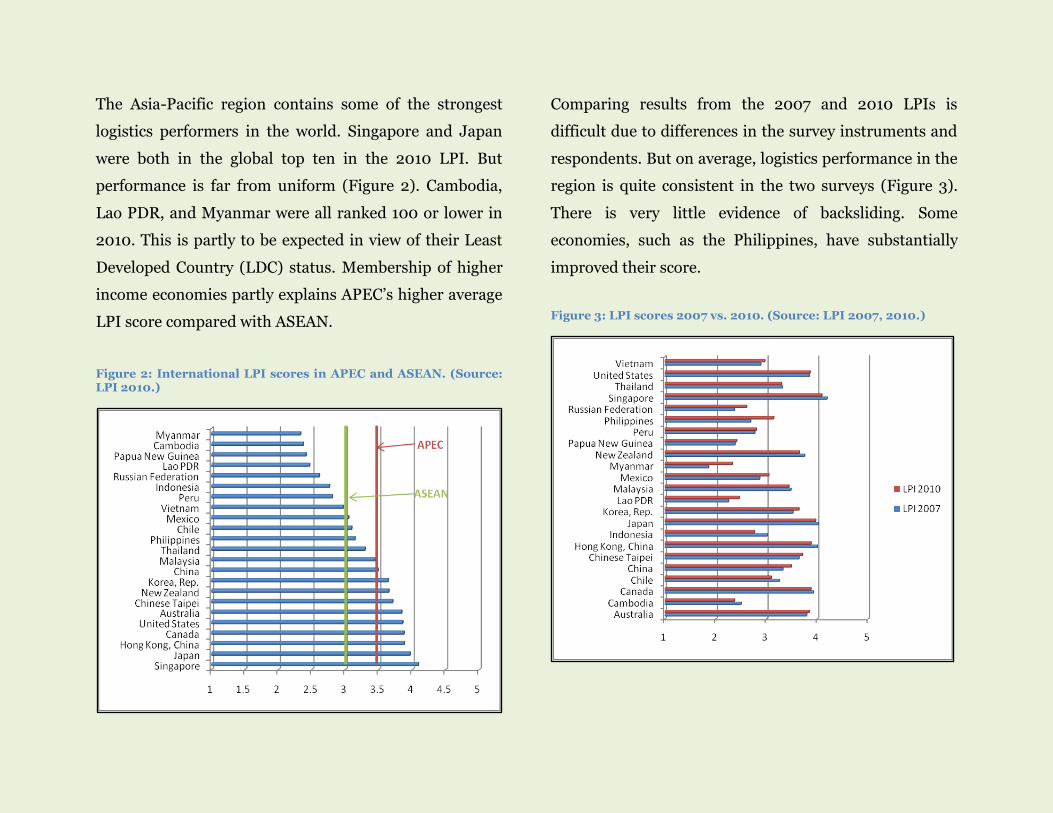
The Asia-Pacific region contains some of the strongest
logistics performers in the world. Singapore and Japan
were both in the global top ten in the 2010 LPI. But
performance is far from uniform (Figure 2). Cambodia,
Lao PDR, and Myanmar were all ranked 100 or lower in
2010. This is partly to be expected in view of their Least
Developed Country (LDC) status. Membership of higher
income economies partly explains APEC’s higher average
LPI score compared with ASEAN.
Figure 2: International LPI scores in APEC and ASEAN. (Source: LPI 2010.)
Comparing results from the 2007 and 2010 LPIs is
difficult due to differences in the survey instruments and
respondents. But on average, logistics performance in the
region is quite consistent in the two surveys (Figure 3).
There is very little evidence of backsliding. Some
economies, such as the Philippines, have substantially
improved their score.
Figure 3: LPI scores 2007 vs. 2010. (Source: LPI 2007, 2010.)
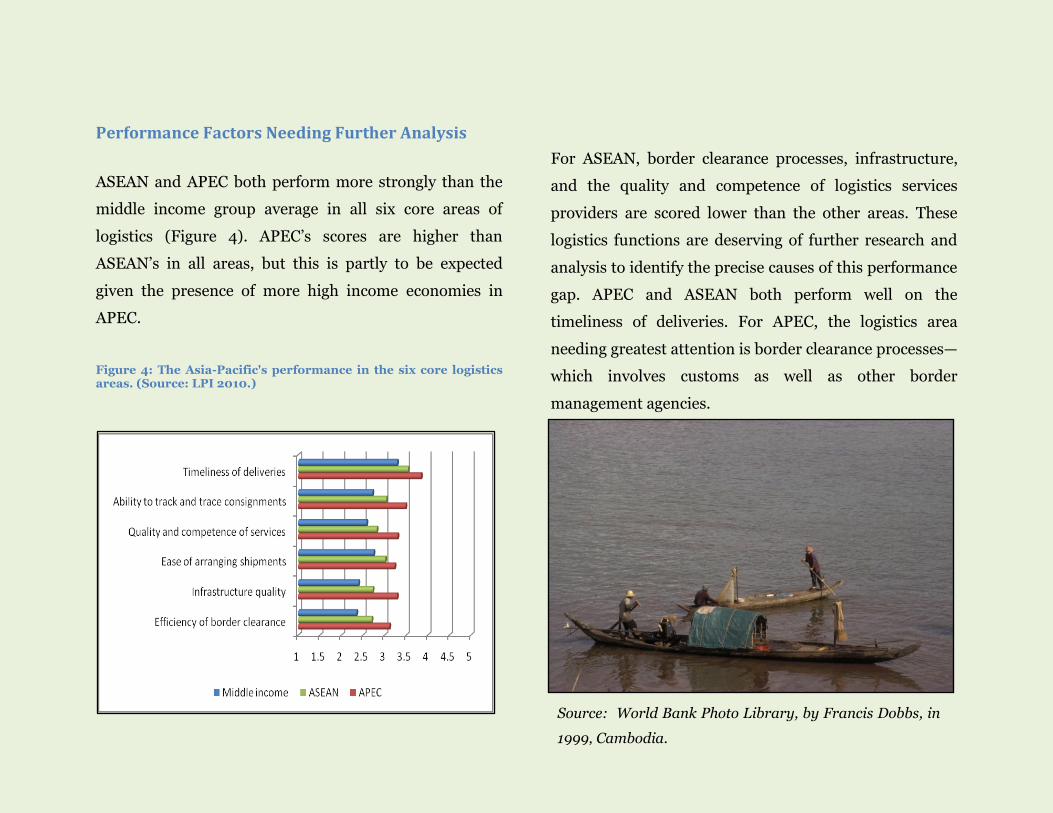
Performance Factors Needing Further Analysis
ASEAN and APEC both perform more strongly than the
middle income group average in all six core areas of
logistics (Figure 4). APEC’s scores are higher than
ASEAN’s in all areas, but this is partly to be expected
given the presence of more high income economies in
APEC.
Figure 4: The Asia-Pacific's performance in the six core logistics areas. (Source: LPI 2010.)
For ASEAN, border clearance processes, infrastructure,
and the quality and competence of logistics services
providers are scored lower than the other areas. These
logistics functions are deserving of further research and
analysis to identify the precise causes of this performance
gap. APEC and ASEAN both perform well on the
timeliness of deliveries. For APEC, the logistics area
needing greatest attention is border clearance processes—
which involves customs as well as other border
management agencies.
Source: World Bank Photo Library, by Francis Dobbs, in
1999, Cambodia.
Domestic LPI—Identifying Bottlenecks
The Domestic LPI provides further information on
specific elements of major supply chain bottlenecks, such
as time and cost, infrastructure, services, and border
management.
Positive Trends in Logistics Performance
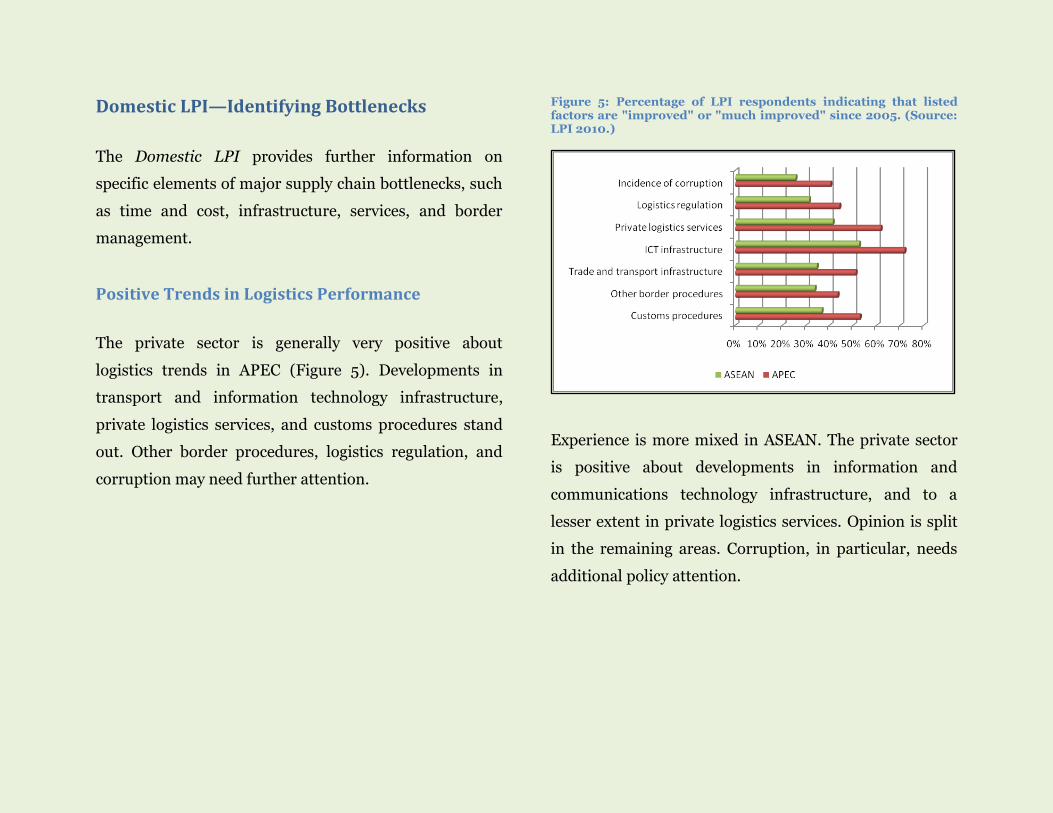
The private sector is generally very positive about
logistics trends in APEC (Figure 5). Developments in
transport and information technology infrastructure,
private logistics services, and customs procedures stand
out. Other border procedures, logistics regulation, and
corruption may need further attention.
Figure 5: Percentage of LPI respondents indicating that listed factors are "improved" or "much improved" since 2005. (Source: LPI 2010.)
Experience is more mixed in ASEAN. The private sector
is positive about developments in information and
communications technology infrastructure, and to a
lesser extent in private logistics services. Opinion is split
in the remaining areas. Corruption, in particular, needs
additional policy attention.
Time and Cost of Moving Goods
The time and cost of moving goods across borders is an
important outcome measure of logistics performance.
APEC and ASEAN both score very well on this metric
(Table 1). Despite the range of income levels in both
groups, their export times and costs compare favorably
with the high income average. The same can be said of
import times and costs in APEC.
Table 1: Export and import lead times and costs. (Source: LPI 2010.)
APEC ASEAN High income
Export Best lead time (days) 1.9 2.0 1.7
Median lead time (days) 2.8 2.8 2.7
Cost (US$) 849 651 980
Import Best lead time (days) 1.9 6.9 2.3
Median lead time (days) 2.9 8.3 3.3
Cost (US$) 884 858 1,024
Lead time is the transport time for export and imports from the
point of origin to the port of loading or equivalent, or to the buyer’s
warehouse.
A different picture emerges with respect to import costs
in ASEAN. First, there is a large gap between export and
import times and costs: the median import time is nearly
three times as long as the median export time, and the
cost is nearly one-third higher. ASEAN import lead times
are much longer than in APEC or the high income group.
Costs are lower, however.
ASEAN economies have some catching up to do with
respect to their APEC neighbors. The disparity between
export and import times suggests that border agencies’
clearance procedures might require further reform in
these economies.
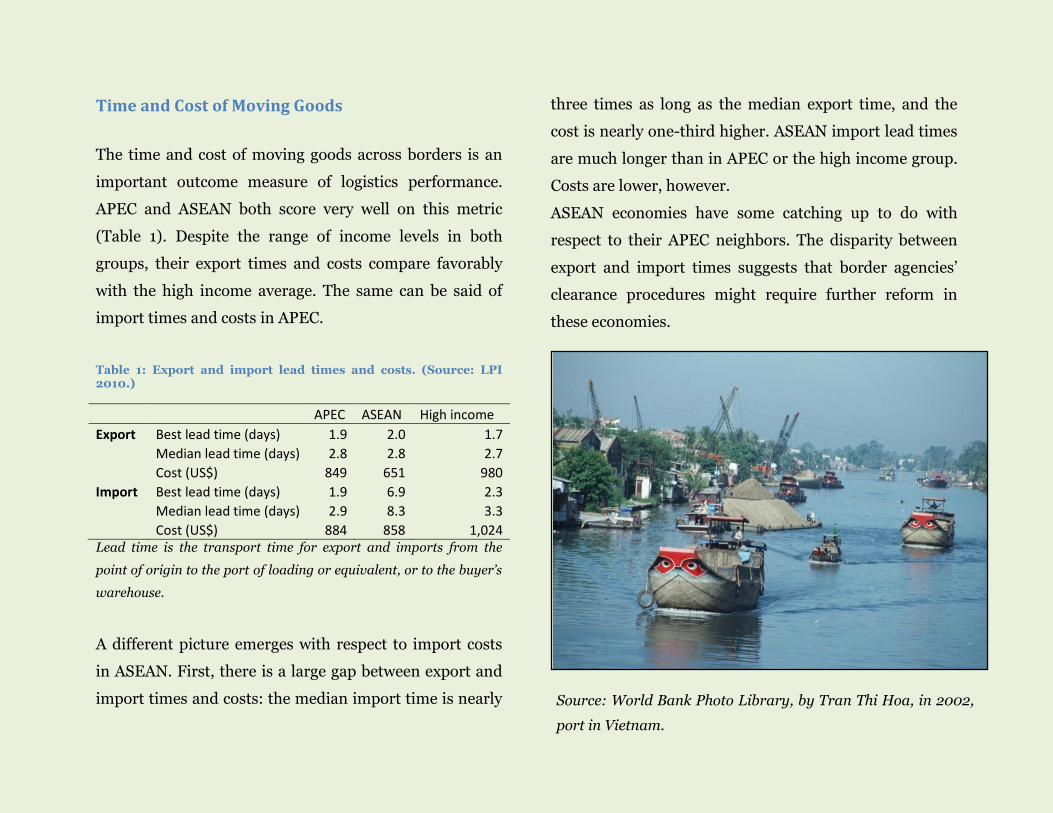
Source: World Bank Photo Library, by Tran Thi Hoa, in 2002,
port in Vietnam.
Reliability can be even more important than time
and cost for overall supply chain performance.
The gap between best and median lead times creates
some uncertainty for private sector operators, although it
is not at a severe level. Logistics professionals also
indicate that clearance does not always take place as
scheduled: in APEC, 70% of respondents feel that imports
are “often” or “nearly always” cleared on time, but in
ASEAN the same is true of only 47% of respondents.
Improving the consistency of clearance times could help
reduce inventory carrying costs, and make manufacturers
more competitive.
According to 2010 LPI respondents, around 25% of
ASEAN shipments and 20% of APEC shipments do not
meet their companies’ internal quality criteria. Although
approximately in line with the middle income group
average, these figures are less impressive than the general
level of performance in APEC and ASEAN. They are
below the high income benchmark of less than 15%.
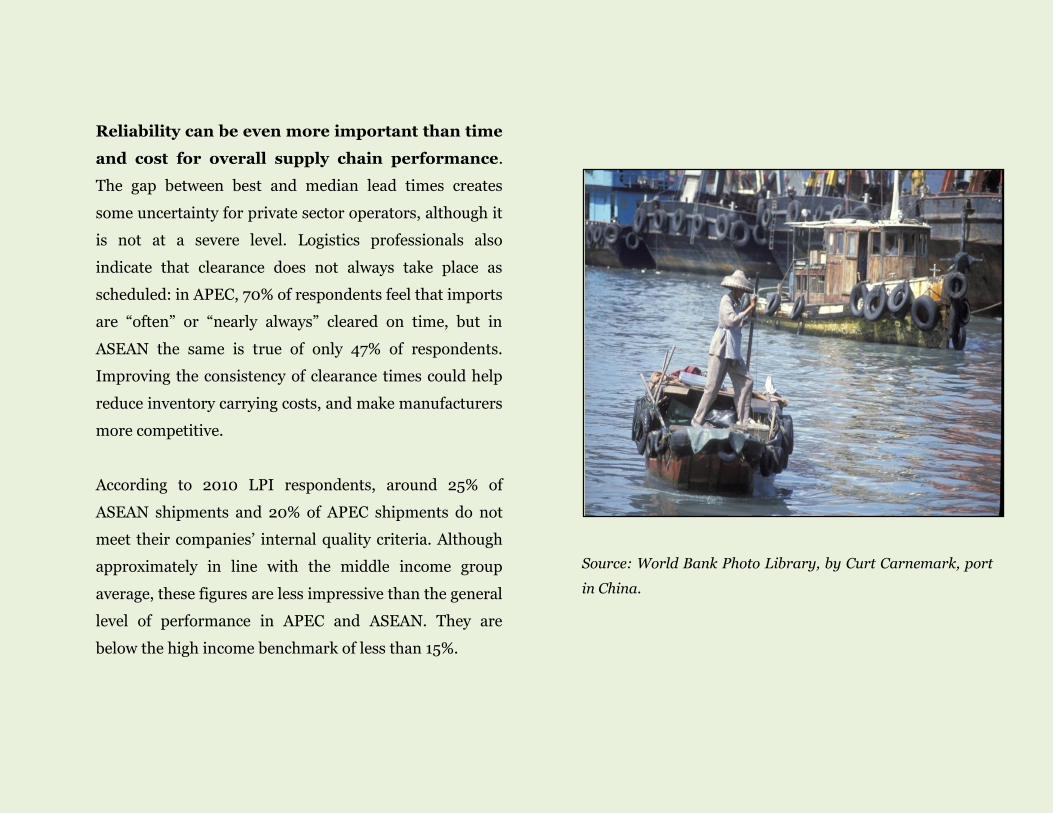
Source: World Bank Photo Library, by Curt Carnemark, port
in China.
Streamlining Border Management
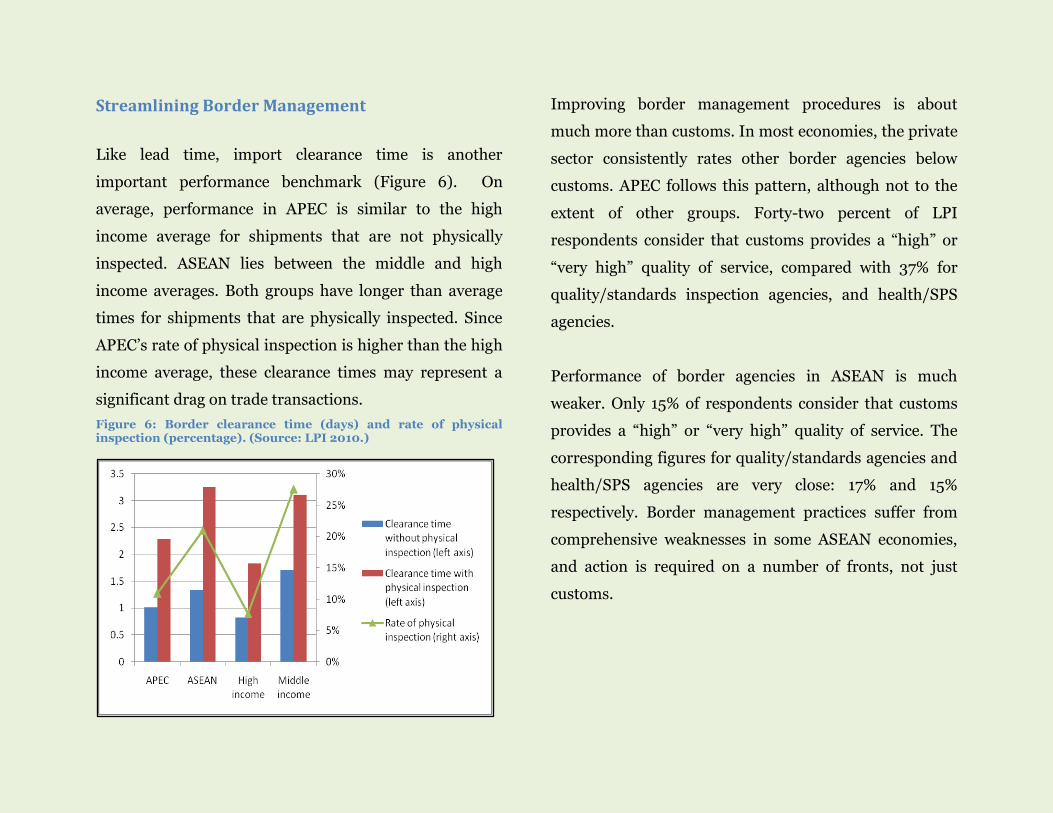
Like lead time, import clearance time is another
important performance benchmark (Figure 6). On
average, performance in APEC is similar to the high
income average for shipments that are not physically
inspected. ASEAN lies between the middle and high
income averages. Both groups have longer than average
times for shipments that are physically inspected. Since
APEC’s rate of physical inspection is higher than the high
income average, these clearance times may represent a
significant drag on trade transactions.
Figure 6: Border clearance time (days) and rate of physical inspection (percentage). (Source: LPI 2010.)
Improving border management procedures is about
much more than customs. In most economies, the private
sector consistently rates other border agencies below
customs. APEC follows this pattern, although not to the
extent of other groups. Forty-two percent of LPI
respondents consider that customs provides a “high” or
“very high” quality of service, compared with 37% for
quality/standards inspection agencies, and health/SPS
agencies.
Performance of border agencies in ASEAN is much
weaker. Only 15% of respondents consider that customs
provides a “high” or “very high” quality of service. The
corresponding figures for quality/standards agencies and
health/SPS agencies are very close: 17% and 15%
respectively. Border management practices suffer from
comprehensive weaknesses in some ASEAN economies,
and action is required on a number of fronts, not just
customs.
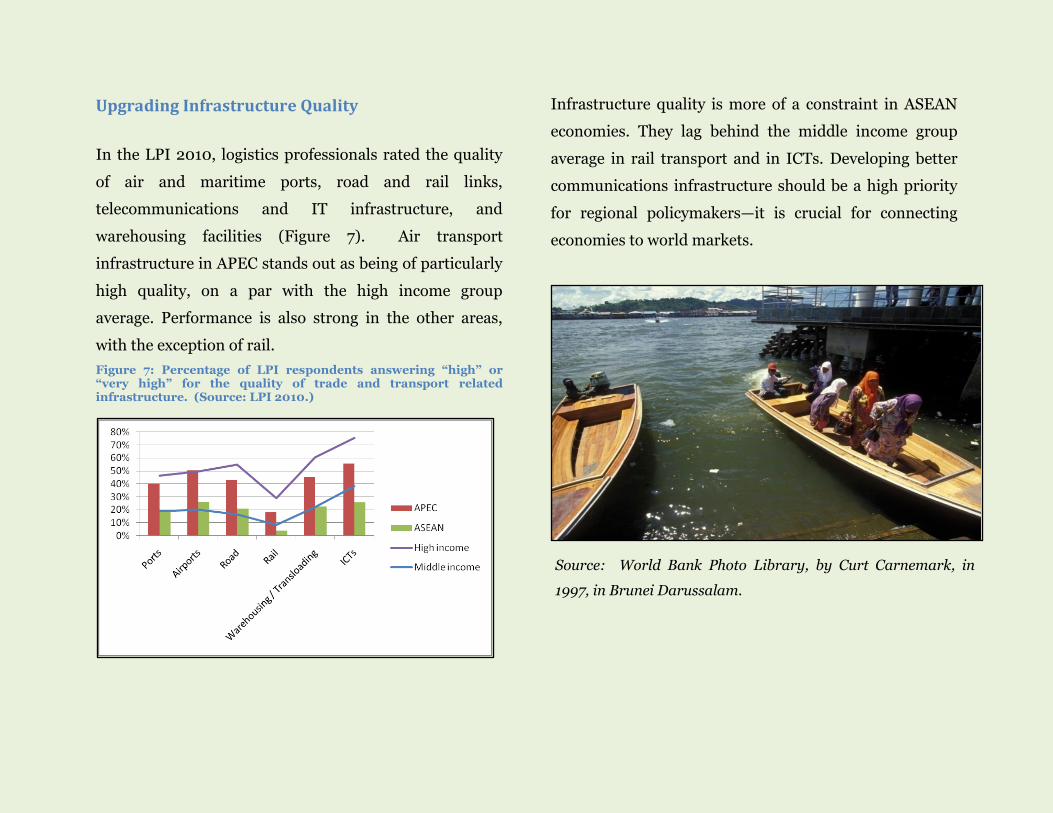
Upgrading Infrastructure Quality
In the LPI 2010, logistics professionals rated the quality
of air and maritime ports, road and rail links,
telecommunications and IT infrastructure, and
warehousing facilities (Figure 7). Air transport
infrastructure in APEC stands out as being of particularly
high quality, on a par with the high income group
average. Performance is also strong in the other areas,
with the exception of rail.
Figure 7: Percentage of LPI respondents answering “high” or “very high” for the quality of trade and transport related infrastructure. (Source: LPI 2010.)
Infrastructure quality is more of a constraint in ASEAN
economies. They lag behind the middle income group
average in rail transport and in ICTs. Developing better
communications infrastructure should be a high priority
for regional policymakers—it is crucial for connecting
economies to world markets.
Source: World Bank Photo Library, by Curt Carnemark, in
1997, in Brunei Darussalam.
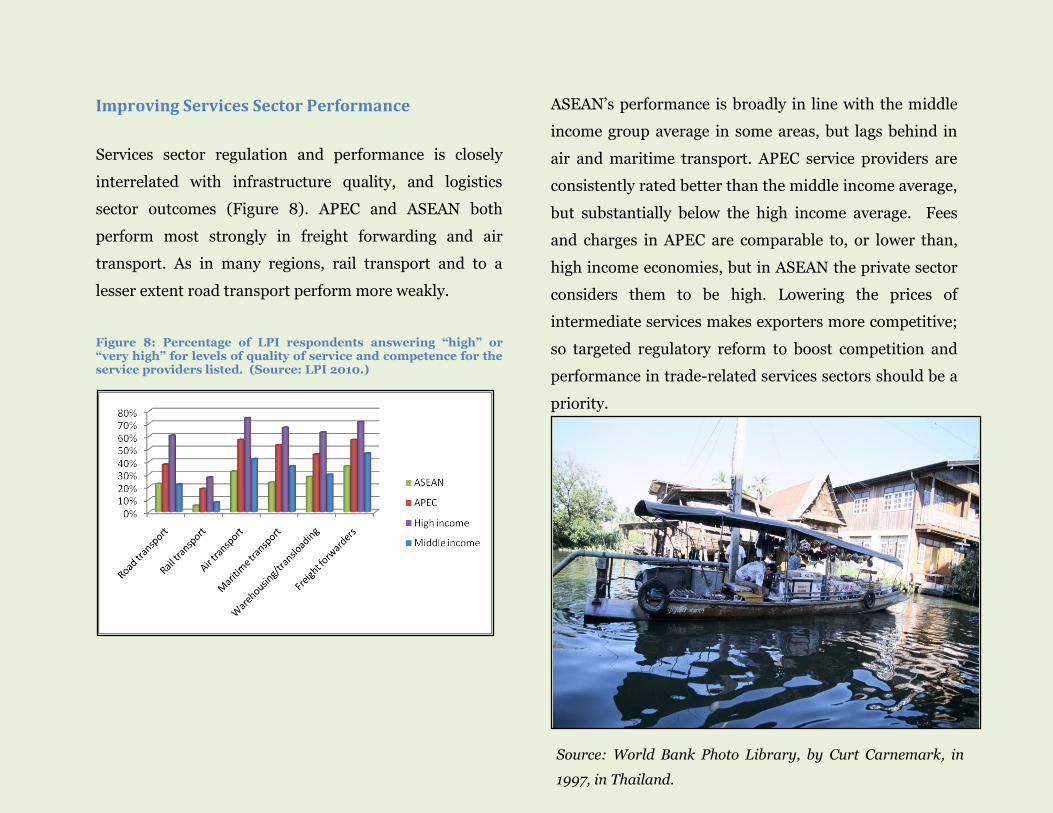
Improving Services Sector Performance
Services sector regulation and performance is closely
interrelated with infrastructure quality, and logistics
sector outcomes (Figure 8). APEC and ASEAN both
perform most strongly in freight forwarding and air
transport. As in many regions, rail transport and to a
lesser extent road transport perform more weakly.
Figure 8: Percentage of LPI respondents answering “high” or “very high” for levels of quality of service and competence for the service providers listed. (Source: LPI 2010.)
ASEAN’s performance is broadly in line with the middle
income group average in some areas, but lags behind in
air and maritime transport. APEC service providers are
consistently rated better than the middle income average,
but substantially below the high income average. Fees
and charges in APEC are comparable to, or lower than,
high income economies, but in ASEAN the private sector
considers them to be high. Lowering the prices of
intermediate services makes exporters more competitive;
so targeted regulatory reform to boost competition and
performance in trade-related services sectors should be a
priority.
Source: World Bank Photo Library, by Curt Carnemark, in
1997, in Thailand.
Addressing Logistics Bottlenecks
Moving forward on trade facilitation requires action on a
number of fronts. Regional forums such as APEC and
ASEAN are invaluable. APEC’s Shanghai and Busan goals
of 5% reductions in trade costs over five years have been
an important focal point for trade facilitation efforts in
the region. Trade facilitation and behind-the-border
barriers are also an important part of ASEAN economies’
efforts to complete their Single Market.
Broadening the trade facilitation agenda beyond customs
is key to moving forward. Border agencies need to work
together to improve the speed, reliability, and cost of
compliance with border procedures. Quality/standards
agencies, and health/SPS inspection agencies, both have
an important role to play.
Significant infrastructure investments are required in
some economies. For example, Indonesia will ultimately
need a new deep water port. In the meantime, congestion
at Jakarta’s Tanjung Priok terminal can be reduced by
expanding capacity, strengthening the national Single
Window, and re-examining work schedules.
Regional approaches can also be important, as in the case
of transport corridors. The Greater Mekong Subregion
and the ongoing ASEAN single window project are good
examples of constructive regional engagement. The
experience of world leaders like Singapore and Hong
Kong is valuable for the Asia-Pacific region as a whole.
APEC and ASEAN economies should continue and
expand their cooperative approaches on trade facilitation
with a view to disseminating best practice throughout the
region.
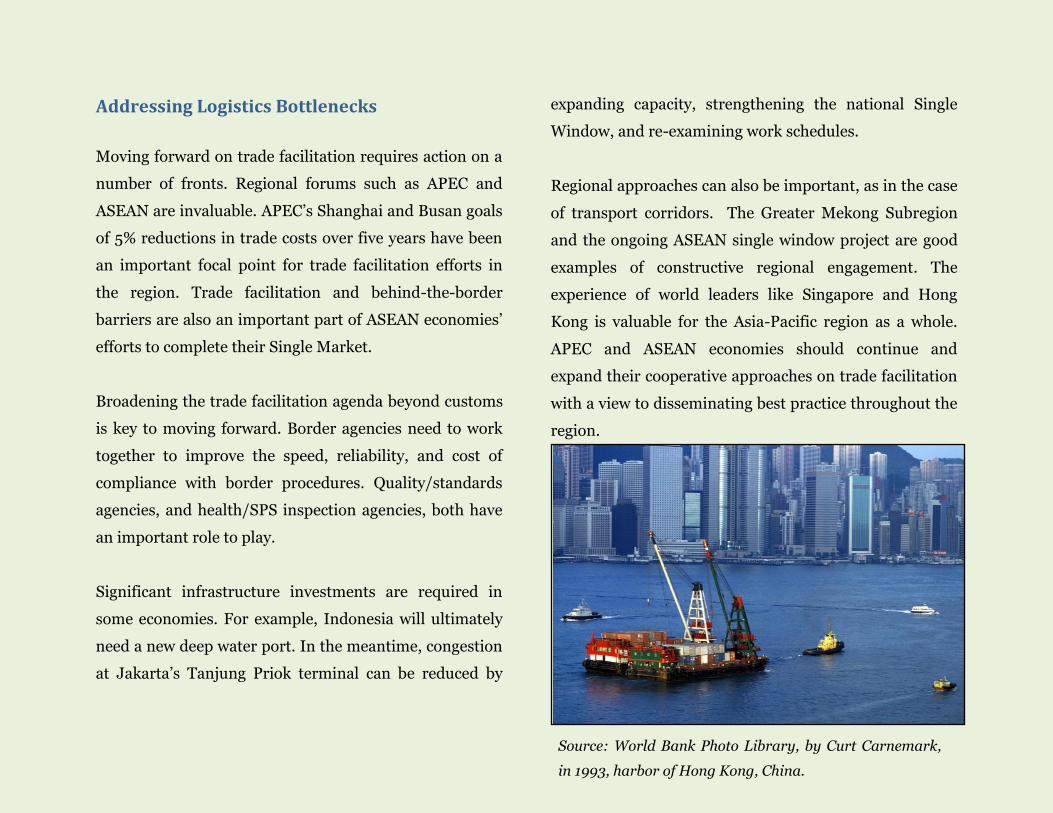
Source: World Bank Photo Library, by Curt Carnemark,
in 1993, harbor of Hong Kong, China.
Contact Us:
International Trade Department
Washington Office :
1818 H Street NW
Washington DC 20433 USA
E-mail:
Website:
www.worldbank.org/trade
www.worldbank.org/tradefacilitation
Download the complete report at www.worldbank.org/lpi
“Connecting to Compete 2007 helped spark dialogue in several countries among various stakeholders in
the government and between policymakers and the private sector about measures to address logistics
bottlenecks and facilitate international trade and transportation. The optimistic messages from
Connecting to Compete 2010 should encourage countries to do even more, particularly important for
countries whose trade logistics performance continues to be low.”
Otaviano Canuto Vice-President and Head of Network
Poverty Reduction and Economic Management
This booklet contains excerpts from the World Bank report “Connecting to Compete 2010: Trade Logistics in the Global Economy”
Download the complete report at www.worldbank.org/lpi