


Languages
Pages
Legal


Please refer to important disclosures at the end of this report 1
Quarterly highlights (Standalone) Y/E March (` cr) 2QFY13 2QFY12 % chg (yoy) 1QFY13 % chg (qoq)
Net Sales 3,296 3,115 5.8 3,007 9.6
EBITDA 334 331 0.9 241 38.8
EBITDA margin (%) 10.1 10.6 (50)bp 8.0 213bp
Adj. PAT 143 154 (7.5) 67 113.0
Source: Company, Angel Research
Ashok Leyland (AL) posted strong results for 2QFY2013 which were ahead of our estimates led by EBITDA margin expansion of 213bp on a sequential basis, higher other income (up 85.5% qoq) and lower tax-rate (8.5% vs 17.3% in 1QFY2013). We revise our volume estimates marginally downwards to account for the continued weakness in the medium and heavy commercial vehicle (MHCV) segment. However, we revise upwards our EBITDA margin estimates to factor in the strong performance during the quarter and also to account for management guidance of 10% EBITDA margin in 2HFY2013. We also lower our tax-rate to 15% for FY2013 from 18% earlier as guided by the management. We maintain our Buy rating on the stock.
Strong results for 2QFY2013: AL registered an in-line growth of 5.8% yoy (9.6% qoq) in net sales to `3,296cr driven by a 26.1% yoy (8.2% qoq) growth in volumes. While, Dost volumes sustained momentum (up 19.6% qoq); total volumes ex Dost posted a decline of 10.5% yoy (up 4.2% qoq) due to slowdown in industrial activity, increase in prices and lower freight availability. The net average realization improved 1.3% qoq despite higher discounts on MHCVs (higher by `20,000/vehicle to `80,000) led by better realization on the exports front due to favorable currency movement and strong spare parts sales. The EBITDA margin surged 213bp sequentially to 10.1%, ahead of our estimates of 9.3%, mainly due to a decline in employee costs (down 1.5% qoq) and other expenditure (down 3.6% qoq). The other expenditure was lower on account of forex gain of `12cr, and savings of `15cr and `10cr on ad spends and power costs respectively. Led by a strong operating performance, significantly higher other income and lower tax-rate, the net profit surged 113% qoq (down 7.5% yoy) to `143cr.
Outlook and valuation: While the near term outlook for the MHCV industry remains challenging due to slowdown in overall industrial activity; we expect volumes to recover in FY2014E led by likely easing of interest rates by 25-50bp in FY2013. At `26, AL is trading at 9x its FY2014E earnings. We maintain our Buy rating on the stock with a target price of `31.
Key financials (Standalone) Y/E March (` cr) FY2011 FY2012 FY2013E FY2014E
Net Sales 11,417 13,318 14,490 16,606
% chg 54.1 16.6 8.8 14.6
Net Profit 630 562 592 759
% chg 64.2 (10.8) 5.3 28.3
EBITDA (%) 10.6 9.4 9.5 9.6
EPS (`) 2.4 2.1 2.2 2.9
P/E (x) 10.9 12.2 11.6 9.0
P/BV (x) 2.6 2.4 2.2 1.9
RoE (%) 16.5 13.8 13.6 16.1
RoCE (%) 14.4 12.9 13.1 14.6
EV/Sales (x) 0.6 0.5 0.5 0.4
EV/EBITDA (x) 6.4 6.1 5.9 4.9 Source: Company, Angel Research
BUY CMP `26 Target Price `31
Investment Period 12 Months
Stock Info
Sector
Market Cap (` cr)
Net Debt (` cr)
Beta
52 Week High / Low
Avg. Daily Volume
Face Value (`)
BSE Sensex
Nifty
Reuters Code
Bloomberg Code
Shareholding Pattern (%)
Promoters 38.6
MF / Banks / Indian Fls 20.9
FII / NRIs / OCBs 29.2
Indian Public / Others 11.3
Abs. (%) 3m 1yr 3yr
Sensex 6.4 7.6 13.2
Ashok Leyland 12.0 (9.2) (2.7)
AL@IN
Automobile
1.0
18,684
5,686
ASOK.BO
6,838
1.0
33/20
836,492
3,494
Yaresh Kothari 022-3935 7800 Ext: 6844
Ashok Leyland Performance Highlights
2QFY2013 Result Update | Automobile
November 9, 2012

Ashok Leyland | 2QFY2013 Result Update
November 9, 2012
2
Exhibit 1: Quarterly financial performance (Standalone) Y/E March (` cr) 2QFY13 2QFY12 % chg (yoy) 1QFY13 % chg (qoq) 1HFY13 1HFY12 % chg (yoy)
Net Sales 3,296 3,115 5.8 3,007 9.6 6,303 5,628 12.0
Consumption of RM 2,097 2,200 (4.7) 1,935 8.3 4,032 3,936 2.4
(% of sales) 63.6 70.6 64.4 64.0 69.9 Staff costs 264 252 4.9 268 (1.5) 532 501 6.1
(% of sales) 8.0 8.1 8.9 8.4 8.9 Purchase of traded goods 303 92 227.2 253 19.5 556 168 231.6
(% of sales) 9.2 3.0 8.4 8.8 3.0 Other expenses 299 240 24.7 310 (3.6) 609 446 36.4
(% of sales) 9.1 7.7 10.3 9.7 7.9 Total Expenditure 2,962 2,784 6.4 2,767 7.1 5,729 5,052 13.4
Operating Profit 334 331 0.9 241 38.8 575 576 (0.2)
OPM (%) 10.1 10.6 8.0 9.1 10.2 Interest 104 66 57.4 83 24.3 187 123 52.7
Depreciation 98 86 14.5 89 10.3 188 171 10.0
Other income 24 13 77.3 13 85.5 37 21 75.7
PBT (excl. Extr. Items) 156 193 (19.2) 81 92.6 237 304 (22.0)
Extr. income/(expense) - - - - - - - -
PBT (incl. Extr. Items) 156 193 (19.2) 81 92.6 237 304 (22.0)
(% of sales) 4.7 6.2 2.7 3.8 5.4 Provision for taxation 13 39 (65.7) 14 (4.9) 27 63 (56.8)
(% of PBT) 8.5 20.1 17.3 11.5 20.8 Reported PAT 143 154 (7.5) 67 113.0 210 240 (12.8)
Adj PAT 143 154 (7.5) 67 113.0 210 240 (12.8)
Adj. PATM 4.3 4.9 2.2 3.3 4.3 Equity capital (cr) 266 266 266 266 266 Reported EPS (`) 0.5 0.6 (7.5) 0.3 113.0 0.8 0.9 (12.8)
Source: Company, Angel Research
Exhibit 2: 2QFY2013 – Actual vs Angel estimates Y/E March (` cr) Actual Estimates Variation (%)
Net Sales 3,296 3,326 (0.9)
EBITDA 334 310 7.6
EBITDA margin (%) 10.1 9.3 80bp
Adj. PAT 143 117 22.2
Source: Company, Angel Research
Exhibit 3: Quarterly volume performance (units) 2QFY13 2QFY12 % chg (yoy) 1QFY13 % chg (qoq) 1HFY13 1HFY12 % chg (yoy)
MHCV passenger 5,348 6,123 (12.7) 6,604 (19.0) 11,952 11,451 4.4
MHCV goods 15,625 17,258 (9.5) 13,295 17.5 28,920 31,013 (6.7)
LCV (ex. Dost) 201 278 (27.7) 431 (53.4) 632 472 33.9
Total volume (ex. Dost) 21,174 23,659 (10.5) 20,330 4.2 41,504 42,936 (3.3)
Dost 8,666 - - 7,248 19.6 15,914 - -
Total volume (incl. Dost) 29,840 23,659 26.1 27,578 8.2 57,418 42,936 33.7
Exports (inc. above ) 2,083 3,230 (35.5) 3,003 (30.6) 5,086 5,769 (11.8)
Source: Company, Angel Research
Ashok Leyland | 2QFY2013 Result Update
November 9, 2012
3
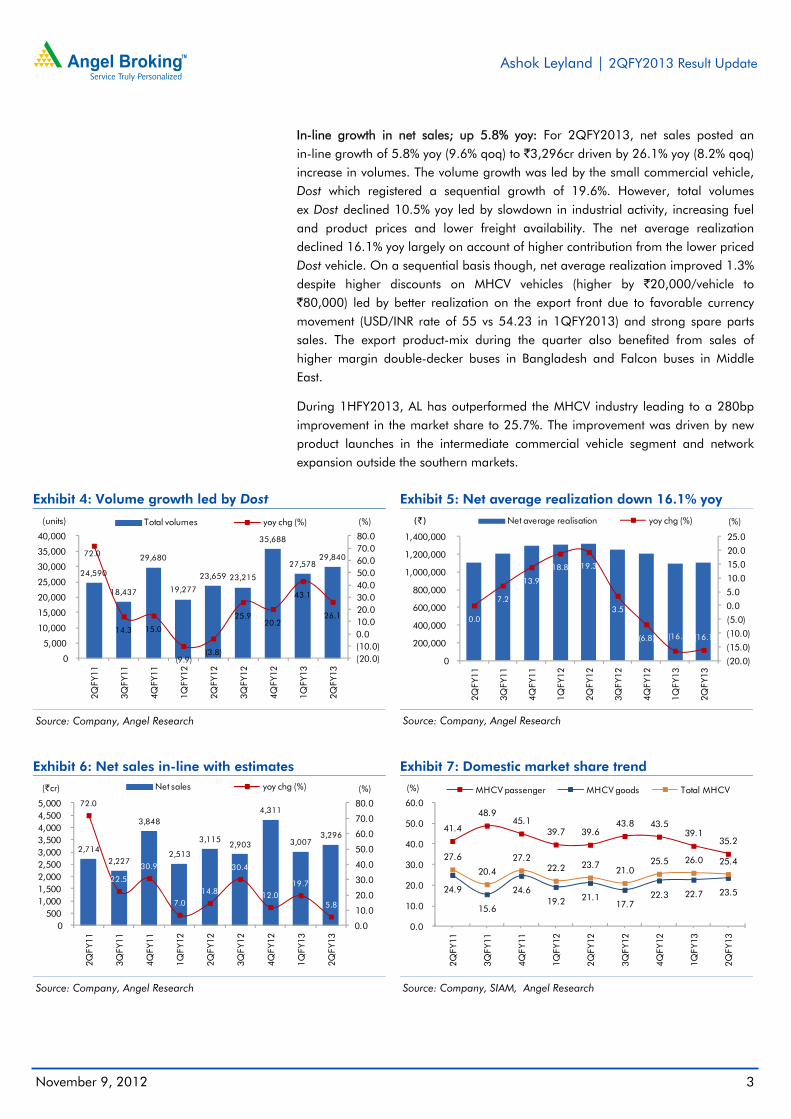
In-line growth in net sales; up 5.8% yoy: For 2QFY2013, net sales posted an in-line growth of 5.8% yoy (9.6% qoq) to `3,296cr driven by 26.1% yoy (8.2% qoq) increase in volumes. The volume growth was led by the small commercial vehicle, Dost which registered a sequential growth of 19.6%. However, total volumes ex Dost declined 10.5% yoy led by slowdown in industrial activity, increasing fuel and product prices and lower freight availability. The net average realization declined 16.1% yoy largely on account of higher contribution from the lower priced Dost vehicle. On a sequential basis though, net average realization improved 1.3% despite higher discounts on MHCV vehicles (higher by `20,000/vehicle to `80,000) led by better realization on the export front due to favorable currency movement (USD/INR rate of 55 vs 54.23 in 1QFY2013) and strong spare parts sales. The export product-mix during the quarter also benefited from sales of higher margin double-decker buses in Bangladesh and Falcon buses in Middle East.
During 1HFY2013, AL has outperformed the MHCV industry leading to a 280bp improvement in the market share to 25.7%. The improvement was driven by new product launches in the intermediate commercial vehicle segment and network expansion outside the southern markets.
Exhibit 4: Volume growth led by Dost
Source: Company, Angel Research
Exhibit 5: Net average realization down 16.1% yoy
Source: Company, Angel Research
Exhibit 6: Net sales in-line with estimates
Source: Company, Angel Research
Exhibit 7: Domestic market share trend
Source: Company, SIAM, Angel Research
24,590
18,437
29,680
19,277
23,659 23,215
35,688
27,578 29,840 72.0
14.3 15.0
(9.9)(3.8)
25.9 20.2
43.1
26.1
(20.0)(10.0)0.0 10.0 20.0 30.0 40.0 50.0 60.0 70.0 80.0
0
5,000
10,000
15,000
20,000
25,000
30,000
35,000
40,000
2QFY
11
3QFY
11
4QFY
11
1QFY
12
2QFY
12
3QFY
12
4QFY
12
1QFY
13
2QFY
13
(%)(units) Total volumes yoy chg (%)
0.0
7.2
13.9
18.8 19.3
3.5
(6.8) (16.3) (16.1)
(20.0)
(15.0)
(10.0)
(5.0)
0.0
5.0
10.0
15.0
20.0
25.0
0
200,000
400,000
600,000
800,000
1,000,000
1,200,000
1,400,000
2QFY
11
3QFY
11
4QFY
11
1QFY
12
2QFY
12
3QFY
12
4QFY
12
1QFY
13
2QFY
13
(%)(`) Net average realisation yoy chg (%)
2,714 2,227
3,848
2,513
3,115 2,903
4,311
3,007 3,296
72.0
22.5
30.9
7.0 14.8
30.4
12.0 19.7
5.8
0.0
10.0
20.0
30.0
40.0
50.0
60.0
70.0
80.0
0 500
1,000 1,500 2,000 2,500 3,000 3,500 4,000 4,500 5,000
2QFY
11
3QFY
11
4QFY
11
1QFY
12
2QFY
12
3QFY
12
4QFY
12
1QFY
13
2QFY
13
(%)(`cr) Net sales yoy chg (%)
41.4
48.945.1
39.7 39.643.8 43.5
39.135.2
24.9
15.6
24.619.2 21.1
17.722.3 22.7 23.5
27.6
20.4
27.222.2 23.7
21.025.5 26.0 25.4
0.0
10.0
20.0
30.0
40.0
50.0
60.0
2QFY
11
3QFY
11
4QFY
11
1QFY
12
2QFY
12
3QFY
12
4QFY
12
1QFY
13
2QFY
13
(%) MHCV passenger MHCV goods Total MHCV

Ashok Leyland | 2QFY2013 Result Update
November 9, 2012
4
EBITDA margin ahead of estimates at 10.1%: On the operating front, EBITDA margins surged 213bp qoq to 10.1%, ahead of our estimates of 9.3%, mainly due to reduction in employee cost (down 1.5% qoq) and other expenditure (down 3.6% qoq). The other expenditure was lower on account of forex gain of `12cr, and on savings of `15cr and `10cr on ad spends and power costs respectively. As a result, operating profit grew 38.8% qoq to `334cr. On a yoy basis, the EBITDA margin witnessed a decline of 50bp as benefits of lower raw-material expenses as a percentage of sales were negated by a sharp 140bp increase in other expenditure as a percentage of sales. The other expenditure was higher largely due to higher advertising and brand building spends.
Exhibit 8: EBITDA margin surprises positively
Source: Company, Angel Research
Exhibit 9: Net profit up 113% qoq
Source: Company, Angel Research
Net profit up 113% qoq: Led by a strong operating performance, significantly higher other income and lower tax-rate, the net profit surged 113% qoq (down 7.5% yoy) to `143cr. While other income was up 77.3% yoy and 85.5% qoq to `24cr, the tax-rate stood at 8.5% as against 20.1% in 2QFY2012 and 17.3% in 1QFY2013 due to MAT credit of `44.3cr. The interest expense for the quarter increased 57.4% yoy (24.3% qoq) on account of increase in debt levels and also due to higher working capital requirement.
11.3 7.5
13.2 9.7 10.6 7.2 10.9 8.0 10.1
73.6 73.2 72.8 72.9 74.7 75.9 75.8 74.4 74.5
0.0
10.0
20.0
30.0
40.0
50.0
60.0
70.0
80.0
2QFY
11
3QFY
11
4QFY
11
1QFY
12
2QFY
12
3QFY
12
4QFY
12
1QFY
13
2QFY
13(%) EBITDA margin Raw material cost/sales
167 43 298 86 154 67 259 67 143
6.2
1.9
7.7
3.5
5.0
2.3
6.0
2.2
4.3
0.0
1.0
2.0
3.0
4.0
5.0
6.0
7.0
8.0
9.0
0
50
100
150
200
250
300
350
2QFY
11
3QFY
11
4QFY
11
1QFY
12
2QFY
12
3QFY
12
4QFY
12
1QFY
13
2QFY
13
(%)(` cr) Net profit Net profit margin

Ashok Leyland | 2QFY2013 Result Update
November 9, 2012
5
Conference call – Key highlights
The management expects the MHCV industry to post a decline of 5-10% (flat growth earlier) in FY2013; however it is hopeful of a revival in 4QFY2013. The company expects to post flat volumes ex Dost in FY2013. It is targeting a market share of 26% by the end of FY2013. The management sees Dost volumes of around ~36,000 units in FY2013.
AL indicated that the operator profitability has improved post the diesel price hike as freight rates have gone up by over 10%.
According to the management, the contribution of southern India in overall commercial vehicle industry has come down to 22-23% in 2QFY2013 compared to 25-26% earlier.
The company’s exports declined 12% in 1HFY2013 due to decline in demand in key markets of Bangladesh and Sri Lanka (accounting for 60-65% of total exports).
Spare parts revenue during 2QFY2013 and 1HFY2013 stood at ~`260cr (37% yoy growth) and ~`500cr (27% yoy growth) respectively. Engine volumes jumped 26.0% yoy to 4,400 units and revenues came in at `71cr. The defense kit order book currently stands ~3,000 units.
Production at the Pantnagar plant stood at 15,000 units in 1HFY2013. AL expects to produce 40,000 units in FY2013. The income tax benefit at the Pantnagar plant will expire in FY2015 and thereafter the company will get 30% tax benefit; however excise benefits expire by 2020. Post the recent excise duty hike and increase in localization at the plant, benefits have increased to `60,000/vehicle, up from `45,000/vehicle.
The company has increased its capital expenditure guidance to `600cr for FY2013E from `450cr announced in 1QFY2013.

Ashok Leyland | 2QFY2013 Result Update
November 9, 2012
6
Investment arguments
Volume growth to benefit from easing of interest rates and recently launched Dost: MHCV demand has witnessed a slowdown in recent times due to high interest rates and slowdown in industrial activity; however, we believe MHCV demand is near its trough. With reversal in interest rates (25-50bp cut in FY2013), we expect a pick-up in industrial activity, leading to a rebound in MHCV sales in FY2014. Further, the recently introduced LCV - Dost (through JV with Nissan) has been received well by the markets and AL expects to ramp-up its production.
EBITDA margin pressures to persist due to change in product-mix: While raw-material prices have stabilized and AL continues to benefit from the ramp-up in production at the Pantnagar facility (total profitability estimated to be higher due to cost savings of ~`60,000/vehicle), the product-mix is set to change due to increasing proportion of the lower margin LCV - Dost (contribution to total volumes to increase from ~7% in FY2012 to ~28% in FY2013E). AL has indicated that it earns marketing/distribution fees of `15,000-`18,000/vehicle on Dost sales.
Outlook and valuation
We revise our volume estimates marginally downwards to account for the continued weakness in the MHCV segment. However, we revise upwards our EBITDA margin estimates to factor in the strong performance during the quarter and also to account for management guidance of 10% EBITDA margin in 2HFY2013. We also lower our tax-rate to 15% in FY2013 from 18% earlier as guided by the management.
Exhibit 10: Change in estimates Y/E March Earlier Estimates Revised Estimates % chg
FY2013E FY2014E FY2013E FY2014E FY2013E FY2014E
Net Sales (` cr) 14,920 16,850 14,490 16,606 (2.9) (1.5)
OPM (%) 9.0 9.3 9.5 9.6 50bp 30bp
EPS (`) 2.2 2.7 2.2 2.9 2.1 3.8
Source: Company, Angel Research
While the near term outlook for the MHCV industry remains challenging due to slowdown in overall industrial activity; we expect volumes to recover in FY2014 led by likely easing of interest rates by 25-50bp in FY2013. Further, the recently launched Dost continues to drive the overall volume growth of the company. We believe that the momentum in Dost volumes will continue going ahead and will account for ~30% (~7% in FY2012) of AL’s overall volumes by FY2014E.
At `26, AL is trading at an attractive level of 9x its FY2014E earnings. We maintain our Buy rating on the stock with a target price of `31, valuing the stock at 11x its FY2014E earnings.

Ashok Leyland | 2QFY2013 Result Update
November 9, 2012
7
Exhibit 11: Key assumptions
(units) FY2009 FY2010 FY2011 FY2012 FY2013E FY2014E
MHCV passenger 19,981 18,481 25,226 25,845 28,430 31,272
MHCV goods 33,071 44,345 68,007 67,408 64,038 69,161
LCV (ex. Dost) 1,379 1,100 873 1,172 1,465 1,612
Dost - - - 7,593 36,000 45,000
Total volume (units) 54,431 63,926 94,106 102,018 129,932 147,045
% yoy chg (34.7) 17.4 47.2 8.4 27.4 13.2
Domestic 47,619 57,947 83,800 89,109 116,939 130,134
Exports 6,812 5,979 10,306 12,909 12,993 16,910
Source: Company, Angel Research
Exhibit 12: Angel vs consensus forecast
Angel estimates Consensus Variation (%)
FY13E FY14E FY13E FY14E FY13E FY14E
Total op. income (` cr) 14,490 16,606 14,060 16,062 3.1 3.4
EPS (`) 2.2 2.9 2.1 2.7 8.4 5.7
Source: Bloomberg, Angel Research
Exhibit 13: One-year forward P/E band
Source: Company, Angel Research
Exhibit 14: One-year forward P/E chart
Source: Company, Angel Research
Exhibit 15: One-year forward EV/EBITDA band
Source: Company, Angel Research
Exhibit 16: One-year forward EV/EBITDA chart
Source: Company, Angel Research
0
5
10
15
20
25
30
35
40
45
Apr
-03
Mar
-04
Mar
-05
Feb-
06
Jan-
07
Jan-
08
Dec
-08
Dec
-09
Nov
-10
Nov
-11
Oct
-12
(`) Share Price (`) 6x 9x 12x 15x
0
5
10
15
20
25
30
35
Aug
-05
Mar
-06
Nov
-06
Jul-0
7
Mar
-08
Nov
-08
Jul-0
9
Mar
-10
Nov
-10
Jul-1
1
Feb-
12
Oct
-12
(x) One-yr forward P/E Five-yr average P/E
0
2,000
4,000
6,000
8,000
10,000
12,000
14,000
Apr
-03
Jan-
04
Nov
-04
Aug
-05
Jun-
06
Mar
-07
Jan-
08
Oct
-08
Aug
-09
Jun-
10
Mar
-11
Jan-
12
Oct
-12
(` cr) EV (` cr) 2x 4x 6x 8x
0.0 1.0 2.0 3.0 4.0 5.0 6.0 7.0 8.0 9.0
10.0
Aug
-05
Feb-
06
Sep-
06
Mar
-07
Oct
-07
May
-08
Nov
-08
Jun-
09
Jan-
10
Jul-1
0
Feb-
11
Sep-
11
Mar
-12
Oct
-12
(x) One-yr forward EV/EBITDA Five-yr average EV/EBITDA

Ashok Leyland | 2QFY2013 Result Update
November 9, 2012
8
Exhibit 17: Automobile - Recommendation summary
Company Reco. CMP (`)
Tgt. price (`)
Upside (%)
P/E (x) EV/EBITDA (x) RoE (%) FY12-14E EPS
FY13E FY14E FY13E FY14E FY13E FY14E CAGR (%)
Ashok Leyland Buy 26 31 22.1 11.6 9.0 5.9 4.9 13.6 16.1 16.2
Bajaj Auto Neutral 1,852 - - 17.0 15.1 11.7 10.0 46.2 41.6 7.3
Hero MotoCorp Neutral 1,908 - - 16.1 14.6 8.4 7.0 48.3 41.9 9.7
Maruti Suzuki Neutral 1,465 - - 22.2 15.5 11.5 7.7 11.9 15.1 36.6 Mahindra & Mahindra Accumulate 910 986 8.3 16.6 14.5 9.7 8.0 24.3 23.4 15.9
Tata Motors Accumulate 281 319 13.8 7.6 6.3 4.0 3.3 31.2 28.9 11.1
TVS Motor Buy 38 45 17.0 8.0 6.8 3.4 2.7 18.2 18.7 3.5
Source: Company, Angel Research
Company background
Ashok Leyland (AL) is the country's second largest CV manufacturer. The company has a strong presence in the MHCV segment, with a domestic market share of ~23% as of FY2012. AL enjoys a dominant position in southern India, with a ~48% market share, and is currently focusing on expanding its presence in northern India by increasing its touch points in the region. The company, through its JV with Nissan Motor and John Deere, intends to expand its product portfolio and has recently launched new vehicles Dost (to tap the growing LCV demand) and Backhoe Loader (construction equipment segment), respectively.

Ashok Leyland | 2QFY2013 Result Update
November 9, 2012
9
Profit and loss statement (Standalone)
Y/E March (` cr) FY2009 FY2010 FY2011 FY2012 FY2013E FY2014E
Total operating income 6,098 7,407 11,417 13,318 14,490 16,606
% chg (23.1) 21.5 54.1 16.6 8.8 14.6
Total expenditure 5,642 6,648 10,203 12,062 13,113 15,005
Net raw material costs 4,480 5,212 8,175 9,464 10,288 11,790
Other mfg costs 132 135 235 275 326 365
Employee expenses 563 667 975 1,036 1,145 1,312
Other 467 634 819 1,286 1,355 1,538
EBITDA 456 760 1,214 1,256 1,377 1,601
% chg (43.5) 66.6 59.8 3.5 9.6 16.3
(% of total op. income) 7.5 10.3 10.6 9.4 9.5 9.6
Depreciation & amortization 178 204 267 353 382 409
EBIT 278 555 946 903 995 1,192
% chg (56.0) 100.1 70.4 (4.5) 10.1 19.8
(% of total op. income) 4.6 7.5 8.3 6.8 6.9 7.2
Interest and other charges 160 102 189 255 347 318
Other income 91 91 44 42 49 53
(% of PBT) 46.3 18.1 5.6 6.1 7.0 5.7
Recurring PBT 208 545 802 690 696 926
% chg (67.3) 161.3 47.2 (13.9) 0.9 33.0
Extraordinary income/(exp.) 11 40 2 4 - -
PBT 197 505 800 686 696 926
Tax 18 121 171 124 104 167
(% of PBT) 9.4 24.0 21.3 18.1 15.0 18.0
PAT (reported) 190 424 631 566 592 759
ADJ. PAT 179 384 630 562 592 759
% chg (60.3) 114.6 64.2 (10.8) 5.3 28.3
(% of total op. income) 2.9 5.2 5.5 4.2 4.1 4.6
Basic EPS (`) 0.7 1.6 2.4 2.1 2.2 2.9
Adj. EPS (`) 0.7 1.4 2.4 2.1 2.2 2.9
% chg (60.3) 114.6 64.2 (10.8) 5.3 28.3

Ashok Leyland | 2QFY2013 Result Update
November 9, 2012
10
Balance sheet statement (Standalone)
Y/E March (` cr) FY2009 FY2010 FY2011 FY2012 FY2013E FY2014E
SOURCES OF FUNDS
Equity share capital 133 133 133 266 266 266
Reserves & surplus 3,341 3,536 3,830 3,942 4,224 4,674
Shareholders’ Funds 3,474 3,669 3,963 4,208 4,491 4,940
Total loans 1,958 2,280 2,348 2,395 2,895 2,895
Deferred tax liability 263 385 444 490 490 490
Other long term liabilities - - - 4 4 4
Long term provisions - - 78 77 77 77
Total Liabilities 5,695 6,334 6,833 7,174 7,956 8,406
APPLICATION OF FUNDS
Gross block 4,939 6,019 6,692 7,256 7,854 8,415
Less: Acc. depreciation 1,540 1,769 2,058 2,343 2,725 3,134
Net Block 3,399 4,250 4,634 4,914 5,130 5,281
Capital work-in-progress 998 561 358 548 550 589
Goodwill - - - - - -
Investments 264 326 1,230 1,534 1,591 1,597
Long term loans and advances - - 385 608 608 608
Other noncurrent assets - - 3 7 7 7
Current assets 3,166 4,152 3,984 4,304 4,762 5,643
Cash 88 519 180 33 68 276
Loans & advances 790 973 431 810 869 996
Other 2,288 2,660 3,373 3,461 3,825 4,371
Current liabilities 2,141 2,961 3,760 4,742 4,693 5,320
Net current assets 1,025 1,191 224 (438) 70 324
Misc. exp. not written off 10 5 - - - -
Total Assets 5,695 6,334 6,833 7,174 7,956 8,406

Ashok Leyland | 2QFY2013 Result Update
November 9, 2012
11
Cash flow statement (Standalone)
Y/E March (` cr) FY2009 FY2010 FY2011 FY2012 FY2013E FY2014E
Profit before tax 208 545 802 690 696 926
Depreciation 178 204 267 353 382 409
Change in working capital (785) 264 628 518 (472) (46)
Others (18) 289 (891) (275) - -
Other income (91) (91) (44) (42) (49) (53)
Direct taxes paid (18) (121) (171) (124) (104) (167)
Cash Flow from Operations (526) 1,090 591 1,120 453 1,069
(Inc.)/Dec. in fixed assets (2,466) (643) (470) (755) (600) (600)
(Inc.)/Dec. in investments 346 (63) (904) (304) (57) (6)
Other income 91 91 44 42 49 53
Cash Flow from Investing (2,028) (614) (1,329) (1,017) (608) (553)
Issue of equity - - - - - -
Inc./(Dec.) in loans 1,071 322 68 47 500 -
Dividend paid (Incl. Tax) 234 156 233 309 309 309
Others 519 (523) 97 (606) - -
Cash Flow from Financing 1,823 (45) 398 (250) 191 (309)
Inc./(Dec.) in cash (731) 430 (340) (147) 36 207
Opening Cash balances 451 88 519 180 33 68
Closing Cash balances 88 519 180 33 68 276

Ashok Leyland | 2QFY2013 Result Update
November 9, 2012
12
Key ratios
Y/E March FY2009 FY2010 FY2011 FY2012 FY2013E FY2014E
Valuation Ratio (x) P/E (on FDEPS) 38.2 17.8 10.9 12.2 11.6 9.0
P/CEPS 18.6 11.6 7.6 7.5 7.0 5.9
P/BV 3.2 2.9 2.6 2.4 2.2 1.9
Dividend yield (%) 1.9 2.9 3.9 3.9 3.9 3.9
EV/Sales 1.2 1.0 0.6 0.5 0.5 0.4
EV/EBITDA 18.5 10.9 6.4 6.1 5.9 4.9
EV / Total Assets 1.5 1.3 1.1 1.1 1.0 0.9
Per Share Data (`)
EPS (Basic) 0.7 1.4 2.4 2.1 2.2 2.9
EPS (fully diluted) 0.7 1.4 2.4 2.1 2.2 2.9
Cash EPS 1.4 2.2 3.4 3.4 3.7 4.4
DPS 0.5 0.8 1.0 1.0 1.0 1.0
Book Value 7.9 8.8 10.0 10.9 11.9 13.6
Dupont Analysis
EBIT margin 4.6 7.5 8.3 6.8 6.9 7.2
Tax retention ratio 0.9 0.8 0.8 0.8 0.9 0.8
Asset turnover (x) 1.7 1.7 2.3 2.4 2.3 2.5
ROIC (Post-tax) 7.1 9.7 15.2 13.2 13.6 14.6
Cost of Debt (Post Tax) 10.2 3.7 6.4 8.8 11.2 9.0
Leverage (x) 0.3 0.4 0.3 0.2 0.2 0.2
Operating ROE 6.3 12.2 17.9 14.2 14.2 15.9
Returns (%)
ROCE (Pre-tax) 6.2 9.2 14.4 12.9 13.1 14.6
Angel ROIC (Pre-tax) 6.5 12.4 17.7 15.5 15.1 17.5
ROE 6.4 10.7 16.5 13.8 13.6 16.1
Turnover ratios (x)
Asset Turnover (Gross Block) 1.5 1.4 1.8 1.9 1.9 2.0
Inventory / Sales (days) 76 73 61 61 62 61
Receivables (days) 40 49 35 33 35 35
Payables (days) 114 110 95 105 107 107
WC cycle (ex-cash) (days) 33 40 11 (6) (6) 1
Solvency ratios (x)
Net debt to equity 0.5 0.4 0.2 0.2 0.3 0.2
Net debt to EBITDA 3.5 1.9 0.8 0.7 0.9 0.6
Interest Coverage (EBIT / Int.) 1.7 5.5 5.0 3.5 2.9 3.7

Ashok Leyland | 2QFY2013 Result Update
November 9, 2012
13
Research Team Tel: 022 - 39357800 E-mail: [email protected] Website: www.angelbroking.com DISCLAIMER This document is solely for the personal information of the recipient, and must not be singularly used as the basis of any investment decision. Nothing in this document should be construed as investment or financial advice. Each recipient of this document should make such investigations as they deem necessary to arrive at an independent evaluation of an investment in the securities of the companies referred to in this document (including the merits and risks involved), and should consult their own advisors to determine the merits and risks of such an investment.
Angel Broking Limited, its affiliates, directors, its proprietary trading and investment businesses may, from time to time, make investment decisions that are inconsistent with or contradictory to the recommendations expressed herein. The views contained in this document are those of the analyst, and the company may or may not subscribe to all the views expressed within.
Reports based on technical and derivative analysis center on studying charts of a stock's price movement, outstanding positions and trading volume, as opposed to focusing on a company's fundamentals and, as such, may not match with a report on a company's fundamentals.
The information in this document has been printed on the basis of publicly available information, internal data and other reliable sources believed to be true, but we do not represent that it is accurate or complete and it should not be relied on as such, as this document is for general guidance only. Angel Broking Limited or any of its affiliates/ group companies shall not be in any way responsible for any loss or damage that may arise to any person from any inadvertent error in the information contained in this report. Angel Broking Limited has not independently verified all the information contained within this document. Accordingly, we cannot testify, nor make any representation or warranty, express or implied, to the accuracy, contents or data contained within this document. While Angel Broking Limited endeavours to update on a reasonable basis the information discussed in this material, there may be regulatory, compliance, or other reasons that prevent us from doing so. This document is being supplied to you solely for your information, and its contents, information or data may not be reproduced, redistributed or passed on, directly or indirectly.
Angel Broking Limited and its affiliates may seek to provide or have engaged in providing corporate finance, investment banking or other advisory services in a merger or specific transaction to the companies referred to in this report, as on the date of this report or in the past.
Neither Angel Broking Limited, nor its directors, employees or affiliates shall be liable for any loss or damage that may arise from or in connection with the use of this information.
Note: Please refer to the important `Stock Holding Disclosure' report on the Angel website (Research Section). Also, please refer to the latest update on respective stocks for the disclosure status in respect of those stocks. Angel Broking Limited and its affiliates may have investment positions in the stocks recommended in this report.
Disclosure of Interest Statement Ashok Leyland
1. Analyst ownership of the stock No
2. Angel and its Group companies ownership of the stock No
3. Angel and its Group companies' Directors ownership of the stock No
4. Broking relationship with company covered No
Ratings (Returns): Buy (> 15%) Accumulate (5% to 15%) Neutral (-5 to 5%) Reduce (-5% to -15%) Sell (< -15%)
Note: We have not considered any Exposure below ` 1 lakh for Angel, its Group companies and Directors
Top Related