


Languages
Pages
Legal


International Journal of Agriculture, Environment and Bioresearch
Vol. 2, No. 06; 2017
ISSN: 2456-8643
www.ijaeb.org Page 234
ARSENIC IN GROUNDWATER, SOIL AND RICE GRAIN OF NEPAL
Rajib K. Shrestha1*, Bhim P. Kafle1, Anu Gurung2, Deepak Regmi3 1Department of Chemical Science and Engineering, School of Engineering, Kathmandu University, Nepal 2Department of Environmental Science and Engineering, School of Science, Kathmandu University, Nepal
3Birendra Multiple Campus, Tribhuvan University, Chitwan, Nepal
*Corresponding author e-mail: [email protected]
ABSTRACT
Arsenic (As) contamination in groundwater is a serious issue of South Asian countries. As can
also contaminate soil and crops growing in that area. To evaluate the level of As contamination
in water, soil and crops (rice grain), sites were selected from highly As affected southern district
of Nepal, Nawalparasi. The As level in water was above the national (0.05 mg L-1) and WHO
standards (0.01 mg L-1). However, soil and rice grain showed As contamination in the safe level.
The average ratios of As concentration of soil to water, rice grain to water and rice grain to soil
samples was found to be 6.2, 2 and 1.5, respectively. Furthermore, positive correlation of As in
water with soil and negative correlation of As in water with rice grain indicates that soil gets
contaminated first with As followed by rice grain. Hydride generation atomic absorption
spectrophotometer was used for As analysis.
Keywords: Arsenic (As), groundwater, soil, rice grain, HGAAS
Introduction
Arsenic is a significant contaminant and pollutant of groundwater and soil in many regions of the
world. Higher concentration of arsenic in drinking water have been reported in several countries
including Argentina, Bangladesh, China, India, Nepal, USA, Japan etc (Thakur et al., 2011). The
most severe problem of arsenic contamination in groundwater is in Bangladesh and West Bengal
State of India (Sijapati et al., 2004). In 1999, As presence in groundwater in the Terai districts of
Nepal was brought to light for the first time during the survey conducted by WHO (WHO, 2001).
Importantly, As containing water can contaminate soil and also crops growing in that soil.
Specifically, available documents indicate that Nepal’s 24 districts, including all 20 Terai
districts and four hilly districts have shown arsenic contamination (FAO, 2004). The studies
(Panthi et al., 2006; Maharjan et al., 2006 and Thakur et al., 2011) revealed that arsenic
contamination was found to be severe in districts of Terai namely Nawalparasi, Bara, Parsa,

International Journal of Agriculture, Environment and Bioresearch
Vol. 2, No. 06; 2017
ISSN: 2456-8643
www.ijaeb.org Page 235
Rautahat, Rupandehi, and Kapilvastu. In these districts, arsenic contamination in tubewells
varied from 2.1% of 2043 tubewells examined in Rupandehi district to 25.7% of 3211 tubewells
examined in Nawalparasi district (Maharjan et al., 2006). Also, the highest arsenic concentration,
above 0.05 mg L-1, was reported in Nawalparasi district and minimum arsenic concentration was
reported in Palpa, Ilam and Chitwan districts (Thakur et al., 2011). Of the total studied
population of six districts (N = 18,288), 400 were identified as cases of arsenicosis. The
occurrence of arsenicosis was on average 2.2% (400/18288) and varied from 0.7% (11/1666) in
Kapilvastu district to 3.6% (109/3011) in Nawalparasi district. The highest prevalence (18.6% =
97/521) of arsenicosis was reported in Patkhouli village of Nawalparasi, where 95.8% of
tubewells were contaminated with arsenic (Maharjan et al., 2006). The toxicity of As to human
health ranges from skin lesions (melanosis and keratosis) to cancer of the brain, lungs, kindey
and stomach (Thakur et al., 2011).
Nepal is agricultural country and rice is the staple food of the country. The rice cultivation
mainly depends on the underground water. Terai, a plain southern part of Nepal is very rich in
groundwater and thus have been the primary source for drinking water and irrigation purposes
(FAO, 2004). Over 90 % of Terai population draws groundwater from tubewells for drinking and
irrigation (Gurung et al., 2005). Generally As is available in much higher concentration in
groundwater compared to surface water (Sijapati et al., 2004). Also, arsenic concentration in
groundwater varies seasonally. Groundwater has higher As-concentration in pre-monsoon season
and the dilution of the underground water causes the lowering of As concentration in post-
monsoon season (Shrestha et al., 2014). Arsenic mobilization in the water residing in aquifers
may have been caused by over withdrawal of groundwater during cultivation. The widespread
use of arsenic contaminated groundwater in irrigation for a prolonged period of time
could elevate its concentration in surface soil and eventually into vegetations for example,
rice plants and rice grain. The arsenic content in tissues of rice plant is in the order:
straw > husk > rice grain (Rahman et al., 2007).
World Health Organization (WHO) has set 0.01 mg L-1 As concentration as the limit value in the
drinking water. Many countries, particularly developing one like Nepal, including India and
Bangladesh, have adopted the limit of 0.05 mg L-1 As concentration as their national standard
because of lack of adequate tests and also removal and mitigation facilities to lower the level of
arsenic concentration (Thakur et al., 2011). The lowest standard currently set for acceptable As
concentration in drinking water is implemented by Australia, which has a national standard of
0.007 mg L-1 (ADWG, 2004). However, limited literatures are available on As accumulation in
rice varieties and soil. Unfortunately, there is no upper standard limit of arsenic in food grain for
South and East Asian countries, United Kingdom and Australia has set the food hygiene standard

International Journal of Agriculture, Environment and Bioresearch
Vol. 2, No. 06; 2017
ISSN: 2456-8643
www.ijaeb.org Page 236
level of As as 1.0 mg kg−1 (Warren et al., 2003). European Union recommends 20 mg of
As kg−1 soil as the maximum limit of As in agricultural soil for crops (Kabata-Pendias and
Pendias, 1992).
As contamination in groundwater and food grain is a major health issues in Terai region of Nepal,
where the population density is very high. The long term use of As contaminated groundwater for
irrigation results the elevated As contamination in agricultural land followed by food grain.
Previous studies clearly indicated that the Terai region as a whole has been in deteriorating
condition due to As contamination and also, more importantly, there are reports of As
contamination in food grain in Bangladesh and West Bengal of India. There is no any scientific
investigation in this issue in case of Nepal. In this regard, prediction of actual concentration of As
dissolved in water and food grain will allow to make a clear picture of total dose taken by the
people from drinking water and food materials so that Nepal Government can make a proper
plan accordingly for providing pure water. Therefore, this study has been conducted to find the
As concentration in groundwater, soil and rice grain of Nawalparasi district. This study also
indicates the flow of As from groundwater to soil and then, from both groundwater and soil to
rice grain.
Methodology
Sampling sites
Nawalparasi is one of six districts of Lumbini zone in Nepal’s Western Development Region.
Area inside the dashed line in Fig. (1) shows the google map of Nawalparasi district. It is one of
the 20 Terai districts of Nepal and bordered by Chitwan and Tanahu districts in the east;
Rupandehi and Palpa in the west; Palpa and Tanahu in the north and Uttar Pradesh state of India
in the south. Nawalparasi has 74 VDCs and one municipality. The head quarter of the district is
Parasi bazaar. The district lies between 91 and 1,936 meters above sea level. It occupies the area
between 27˚ 21' and 27˚ 47' latitudes, and 83˚ 36' and 84˚ 25' longitudes (New ERA, 2000).

International Journal of Agriculture, Environment and Bioresearch
Vol. 2, No. 06; 2017
ISSN: 2456-8643
www.ijaeb.org Page 237
Fig. 1: Google map of Nawalparasi district (Source: Shrestha et al., 2014)
Devgaun and Manari are two Village Development Committees (VDCs) of Nawalparasi district.
Of many villages, Pathkauli village of Devagaun VDC and Mahuwa village of Manari VDC
were selected as the project site.
Sample collection and arsenic analysis
The sampling of groundwater (taken from hand pumps, 40-100 feet deep) and soil was
conducted at post-monsoon season from 1st to 3rd October 2012. Similarly, sampling of rice grain
samples was done on 18th October, which is nearly the time of rice harvesting. Groundwater
(N = 46), soil (N = 10) and rice grain (N = 7) samples were collected for As analysis. Rice grain
samples were collected at the rice field and soil samples were also collected from the rice field at
a depth of 0-15 cm.

International Journal of Agriculture, Environment and Bioresearch
Vol. 2, No. 06; 2017
ISSN: 2456-8643
www.ijaeb.org Page 238
Analysis was performed by two different techniques. For qualitative analysis, a HACH As-test
kit was used and for quantitative analysis, hydride generation atomic absorption
spectrophotometer (HGAAS) (Thermo Electron Corporation) was used.
Presence of As in the tubewell water was confirmed by HACH As-test kits at the site, which
gives rough range of As concentration on the basis of color change. Briefly, the As-test kit
contains mercuric bromide (HgCl2) coated film with which arsine gas (AsH3) reacts due to which
color of the film changes. Arsine gas (AsH3) is produced from the reaction between As3+ and
hydrogen ions (H+). As3+ is formed from the reduction of As5+ by the addition of potassium
iodide (KI) and stannous chloride (SnCl2) in an acidic medium and hydrogen ions (H+) are
formed by the reaction of HCl and zinc granules. This stain is then compared against a colour
coded chart indicating the As concentration from zero to 0.5 mg L-1 (Nepal, 2011).
After confirmation of presence of As in a particular tubewell by testing with HACH As-test kit
during the blanket testing in field visit, two sets of samples were prepared in polyethylene vials
for laboratory analysis (note that, the plastic bottles were previously washed by distilled water
and dried in oven). In one set of vials, groundwater samples were collected without preservative
for the analysis of Physio-chemical parameters: pH, conductivity and total dissolved solids
(TDS) and kept in ice box. The Physio-chemical parameters were measured in the laboratory of
Kathmandu University and the findings were reported in our previous article (Shrestha et al.,
2014). While for quantitative analysis of arsenic, five ml concentrated HCl per liter was added to
vials containing water and transferred to Aquatic Ecology Center (AEC) at Kathmandu
University in Dhulikhel for further analysis by HG-AAS for the more accurate result.
Digestion of soil and rice grain samples
The rice grain and soil samples were digested in the laboratory before quantitative analysis of As.
The digestion method was followed as reported by Rahman et. al (2007) and is briefly described
below.
The collected samples (rice grain and soil) from each spot were tagged properly and sun dried for
3 days putting the samples on a wooden table. The sun dried samples were stored in a drying
cabinet at 45°C. Again, taking the final weight, all samples were oven dried at 65°C for 72 hours.
Then, the samples were ground and sieved. About 0.5 g of the sample was taken into a dry clean
digestion tubes and 5 ml of concentrated nitric acid was added in it. The mixture was allowed to
stand overnight under fume hood. In the following day, the digestion tubes were placed on a
heating block and heated at 60°C for 2 hours. Then, the tubes were allowed to cool at room
temperature. About 2 ml of concentrated perchloric acid was added to the rice grain samples. For
the soil samples (initial soil), 3 ml sulfuric acid was added in addition to 2 ml perchloric acid.

International Journal of Agriculture, Environment and Bioresearch
Vol. 2, No. 06; 2017
ISSN: 2456-8643
www.ijaeb.org Page 239
Again, the tubes were heated at 160°C for about 4–5 hours. Heating was stopped when the dense
white fume of perchloric acid occurred. The digest was cooled, diluted to 25 ml by distilled DI
water and filtered through filter paper (Whatman: No.1) and stored in 30-ml polythene bottles
previously washed by distilled DI water and dried. Then, the extracts of the digested samples
were transported to Aquatic Ecology Centre (AEC) at Kathmandu University in Dhulikhel for
further analysis by HGAAS.
Method for Arsenic (As) analysis by HGAAS
The compounds of arsenic are converted to their volatile hydrides by the use of sodium
borohydride (NaBH4) as reducing agent in acidic medium created by HCl. Then, the hydride is
dissociated into an atomic vapour by the relatively moderate temperature of an air-acetylene
flame (Mendham et al., 2002).
The reaction sequence for arsenic analysis by HG-AAS may be represented by
As (V) AsH3 Aso(gas) + H2
NaBH4
H+
Heat in flame
Results and discussion
As-concentration in underground water, soil and rice grain samples
During post-monsoon season from 1st to 3rd October 2012, groundwater (N = 46), soil (N = 10)
and rice grain samples (N = 7) were collected and analyzed for As concentration using HGAAS.
Figures (2) & (3) and Table (1) respectively show the concentration of As in groundwater, soil
and rice grain samples.
This study shows that the level of As concentration in groundwater was found above the Nepal's
national (0.05 mg L-1) & WHO standards (0.01 mg L-1) in all analyzed samples ranging from
0.121 mg L-1 to 1.103 mg L-1 with the average of 0.59 mg L-1. Similarly, Bhattacharya et al.
(2009) revealed that the level of arsenic concentration in irrigation water in the range of
0.11±0.012 to 0.76±0.014 mg L-1 in the study of the arsenic affected 17 villages of Nadia district,
West Bengal, India. A survey study conducted on arsenic concentration of tube-well water of
41 districts from the total 64 districts of Bangladesh by the British Geological Survey (2000)
showed that 51% samples were above 0.01 mg L-1 (WHO standard), 35% samples were above
0.05 mg L-1 (national standard), 25% were above 0.10 mg L-1, 8.4% were above
0.30 mg L-1 and 0.1% were above 1.0 mg L-1 (Abedin and Meharg, 2002).

International Journal of Agriculture, Environment and Bioresearch
Vol. 2, No. 06; 2017
ISSN: 2456-8643
www.ijaeb.org Page 240
Some soil and rice grain samples, collected from arsenic affected area where the arsenic
contaminated tubewell water was used for irrigation, showed arsenic contamination. This study
shows that As concentration in all soil samples are in the range of 0.35 to 9.55 mg kg-1 with
average of 3.14 mg kg-1 which is below than 20 mg of As kg−1 soil as the maximum limit of
arsenic in agricultural soil for crops. Similarly Bhattacharya et al. (2009) revealed that the total
soil arsenic concentration ranged from 1.38±0.108 to 12.27±0.094 mg kg-1 dry weight of arsenic
in the study of the arsenic affected 17 villages of Nadia district, West Bengal, India. In the next
study by Meharg and Rahman (2003), the arsenic level in the 0 - 15 cm surface paddy soil in 27
administrative districts of Bangladesh varied between 3.1 to 42.5 mg kg-1.
Figure 2: As concentration in groundwater samples

International Journal of Agriculture, Environment and Bioresearch
Vol. 2, No. 06; 2017
ISSN: 2456-8643
www.ijaeb.org Page 241
Figure 3: As concentration in soil samples
In all rice grain samples analyzed, this study shows that the average As concentration was about
0.74 mg kg-1 which is below the food hygiene standard level of As (1.0 mg kg−1) in United
Kingdom and Australia. Specifically, three samples showed As level below detection limit
(0.005 mg kg-1) reported as ND (not determined) in the table (1) and other four samples
demonstrated in the range 0.35 mg kg-1 to 1.9 mg kg-1. Similarly, in the study of the arsenic
affected 17 villages of Nadia district (West Bengal, India) by Bhattacharya et al. (2009), the
results showed that the level of arsenic in the rice grain ranging from 0.25±0.014 to 0.73±0.009
mg kg-1. In the next study by Meharg and Rahman (2003), the arsenic level in rice grain varieties
collected from different western Bangladesh districts ranged from 0.058 to 1.83 mg kg-1. In
another study, As level in rice grain ranged from 0.03 to 0.11 mg kg-1 in North American cooked
rice (N=18) (Tao and Bolger, 1998 ) and on raw rice grain, this range was 0.2 – 0.46 mg kg-1
with a mean of 0.303 mg kg-1 wet weight (N=4) (Schoof et al., 1999). For Taiwan, values ranged
between 0.063 mg kg-1 and 0.2 mg kg-1 dry weight (N=4) (Schoof et al., 1998).

International Journal of Agriculture, Environment and Bioresearch
Vol. 2, No. 06; 2017
ISSN: 2456-8643
www.ijaeb.org Page 242
Table 1: As concentration in rice grain samples
S.N. Rice grain samples As concentration in rice grain (mg kg-1) samples
1 rs1 ND(<0.005)
2 rs4 0.35
3 rs14 ND(<0.005)
4 rs17 ND(<0.005)
5 rs18 0.35
6 rs20 0.35
7 mrs1 1.9
Table 2: Ratios of As concentration in rice grain to soil samples
S.N. Ratios of As
concentration in rice
grain to soil sample
Ratios of As concentration
(ppm) in rice grain to soil
sample
Average of ratios of As
concentration (ppm) in rice grain
to soil sample
1 44 ssrs 95.035.0 = 0.37
1.5
2 1818 ssrs 45.335.0 = 0.101
3 2020 ssrs 5.335.0 = 0.1
4 11 mssmrs 35.09.1 = 5.43

International Journal of Agriculture, Environment and Bioresearch
Vol. 2, No. 06; 2017
ISSN: 2456-8643
www.ijaeb.org Page 243
Table 3: Ratios of As concentration in rice grain to water sample
S.N. Ratios of As
concentration in rice
grain to water sample
Ratios of As concentration
(ppm) in rice grain to water
sample
Average of ratios of As
concentration(ppm) in rice grain
to water sample
1 44 wsrs 335.035.0 = 1.05
2.03
2 1818 wsrs 35.035.0 = 1
3 2020 wsrs 865.035.0 = 0.405
4 11 mwsmrs 334.09.1 = 5.69

International Journal of Agriculture, Environment and Bioresearch
Vol. 2, No. 06; 2017
ISSN: 2456-8643
www.ijaeb.org Page 244
Table 4: Ratios of As concentration in soil to water sample
S.N. Ratios of As
concentration in soil to
water sample
Ratios of As concentration
(ppm) in soil to water sample
Average of ratios of As
concentration (ppm) in soil to
water sample
1 11 wsss 325.01.3 = 9.54
6.2
2 44 wsss 335.095.0 = 2.84
3 1414 wsss 827.01.4 = 4.96
4 1717 wsss 41.03.3 = 8.05
5 1818 wsss 35.045.3 = 9.86
6 2020 wsss 865.05.3 = 4.05
7 11 mwsmss 334.035.0 = 1.05
8 99 mwsmss 671.09.1 = 2.83
9 2121 mwsmss 712.015.1 = 1.62
10 2525 mwsmss 559.055.9 = 17.08
International Journal of Agriculture, Environment and Bioresearch
Vol. 2, No. 06; 2017
ISSN: 2456-8643
www.ijaeb.org Page 245
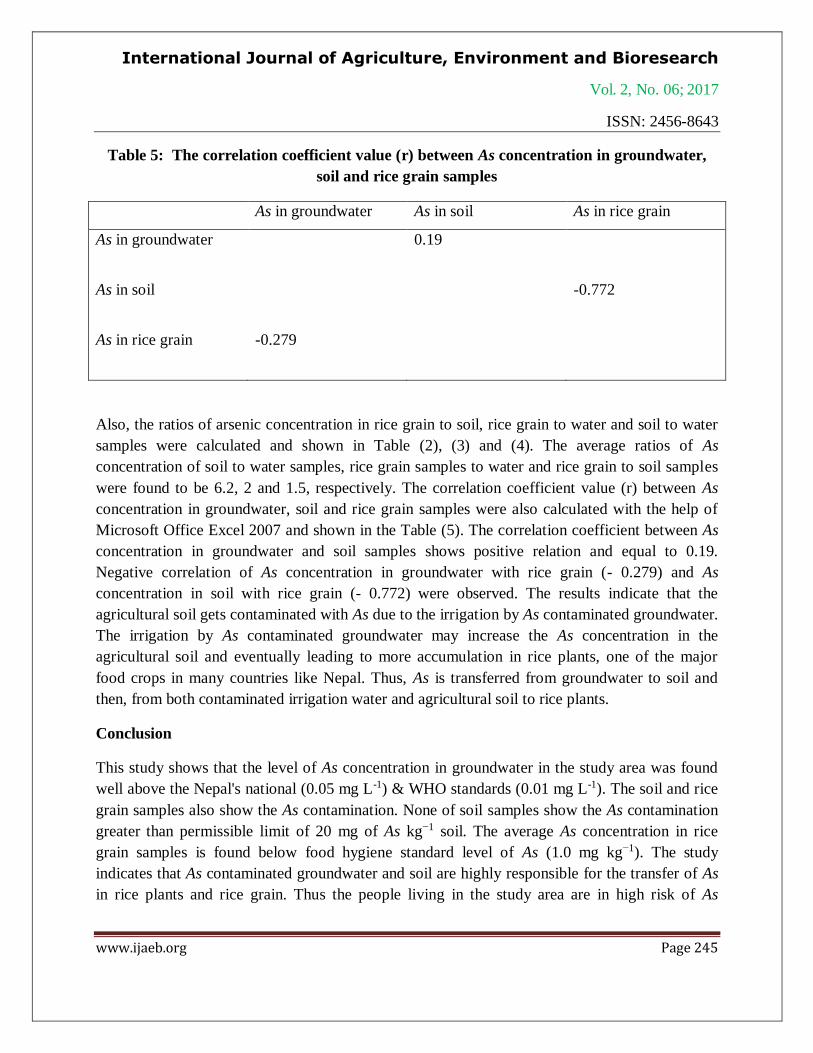
Table 5: The correlation coefficient value (r) between As concentration in groundwater,
soil and rice grain samples
As in groundwater As in soil As in rice grain
As in groundwater 0.19
As in soil -0.772
As in rice grain -0.279
Also, the ratios of arsenic concentration in rice grain to soil, rice grain to water and soil to water
samples were calculated and shown in Table (2), (3) and (4). The average ratios of As
concentration of soil to water samples, rice grain samples to water and rice grain to soil samples
were found to be 6.2, 2 and 1.5, respectively. The correlation coefficient value (r) between As
concentration in groundwater, soil and rice grain samples were also calculated with the help of
Microsoft Office Excel 2007 and shown in the Table (5). The correlation coefficient between As
concentration in groundwater and soil samples shows positive relation and equal to 0.19.
Negative correlation of As concentration in groundwater with rice grain (- 0.279) and As
concentration in soil with rice grain (- 0.772) were observed. The results indicate that the
agricultural soil gets contaminated with As due to the irrigation by As contaminated groundwater.
The irrigation by As contaminated groundwater may increase the As concentration in the
agricultural soil and eventually leading to more accumulation in rice plants, one of the major
food crops in many countries like Nepal. Thus, As is transferred from groundwater to soil and
then, from both contaminated irrigation water and agricultural soil to rice plants.
Conclusion
This study shows that the level of As concentration in groundwater in the study area was found
well above the Nepal's national (0.05 mg L-1) & WHO standards (0.01 mg L-1). The soil and rice
grain samples also show the As contamination. None of soil samples show the As contamination
greater than permissible limit of 20 mg of As kg−1 soil. The average As concentration in rice
grain samples is found below food hygiene standard level of As (1.0 mg kg−1). The study
indicates that As contaminated groundwater and soil are highly responsible for the transfer of As
in rice plants and rice grain. Thus the people living in the study area are in high risk of As

International Journal of Agriculture, Environment and Bioresearch
Vol. 2, No. 06; 2017
ISSN: 2456-8643
www.ijaeb.org Page 246
exposure to human bodies through As contaminated groundwater by drinking and cooking
purposes and through As contaminated rice grain.
Acknowledgement
The authors are thankful to University Grant Commission (UGC), Nepal for financial support
and Aquatic Ecology Centre (AEC) and Department of Natural Science, School of Science at
Kathmandu University in Dhulikhel for providing research facilities. The authors also would like
to thank Dr. Rajendra Joshi, Assistant Professor, Department of Chemical Science and
Engineering, School of Engineering, Kathmandu University and Dr. Makhan Maharjan, Sr.
Program Manager of Environment and Public Health Organization (ENPHO), Nepal for their
valuable suggestions and inputs.
References
Abedin Md. J. and Meharg A. A. 2002. Relative toxicity of arsenite and arsenate on germination
and early seedling growth of rice (Oryza sativa L.). Plant and Soil, © 2002 Kluwer Academic
Publishers, Printed in the Netherlands.243: 57-66
Australian Drinking Water Guidelines, ADWG. 2004.
Bhattacharya P., Samal A. C., Majumdar J. and Santra S. C. 2009. Transfer of Arsenic from
Groundwater and Paddy Soil to Rice Plant (Oryza sativa L.): A Micro Level Study in West
Bengal, India. World Journal of Agricultural Sciences 5 (4): 425-431. ISSN 1817-3047
FAO. 2004. Arsenic threat and irrigation management in Nepal, Rome.
Gurung J. K., Ishiga H. & Khadka M. S. 2005. Geological and geochemical examination of
arsenic contamination in groundwater in the Holocene Terai Basin, Nepal. Environ Geol, 49: 98–
113. DOI: 10.1007/s00254-005-0063-6.
Kabata-Pendias A. & Pendias H. 1992. Trace element in soil and plants (2nd ed.). London, UK:
CRC.
Maharjan M., Shrestha R. R., Ahmad S. A., Watanabe C. & Ohtsuka R. 2006. Prevalence of
Arsenicosis in Terai, Nepal. J. HEALTH POPUL NUTR, 24(2): 246-252.
Mandal B. K.. & Suzuki K.. T. 2002. Arsenic round the world: A review.
Talanta, 58 (1), 201-235.

International Journal of Agriculture, Environment and Bioresearch
Vol. 2, No. 06; 2017
ISSN: 2456-8643
www.ijaeb.org Page 247
Meharg A. A. and Rahman Md. M. 2003. Arsenic contamination of Bangladesh paddy field
soils: Implications for rice contribution to arsenic consumption. Environ. Sci. Technol. 37: 229-
234
Mendham J., Denney R. C., Barnes J. D. & Thomas M. 2002. “Vogel’s Textbook of Quantitative
Chemical Analysis”, 6th eds. Pearson Education Limited, Indian branch, Delhi, India.
Nepal G. D. 2011. Research on mitigation option of arsenic contaminated ground water in
Nepal.
Rural water supply and sanitation project, Western Nepal.
New ERA. 2000. Baseline Survey Report- Nawalparasi: Decentralized Planning for the Child
Programme. District Development Committee - Nawalparasi, National Planning Commission,
Ministry of Local Development, UNICEF.
Panthi R. S., Sharma S. & Mishra K. A. 2006. Recent status of Arsenic contamination in
groundwater of Nepal- A review. Kathmandu University Journal of Science, Engineering and
Technology, 2(1): 1-11.
Rahman M. A., Hasegawa H., Rahman M. M., Islam M. N., Miah M. A. M. & Tasmin A. 2007.
Arsenic Accumulation in Rice (Oryza sativa L.) Varieties of Bangladesh: A Glass House Study.
Water Air Soil Pollution, 185 (1-4): 53–61. DOI: 10.1007/s11270-007-9425-x
Schoof R. A., Yost L. J., Eickhoff J., Crecelius E. A., Irgolic K, Gowssler W, Guo H R, Greene,
H. 1998. Dietary arsenic intake in Taiwanese districts with elevated arsenic in drinking water
Hum. Ecol. Risk Asses. 4, 117
Schoof R. A., Yost L. J., Eickhoff J., Crecelius E. A., Cragin D. W., Meacher, D M , Menzel,
D B 1999. A market basket survey of inorganic arsenic in food. Food Chem Toxicol. 37 (8), 839
- 46.
Shrestha R. K., Regmi D. & Kafle B. P. 2014. Seasonal Variation of Arsenic Concentration in
Groundwater of Nawalparasi district of Nepal. Int J Appl Sci Biotechnol, Vol 2(1): 59-63. DOI:
10.3126/ijasbt.v2i1.9477
Sijapati S., Pradhan B. & Parajuli U. 2004. Arsenic Threat and irrigation Management in Nepal.
Food and Agriculture Organization of the United Nations, Rome.
Tao S. S. H. and Bolger P. M. 1998. Dietary arsenic intakes in the United States: FDA total diet
study, September 1991 – December 1996. Food Add. Contam. 16, 465.

International Journal of Agriculture, Environment and Bioresearch
Vol. 2, No. 06; 2017
ISSN: 2456-8643
www.ijaeb.org Page 248
Thakur J. K.., Thakur K. R., Ramanathan A., Kumar M. and Singh S. K. 2011. Arsenic
contamination of Groundwater in Nepal- An overview. Water 3: 1-20; doi: 10.3390/w3010001.
Warren G. P., Alloway B. J., Lepp N. W., Singh B., Bochereau F. J. M. and Penny C. 2003.
Field trials to assess the uptake of arsenic by vegetables from contaminated soils and soil
remediation with iron oxides. Science of the Total Environment, 311, 19–33
WHO. 2001. Arsenic contamination in Groundwater Affecting Some Countries in the South-East
Asia Region. WHO: Washington, DC, USA.
WHO. 2008. Guidelines for drinking water quality, 3rd edition, volume 1, World Health
Organization, Geneva.
Top Related