


Languages
Pages
Legal


ARKANSAS EDUCATION REPORT Volume 11, Issue 5
OUTSTANDING EDUCATIONAL PERFORMANCE AWARDS: HIGHLIGHTING HIGH-ACHIEVING ARKANSAS SCHOOLS, 2014
HIGH-ACHIEVING ELEMENTARY SCHOOLS BY GRADE LEVEL AND REGION
September 17, 2014
By:
Charlene A. Reid Gary W. Ritter
Office for Education Policy University of Arkansas
211 Graduate Education Building Fayetteville, AR 72701 Phone: (479) 575-3773
Fax: (479) 575-3196 E-mail: [email protected]
Outstanding Educational Performance Awards 2014 Page ii
TABLE OF CONTENTS
Introduction ..................................................................................................................................... 1
II. 2014 OEP Awards: High-Achieving Elementary Schools By Grade Level and By Region ..... 8
C. Elementary Math by Grade, 2014 .......................................................................................... 9
D. Elementary Literacy by Grade, 2014 ................................................................................... 12
E. Northwest Region, Elementary Schools, 2014 ..................................................................... 15
F. Northeast Region, Elementary Schools, 2014 ...................................................................... 17
G. Central Region, Elementary Schools, 2014 ......................................................................... 19
H. Southwest Region, Elementary Schools, 2014 .................................................................... 21
I. Southeast Region, Elementary Schools, 2014 ....................................................................... 23
Appendix ...................................................................................................................................... A1

Outstanding Educational Performance Awards 2014 Page 1
INTRODUCTION Since our founding in 2003, the mission of the Office for Education Policy has been looking at
pressing issues through the lens of academic research and disseminating our findings to
educators, policymakers, and other stakeholders around Arkansas. Every once in a while,
however, we think it is okay to stray from issue analysis and simply share some good news!
In this Arkansas Education Report (AER), we aim to highlight excellent performance and offer
our congratulations. To that end, we are happy to highlight many excellent schools around the
state in our now-annual AER, entitled the Outstanding Educational Performance Awards, or the
OEP awards.
Over a three month period this fall, a new set of OEP Awards will be released every couple of
weeks to highlight high-performing schools in Arkansas on the Benchmark exam in math and
literacy, and End-Of-Course (EOC) exams in Algebra, Geometry, Literacy (Grade 11), and
Biology.
Two years ago, we first introduced an academic performance indicator, the “GPA” rating
system, to rank the highest-performing schools. In the past, the rankings were created based on
the percentage of students scoring at the proficient or advanced level on each assessment.
Generally, when discussing academic achievement on the Benchmark exams, policymakers
focus on this figure. However, the proficiency indicator suffers from being an “all-or-nothing”
measure, in which a student is either proficient or not.
The proficiency measure disregards real information provided by student scores that are placed
into the four different performance categories: below basic, basic, proficient, and advanced.
Additionally, this mark does not differentiate between a school in which 100% of students score
proficient and a school in which 100% of students score advanced. Both of these schools would
show 100% of students performing at proficient and advanced levels; however, in the latter
school, students actually performed at a significantly higher level. Thus, a slightly more
informative indicator gives the most credit to students who score at the advanced level and the
least credit to students who score at the below basic level. For such purposes, we have created
the “GPA” rating system. In this GPA measure, parallel to the familiar grade point average for
individual students, we treat the Benchmark test scores in a similar way, whereby a 4.0 is a
perfect score.
Category GPA Points Awarded
Advanced 4.0
Proficient 3.0
Basic 2.0
Below Basic 1.0
The GPA measure, we believe, is a better representation of student achievement on statewide
standardized exams. In this report, we are presenting a list of the top 25 schools in each area. In
some cases, these "top 25 lists" will contain more than 25 schools as some schools' GPA scores
will be identical. This is not a new phenomenon, as we also exceeded 25 schools in previous

Outstanding Educational Performance Awards 2014 Page 2
reports when using the percent proficient and advanced metric as an indicator for student
achievement; however, there are fewer ties using the more precise GPA measure.
After we present our overall snapshot of high-performing schools, we will release subsequent
reports every few weeks focusing on different subsets of schools. In the following weeks, we
will focus on high-performing elementary schools, middle schools, and high schools in the
various regions across the state. Then, we will feature schools that are beating the odds (that is,
schools that have high levels of student achievement while serving a high percentage of low-
income students). Finally, we will conclude our report by focusing on the schools with the
greatest improvement in test scores. Our release schedule is:
High-Achieving “Overall” Schools in Arkansas
High-Achieving Elementary Schools By Grade Level and By Region
High-Achieving Middle Schools By Grade Level and By Region
High-Achieving High Schools
Beating the Odds: High-Achieving Schools Serving Low-Income Communities
Most Improved Schools
Stay tuned over the next ten weeks to see which schools in your area are recognized for our OEP
Awards!
Outstanding Educational Performance Awards 2014 Page 8
II. 2014 OEP AWARDS: HIGH-ACHIEVING ELEMENTARY SCHOOLS BY
GRADE LEVEL AND BY REGION This section provides a deeper look at the high-achieving elementary schools and grades within
schools based on the Arkansas Benchmark exam.1 The Benchmark exams in math and literacy
were administered to students in grades 3-8 in April 2014.
Because we already listed our overall top-performing elementary schools in Section I of the OEP
Awards, we move directly into listing the top-performing elementary schools by grade. We then
highlight the top-performing elementary schools and grades within schools in each region.2 Each
table presents the high-achieving schools for the noted grade and subject. These tables include
the region in which the school is located, the number of test takers, the percent of students
scoring at the proficient and advanced levels, and the GPA of the school in that particular
subject.
1 In this section, we highlight the top-performing grade levels for grades three through five. We did not distinguish
between elementary or middle school but simply highlight the top grade levels overall. Therefore, a middle school
may be listed if it includes one of these grades. The next installment of OEP Awards, High-Achieving Middle
Schools by Region, will cover grades six through eight. 2 Schools are divided into five regions in Arkansas: Northwest (NW), Northeast (NE), Central (CN), Southwest
(SW), and Southeast (SE).

Outstanding Educational Performance Awards 2014 Page 9
C. Elementary Math by Grade, 2014 Table 5: Top 10 Arkansas Schools: Grade Three Math Achievement
Indicates school placed on list in 2012-13.
School (District) Region
# of
Test
Takers
%
Proficient/
Advanced
GPA
1 Skyline Heights Elementary School
(Harrison)
NW 75 100% 3.92
2 Evening Shade Elementary School
(Cave City)
NE 11 100% 3.91
3 Viola Elementary School (Viola) NE 27 100% 3.89
4 Caddo Hills Elementary School
(Caddo Hills)
SW 33 100% 3.88
4 Gillett Elementary School (DeWitt) SE 16 94% 3.88
4 Salem Elementary School (Salem) NE 50 98% 3.88
4 Spring Hill Elementary School
(Spring Hill)
SW 32 97% 3.88
8 Forest Heights Elementary School (Harrison) NW 76 99% 3.86
9 Concord Elementary School (Concord) NE 20 95% 3.85
9 Eagle Heights Elementary School (Harrison) NW 39 98% 3.85

Outstanding Educational Performance Awards 2014 Page 10
Table 6: Top 10 Arkansas Schools: Grade Four Math Achievement
School (District) Region # of Test
Takers
%
Proficient/
Advanced
GPA
1 Park Magnet School (Hot Springs) CN 44 100% 3.91
2 Mount Pleasant Elementary School
(Melbourne)
NE 26 100% 3.77
2 Norfork Elementary School (Norfork) NW 26 96% 3.77
4 Vandergriff Elementary School
(Fayetteville)
NW 108 94% 3.76
5 Northwest Arkansas Classical Academy
(Northwest Arkansas Classical Academy)
NW 45 94% 3.74
6 Euper Lane Elementary School (Fort
Smith)
NW 53 97% 3.71
7 Central Park at Morning Star Elementary
School (Bentonville)
NW 138 97% 3.70
8 Don Roberts Elementary School (Little
Rock)
CN 149 93% 3.69
9 Academy of Technology (Vilonia) CN 28 100% 3.68
10 Forest Park Elementary School (Little
Rock)
CN 72 93% 3.67
Outstanding Educational Performance Awards 2014 Page 11
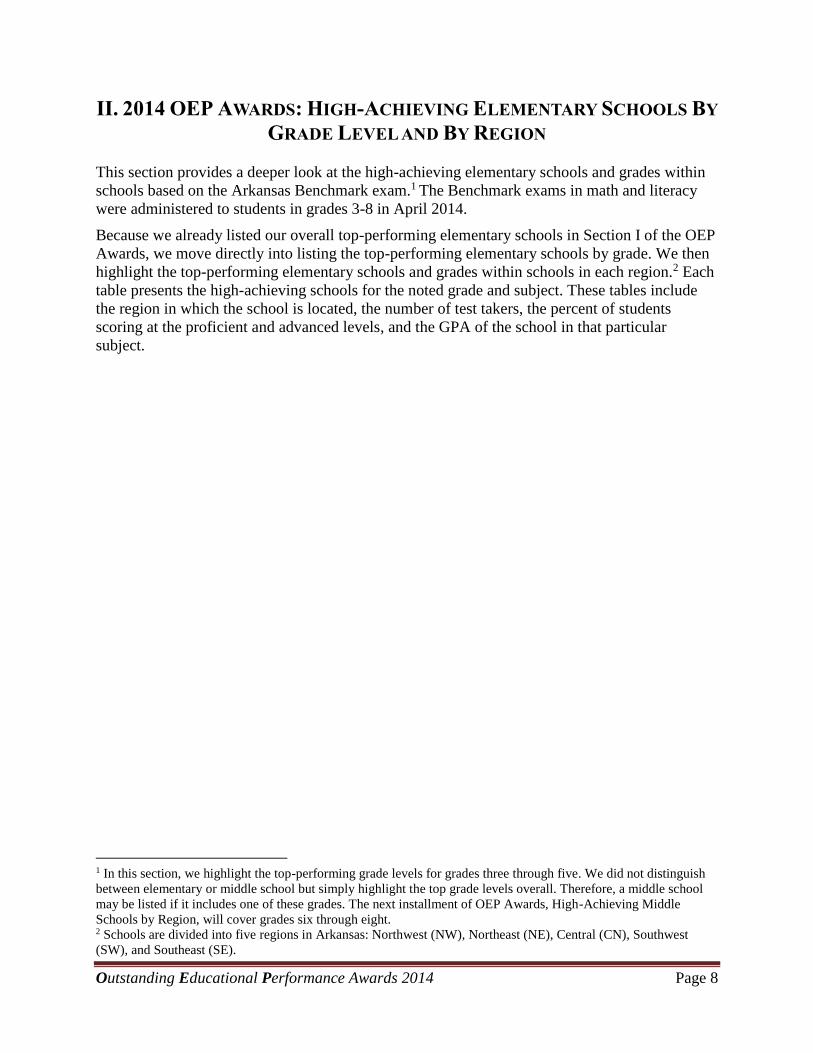
Table 7: Top 10 Arkansas Schools: Grade Five Math Achievement
School (District) Region
# of
Test
Takers
%
Proficient/
Advanced
GPA
1 Mount Pleasant Elementary School
(Melbourne)
NE 26 100% 4.00
2 Vandergriff Elementary School
(Fayetteville)
NW 104 96% 3.63
3 Hardin Elementary School (White Hall) CN 32 97% 3.56
3 Richland Elementary School (West
Memphis)
NE 79 96% 3.56
5 Des Arc Elementary School (Des Arc) SE 41 95% 3.53
6 Eastside Elementary School (Rogers) NW 97 94% 3.51
7 Salem Elementary School (Salem) NE 62 95% 3.50
8 Root Elementary School (Fayetteville) NW 81 94% 3.49
9 Marvell-Elaine Elementary School
(Marvell)
SE 35 94% 3.48
10 Bernice Young Elementary (Springdale) NW 94 93% 3.47
10 Don Roberts Elementary School (Little
Rock)
CN 122 89% 3.47

Outstanding Educational Performance Awards 2014 Page 12
D. Elementary Literacy by Grade, 2014
Table 8: Top 10 Arkansas Schools: Grade Three Literacy Achievement
School (District) Region # of Test
Takers
%
Proficient/
Advanced
GPA
1 Spring Hill Elementary School (Spring
Hill)
SW 32 101% 3.91
2 Park Magnet School (Hot Springs ) CN 57 97% 3.85
3 Forest Park Elementary School (Little
Rock)
CN 74 96% 3.77
4 Skyline Heights Elementary School
(Harrison)
NW 75 100% 3.76
4 Gillett Elementary School (DeWitt) SE 16 94% 3.76
4 Ellen Smith Elementary School
(Conway)
CN 96 95% 3.76
7 Mammoth Spring Elementary School
(Mammoth Spring)
NE 32 94% 3.75
7 Richland Elementary School (West
Memphis)
NE 71 93% 3.75
9 Nemo Vista Elementary School (Nemo
Vista)
NW 30 97% 3.74
10 Caddo Hills Elementary School (Caddo
Hills)
SW 33 100% 3.73
10 Genoa Central Elementary School
(Genoa Central)
SW 80 97% 3.73
10 Greenbrier Westside Elementary School
(Greenbrier)
CN 77 99% 3.73

Outstanding Educational Performance Awards 2014 Page 13
Table 9: Top 10 Arkansas Schools: Grade Four Literacy Achievement
School (District) Region
# of
Test
Takers
%
Proficient/
Advanced
GPA
1 Park Magnet School (Hot Springs) CN 44 100% 3.93
2 Mount Pleasant Elementary School
(Melbourne)
NE 26 100% 3.88
3 Van-Cove Elementary School
(Cossatot River)
SW 30 100% 3.87
4 Forest Park Elementary School (Little Rock) CN 72 97% 3.86
5 Vandergriff Elementary School (Fayetteville) NW 108 98% 3.82
6 Norfork Elementary School (Norfork) NW 26 100% 3.81
6 Elm Tree Elementary School (Bentonville) NW 117 99% 3.81
6 Janie Darr Elementary School (Rogers) NW 62 97% 3.81
9 Central Park at Morning Star Elementary School
(Bentonville)
NW 138 96% 3.78
10 Don Roberts Elementary School (Little Rock) CN 149 95% 3.75
10 Pottsville Middle Grades (Pottsville) NW 121 95% 3.75
Outstanding Educational Performance Awards 2014 Page 14
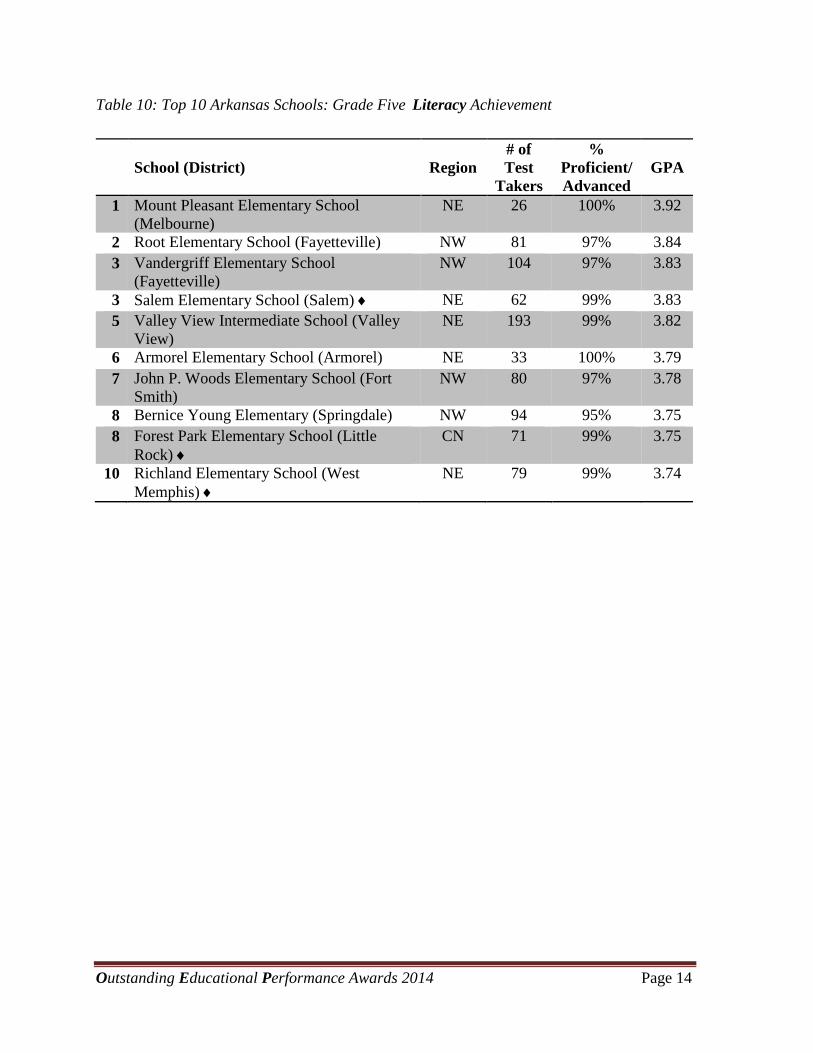
Table 10: Top 10 Arkansas Schools: Grade Five Literacy Achievement
School (District) Region
# of
Test
Takers
%
Proficient/
Advanced
GPA
1 Mount Pleasant Elementary School
(Melbourne)
NE 26 100% 3.92
2 Root Elementary School (Fayetteville) NW 81 97% 3.84
3 Vandergriff Elementary School
(Fayetteville)
NW 104 97% 3.83
3 Salem Elementary School (Salem) NE 62 99% 3.83
5 Valley View Intermediate School (Valley
View)
NE 193 99% 3.82
6 Armorel Elementary School (Armorel) NE 33 100% 3.79
7 John P. Woods Elementary School (Fort
Smith)
NW 80 97% 3.78
8 Bernice Young Elementary (Springdale) NW 94 95% 3.75
8 Forest Park Elementary School (Little
Rock)
CN 71 99% 3.75
10 Richland Elementary School (West
Memphis)
NE 79 99% 3.74

Outstanding Educational Performance Awards 2014 Page 15
The sections below present the high-achieving schools for the noted grade and subject in each
region in 2014.
E. Northwest Region, Elementary Schools, 2014
Table 11: Top 5 Overall Elementary Schools in Northwest Arkansas Based on Benchmark Math
Achievement
School (District) Grades
Served
# of
Test
Takers
%
Proficient/
Advanced
GPA
1 Bob Folsom Elementary School (Farmington) K-3 67 97% 3.82
2 Pottsville Elementary School (Pottsville) K-3 132 97% 3.78
3 Skyline Heights Elementary School (Harrison) K-4 155 96% 3.76
4 Forest Heights Elementary School (Harrison) K-4 154 97% 3.73
5 Central Park at Morning Star Elementary
School (Bentonville)
K-4 307 96% 3.72
Table 12: Top 3 Schools by Grade Level in Northwest Arkansas Based on Benchmark Math
Achievement
School (District)
# of
Test
Takers
%
Proficient/
Advanced
GPA
3rd Grade
1 Skyline Heights Elementary School (Harrison) 75 100% 3.92
2 Forest Heights Elementary School (Harrison) 76 99% 3.86
3 Eagle Heights Elementary School (Harrison) 39 98% 3.85
4th Grade
1 Norfork Elementary School (Norfork) 26 96% 3.77
2 Vandergriff Elementary School (Fayetteville) 108 94% 3.76
3 Northwest Arkansas Classical Academy (Northwest
Arkansas Classical Academy)
45 94% 3.74
5th Grade
1 Vandergriff Elementary School (Fayetteville) 104 96% 3.63
2 Eastside Elementary School (Rogers) 97 94% 3.51
3 Root Elementary School (Fayetteville) 81 94% 3.49

Outstanding Educational Performance Awards 2014 Page 16
Table 13: Top 5 Overall Elementary Schools in Northwest Arkansas Based on Benchmark
Literacy Achievement
School (District) Grades
Served
# of
Test
Takers
%
Proficient/
Advanced
GPA
1 Vandergriff Elementary School
(Fayetteville)
K-5 351 96% 3.77
2 Elm Tree Elementary School (Bentonville) K-4 242 95% 3.72
3 Bernice Young Elementary (Springdale) K-5 280 96% 3.71
3 Root Elementary School (Fayetteville) K-5 250 96% 3.71
3 Skyline Heights Elementary School
(Harrison)
K-4 155 98% 3.71
Table 14: Top 3 Schools by Grade Level in Northwest Arkansas Based on Benchmark Literacy
Achievement
School (District)
# of
Test
Takers
%
Proficient/
Advanced
GPA
3rd Grade
1 Skyline Heights Elementary School (Harrison) 75 100% 3.76
2 Nemo Vista Elementary School (Nemo Vista) 30 97% 3.74
3 Root Elementary School (Fayetteville) 73 96% 3.70
4th Grade
1 Vandergriff Elementary School (Fayetteville) 108 98% 3.82
2 Elm Tree Elementary School (Bentonville) 117 99% 3.81
2 Janie Darr Elementary School (Rogers) 62 97% 3.81
2 Norfork Elementary School (Norfork) 26 100% 3.81
5th Grade
1 Root Elementary School (Fayetteville) 81 97% 3.84
2 Vandergriff Elementary School (Fayetteville) 104 97% 3.83
3 John P. Woods Elementary School (Fort Smith) 80 97% 3.78
Outstanding Educational Performance Awards 2014 Page 17
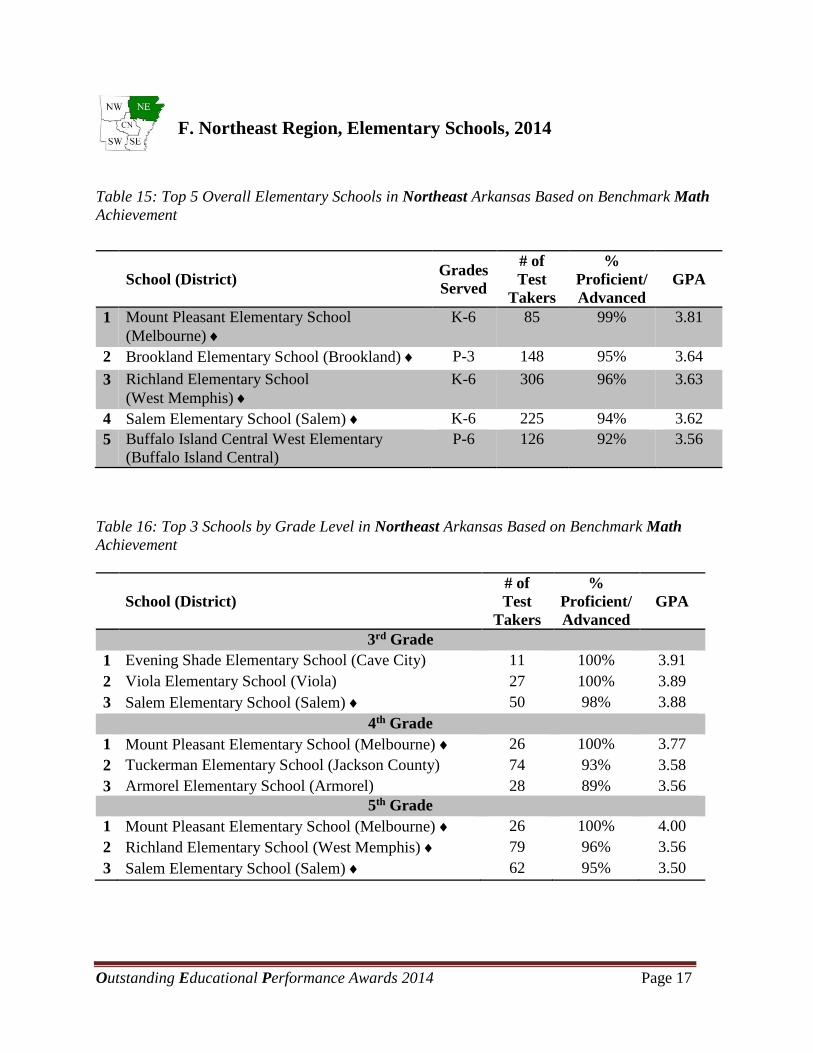
F. Northeast Region, Elementary Schools, 2014
Table 15: Top 5 Overall Elementary Schools in Northeast Arkansas Based on Benchmark Math
Achievement
Table 16: Top 3 Schools by Grade Level in Northeast Arkansas Based on Benchmark Math
Achievement
School (District)
# of
Test
Takers
%
Proficient/
Advanced
GPA
3rd Grade
1 Evening Shade Elementary School (Cave City) 11 100% 3.91
2 Viola Elementary School (Viola) 27 100% 3.89
3 Salem Elementary School (Salem) 50 98% 3.88
4th Grade
1 Mount Pleasant Elementary School (Melbourne) 26 100% 3.77
2 Tuckerman Elementary School (Jackson County) 74 93% 3.58
3 Armorel Elementary School (Armorel) 28 89% 3.56
5th Grade
1 Mount Pleasant Elementary School (Melbourne) 26 100% 4.00
2 Richland Elementary School (West Memphis) 79 96% 3.56
3 Salem Elementary School (Salem) 62 95% 3.50
School (District) Grades
Served
# of
Test
Takers
%
Proficient/
Advanced
GPA
1 Mount Pleasant Elementary School
(Melbourne)
K-6 85 99% 3.81
2 Brookland Elementary School (Brookland) P-3 148 95% 3.64
3 Richland Elementary School
(West Memphis)
K-6 306 96% 3.63
4 Salem Elementary School (Salem) K-6 225 94% 3.62
5 Buffalo Island Central West Elementary
(Buffalo Island Central)
P-6 126 92% 3.56

Outstanding Educational Performance Awards 2014 Page 18
Table 17: Top 5 Overall Elementary Schools in Northeast Arkansas Based on Benchmark
Literacy Achievement
Table 18: Top 3 Schools by Grade Level in Northeast Arkansas Based on Benchmark Literacy
Achievement
School (District)
# of
Test
Takers
%
Proficient/
Advanced
GPA
3rd Grade
1 Mammoth Spring Elementary School (Mammoth
Spring)
32 94% 3.75
1 Richland Elementary School (West Memphis) 71 93% 3.75
3 Armorel Elementary School (Armorel) 26 100% 3.69
4th Grade
1 Mount Pleasant Elementary School (Melbourne) 26 100% 3.88
2 Timbo Elementary School (Mountain View) 11 100% 3.73
3 Calico Rock Elementary School (Calico Rock) 31 97% 3.68
3 Richland Elementary School (West Memphis) 85 97% 3.68
5th Grade
1 Mount Pleasant Elementary School (Melbourne) 26 100% 3.92
2 Salem Elementary School (Salem) 62 99% 3.83
3 Valley View Intermediate School (Valley View) 193 99% 3.82
School (District) Grades
Served
# of
Test
Takers
%
Proficient/
Advanced
GPA
1 Mount Pleasant Elementary School
(Melbourne)
K-6 85 96% 3.73
2 Armorel Elementary School (Armorel) K-6 117 96% 3.65
2 Richland Elementary School
(West Memphis)
K-6 306 95% 3.65
4 Salem Elementary School (Salem) K-6 225 93% 3.63
5 Brookland Elementary School (Brookland) P-3 148 91% 3.57

Outstanding Educational Performance Awards 2014 Page 19
G. Central Region, Elementary Schools, 2014
Table 19: Top 5 Overall Elementary Schools in Central Arkansas Based on Benchmark Math
Achievement
Table 20: Top 3 Schools by Grade Level in Central Arkansas Based on Benchmark Math
Achievement
School (District)
# of
Test
Takers
%
Proficient/
Advanced
GPA
3rd Grade
1 Forest Park Elementary School (Little Rock) 74 98% 3.82
1 Stagecoach Elementary School (Cabot) 84 100% 3.82
3 Julia Lee Moore Elementary School (Conway) 50 98% 3.80
3 Park Magnet School (Hot Springs) 57 98% 3.80
4th Grade
1 Park Magnet School (Hot Springs) 44 100% 3.91
2 Don Roberts Elementary School (Little Rock) 149 93% 3.69
3 Academy of Technology (Vilonia) 28 100% 3.68
5th Grade
1 Hardin Elementary School (White Hall) 32 97% 3.56
2 Don Roberts Elementary School (Little Rock) 122 89% 3.47
3 Williams Magnet Elementary School (Little Rock) 65 86% 3.38
School (District) Grades
Served
# of Test
Takers
%
Proficient/
Advanced
GPA
1 Park Magnet School (Hot Springs) K-5 101 99% 3.85
2 Academy of Technology (Vilonia) 2-4 53 100% 3.64
2 Stagecoach Elementary School (Cabot) K-4 170 94% 3.64
4 Julia Lee Moore Elementary School
(Conway)
K-4 102 93% 3.63
5 Don Roberts Elementary School
(Little Rock)
P-5 409 91% 3.62

Outstanding Educational Performance Awards 2014 Page 20
Table 21: Top 5 Overall Elementary Schools in Central Arkansas Based on Benchmark Literacy
Achievement
Table 22: Top 3 Schools by Grade Level in Central Arkansas Based on Benchmark Literacy
Achievement
School (District)
# of
Test
Takers
%
Proficient/
Advanced
GPA
3rd Grade
1 Park Magnet School (Hot Springs) 57 97% 3.85
2 Forest Park Elementary School (Little Rock) 74 96% 3.77
3 Ellen Smith Elementary School (Conway) 96 95% 3.76
4th Grade
1 Park Magnet School (Hot Springs) 44 100% 3.93
2 Forest Park Elementary School (Little Rock) 72 97% 3.86
3 Don Roberts Elementary School (Little Rock) 149 95% 3.75
5th Grade
1 Forest Park Elementary School (Little Rock) 71 99% 3.75
2 Lakewood Elementary School (North Little Rock) 66 97% 3.68
3 Baker Interdistrict Elementary School (Pulaski
County Special)
89 91% 3.66
3 Hardin Elementary School (White Hall) 32 100% 3.66
3 Magnet Cove Elementary School (Magnet Cove) 41 95% 3.66
School (District) Grades
Served
# of Test
Takers
%
Proficient/
Advanced
GPA
1 Park Magnet School (Hot Springs) K-5 101 98% 3.88
2 Forest Park Elementary School
(Little Rock)
P-5 217 97% 3.79
3 Ellen Smith Elementary School (Conway) K-4 177 95% 3.73
4 Baker Interdistrict Elementary School
(Pulaski County Special)
K-5 242 93% 3.65
5 Hardin Elementary School (White Hall) K-5 121 96% 3.64
Outstanding Educational Performance Awards 2014 Page 21
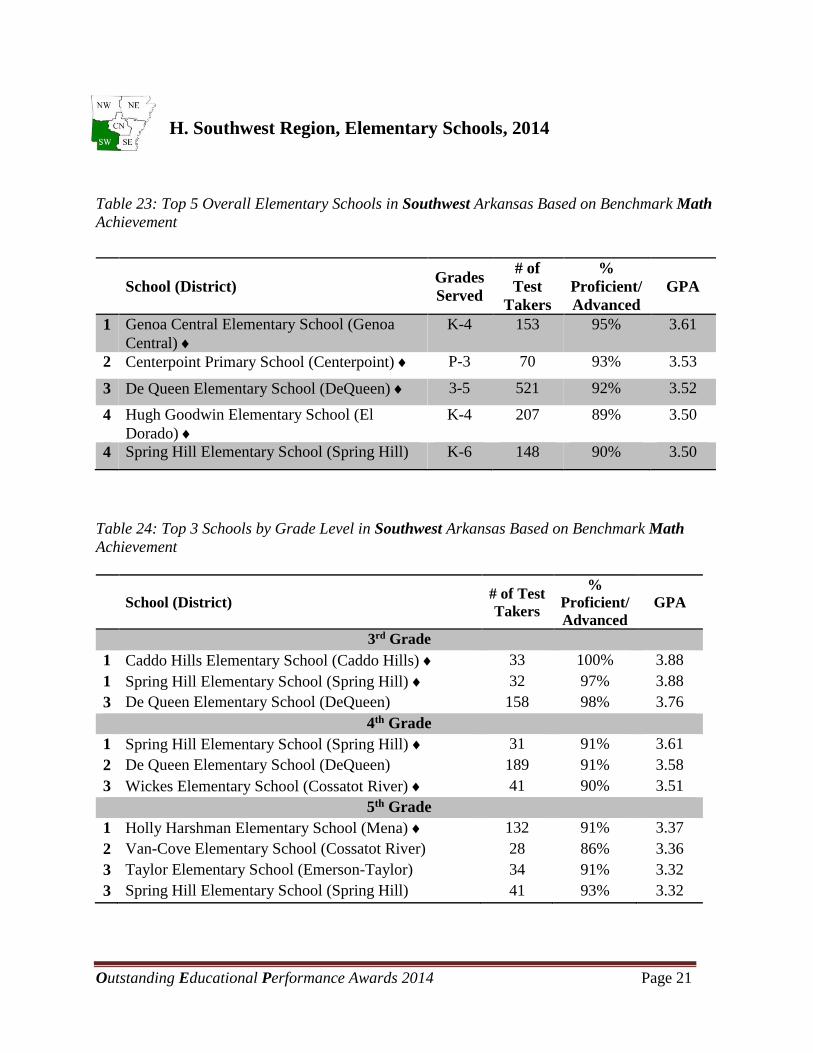
H. Southwest Region, Elementary Schools, 2014
Table 23: Top 5 Overall Elementary Schools in Southwest Arkansas Based on Benchmark Math
Achievement
Table 24: Top 3 Schools by Grade Level in Southwest Arkansas Based on Benchmark Math
Achievement
School (District) # of Test
Takers
%
Proficient/
Advanced
GPA
3rd Grade
1 Caddo Hills Elementary School (Caddo Hills) 33 100% 3.88
1 Spring Hill Elementary School (Spring Hill) 32 97% 3.88
3 De Queen Elementary School (DeQueen) 158 98% 3.76
4th Grade
1 Spring Hill Elementary School (Spring Hill) 31 91% 3.61
2 De Queen Elementary School (DeQueen) 189 91% 3.58
3 Wickes Elementary School (Cossatot River) 41 90% 3.51
5th Grade
1 Holly Harshman Elementary School (Mena) 132 91% 3.37
2 Van-Cove Elementary School (Cossatot River) 28 86% 3.36
3 Taylor Elementary School (Emerson-Taylor) 34 91% 3.32
3 Spring Hill Elementary School (Spring Hill) 41 93% 3.32
School (District) Grades
Served
# of
Test
Takers
%
Proficient/
Advanced
GPA
1 Genoa Central Elementary School (Genoa
Central)
K-4 153 95% 3.61
2 Centerpoint Primary School (Centerpoint) P-3 70 93% 3.53
3 De Queen Elementary School (DeQueen) 3-5 521 92% 3.52
4 Hugh Goodwin Elementary School (El
Dorado)
K-4 207 89% 3.50
4 Spring Hill Elementary School (Spring Hill) K-6 148 90% 3.50

Outstanding Educational Performance Awards 2014 Page 22
Table 25: Top 5 Overall Elementary Schools in Southwest Arkansas Based on Benchmark
Literacy Achievement
Table 26: Top 3 Schools by Grade Level in Southwest Arkansas Based on Benchmark Literacy
Achievement
School (District)
# of
Test
Takers
%
Proficient/
Advanced
GPA
3rd Grade
1 Spring Hill Elementary School (Spring Hill) 32 101% 3.91
2 Caddo Hills Elementary School (Caddo Hills) 33 100% 3.73
2 Genoa Central Elementary School (Genoa Central) 80 97% 3.73
4th Grade
1 Van-Cove Elementary School (Cossatot River) 30 100% 3.87
2 Spring Hill Elementary School (Spring Hill) 31 97% 3.71
3 Taylor Elementary School (Emerson-Taylor) 27 96% 3.66
1 Spring Hill Elementary School (Spring Hill) 41 95% 3.61
2 Gary E. Cobb Middle School (Genoa Central) 77 92% 3.55
3 Fouke Elementary School (Fouke) 78 91% 3.54
School (District) Grades
Served
# of
Test
Takers
%
Proficient/
Advanced
GPA
1 Genoa Central Elementary School (Genoa
Central)
K-4 153 97% 3.66
2 Spring Hill Elementary School
(Spring Hill)
K-6 148 91% 3.49
3 Taylor Elementary School (Emerson-Taylor) K-6 106 91% 3.46
4 De Queen Elementary School (DeQueen) 3-5 521 89% 3.45
5 Prescott Elementary School (Prescott) K-4 152 89% 3.42

Outstanding Educational Performance Awards 2014 Page 23
I. Southeast Region, Elementary Schools, 2014
Table 27: Top 5 Overall Elementary Schools in Southeast Arkansas Based on Benchmark Math
Achievement
Table 28: Top 3 Schools by Grade Level in Southeast Arkansas Based on Benchmark Math
Achievement
School (District)
# of
Test
Takers
%
Proficient/
Advanced
GPA
3rd Grade
1 Gillett Elementary School (DeWitt) 16 94% 3.88
2 Portland Elementary School (Hamburg) 17 95% 3.68
3 Des Arc Elementary School (Des Arc) 27 96% 3.66
4th Grade
1 Des Arc Elementary School (Des Arc) 49 89% 3.54
2 Gillett Elementary School (DeWitt) 15 86% 3.37
3 DeWitt Elementary School (DeWitt) 85 80% 3.22
5th Grade
1 Des Arc Elementary School (Des Arc) 41 95% 3.53
2 Marvell-Elaine Elementary School (Marvell) 35 94% 3.48
3 Kingsland Elementary School (Cleveland County) 12 83% 3.23
School (District) Grades
Served
# of
Test
Takers
%
Proficient/
Advanced
GPA
1 Gillett Elementary School (DeWitt) P-5 31 90% 3.63
2 Des Arc Elementary School (Des Arc) P-6 152 92% 3.54
3 Marvell-Elaine Elementary School (Marvell) P-5 96 85% 3.34
4 Crossett Elementary School (Crossett) P-4 268 80% 3.26
5 Drew Central Elementary School (Drew
Central)
K-4 119 79% 3.23

Outstanding Educational Performance Awards 2014 Page 24
Table 29: Top 5 Overall Elementary Schools in Southeast Arkansas Based on Benchmark
Literacy Achievement
Table 30: Top 3 Schools by Grade Level in Southeast Arkansas Based on Benchmark Literacy
Achievement
School (District)
# of
Test
Takers
%
Proficient/
Advanced
GPA
3rd Grade
1 Gillett Elementary School (DeWitt) 16 94% 3.76
2 Kingsland Elementary School (Cleveland County) 17 89% 3.50
3 Des Arc Elementary School (Des Arc) 27 86% 3.44
4th Grade
1 Portland Elementary School (Hamburg) 23 96% 3.70
2 Gillett Elementary School (DeWitt) 15 93% 3.53
3 Des Arc Elementary School (Des Arc) 49 90% 3.41
5th Grade
1 Kingsland Elementary School (Cleveland County) 12 92% 3.51
2 Woodlawn Elementary School (Woodlawn) 38 87% 3.40
3 Des Arc Elementary School (Des Arc) 41 88% 3.37
This concludes the High-Achieving Elementary Schools Outstanding Educational Performance
Awards. We would like to congratulate ALL of the schools on our high-achieving lists. Our next
installment, High-Achieving Middle Schools, takes a deeper look at middle schools and
highlights schools by grade levels and by regions.
School (District) Grades
Served
# of
Test
Takers
%
Proficient/
Advanced
GPA
1 Gillett Elementary School (DeWitt) P-5 31 94% 3.65
2 Des Arc Elementary School (Des Arc) P-6 152 89% 3.40
3 Portland Elementary School (Hamburg) P-5 61 89% 3.35
4 DeWitt Elementary School (DeWitt) K-5 221 82% 3.27
5 Monticello Intermediate School (Monticello) 3-5 403 82% 3.27

Outstanding Educational Performance Awards 2014 Page A1
APPENDIX A. Methods
The Office for Education Policy strives to make all of our calculations and publications
transparent to our readers. Thus, in this appendix we describe our data source, calculations
performed on these data for the purposes of our reporting, and our method for determining a
school’s classification as an elementary, middle, or high school.
All data used in this report were obtained from the Arkansas Department of Education.
Benchmark and End-of-Course exam scores were obtained from the testing section
(http://www.arkansased.org/divisions/learning-services/student-assessment). Other data, such as
the percent of students eligible for free and reduced lunch, were obtained from the Arkansas
Department of Education Data Center (http://adedata.arkansas.gov).
All data were analyzed at the school level; however, the ADE provides the percentage of scores
at the proficient and advanced level by grade. Therefore, in order to present an accurate school-
level percentage of students scoring proficient and advanced across all grades, a weighted
average for each school was calculated to account for different levels of enrollment at each grade
level. In an effort to highlight schools that were strong in both subject areas, we calculated a
simple average of the school level percent proficient and advanced in math and literacy at the
elementary and middle school levels.
As previously discussed in the introduction, in order to calculate the GPA measure we treat the
benchmark test scores similar to the existing grade point system.
We calculated the GPA measure for every schools math, literacy, and combined math and
literacy scores. The GPA measure is comprehensive in that it takes into account all of the test
score levels (advanced, proficient, basic, and below basic), instead of lumping together advanced
and proficient scores.
Category GPA Points
Awarded
Advanced 4.0
Proficient 3.0
Basic 2.0
Below Basic 1.0

Outstanding Educational Performance Awards 2014 Page A2
B. School Classification
For the OEP Awards, we classified schools based on the following rules:
Elementary School: primarily grades 3-5 (minimum grade P, K, 1, 2, 3, or 4)
Middle School: primarily grades 6-8 (minimum grade of 4, 5, or 6 and maximum grade
of 7, 8, or 9)
There were also a few “comprehensive schools,” such as K-8 or K-12 schools, that we included
as either middle schools or elementary schools based on their enrollment numbers. The following
table lists every grade configuration and their classifications.
Table A: School Classifications
Elementary
Schools
Middle Schools
1-4 4-6
1-5 4-8
1-6 5-6
1-8 5-7
2-3 5-8
2-4 5-9
2-5 5-12
2-6 6
3-4 6-12
3-5 6-7
3-6 6-8
4-5 7-12
5 7-8
K-3 7-9
K-4 8
K-5 8-9
K-6 8-12
K-7
K-8
K-9
K-12
P-2
P-3
P-4
P-5
P-6
P-7
P-8
Top Related