


Languages
Pages
Legal

ARDS, RESPIRATORY FAILURE AND BLOOD BIOMARKERS
Angela Rogers, MD Stanford University
Assistant Professor of Medicine
Friday, January 18, 2019 – 1:55 p.m. – 2:40 p.m.
Angela Rogers, MD, MPH, received her medical degree from Harvard Medical School, and her Masters in public health from the Harvard School of Public Health, and pursued post-graduate training at the Brigham and Women’s Hospital and Harvard Combined fellowship. She is an Assistant Professor in Pulmonary and Critical Care Medicine at Stanford University, where her research focuses on using genetics and genomics to identify novel biology in ARDS.

1/31/2019
1
Precision medicine & the role for biomarkers in ARDS
Angela RogersStanford University
California Thoracic SocietyJanuary 18, 2019
Conflicts of Interest
• I have no conflicts of interest

1/31/2019
2
Learning objectives
• To understand the need for biomarkers in ARDS
• PaO2:FIO2: A biomarker that works in ARDS
• Biomarkers for endotyping or “splitting” ARDS:
– Latent class modeling of plasma
– Molecular phenotyping of edema fluid
ATS Core Curriculum 2016
•Intubated
•Acute
•P:F ratio <300
•Bilateral opacities
•Not explained by hydrostatic edema
ARDS is defined very simply
1/31/2019
3
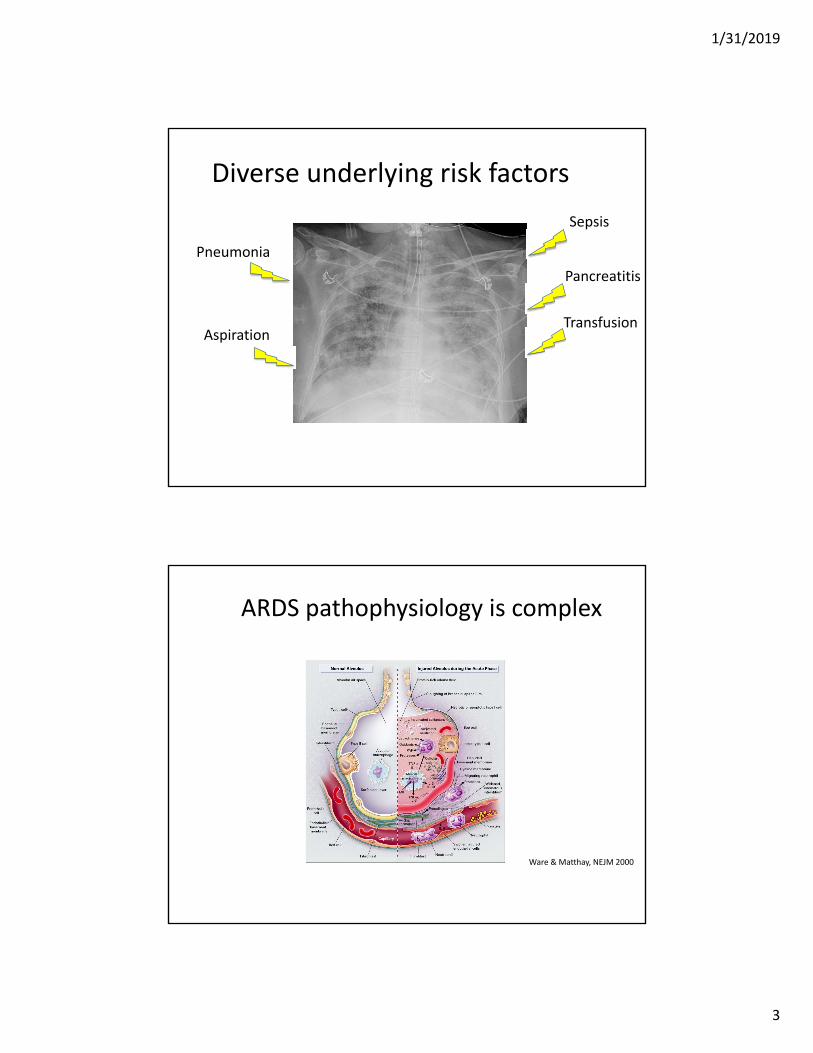
Diverse underlying risk factors
Pneumonia
Aspiration
Pancreatitis
Sepsis
Transfusion
Diverse underlying risk factors
Pneumonia
Aspiration
Pancreatitis
Sepsis
Transfusion
ARDS pathophysiology is complex
Ware & Matthay, NEJM 2000

1/31/2019
4
“Lumping” vs “Splitting”
What have we learned from lumping?• ARDS is common
– 10% of all ICU & 23% of acute respiratory failure admissions
• In real world carries high mortality rate
• Major benefit of low tidal ventilation
Bellani et al, JAMA 2016ARDSNET NEJM 2000Matthay et al. JCI 2012

1/31/2019
5
Biomarkers in all of ARDS
Ware LB, Chest 2010
90-day mortality
Pathway BiomarkerAlive Die p-
value
Inflammation
IL-6 209 322 0.004
IL-8 35 64 <0.001
TNFR 3668 6914 <0.001
Coagulation & fibrinolysis
Protein C 82 68 .011
PAI-1 54 111 <0.001
Endothelial injury
ICAM 854 1072 <0.001
VWF 370 477 <0.001
Epithelial injury SP-D 92 124 .01
Combining biomarkers to improve prediction based on ALVEOLI trial
Ware LB, Chest 2010

1/31/2019
6
Is it possible that lumping all of ARDS together is harming ARDS clinical
trials & science?
• 70 yo F with colon CA on chemo, recently discharged after 1 week admission for failure to thrive
• Per husband, was nauseated, ”gurgling” all night
• Returns to ED critically ill
Why splitting matters: a case to classify

1/31/2019
7

1/31/2019
8
6 pm
ARDS clinical trial enrollment
Live Die
Paralytic
Placebo

1/31/2019
9
ARDS biobank
ARDS Not ARDS
Patient #1
Overnight respiratory improvement
• 9 am: MAP falls to 40, pH 6.8/55/80, c/w bowel perforation
• 6 pm: FIO2 1.0, PEEP 18, Pplat 37, ABG 7.23/60/55
• 3 am: FIO2 0.4, PEEP 8, Pplat 21, ABG 7.23/60/90

1/31/2019
10
What does this case do to our clinical trial and biobank?
Live Die
Paralytic
Placebo
ARDS Not ARDS
Patient #1
Misclassification in ARDS really matters for clinical trials
• Inter‐rater CXR interpretation varies from κ ~.4‐.9
ARDS NotARDS
ARDS 50
Not 50
ARDS Not ARDS
ARDS 40 10
Not 10 40
Κ = 1 Κ = .6
ARDS Not ARDS
ARDS 40 20
Not 10 30
Κ = .4
Rubenfeld et al. Chest 1999

1/31/2019
11
Power for clinical trials dramatically falls with misclassification
Sjoder et al. Annals ATS 2016
RCT power estimate when ARDS enrollment is imperfect from a patient cohort with 25% ARDS prevalence

1/31/2019
12
• Prognostic: Identify patients at highest risk of bad outcomes and death
• Predictive: Identify patients who would benefit most from treatment
A major role for biomarkers may be in “Splitting” ARDS
PaO2:FIO2 ratio as a critical ARDS biomarker
• PaO2:FIO2
– P:F ratio defines disease severity
• Prognostic, outperforms other, more complex models
– Enriches clinical trials: recruiting based on more stringent thresholds
• Predictive enrichment
AECC consensus conf, AJRCCM 1994Berlin definition, JAMA 2014

1/31/2019
13
P:F <150 positive clinical trials
Lower hazard for death (.68, p=.04)
31.6% vs 40.7% 90‐day mortality (p=.08)
NEJM. 2010, 373: 1107-16
Cisatricurium
Placebo
Days since enrollment
Neuromuscular blockade
Probab
ility of Su
rvival
16% vs 32.8% 28d mortality (p<.001)
23.6 vs 41% 90d mortality (p<.001)
Days since enrollment
Prone
Supine
NEJM. 2013, 368: 2159-67
Prone positioning
Biomarkers for splitting
ARDSARDS
ARDS
ARDS
ARDSARDS
ARDS
ARDS
ARDSARDS
ARDSARDS
ARDS
ARDSARDS
ARDS
ARDS
ARDS
ARDS
ARDS
ARDS
ARDS
ARDS
ARDS
ARDS
ARDS
ARDS
ARDS
ARDSARDS
ARDS
ARDS
Expected mortality
N
ARDS
ARDS
ARDS
ARDS
ARDS
ARDS
ARDSARDS ARDS
ARDS
ARDS
ARDS
ARDS
ARDS
ARDS
Median expected mortality: .3
ARDS
ARDS
ARDS
ARDSARDS
ARDS
ARDS

1/31/2019
14
Biomarkers for splitting
ARDS
ARDSARDSARDS
ARDS
ARDS
ARDSARDS
ARDSARDS
ARDSARDS
ARDS
ARDSARDS
ARDS
ARDS
ARDSARDS
ARDS
ARDS
ARDSARDS
ARDS
ARDS
Expected mortality
N
ARDS
ARDS
ARDSARDS ARDS
ARDS
ARDS
ARDS
ARDS
ARDS
ARDS
ARDS
ARDS
ARDS
ARDS
ARDS
ARDS
ARDS
ARDS
ARDS
ARDS
ARDS
Median expected mortality: .3
ARDS
ARDS
ARDS
ARDS
ARDS
ARDS
ARDS
ARDSARDS
ARDSARDS
ARDS
ARDS
ARDS
2 examples
• Latent class modeling, identified plasma biomarkers
• Metabolomics of pulmonary edema fluid
1/31/2019
15
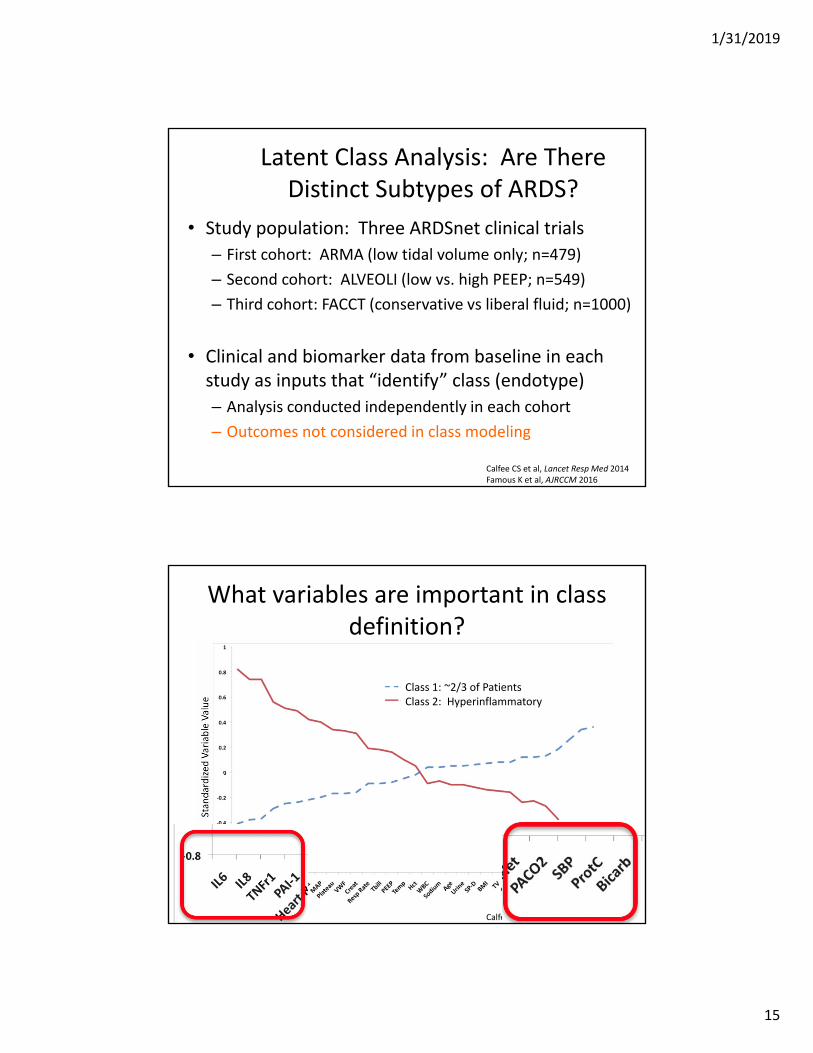
Latent Class Analysis: Are There Distinct Subtypes of ARDS?
• Study population: Three ARDSnet clinical trials
– First cohort: ARMA (low tidal volume only; n=479)
– Second cohort: ALVEOLI (low vs. high PEEP; n=549)
– Third cohort: FACCT (conservative vs liberal fluid; n=1000)
• Clinical and biomarker data from baseline in each study as inputs that “identify” class (endotype)
– Analysis conducted independently in each cohort
– Outcomes not considered in class modeling
Calfee CS et al, Lancet Resp Med 2014Famous K et al, AJRCCM 2016
What variables are important in class definition?
Calfee CS et al, Lancet Resp Med 2014
Class 1: ~2/3 of PatientsClass 2: Hyperinflammatory

1/31/2019
16
Classes differ by clinical variables
Calfee CS et al, Lancet Resp Med 2014
Mortality differs by class
90-day mortality
StudyClass 1 (~2/3) Class 2 (~1/3)
p-value
ARMA 23% 44% 0.006
ALVEOLI 19% 51% <0.001
FACTT 22% 45% <0.0001
Class could be defined w/ >90% AUC with 3 factors: IL8, TNFr1, bicarbonate
ARDS ARDS
Calfee CS et al, Lancet Resp Med 2014Famous K et al, AJRCCM 2016

1/31/2019
17
Response to Therapy differs by class
Mortality in Class 1 ARDS (n=404)
Mortality in Class 2 ARDS (n=145)
Low PEEP 16% 51%
High PEEP 24% 40%
ALVEOLI (pinteraction=.049)
FACCT (pinteraction=.004)Mortality in Class 1
ARDS (n=727)Mortality in Class 2
ARDS (n=273)
Liberal fluid 18% 50%
Conservative fluid
26% 40%
Calfee CS et al, Lancet Resp Med 2014Famous K et al, AJRCCM 2016
Metabolomics of pulmonary edema fluid: ARDS vs CHF

1/31/2019
18
Pulmonary edema fluid metabolomics
• Undiluted pulmonary edema fluid in ARDS– High edema: plasma protein ratio (>.65)
associated with ARDS (AUC >.8)
• Pulmonary edema fluid at time of intubation– 16 ARDS vs 13 CHF– Collected at Vanderbilt and UCSF
Rogers et al. AJP Lung 2017
CHF vs ARDS PhenotypingARDS (N=16) CHF (N=13) P value
Age 43.7 50.5 .3
Gender (%M) 50% 62% .7
Sepsis 44% 0% .008
Mortality 44% 15% .12
PrimaryDiagnosis
Pneumonia (4)Sepsis (4)
Anaphylaxis (2)Aspiration (1)TRALI (2)
Fulm Hep Fail (1)Reperfusion edema
(1)Tumor lysis (1)
Vol overload/CHF (5)
MI/Ischemia (2)Cardiac arrest (1) Post‐obstructive
(2)Cardiogenic shock
(1)TRALI (1)
Neurogenic (1)
.01

1/31/2019
19
Metabolic profiling strategy
• Undiluted pulmonary edema fluid profiled by Metabolon
• Tests up to 3000 human plasma metabolites with high accuracy
• Metabolite levels log2 normalized and auto scaled• Differences in classes assessed using machine learning– Principle components analysis– Partial least squares‐discriminant analysis– Hierarchical clustering
No separation of CHF vs ARDSΔ CHF + ARDS
Rogers et al. AJP Lung 2017

1/31/2019
20
Hierarchical clustering: A subset separates
CHF ARDS
6 Separate ARDS6 Distinct ARDS 10 Remaining ARDS CHF
Age 36 49 51
Gender (%M) 33 60% 62%
Sepsis 66% 30% 0%
Mortality 66% 30% 15%
PrimaryDiagnosis
Sepsis (3)Fulm Hep Fail (1)Anaphylaxis (1)Aspiration (1)
Pneumonia (4)Sepsis (1)
Anaphylaxis (1)TRALI (2)
Reperfusion edema (1)
Tumor lysis (1)
Vol overload/CHF (5)
MI/Ischemia (2)Cardiac arrest (1) Post‐obstructive
(2)Cardiogenic shock
(1)TRALI (1)
Neurogenic (1)

1/31/2019
21
These 6 separate Δ CHF & 10 ARDS + 6 distinct ARDS
Principal Components AnalysisPartial Least Squares DA
These 6 are highly metabolically active
Log2 (Fold Change)
‐Log 1
0(P value)
Rogers et al. AJP Lung 2017

1/31/2019
22
Pulmonary edema: A newly attainable biomarker?
McNeil et al. AJRCCM 2018
Should we be lumping or splitting ARDS?

1/31/2019
23
Should we be lumping AND splitting ARDS?
Should we be lumping AND splitting ARDS?
Low tidal volume, lung protective ventilation• Clearly helps mortality in ARDS
• Little downside in some misclassification

1/31/2019
24
Should we be lumping AND splitting ARDS?
ARDS clinical trials• Genomics tells us we need to be careful with lumping• Endotypes• Frank misclassification
• Kills power of trial & puts patients who can’t benefit at risk
Conclusions
• Lumping all of ARDS as a single phenotype has been very successful for lung protective ventilation and reduced mortality
• For moving toward precision medicine:
– To date our only established biomarker in ARDS is the P:F ratio, which is prognostic and predictive
– Biomarkers will likely be critical in endotypingARDS & moving toward personalized medicine in practice and clinical trials

1/31/2019
25
Top Related