


Languages
Pages
Legal


1
Aquatic macroinvertebrate biodiversity associated with artificial agricultural drainage ditches 1
2
M. J. Hill1, R.P. Chadd2 N. Morris3, J. D. Swaine and P. J. Wood1 3
4
1Centre for Hydrological and Ecosystem Science, Department of Geography, Loughborough 5
University, Loughborough, Leicestershire, LE11 3TU, UK 6
2Environment Agency of England and Wales, Anglian Region, Northern Area, Waterside House, 7
Waterside North, Lincoln, Lincolnshire LN2 5HA, UK. 8
3 Welland and Deepings Internal Drainage Board, Deeping House, Welland Terrace, Spalding 9
PE11 2TD, UK 10
11
Author for correspondence 12
Paul J Wood 13 Department of Geography 14 Loughborough University 15 Loughborough 16 Leicestershire 17 LE11 3TU 18 UK. 19 20 Tel: 00 44 (0)1509 223012 21 Email: [email protected] 22 23
24
25
26
27
28
29

2
Abstract 30
Agricultural drainage channels and ditches are ubiquitous features in the lowland agricultural 31
landscapes, built primarily to facilitate land drainage, irrigate agricultural crops and alleviate flood 32
risk. Most drainage ditches are considered artificial waterbodies and are not typically included in 33
routine monitoring programmes, and as a result the faunal and floral communities they support are 34
poorly quantified. This paper characterizes the aquatic macroinvertebrate diversity (alpha, beta and 35
gamma) of agricultural drainage ditches managed by an internal drainage board in Lincolnshire, UK. 36
The drainage ditches support very diverse macroinvertebrate communities at both the site (alpha 37
diversity) and landscape scale (gamma diversity) with the main arterial drainage ditches supporting 38
greater numbers of taxa when compared to smaller ditches. Examination of the between site 39
community heterogeneity (beta diversity) indicated that differences among ditches were high spatially 40
and temporally. The results illustrate that both main arterial and side ditches make a unique 41
contribution to aquatic biodiversity of the agricultural landscape. Given the need to maintain drainage 42
ditches to support agriculture and flood defence measures, we advocate the application of principles 43
from ‘reconciliation ecology’ to inform the future management and conservation of drainage ditches. 44
45
Key words: drainage channel; invertebrates; wetland habitat; reconciliation ecology; conservation; 46
species richness. 47
48
49
3
Introduction 50
Land drainage improvements across Europe have historically been followed by the large-scale 51
conversion of lowland wetlands to intensive arable production. This has resulted in a wide range of 52
documented changes and adverse effects upon biological communities across terrestrial, riparian and 53
aquatic landscapes (Buisson et al., 2008; Holden et al., 2004; van Eerden et al., 2010; Watson & 54
Ormerod, 2004). Contemporary European wetlands exist as isolated fragments of their former extent, 55
with those that remain largely surrounded by agricultural land (Verdonschot et al., 2011). Wetland 56
habitat loss across Europe is most likely to continue as agricultural intensification, land conversion 57
and water abstraction continue to exert pressure (Maltby & Acreman, 2011). Frequently, the only 58
remaining aquatic habitat/refuges that exist in agricultural landscapes are ponds (e.g., Sayer et al., 59
2012) and drainage ditch networks. However, the potential importance of drainage ditch habitats in 60
supporting aquatic biodiversity, the persistence of wetland floral or faunal communities, or species of 61
conservation interest, has been poorly quantified to date, internationally (Katano et al., 2003; Leslie et 62
al., 2012; Maltchik et al., 2011; Vaikre et al., 2015). 63
Ditches are defined as man-made channels created principally for agricultural purposes, which often 64
follow linear field boundaries, turning at right angles and frequently display little relationship with 65
natural landscape topography (Davies et al., 2008a). Drainage ditches created in lowland agricultural 66
regions often occur in dense networks, characterised by larger main ditches (arterial drainage channels 67
– where flow is preferentially conveyed by gravity or by pumping) and smaller side ditches (smaller 68
channels within which water levels can be controlled by the use of weirs and can be isolated from the 69
main arterial channel; Clarke, 2015). Extensive linear networks of drainage ditches extend over an 70
estimated 128,000 km in the UK (Clare & Edwards, 1983). The primary anthropogenic function of 71
drainage ditches is to convey water to agricultural land, to support crop irrigation during the growing 72
season/dry periods and to divert water away from agriculture and urban infrastructure within towns 73
and villages (flood alleviation) during wetter periods. Agricultural drainage ditches are frequently 74
subject to a range of routine management activities including dredging/ in-channel vegetation 75

4
management and bank vegetation cutting to maintain efficient conveyance of water and reduce flood 76
risks (Clarke, 2015). 77
For EU Water Framework Directive (WFD) purposes, most drainage ditches are classified as either 78
Artificial Water Bodies (AWB), or as Heavily Modified Water Bodies (HMWB) if they follow the 79
course of a pre-existing watercourse (EU, 2000); although the number of designations of AWB and 80
HMWB vary widely between EU nations (Liefferink et al., 2011). Given their importance in 81
supporting the irrigation of crops and flood defence, they are managed primarily as agricultural and 82
flooding alleviation infrastructure. As a result, unlike other lentic and lotic surface waterbodies, their 83
ecology may not be required to be monitored on a regular basis, and there is no obligation for them to 84
achieve the WFD requirement of Good Ecological Status (GES). Instead, the alternative target of 85
Good Ecological Potential (GEP) is applied to AWB and HMWB. This designation reflects the 86
anthropogenic requirements placed upon them, the social and economic benefits of the services they 87
provide, and that it may not be practically or economically possible to modify or change the existing 88
configuration (EU, 2000; Environment Agency, 2009). 89
Agricultural drainage ditches have typically been reported to support lower taxonomic richness 90
compared with other waterbodies (streams, rivers, lakes and ponds), which has been attributed to their 91
close proximity to intensive agricultural activities and the runoff of herbicides, pesticides and 92
fertilisers into them, the latter reducing floral richness with knock-on effects on the fauna (e.g., Davies 93
et al., 2008b; Williams et al., 2003). However, a number of case studies have demonstrated the 94
importance of drainage ditches as reservoirs for aquatic fauna and flora populations (Goulder, 2008; 95
Foster et al., 1990; Painter, 1999; Verdonschot et al., 2011; Whatley et al., 2015). A number of studies 96
have also illustrated that drainage ditches can have significant conservation value, supporting high 97
biodiversity and communities of conservation value, even in intensively cultivated and managed 98
agricultural landscapes (e.g., Armitage et al., 2003; Davies et al., 2008b; Foster et al., 1990; Goulder, 99
2008; Watson & Ormerod, 2004; Williams et al., 2003). Ditches supporting high taxonomic richness 100
typically occur in areas where historic lowland fen occurred and often have continuity with ancient 101
wetlands (Davies et al., 2008b). 102

5
This paper aims to highlight the aquatic macroinvertebrate biodiversity and conservation value 103
associated with lowland agricultural drainage ditches (Artificial Water Bodies) and how recognition 104
of this value can be used to reconcile their anthropogenic function and appearance. We sought to 105
examine the following assumptions: i) main (arterial) drainage ditches will have a lower aquatic 106
macroinvertebrate biodiversity and conservation value than side ditches and: ii) there will be 107
significant spatial (between sites) and temporal (seasonal) heterogeneity in macroinvertebrate 108
communities among agricultural drainage ditches. The differences recorded should reflect local ditch 109
management regimes and the life history of the organisms inhabiting individual ditches. 110
Materials and Methods 111
Study Sites 112
Deeping Fen (TF 17643 17347) is an area of low-lying, intensively cultivated agricultural land 113
encircled by the River Glen and River Welland, Lincolnshire, UK. Historically, Deeping Fen was part 114
of 100,000 ha of wild fenland, but as a result of extensive draining for intensive arable agriculture 115
over several centuries, less than 55 ha of natural fenland remain, representing a loss of 99% (Boyes & 116
Russell, 1977; Wet Fens Partnership, 2015). An extensive network of drainage ditches, river 117
embankments and water pumping systems operate within the Welland and Deepings Internal 118
Drainage Board area. The drainage ditches are surrounded by intensive arable farming and subject to 119
water level management with water pumped from the ditches during periods of high rainfall into the 120
tidal River Welland to reduce flood risk. During the growing season and periods of low precipitation 121
water levels within the ditches are raised through a reduction in pumping, the management of weir 122
boards in side channels to reduce the drainage of water and through a series of valves on the R. 123
Welland and Greatford Cut that allow water into the system. In effect, the drainage ditches are kept 124
artificially low during the winter and raised during the summer to support agricultural irrigation and 125
provide environmental benefits to support the Cross Drain SSSI (Natural England, 2015). This results 126
in highly regulated water levels that are in complete contrast to the pattern displayed in the proximal 127
River Welland. 128
6
A total of 12 sites were surveyed in Deeping Fen on three occasions during 2014, corresponding to 129
spring, summer and winter. Two types of drainage ditch sites were selected: (i) 7 sites on two of the 130
longest main arterial drainage ditches - wider (> 5 m wide) and longer ditches which are connected to 131
a large number of side ditches. The main arterial drainage ditches (North Drove and South Drove 132
Drains) are maintained on an annual basis, with the vegetation on alternate banks cut / mown every 133
year and (ii) 5 side ditches – smaller (< 3 m wide) and shorter ditches connected at either end to a 134
main arterial drainage ditch, but both banks experience maintenance and vegetation management on 135
both banks on an annual basis. In addition, a long-term records collected by the Environment Agency 136
of England and Wales for 3 sites (1989 – 2014) in the drainage network were available. These data 137
provide a long term historical perspective of macroinvertebrate biodiversity within the agricultural 138
drainage ditches. 139
Macroinvertebrate sampling 140
Aquatic macroinvertebrate taxa were sampled using a kick / sweep-sample technique with a standard 141
pond net (mesh size 1 mm) over a three minute period (Armitage et al., 2003; Murray-Bligh, 1999). 142
Aquatic macroinvertebrate samples were collected during each survey (spring - April, summer - June 143
and winter - December) from each site. The samples were preserved in the field in 4% formaldehyde 144
solution and processed into 70% industrial methylated spirits in the laboratory. The majority of faunal 145
groups were identified to species level, although Sphaeriidae were identified to genus, Cladocera, 146
Ostracoda, Oligochaeta, Hydracarina, Collembola and Diptera were recorded as such. 147
Statistical analysis 148
Three measures of ditch aquatic macroinvertebrate diversity were calculated: alpha, beta and gamma 149
diversity. Alpha diversity represents the faunal diversity within an individual sample site, beta-150
diversity characterises the spatial/temporal distribution and heterogeneity in community composition 151
between individual sites within a given area, and gamma diversity represents the overall biodiversity 152
across the entire study region (Anderson et al., 2011; Arellano & Halffter, 2003; Poggio et al., 2010). 153
Taxon richness and abundance was calculated for each ditch site (alpha) using the Species Diversity 154
7
and Richness IV software (Pisces Conservation, 2008). To achieve this, species-abundance data from 155
individual ditches for each season were combined in the final analysis. In addition, macroinvertebrate 156
biodiversity between seasons was also examined. Total aquatic macroinvertebrate diversity (gamma) 157
was calculated by combining species-abundance data from each ditch site. Jaccard’s Coefficient of 158
Similarity (Cj) was calculated in the Community Analysis Package 3.0 program (Pisces Conservation, 159
2004) to quantify beta-diversity. The data was examined to ensure that the data complied with the 160
underlying assumptions of parametric statistical tests (e.g., normal distribution and homogeneity of 161
variances). Where these assumptions were not met, abundance data were log10 transformed. 162
Differences in faunal diversity among ditches (main and side) were examined using one-way analysis 163
of variance (ANOVA) in SPSS (version 21, IBM Corporation, New York). Seasonal differences 164
(nested within ditch type) in macroinvertebrate richness and abundance among the ditch types were 165
examined using a nested analysis of variance (nested ANOVA) with the Sidak post-hoc test used to 166
determine where significant differences between seasons occurred (van de Meutter et al. 2005). 167
One-way analysis of variance was used to statistically assess the differences in Jaccard’s Coefficient 168
of Similarity Cj among main and side ditches. In addition, heterogeneity of macroinvertebrate 169
communities between main and side ditch sites, and season (spring, summer and winter) samples was 170
assessed using Analysis of Similarity (ANOSIM) and summarized using Non-metric 171
Multidimensional Scaling (NMDS) ordination plots (using Bray-Curtis dissimilarity metric) in 172
PRIMER v6 (Clarke & Gorley, 2006). SIMPER analysis was undertaken to determine which taxa 173
contributed most to the seasonal (spring, summer and winter) differences in macroinvertebrate 174
community composition and between site (main/side) differences in taxonomic composition. Faunal 175
abundance data was square root transformed prior to ANOSIM, NMDS and SIMPER analysis. 176
The conservation value of the aquatic macroinvertebrates within each ditch site was determined using 177
the Community Conservation Index (CCI). This incorporates both rarity of macroinvertebrate species 178
at a national scale in the UK and the community richness (see Chadd & Extence, 2004 for further 179
methodological details). CCI can provide the basis for the development of conservation strategies 180
8
when used in conjunction with knowledge of the habitat requirements of target organisms and 181
communities (Chadd & Extence, 2004; Armitage et al. 2012). 182
Results 183
Macroinvertebrate biodiversity 184
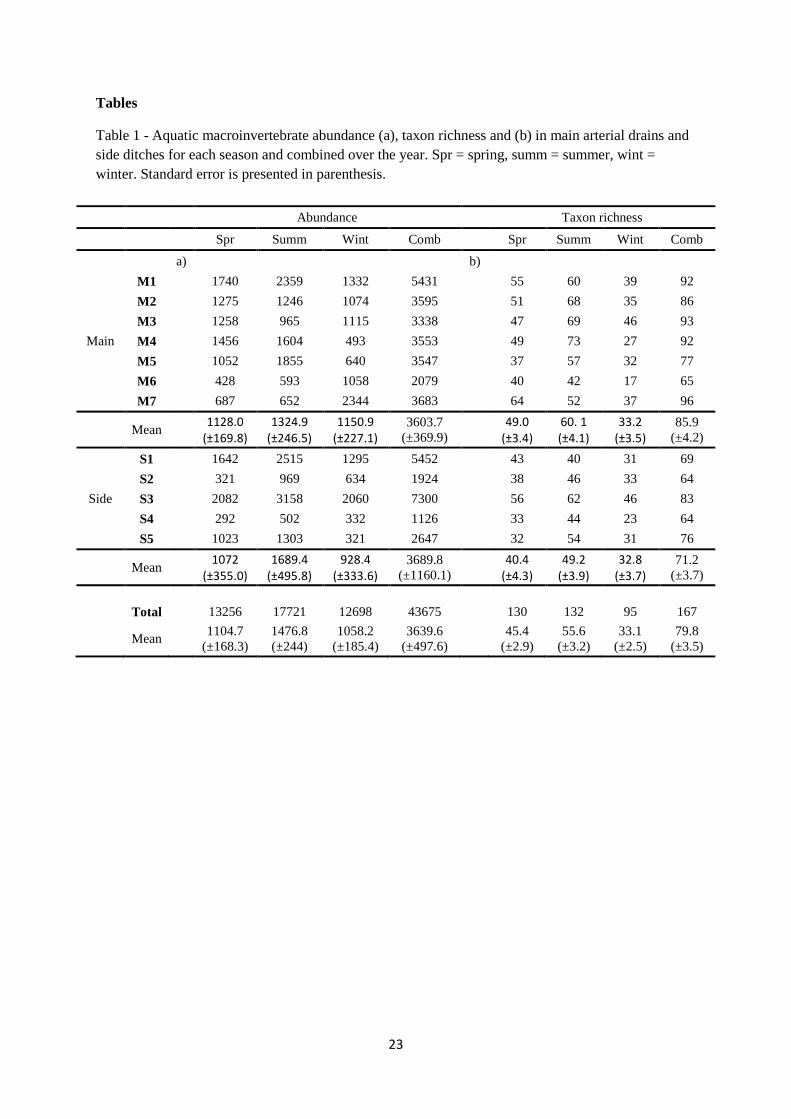
A total of 167 taxa was recorded from the main (total: 150 taxa, mean: 85.9) and side (total: 133 taxa, 185
mean: 71.2) ditch sites during the three surveys in 2014 (Table 1). The largest numbers of taxa were 186
recorded from the orders Coleoptera (53), Gastropoda (27), Trichoptera (19), Hemiptera (17) and 187
Odonata (13). Two non-native taxa, Crangonyx pseudogracilis (Amphipoda) and Potamopyrgus 188
antipodarum (Gastropoda), were both recorded from all 12 study sites. Both species were abundant; 189
C. pseudogracilis accounted for up to 13% of the sample abundance and P. antipodarum accounted 190
for up to 12% of sample abundance. 191
Aquatic macroinvertebrate taxonomic richness was significantly greater within the main arterial 192
ditches when compared with the side ditches (ANOVA F1, 12 = 6.182; p<0.05). The greatest number 193
of taxa (96 taxa) was recorded from a main ditch site whilst the lowest diversity (64 taxa) was 194
recorded from two side ditches. Higher taxonomic richness in the main ditches was driven by a 195
greater richness of Hemiptera, Coleoptera and Trichoptera taxa when compared with the side ditches 196
(Figure 1). No significant difference in aquatic macroinvertebrate abundance among main and side 197
ditches was recorded (p>0.05). 198
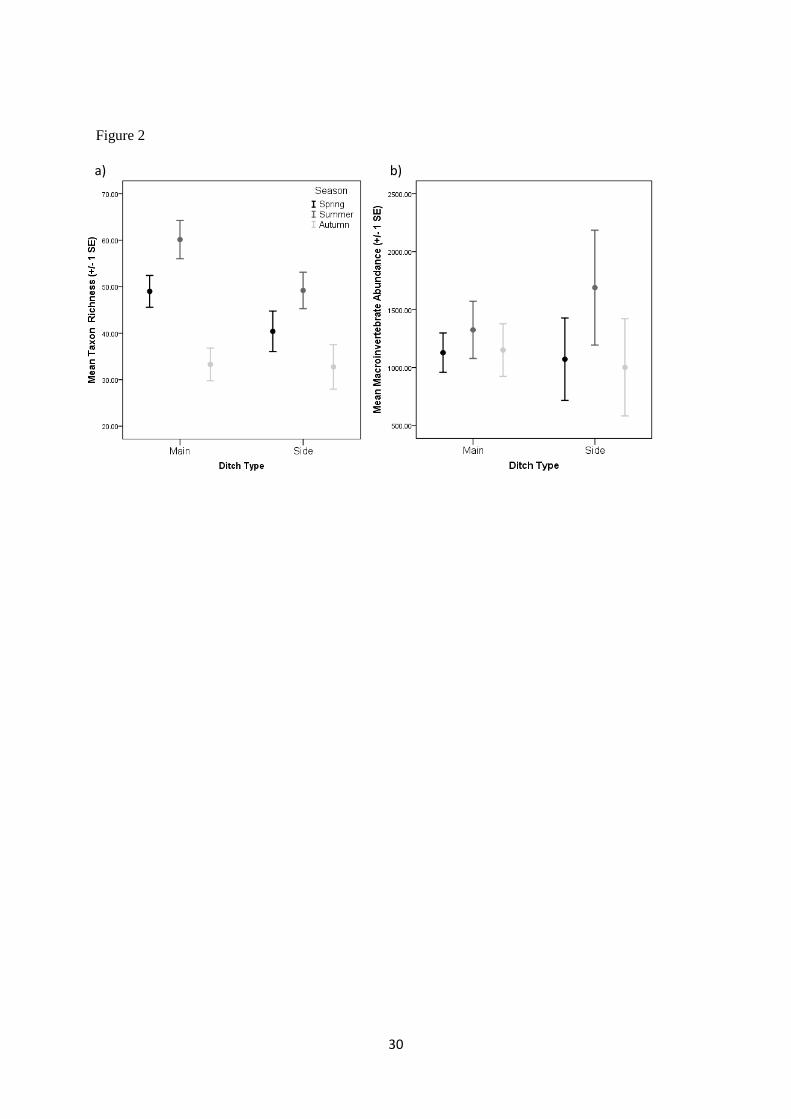
When individual seasons (spring, summer and autumn) were considered, a significant difference in 199
the number of taxa (nested ANOVA F4, 29 = 8.513; p<0.001) was observed among main and side 200
drainage ditches (Figure 2a). Post hoc analysis indicated that macroinvertebrate faunal richness was 201
significantly lower during the winter season than the spring or summer season (Figure 2a). Aquatic 202
Coleoptera (spring = 38 taxa, summer = 40 taxa, winter = 17 taxa), Hemiptera (spring = 13 taxa, 203
summer = 14 taxa, winter = 9 taxa) and Ditpera (spring = 8 taxa, summer = 9 taxa, winter = 4 taxa) 204
taxa displayed a significantly lower richness during the winter season. Aquatic macroinvertebrate 205
9
abundance did not differ among the three seasons (P>0.05) (Figure 2b) or when all seasons were 206
considered (average abundance: 3640 individuals all site; 3604 individuals - main ditches; 3690 207
individuals – side ditches; Table 1). 208
Community heterogeneity 209
A significant difference in community composition was recorded between main and side ditch 210
macroinvertebrate communities for the spring, summer and winter seasons, and when all sampling 211
dates were considered together (ANOSIM p<0.01). This difference resulted in a consistent separation 212
of main and side ditch samples within the NMDS ordination plots. The main ditch sites formed 213
relatively distinct clusters within the NMDS site plots for each of the seasonal surveys (Figures 3a - c) 214
and when all samples from three seasons were combined (Figure 3d). The side ditch sites were more 215
widely dispersed, indicating greater community heterogeneity, although there was some overlap with 216
the main ditch sites during spring (Figure 3a). SIMPER analysis indicated significant community 217
heterogeneity and that differences between main and side ditches was driven by greater abundances of 218
2 gastropods (Radix balthica and Physa fontinalis) in the side ditches and greater abundances of an 219
Ephemeroptera larva (Cloeon dipterum) and an amphipod shrimp (Gammarus pulex) in the main ditch 220
sites (Table 2a). Side ditches had significantly lower Jaccard’s Coefficient of Similarity value during 221
the spring (main Cj = 0.45 side Cj = 0.32), summer (main Cj = 0.48 side Cj = 0.39) and when all 222
sample sites were combined (main Cj = 0.57 side Cj = 0.47) than main channel ditch sites (ANOVA 223
p<0.001) (Table 3). No significant difference in Jaccard’s Coefficient of similarity was recorded 224
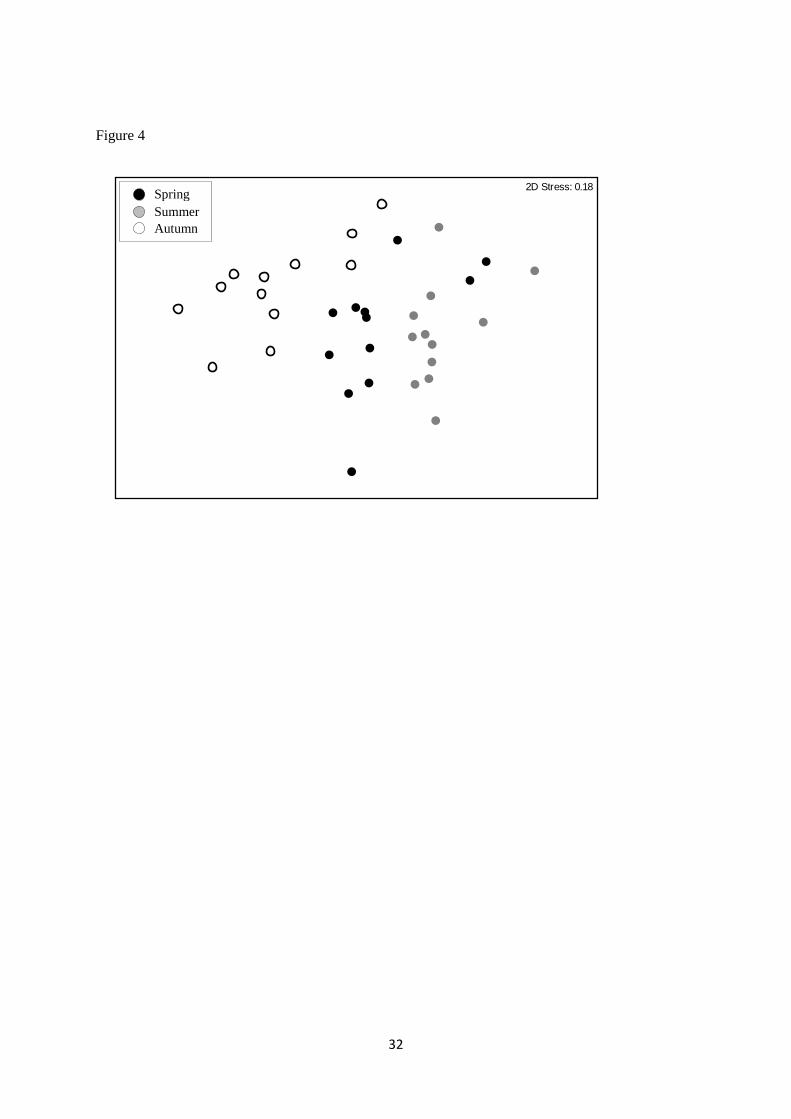
between main and side ditches during winter. 225
When seasonal differences in macroinvertebrate community composition within the drainage ditches 226
over three seasons (spring, summer and winter) were examined using NMDS, clear clusters of 227
samples were identified for samples collected during the spring, summer and winter respectively 228
(Figure 4). In addition, ANOSIM indicated that there were significant differences between spring, 229
summer and winter macroinvertebrate community composition (ANOSIM P<0.01). Seasonal 230
macroinvertebrate heterogeneity was driven by greater abundances of C. dipterum and a freshwater 231
10
shrimp (C. pseudogracilis) during the winter, greater abundances of G. pulex during spring and 232
significantly greater abundances of R. balthica and non-biting midge larvae (Chironomidae) during 233
the summer (Table 2b). 234
Conservation Value 235
Three nationally scarce or nationally notable Coleoptera were identified within the ditch sites; Agabus 236
uliginosus (Dytiscidae) was recorded from a single side ditch, Oulimnius major (Elmidae) was 237
recorded within both main ditches, Scarodytes halensis (Dytiscidae) was recorded from one main and 238
side ditch site and Agabus undulatus (Dytiscidae), listed as Lower Risk - Near Threatened on the 239
IUCN red data list 2001, was recorded from a single side ditch. Based on the CCI scores derived, the 240
macroinvertebrate communities within two ditch sites were of fairly high conservation value (1 main 241
and 1 side ditch), one side ditch was of a high conservation value and a single main drainage ditch 242
was of a very high conservation value (Table 4). No ditches were recorded to have a low conservation 243
value. There was no significant differences in CCI scores between main and side ditches for any 244
season or for the combined dataset (P>0.05). In addition, no significant difference in conservation 245
value between the seasons was recorded (P>0.05). 246
247
Discussion 248
Macroinvertebrate biodiversity and community heterogeneity 249
This study sought to characterise the aquatic macroinvertebrate biodiversity and conservation value of 250
lowland agricultural drainage ditches. The results of the study illustrate that the drainage ditches 251
examined support very high biodiversity at both the individual site (alpha diversity) and landscape 252
scale (gamma diversity), and that there was significant between site heterogeneity (beta diversity). 253
The number of aquatic macroinvertebrate taxa recorded in this study (167 taxa) was markedly higher 254
than that recorded on other studies of drainage ditches in the UK (Davies et al., 2008b) and 255
comparable to other wetland habitats (Williams et al., 2003). When the long-term historical data 256
11
(1989-2014) available for the sites were added to the taxa list from this study, the number of taxa 257
recorded almost doubled to 338 taxa (including 131 Coleoptera, 51 Gastropoda/Bivalvia, 35 258
Hemiptera and 26 Trichoptera). This figure is markedly higher than any other study reported in the 259
UK and second highest among drainage ditch studies of macroinvertebrate biodiversity reported 260
internationally (Table 5). This probably reflects the high connectivity within the drainage network 261
(River Welland and the River Glen) and proximity to remnant fen wetlands (Baston Fen SSSI and 262
Thurlby Fen Nature reserve) and fen restoration projects (Willow Tree Fen nature reserve). 263
Traditional wetland fens in the UK typically support exceptionally high aquatic macroinvertebrate 264
diversity (Eyre et al., 1990; Foster et al., 1990 Painter, 1999; Rouquette & Thompson, 2005). The 265
drainage ditches may effectively function as aquatic corridors through the agricultural landscape, 266
linking natural, semi-natural and artificial habitats (Buisson et al., 2008; Mazerolle, 2004). 267
We assumed that due to more frequent management operations (water level change, dredging, bank 268
cutting), main arterial drainage ditches would support lower macroinvertebrate biodiversity and 269
conservation value than the less frequently managed side ditches. No evidence was found to support 270
this assumption since the side ditches supported significantly lower aquatic macroinvertebrate taxon 271
richness (alpha) than main drainage ditch sites. The management practices, primarily designed to 272
maintain the hydrological functioning (conveyance of water) may actually inadvertently promote and 273
enhance aquatic macroinvertebrate diversity. Ditch cleaning and dredging has been shown to 274
positively influence Trichoptera presence in ditches (Twisk et al., 2000), and dredging can remove 275
nutrient rich sediment (Whatley et al., 2014a) and reset ditch habitats to an earlier successional stages 276
(Clarke, 2015). The rotational management of sites over time means a variety of vegetation 277
successional stages will be present across the sites and collectively these provide a wide range of 278
habitats suitable for macroinvertebrates (Clarke, 2015; Painter et al., 1999). Aquatic macrophytes 279
have been shown to be an important driver of aquatic macroinvertebrate communities (Whatley et al., 280
2014a; Whatley et al., 2014b) and the riparian banks and channel of the main arterial ditches are cut 281
on alternate years. As a result, aquatic macrophytes (submerged and emergent) were present at all 282
sites and able to provide refuge, oxygenation, oviposition and feeding sites for macroinvertebrate taxa 283
12
(Bazzanti et al., 2010; de Szalay & Resh, 2000; Warfe & Barmuta, 2004). The reduced biodiversity 284
recorded in side ditches may reflect the more extensive management strategy (a greater proportion of 285
vegetation cutting and dredging on both banks), despite being managed less frequently. 286
Significant aquatic macroinvertebrate community heterogeneity was recorded between the main and 287
side drainage ditches, and across the three seasons. This supports the second assumption of the study, 288
that there would be significant heterogeneity in macroinvertebrate communities among the main and 289
side drainage ditches. The primary differences in the communities reflects the presence of taxa 290
associated with slow flow and lotic conditions such as the Crustacea G. pulex in the main arterial 291
drains compared to the side ditches which supported much higher abundances of gastropods such as 292
P. fontinalis and R. balthica. The ponding of water in side ditches during the winter and abundance of 293
structurally complex macrophyte communities within them provide ideal habitats and conditions for 294
gastropods (Bronmark, 1985; Hinojosa-Garro et al., 2010). However, invertebrate communities 295
among side ditches were more heterogeneous than the main drainage ditches; Jaccard’s Similarity was 296
lower for side ditches than main arterial drainage ditches. This reflects the wider range of successional 297
stages present across side ditches (from freshly managed to largely vegetation) when compared to the 298
main arterial ditches where one bank was always vegetated. The high seasonal heterogeneity recorded 299
reflects the life-cycle characteristics and natural seasonal variability of aquatic macroinvertebrate 300
communities and reflects the pattern recorded in other freshwater systems. 301
Conservation value and management of the resource 302
Biodiversity conservation in many regions currently relies on designated protected areas (e.g., nature 303
reserves) (Mainstone, 2008; McDonald et al., 2008; Twisk et al., 2000). Protected area legislation, at a 304
national and European scale largely concentrates on the identification and selection of the best 305
examples of natural or semi-natural habitats. Within these protected areas adverse anthropogenic 306
stressors are minimised and the deterioration of ‘target’ habitat conditions can be avoided (Mainstone, 307
2008). However, agricultural activities and urban expansion are projected to threaten the flora and 308
fauna within many of these protected areas (Guneralp & Seto, 2013). As a result, habitat, biodiversity 309

13
of species conservation strategies should not depend exclusively on protected areas (Chester & 310
Robson, 2013) and opportunities to enhance them should be taken wherever possible. 311
It is increasingly recognised that the long-term conservation of habitats and species requires new / 312
novel approaches. The use of management strategies to increase the physical diversity of 313
anthropogenic habitats has begun to be used in some aquatic systems as a means to support native 314
flora and fauna (therefore promoting and enhancing biodiversity) whilst not reducing the effectiveness 315
of their primary anthropogenic function (Moyle, 2014). The management and conservation of 316
agricultural drainage ditches represent a prime example of a location where the principles of 317
‘reconciliation ecology’ (sensu Rosenzweig, 2003) could be applied for the mutual benefit of societal 318
requirements and conservation of natural resources. Reconciliation ecology 319
‘…discovers how to modify and diversify anthropogenic habitats so that they harbour a wide 320
variety of wild species. In essence, it seeks to give many species back their geographical 321
ranges without taking away ours’ (Rosenzweig, 2003, p.37). 322
Reconciliation ecology acknowledges that humans increasingly dominate many ecosystems, 323
especially agricultural landscapes (Rosenzweig, 2003), and that society has a responsibility to 324
determine what it wants these systems to look like aesthetically, how they function and what target 325
species we want them to support. If more widely accepted and adopted, reconciliation ecology could 326
provide a framework for supporting future conservation of biota within habitats that are increasingly 327
anthropogenically modified or dominated (Chester & Robson, 2013; Dudgeon et al. 2006; 328
Rosenzweig, 2003). 329
It has been widely acknowledged that many agricultural practices and land use patterns, especially 330
those of traditional agriculture, are already compatible with supporting biodiversity and agricultural 331
production (Benayas & Bullock, 2012), even if this has occurred consequentially rather than by 332
design. Therefore, there is a strong case to suggest that the principles of reconciliation ecology are 333
already in operation at the drainage ditch sites examined in this study since they support diverse 334
macroinvertebrate communities (alpha and gamma diversity) and support a number of aquatic 335
macroinvertebrate taxa with conservation designations. The CCI indicated that 2 drainage ditches 336
14
were of high or very high conservation value. These findings support some previous research on 337
drainage ditches which have illustrated their importance for biodiversity conservation in agricultural 338
areas (Armitage et al., 2003; Clarke, 2015; Davies et al., 2008b; Foster et al., 1990; Watson & 339
Ormerod, 2004; Williams et al., 2003). In many areas there have been calls and incentives for de-340
intensification of agricultural land to reverse the decline in biodiversity through the use of voluntary 341
agri-environment schemes (Davies et al., 2008a). Agri-environment schemes in the UK aim to reduce 342
the widespread pollution of aquatic systems in agricultural landscapes typically through the 343
development of buffer strips. These are effectively narrow bands of land (buffers) surrounding aquatic 344
habitats left free from agricultural production and to absorb nutrients and chemical run-off (Davies et 345
al., 2009). However, while this may be an option in low productivity and on land of marginal 346
agricultural value, in highly productive and agricultural intensive landscapes this is not a realistic or 347
economically viable option. In addition, it may be more difficult to legitimise and implement when 348
the waterbodies in question are designated as artificial or heavily modified waterbodies (AWB or 349
HMWB) under the EU Water Framework Directive and little pre-existing information regarding their 350
ecological value is available. 351
Reconciliation ecology may provide an alternative practical approach to maintain, protect and 352
enhance aquatic biodiversity in agricultural areas. Ditches are well suited to reconciliation ecology 353
and many already support significant taxonomic richness (Armitage et al., 2003; Verdonschot et al., 354
2011). Only small modifications to management (e.g., cut bank sides on alternate years) can 355
significantly enhance aquatic alpha and gamma diversity and conservation value in agricultural 356
landscapes (Twisk et al., 2000) whilst not reducing the anthropogenic utility of ditches. Given there 357
will be no loss of agricultural land or change to the primary function of the ditches (irrigation and 358
flood risk management), only very minor changes to existing management strategies and no/very low 359
financial costs, land managers and farmers may be more willing to implement reconciliation ecology 360
approaches to protect or enhance biodiversity than agri-environment schemes. However, given that 361
linear agricultural drainage ditch habitats are often the only remaining freshwater habitat in many 362
agricultural landscapes a greater appreciation and understanding of the wildlife resource (biodiversity) 363
15
associated with them is required to provide evidence to underpin future management strategies to 364
maximise the dual utility/benefits of drainage ditches for anthropogenic purposes and aquatic 365
biodiversity. 366
In the absence of formal legislative protection (the Water Framework Directive and Habitats Directive 367
overlook ditches) the ecology of large networks of agricultural drainage ditches are currently 368
unknown, ignored and potentially under threat. In some intensively farmed landscapes, drainage 369
ditches are being increasingly replaced by sub-surface drainage pipes to increase crop yield (Herzon 370
& Helenius, 2008). Land managers, farmers, environmental regulators and policy makers need to 371
recognise the conservation value and biological importance of drainage ditches as one of the last 372
remaining aquatic habitats and refuges available in agricultural areas and, where appropriate, provide 373
protection for most valuable sites. 374
375
Acknowledgements 376
The authors would like to thank Welland and Deepings Internal Drainage Board for their permission 377
to access sites. The authors would also like to thank Malcolm Doubleday for his guidance around the 378
fen during site selection. PJW acknowledges the support of a Loughborough University, School of 379
Social, Political and Geographical Sciences research grant to support the research presented in this 380
paper. 381
382
References 383
Anderson, M.J., T.O. Crist, J.M. Chase, M. Vellend, B.D. Inouye, A.L. Freestone, N.J. Sanders, H.V. 384
Cornell, L.S. Comita, K.F. Davies, S.P. Harrison, N.J.R. Kraft, J.C. Stegen & N.G. Swenson, 385
2011. Navigating the multiple meanings of β diversity: a road map for the practicing ecologist. 386
Ecology Letters 14: 19-28. 387
16
Armitage, P.D., A. Hawczak & J.H. Blackburn, 2012. Tyre track pools and puddles – Anthropogenic 388
contributors to aquatic biodiversity. Limnologica 42: 254-263. 389
Armitage, P.D., K. Szoszkiewicz, J.H. Blackburn & I. Nesbitt, 2003. Ditch communities: a major 390
contributor to floodplain diversity. Aquatic Conservation: Marine and Freshwater Ecosystems 391
13: 165-185. 392
Arellano, L. & G. Halffter, 2003. Gamma diversity: derived from and a determinant of alpha diversity 393
and beta diversity. An analysis of three tropical landscapes. Acta Zoologica Mexicana 90: 27-394
76. 395
Bazzanti, M., C. Coccia, Giuseppina & M. Dowgiallo, 2010. Microdistribution of macroinvertebrates 396
in a temporary pond of Central Italy: taxonomic and functional analyses. Limnologica 40: 291-397
299. 398
Benayas, J.M.R. & J.M. Bullock, 2012. Restoration of biodiversity and ecosystem services on 399
agricultural land. Ecosystems 15: 883-899 400
Boyes, J. & R. Russell, 1977. The canals of Eastern England. David and Charles, UK. 401
Brönmark, C. 1985. Freshwater snail diversity: effects of pond area, habitat heterogeneity and 402
isolation. Oecologia 67: 127-131. 403
Buisson, R.S.K., P.M. Wade, R.L. Cathcart, S.M. Hemmings, C.J. Manning & L. Mayer, 2008. The 404
Drainage Channel Biodiversity Manual: Integrating Wildlife and Flood Risk Management. 405
Association of Drainage Authorities and Natural England: Peterborough. 406
Chadd, R. & C. Extence, 2004. The conservation of freshwater macroinvertebrate populations: a 407
community based classification scheme. Aquatic Conservation: Marine and Freshwater 408
Ecosystems 14: 597-624. 409
Chester, E.T. & B.J. Robson, 2013. Anthropogenic refuges for freshwater biodiversity: Their 410
ecological characteristics and management. Biological Conservation 166: 64-75. 411

17
Clare, P. & R.W. Edwards, 1983. The macroinvertebrate fauna of the drainage channels of the Gwent 412
Levels, South Wales. Freshwater Biology 13: 205-225. 413
Clarke, K.R. & R.N. Gorley, 2006. PRIMER v6: User Manual/Tutorial. PRIMER E-Ltd: Plymouth, 414
UK. 415
Clarke, S.J. 2015. Conserving freshwater biodiversity: The value, status and management of high 416
quality ditch systems. Journal for Nature Conservation 24: 93-100. 417
Davies, B.R., J. Biggs, P.J. Williams, T.J. Lee & S. Thompson, 2008a. A comparison of the 418
catchment sizes of rivers, streams, ponds, ditches and lakes: implications for protecting aquatic 419
biodiversity in an agricultural landscape. Hydrobiologia 597: 7-17. 420
Davies, B., J. Biggs, P. Williams & S. Thompson, S. 2009. Making agricultural landscapes more 421
sustainable for freshwater biodiversity: a case study from southern England. Aquatic 422
Conservation: Marine and Freshwater Ecosystems 19: 439-447. 423
Davies, B,R., J. Biggs, P. Williams, M. Whitfield, P. Nicolet, D. Sear, S. Bray & S. Maund, 2008b. 424
Comparative biodiversity of aquatic habitats in the European agricultural landscape. 425
Agriculture. Ecosystems and Environment 125: 1-8. 426
de Szalay, F.A & V.H. Resh, 2000. Factors influencing macroinvertebrate colonization of seasonal 427
wetlands: responses to emergent plant cover. Freshwater Biology 45: 295-308. 428
Dudgeon, D., A.H. Athington, M.O. Gessner, Z. Kawabata, D.J. Knowler, C. Leveque, R.J. Naiman, 429
A. Prieur-Richard, D. Soto, M.L.J. Stiassy & C.A. Sullivan, 2006. Freshwater biodiversity: 430
importance, threats, status and conservation challenges. Biological Reviews 81: 163-182. 431
EU, 2000. Directive 2000/60/EC of the European Parliament and of the Council of 23 October 2000 432
establishing a framework for Community action in the field of water policy, 22/12/2000. 433
Official Journal L 327: 1-73. 434
Environment Agency, 2009. River Basin Management Plan, Anglian River Basin District Annex I: 435
Designating artificial & heavily modified water bodies. Environment Agency, UK. 436

18
Eyre, M.D., G.N. Foster & A.P. Foster, 1990. Factors affecting the distribution of water beetle species 437
assemblages in drains of eastern England. Journal of Applied Ecology 109: 217-225. 438
Foster, G.N., A.P. Foster, M.D. Eyre & D.T. Bilton, 1990. Classification of water beetle assemblages 439
in arable fenland and ranking of sites in relation to conservation value. Freshwater Biology 22: 440
343-354. 441
Goulder, R., 2008. Conservation of aquatic plants in artificial watercourses: are drains a substitute for 442
vulnerable navigation canals? Aquatic Conservation: Marine and Freshwater Ecosystems 18: 443
163-174. 444
Guneralp, B., & K.C. Seto, 2013. Futures of global urban expansion: uncertainties and implications of 445
biodiversity conservation. Environmental Research Letters 8: 1-10. 446
Herzon, I., & J. Helenius, 2008. Agricultural drainage ditches, their biological importance and 447
functioning. Biological Conservation 141: 1171-1183. 448
Hinojosa-Garro, D., C.F. Mason & G.J.C. Underwood, 2010. Influence of macrophyte spatial 449
architecture on periphyton and macroinvertebrate community structure in shallow waterbodies 450
under contrasting land management. Fundamental and Applied Limnology 177: 19-37. 451
Holden, J., P.J. Chapman & J.C. Labadz, 2004. Artificial drainage of peatlands: hydrological and 452
hydrochemical processes and wetland restoration. Progress in Physical Geography 28: 95-123. 453
Katano, O., K. Hosoya, K. Iguchi, M. Yamaguchi, Y. Aonuma & S. Kitano, 2003. Species diversity 454
and abundance of freshwater fishes in irrigation ditches around rice fields. Environmental 455
Biology of Fishes 66: 107-121. 456
Langheinrich, U., S. Tischew, R.M. Gersberg &V. Lüderitz, 2004. Ditches and canals in management 457
of fens: opportunity or risk? A case study in the Drömling Natural Park, Germany. Wetland 458
Ecology and Management 12: 429-445. 459
19
Leslie, A.W., R.F. Smith, D.E. Ruppert, K. Bejleri, J.M. McGrath, B.A. Needelman & W.O. Lamp, 460
2012. Environmental factors structuring benthic macroinvertebrate communities of agricultural 461
ditches in Maryland. Environmental Entomology: 41: 802-812. 462
Liefferink, D., M. Wiering & Y. Uitenboogaart, 2011. The EU Water Framework Directive: A multi-463
dimentional analysis of implementation and domestic impact. Land Use Policy 28: 712-722. 464
Mainstone, C P., 2008. The role of specially designated wildlife sites in freshwater conservation – an 465
English perspective. Freshwater Reviews 1: 89-98. 466
Maltby, E. & M.C. Acreman, 2001. Ecosystem services of wetlands: pathfinder for a new paradigm. 467
Hydrological Sciences Journal 56: 1341-1359. 468
Maltchik, L., A. Silvia Rolon, C. Stenert, I. Farina Machado & O. Rocha, 2011. Can rice field 469
channels contribute to biodiversity conservation in Southern Brazilian wetlands? Revista de 470
Biología Tropical 59: 1895-1914. 471
Mazerolle, M.J., 2004. Drainage ditches facilitate frog movements in a hostile landscape. Landscape 472
Ecology 20: 579-590. 473
McDonald R.I., P. Kareiva & R.T.T. Forman, 2008. The implications of current and future 474
urbanization for global protected areas and biodiversity conservation. Biological Conservation 475
141: 1695-1703. 476
Moyle, P.B., 2014. Novel aquatic ecosystems: the new reality for streams in California and other 477
Mediterranean climate regions. River Research and Applications 30: 1335-1344. 478
Murray-Bligh J., 1999. Procedures for collecting and analysing macroinvertebrate samples—BT001 . 479
The Environment Agency: Bristol. 480
Natural England. 2015. SSSI citation for Cross Drain. 481
http://www.sssi.naturalengland.org.uk/citation/citation_photo/1003003.pdf (Accessed 482
31/07/15). 483
20
Painter, D., 1999. Macroinvertebrate distributions and the conservation value of aquatic Coleoptera, 484
Mollusca and Odonata in the ditches of traditionally managed and grazing fen at Wicken Fen, 485
UK. Journal of Applied Ecology 36: 33-48. 486
Pisces Conservation, 2004. Community Analysis Package Version 3.0. Pisces Conservation Ltd, 487
Lymington, UK. 488
Pisces Conservation, 2008. Species Diversity and Richness IV. Pisces Conservation Ltd, Lymington, 489
UK. 490
Poggio, S.L., E.J. Chaneton & C.M. Ghersa, 2010. Landscape complexity differentially affects alpha, 491
beta and gamma diversities of plants occurring in fence rows and crop fields. Biological 492
Conservation 143: 2477-2486. 493
Rosenzweig, M.L., 2003. Reconciliation ecology and the future of species diversity. Oryx 37: 194-494
205. 495
Rouquette, J.R. & D.J. Thompson, 2005. Habitat associations of the endangered damselfly, 496
Coenagrion mercurial, in a water meadow ditch system in southern England. Biological 497
Conservation 123: 225-235. 498
Sayer, C., K. Andrews, E. Shiland, N. Edmonds, R. Edmonds-Brown, I. Patmore, D. Emson & J. 499
Axmacher, 2012. The role of pond management for biodiversity conservation in an agricultural 500
landscape. Aquatic Conservation: Marine and Freshwater Ecosystems 22: 626-638. 501
Twisk, W., M.A.W. Noordervliet & W.J. ter Keurs, 2000. Effects of ditch management on caddisfly, 502
dragonfly and amphibian larvae in intensively farmed peat areas. Aquatic Ecology34: 397-411. 503
van de Meutter, F., R. Stoks & L. De Meester, 2005. The effect of turbidity state and microhabitat on 504
macroinvertebrate assemblages: a pilot study of six shallow lakes. Hydrobiologia 542: 379-390. 505
21
van Eerden, M., G. Lenselink & M. Zijlstra, 2010. Long term changes in wetland area and 506
composition in the Netherlands affecting the carrying capacity for wintering waterbirds. Ardea 507
98: 265-282. 508
Verdonschot, P.F.M. & L.W.G. Higler, 1989, Macroinvertebrates in Dutch ditches: a typological 509
characterization and the status of the Demmerik ditches. Hydrobiological Bulletin 21: 135-142 510
Verdonschot, R.C.M., H.E. Keizer-Vlek & P.F.M. Verdonschot, 2011. Biodiversity value of 511
agricultural drainage ditches: a comparative analysis of the aquatic invertebrate fauna of ditch 512
and small lakes. Aquatic Conservation: Marine and Freshwater Ecosystems 21: 715-727. 513
Vaikre, M., L. Remm & E. Rannap, 2015, Macroinvertebrates in woodland pools and ditches and 514
their response to artificial drainage in Estonia. Hydrobiologia 762: 157-168. 515
Warfe, D.M. & L.A. Barmuta, 2004. Habitat structural complexity mediates the foraging success of 516
multiple predator species. Oecologia 141: 171-178. 517
Watson, A.M. & S.J. Ormerod, 2004. The distribution of three uncommon freshwater gastropods in 518
the drainage ditches of British grazing marshes. Biological Conservation 118: 455-466. 519
Wet Fens Partnership. 2015. The restoration of fenland for people and wildlife. Environment Agency, 520
Peterborough. 521
Whatley, M.H., E.E. van Loon, H. van Dam, J.A. Vonk, H.G. van der Geest & W Admiraal, 2014a. 522
Macrophyte loss drives decadal change in benthic invertebrates in peatland drainage ditches. 523
Freshwater Biology 59: 114-126. 524
Whatley, M.H., E.E. van Loon, J.A. Vonk, H.G. van der Geest & W. Admiraal, 2014b. The role of 525
emergent vegetation in structuring aquatic insect communities in peatland drainage ditches. 526
Aquatic Ecology 48: 267-283. 527
22
Whatley, M.H., J.A. Vonk, H.G. van der Geest & W. Admiraal, (2015). Temporal abiotic variability 528
structures invertebrate communities in agricultural drainage ditches. Limnologica 52: 20-29. 529
DOI: http://dx.doi.org/10.1016/j.limno.2015.03.001. 530
Williams, P., M. Whitfield, J. Biggs, S. Bray, G. Fox, P. Nicolet & D Sear, 2003. Comparative 531
biodiversity of rivers, streams, ditches and ponds in an agricultural landscape in Southern 532
England. Biological Conservation 115: 329-341. 533
534
23
Tables
Table 1 - Aquatic macroinvertebrate abundance (a), taxon richness and (b) in main arterial drains and side ditches for each season and combined over the year. Spr = spring, summ = summer, wint = winter. Standard error is presented in parenthesis.
Abundance Taxon richness
Spr Summ Wint Comb Spr Summ Wint Comb
a) b)
Main
M1 1740 2359 1332 5431 55 60 39 92 M2 1275 1246 1074 3595 51 68 35 86 M3 1258 965 1115 3338 47 69 46 93 M4 1456 1604 493 3553 49 73 27 92 M5 1052 1855 640 3547 37 57 32 77 M6 428 593 1058 2079 40 42 17 65 M7 687 652 2344 3683 64 52 37 96
Mean 1128.0 (±169.8)
1324.9 (±246.5)
1150.9 (±227.1)
3603.7 (±369.9) 49.0
(±3.4) 60. 1 (±4.1)
33.2 (±3.5)
85.9 (±4.2)
Side
S1 1642 2515 1295 5452 43 40 31 69 S2 321 969 634 1924 38 46 33 64 S3 2082 3158 2060 7300 56 62 46 83 S4 292 502 332 1126 33 44 23 64 S5 1023 1303 321 2647 32 54 31 76
Mean 1072 (±355.0)
1689.4 (±495.8)
928.4 (±333.6)
3689.8 (±1160.1) 40.4
(±4.3) 49.2
(±3.9) 32.8
(±3.7) 71.2
(±3.7) Total 13256 17721 12698 43675 130 132 95 167
Mean 1104.7 (±168.3)
1476.8 (±244)
1058.2 (±185.4)
3639.6 (±497.6) 45.4
(±2.9) 55.6
(±3.2) 33.1
(±2.5) 79.8
(±3.5)

24
Table 2 - The top 4 aquatic macroinvertebrate taxa contributing most to community dissimilarity
identified by SIMPER between: a) main and side ditches for all sampling dates and; b) spring,
summer and autumn communities. Note - figure in parenthesis indicates the percentage contribution
to community dissimilarity.
a)
Side
Main
Cloeon dipterum (6.26) Gammarus pulex (4.77) Radix balthica (4.22) Physa fontinalis (3.58)
b)
Spring Summer Winter
Spring
Summer Gammarus pulex (4.29) Radix balthica (3.84) Cloeon dipterum (3.79) Chironomidae (3.52)
Winter Cloeon dipterum (7.41) Gammarus pulex (5.49) Crangonyx pseudogracilis (4.47) Chironomidae (3.82)
Cloeon dipterum (5.82) Gammarus pulex (4.0) Crangonyx pseudogracilis (3.74) Radix balthica (3.47)

25
Table 3 - Jaccard’s Coefficient of Similarity for macroinvertebrate communities for individual seasons and combined seasons from the main and side ditches
Spring Summer Winter Combined Main 0.45 0.48 0.4 0.57 Side 0.32 0.39 0.42 0.47 All ditch samples 0.38 0.42 0.38 0.51

26
Table 4 - Macroinvertebrate Community Conservation Index (CCI) scores from the 12 sample sites for individual seasons and all seasons (Total), (0-5 low conservation value; >5-10 moderate conservation value; >10-15 fairly high conservation value; >15-20 high conservation value and >20 very high conservation value). Fairly high, high and very high conservation value scores are presented in bold.
Spring Summer Winter Total
Main M1 9 9 9 10 M2 12 13 8 14 M3 19 15 9 22 M4 9 9 8 10 M5 8 9 9 9 M6 9 8 8 9 M7 9 8 9 9 Side S1 13 9 7 14 S2 8 8 7 9 S3 8 8 8 8 S4 9 10 10 10 S5 22 9 9 20

27
Table 5 – The number of macroinvertebrate taxa recorded in other published studies which have examined the biodiversity or wider conservation value of artificial drainage channels and ditches. For each source the geographical location, number of ditches and sites examined, the number of macroinvertebrate taxa and duration of the study is included to provide comparison with the results of the current study and historic sampling on Deeping Fen.
Source Location Number sites
Number of taxa
Study date and duration
Armitage et al., (2003) River Frome floodplain,
Dorset, UK 1 ditch, 16 sites
145 1-year (1998)
Clare and Edwards, (1983) Gwent Levels, River Severn Estuary, Wales, UK
60 sites 581 1-year, 6 surveys (1976)
Davies et al., (2008a) Gloucestershire, Oxfordshire & Wiltshire, UK
20 sites / ditches
120 3 years (2000, 2002 and 2003)
Davies et al., (2008b) River Cole, Coleshill, Oxfordshire, UK Whitchurch, Cheshire, UK
11 sites 13 sites
120 75
2-years (2000-2001) 2-years (1997-1998)
Hill et al., (This Study) Historic data
Deeping Fen, between River Glen and River Welland, Lincolnshire, UK
12 sites / 9 ditches 3 Sites
1672
3312
1 Year, 3 surveys (2014) 1989-2014
Langheinrich et al., (2004) Drömling, Saxony, Germany 11 sites / channels
227 3 years, 5 surveys (1996, 1998 and 2000)
Leslie et al., (2012) Chesapeake Bay, Maryland, USA
29 sites / ditches
85 2 months (February-March 2008)
Painter, (1999) Wicken Fen, Cambridgeshire, UK
17 sites / channels
1093 1 month (June 1994)
Verdonschot et al., (2011) Central Netherlands 9 sites / drainage ditches
226 2-months (June-July 2005)
Verdonschot & Higler (1989) Overijssel province, Drenthe provinde and Demmerik polder, Netherlands
150 sites 3604 Composite study of research in 1970’s & 1980’s
Whatley et al., (2014a) Hoogheemraadschap, North Holland, Netherlands
29 sites 71 1985-2007
Whatley et al., (2014b) Wormer, Jisperveld and Naardermeer, North Holland, Netherlands
6 sites / channels
705 2 months (August-September 2011)
Whatley et al., (2015) North Holland, Netherlands 84 sites / channels
159 4-years (2008-2011)
Williams et al., (2003) River Cole, Coleshill, Oxfordshire, UK
20 sites / channels
90 1 year -2000
Notes: 1Clare and Edwards (1983) report 58 taxa in a reduced dataset; 2 Diptera larvae resolved to family level only; 3 Painter (1999) Only Coleoptera, Mollusca and Odonata reported; 4 Verdonschot and Higler (1989) the figure indicated comprises those selected for inclusion in analysis; 5 Whatley et al., (2014b) only insect taxa reported.

28
Figure captions
Figure 1 - Total number of taxa within the main macroinvertebrate groups recorded from the 12 sample sites.
Figure 2 - Error bar graphs indicating (a) Mean taxon richness (+/- 1 SE) and (b) mean community
abundance (+/- 1 SE) recorded in the main and side drainage ditches during the spring, summer and
winter sampling seasons.
Figure 3 - Two dimensional NMDS plot of dissimilarity (Bray-Curtis) of invertebrate communities
within the main and side drainage ditches for: (a) spring (b) summer (c) winter and (d) all seasons
combined.
Figure 4 - Two dimensional NMDS plot of dissimilarity (Bray-Curtis) of seasonal (spring, summer
and winter) invertebrate communities within the agricultural drainage ditches.

29
Others
Hemiptera Odonata
Crustacea Hirudinea Gastropoda
Coleoptera
Ephemeroptera
Diptera Trichoptera
Figure 1
30
Figure 2
a) b)

31
Figure 3
2D Stress: 0.11 2D Stress: 0.12
2D Stress: 0.12 2D Stress: 0.08
a) b)
c) d)
Main Side
32
Figure 4
2D Stress: 0.18
Spring Summer Autumn
Top Related