


Languages
Pages
Legal


April, 2008.April, 2008.
José Rubens de la Rosa - José Rubens de la Rosa - CEO CEO Carlos Zignani - Carlos Zignani - Investor’s Relations Investor’s Relations DirectorDirectorJoão Luiz Borsoi - João Luiz Borsoi - Investor’s Relations Investor’s Relations ManagerManager
NON-DEAL ROAD SHOWNON-DEAL ROAD SHOW
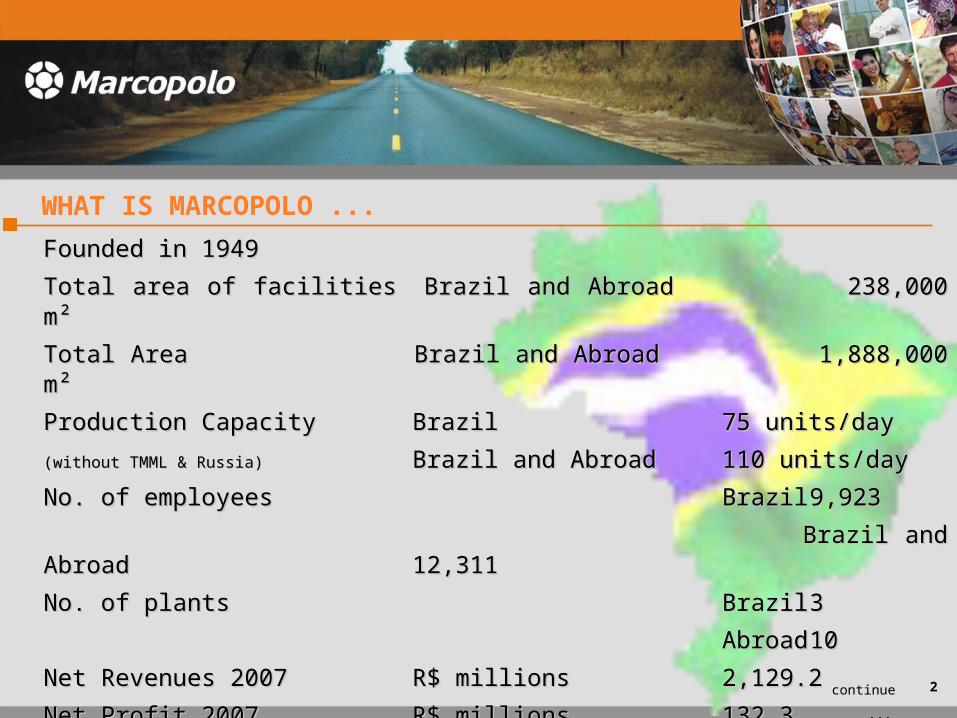
Founded in 1949Founded in 1949
Total area of facilities Total area of facilities Brazil and Abroad Brazil and Abroad 238,000 m² 238,000 m²
Total Area Total Area Brazil and Abroad Brazil and Abroad 1,888,000 m²1,888,000 m²
Production Capacity Production Capacity BrazilBrazil 75 units/day75 units/day
(without TMML & Russia)(without TMML & Russia) Brazil and AbroadBrazil and Abroad 110 units/day110 units/day
No. of employees No. of employees BrazilBrazil 9,9239,923
Brazil and AbroadBrazil and Abroad 12,311 12,311
No. of plants No. of plants BrazilBrazil 33
AbroadAbroad 1010
Net Revenues 2007 Net Revenues 2007 R$ millionsR$ millions 2,129.2 2,129.2
Net Profit 2007Net Profit 2007 R$ millionsR$ millions 132,3132,3
Dividends 2007Dividends 2007 R$ millionsR$ millions 75,0 75,0 (56.7% Net (56.7% Net Profit) Profit) 2continue ...
WHAT IS MARCOPOLO ...
• One of the world’s largest bus body manufacturersOne of the world’s largest bus body manufacturers
• Leadership position in Brazil with 40% market shareLeadership position in Brazil with 40% market share
• One of the most recognized brands in the global bus industryOne of the most recognized brands in the global bus industry
• State of the art production technologyState of the art production technology
• Integrated production of nearly all parts used in Integrated production of nearly all parts used in
manufacturingmanufacturing
• Complete product line: coaches, city buses, midi, micro and Complete product line: coaches, city buses, midi, micro and
minibuses minibuses
3
WHAT IS MARCOPOLO ...

COMPANY’sCOMPANY’s
ORGANIZATIONALORGANIZATIONAL
STRUCTURESTRUCTURE

Fiscal Council
ShareholdersShareholdersShareholdersShareholders
Heir´s Council
Service Providers Businesses
CEOCEOCEOCEO
Board of Board of AdministrationAdministration
Board of Board of AdministrationAdministration
Executive
HR and Ethic
CommitteesInternal Audit
Statutory Audit
Estrategy
Audit and Risk
CO
RP
OR
AT
ION
CO
RP
OR
AT
ION
LCV LCV BusinessBusiness
LCV LCV BusinessBusiness
Financial Financial ServicesServicesFinancial Financial ServicesServices
CFOCFOCFOCFO
AdministrativeAdministrativeDirectorDirector
AdministrativeAdministrativeDirectorDirector
Plastics Plastics BusinessBusinessPlastics Plastics
BusinessBusiness
International International OperationsOperations
(China / (China / India / Russia)India / Russia)
International International OperationsOperations
(China / (China / India / Russia)India / Russia)
Bus Business Bus Business (Caxias, Ciferal, (Caxias, Ciferal,
Colômbia, México, Colômbia, México, South Africa)South Africa)
Bus Business Bus Business (Caxias, Ciferal, (Caxias, Ciferal,
Colômbia, México, Colômbia, México, South Africa)South Africa)
Estrategy, New Estrategy, New Markets & Markets &
Marketing Direct.Marketing Direct.
Estrategy, New Estrategy, New Markets & Markets &
Marketing Direct.Marketing Direct.
5

Loma Hermosa - Argentina
Rio de Janeiro - Brasil
Cota - Colombia
Monterrey - Mexico
Coimbra - Portugal
Johannesburg - South Africa
Changzhou - China
(components)
Golitsino & Pavlov - Russia
Dharward & Lucknow - India
WORLDWIDE PRESENCE …
6
Caxias do Sul - Brasil
(Planalto & Ana Rech)

7
WORLDWIDE PRESENCE …

THE CHASSI
UNDERSTANDING MARCOPOLO PRODUCT ...
8

BUS BODY
THE PRODUCT ...
9
•Sales/Distribution LogisticSales/Distribution Logistic
• Global Presence: market diversificationGlobal Presence: market diversification
• Custom-made productsCustom-made products
• Competitive costsCompetitive costs
• Verticalization & Global Sourcing Verticalization & Global Sourcing
• Economies of scale/Large VolumesEconomies of scale/Large Volumes
• Human Resources/trainning/motivationHuman Resources/trainning/motivation
•TechnologyTechnology
• Broad product lineBroad product line
• Unique manufacturing systems & processesUnique manufacturing systems & processes
• Technologycal autonomy Technologycal autonomy (slide eleven)(slide eleven) 10continue ...
STRONG POINTS ...

11
TECHNOLOGY TRANSFERS ...

•ProfitabilityProfitability• Economic value added philosophyEconomic value added philosophy
• Corporate GovernanceCorporate Governance• Bovespa Level IIBovespa Level II• Board of DirectorsBoard of Directors• Board of Directors CommitteesBoard of Directors Committees• Fiscal CouncilFiscal Council• Heir’s CouncilHeir’s Council• Code of ConductCode of Conduct
• Profitability: (2003/2007)Profitability: (2003/2007)• Increase in net profits: Increase in net profits:
1.6 times1.6 times• Increase in revenues: Increase in revenues:
1.7 times1.7 times• Increase in production:Increase in production:
1.3 times1.3 times• Shares price appreciation and market value: Shares price appreciation and market value:
3.0 times3.0 times
12
STRONG POINTS ...

• To achieve higher rates of revenue growthTo achieve higher rates of revenue growth
• To be present in highly populous/developing countriesTo be present in highly populous/developing countries
• Markets diversification, to minimize effects from fluctuations Markets diversification, to minimize effects from fluctuations
in demand and from economic and political risksin demand and from economic and political risks
• Extend the geographic range of manufacturing and supply Extend the geographic range of manufacturing and supply
centerscenters
• Benefit from economies os scaleBenefit from economies os scale
GROWTH STRATEGIES ... WHY INTERNATIONAL EXPANSION
13

14
RUSSIAN BUSSES MARCO - HIGHLIGHTS ...
15
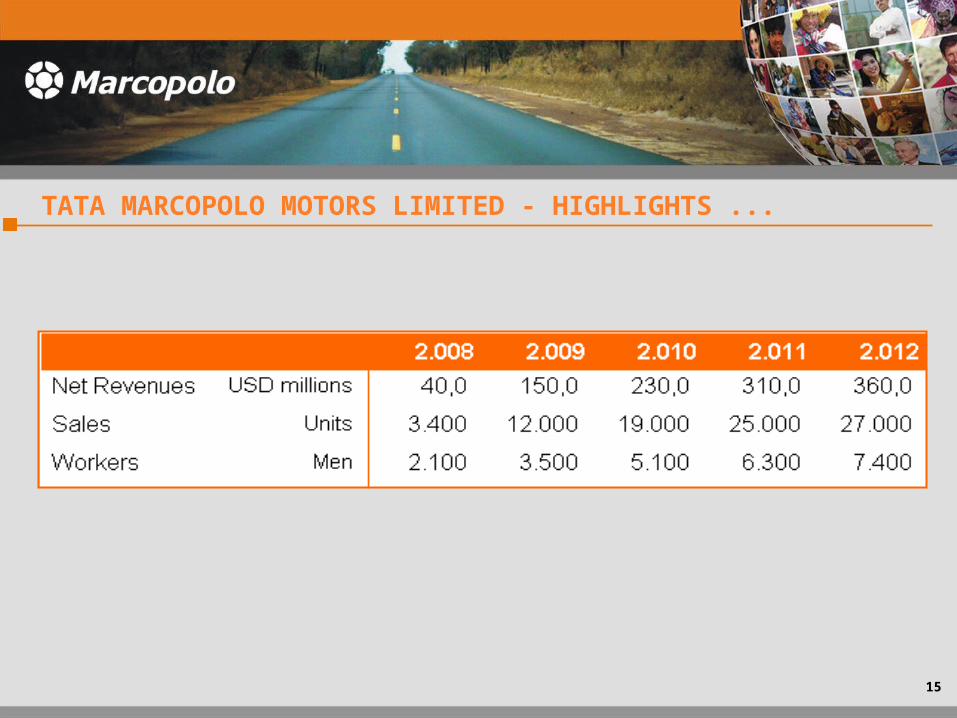
TATA MARCOPOLO MOTORS LIMITED - HIGHLIGHTS ...
16
2008 MAIN OBJECTIVES ...
• Speed up local manufacture of parts by foreign subsidiariesSpeed up local manufacture of parts by foreign subsidiaries
• Establish parts mfg centers in low cost countriesEstablish parts mfg centers in low cost countries
• Increase market effort directed to most profitable and Increase market effort directed to most profitable and
differentiated productsdifferentiated products
• Exploit new market niche (School Bus)Exploit new market niche (School Bus)
• Increase EBITDA and stockholders returnsIncrease EBITDA and stockholders returns
• Foster training and continuing development of employeesFoster training and continuing development of employees

BRAZILIAN BRAZILIAN
BUS BODY PRODUCTION BUS BODY PRODUCTION
& MARKET SHARE& MARKET SHARE

27,952
21,381
25,280 26,983
32,027
31.6%34.1%
46.9%
35.4%32.8%
0
7.000
14.000
21.000
28.000
35.000
2003 2004 2005 2006 20070,0%
30,0%
60,0%
Brazilian Bus Body Production ExportsSource: Simefre18
BRAZILIAN BUS BODY PRODUCTION (units) & EXPORTS (%) ...
+14.6%

47.0% 45.9%42.8%
39.2%41.5%
0,0%
10,0%
20,0%
30,0%
40,0%
50,0%
2003 2004 2005 2006 2007
MP/ Ciferal
Busscar
Caio/Induscar
Comil
Neobus
Mascarello
Others (*)
Source:
Simefre
(*) Irizar, Maxibus.
19
MARKET SHARE (%) ...

MARCOPOLO MARCOPOLO
SUMMARY OF RESULTSSUMMARY OF RESULTS

GLOBAL PRODUCTION (units) ...
64.047.158.863.8
36.4
36.2 41.2 42.1
57.9
36.0
52.9
2003 2004 2005 2006 2007 2008E
63.6DM
EM
Global Production
20,000
14,82415,509
17,807
13,624
2007 Global Product Breakdown
Urban Buses46.4%
Micro Buses10.7%
Mini Buses0.8%
Volare17.7% Intercity
Buses 4.4%
21
15,105
+12.3%
2008E = Forecast

CONSOLIDATED REVENUES (R$ Million) ...
50.6 47.3 44.5 53.1
42.2
60.9
49.452.7 55.5
46.9
39.1
57.8
2003 2004 2005 2006 2007 2008E
DM
EM
2,300.0
1,709.1 1,750.31,605.4
2007 Net Revenues Breakdown
Urban Buses28.8%
Micro Buses5.2%
Mini Buses 0.7%
Parts/ Others 12.7%
Chassis3.0%
Volare16.5%
Intercity Buses 33.1%
Consolidated Revenues
22
2,129.2
1,288.5
+8.0%
US$ 2.89 2.65 2.34 2.14 1.77 1.80
2008E = Forecast

GROSS PROFIT, NET PROFIT (R$ Million) AND MARGINS
(%) ...
362.5329.7
257.2273.4
249.8
18.8 17.015.117.019.4
2003 2004 2005 2006 2007
Gross Profit and Margin
23
+9.9%
120.8
82.485.080.9
6.9 6.24.85.36.3
2003 2004 2005 2006 2007
Net Profit and Margin+9.5%
132.3
US$ 2.89 2.65 2.34 2.14 1.77

24.726.0
19.322.3
23.8
2003 2004 2005 2006 2007
ROE (%) , EBITDA ADJUSTED (R$ Million) AND MARGIN (%) ...
Return on Equity (ROE)
229.1206.3
150.9156.0142.4
11.8 10.88.89.711.1
2003 2004 2005 2006 2007
EBITDA Adjusted and Margin
24
-1.3pp
+11.1%
US$ 2.89 2.65 2.34 2.14 1.77

21.6
49.6
-9.4
26.6
2003 2004 2005 2006 2007
TSR - TOTAL SHAREHOLDERS RETURN (%) ...
25
112.2
TSR Annual Average = 40.1%

TSR or Total Shareholders Return reflects the capital gains plus dividend paid within the period.
TSR TSR 20072007
Dividends + capital gains
Share price at begining of period
0.3353 + (7.20 – 5.95)
5.95
=
TSRTSR = = 26.6%
TSR - TOTAL SHAREHOLDERS RETURN ...
26

CAPITAL EXPENDITURES AND NET INDEBTDENESS (R$
Million) ...
125.1
186.1
115.4
53.7 142.3
181.7
32.9
2003 2004 2005 2006 2007
Net IndebtdenessCapital Expenditures
47.5 48.9
24.7
40.4
109.6
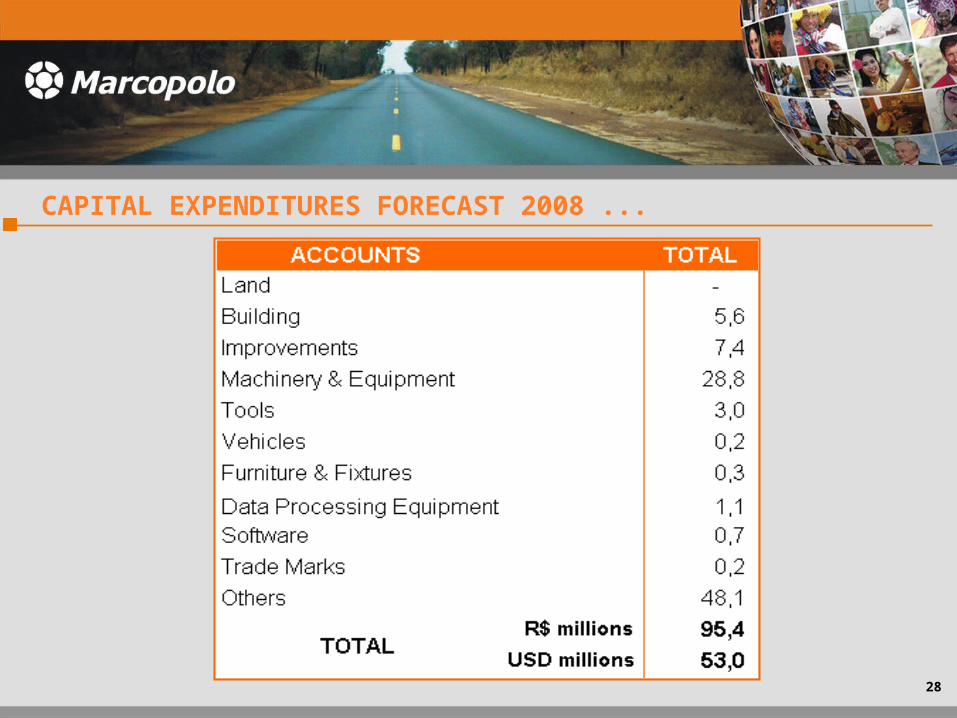
95.4
2003 2004 2005 2006 2007 2008E
86.5
Note: = Financial Segment
= Industrial Segment 27
324.0
2008E = Forecast
28
CAPITAL EXPENDITURES FORECAST 2008 ...
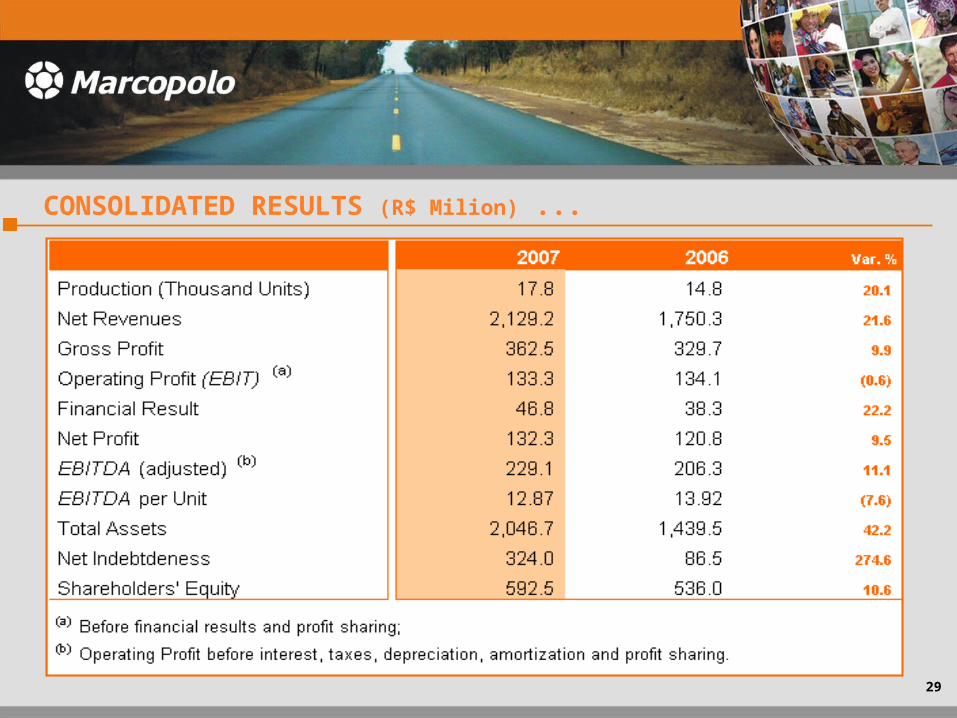
CONSOLIDATED RESULTS (R$ Milion) ...
29

6%4%
7%2% 2%
15%
64%
PAULO BELLINI E VALTER GOMES PINTO CENTRUS
BRADESCO FUNDAÇÃO MARCOPOLO
BANESPREV - FUND. BANESPA BNDES PART. S. A. - BNDESPAR
OUTROS ACIONISTAS
CONTROLING SHAREHOLDERS:CONTROLING SHAREHOLDERS:
in 12/31/2007in 12/31/2007
VOTING SHARES OWNERSHIP ...
30
5%
24%
4%
1%
51%5%
1%
9%
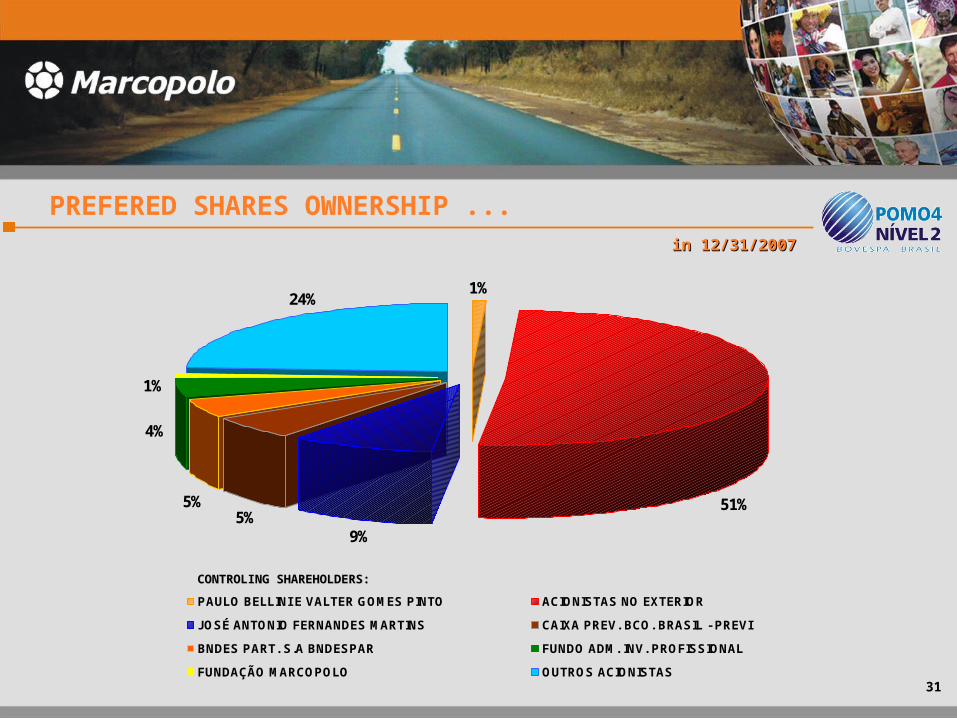
PAULO BELLINI E VALTER GOMES PINTO ACIONISTAS NO EXTERIOR
JOSÉ ANTONIO FERNANDES MARTINS CAIXA PREV. BCO. BRASIL - PREVI
BNDES PART. S.A BNDESPAR FUNDO ADM. INV. PROFISSIONAL
FUNDAÇÃO MARCOPOLO OUTROS ACIONISTAS
CONTROLING SHAREHOLDERS:CONTROLING SHAREHOLDERS:
PREFERED SHARES OWNERSHIP ...
31
in 12/31/2007in 12/31/2007

Marcopolo vs Ibovespa
32
STOCK PERFORMANCE ...
dec-06 mar-07 june-07 sept-07 dec-07
R$ 5.95
44,473 points
R$ 7.20
63,886 points
POMO4 = + 21.0%
IBOVESPA = + 43.7%

33
MARKET VALUE (R$ Million) ...
652.5
1,334.1
1,614.4
123.3238.8 257.9
363.2475.4
538.1
766.8
1998 1999 2000 2001 2002 2003 2004 2005 2006 2007
+21.0%
Note: The figures were updated to reflect the 100% bonus granted after the Board Meeting held on August 25, 2006.

49.357.641.852.9
44.9
0,0
20,0
40,0
60,0
80,0
100,0
120,0
140,0
2003 2004 2005 2006 2007
Net Profit Pay Out (in % ) Dividends(Company)
AVERAGE PAY AVERAGE PAY OUT: 49.5%OUT: 49.5%
NET PROFIT & DIVIDENS PAY OUT (R$ million) ...
34

51.6
20.311.9
93.4
114.7 119.6
2005 2006 2007
Number of TransactionsTotal of Traded Shares (millions)
STOCK PERFORMANCE ...
Number of Transactions and Total of Traded Shares (quantity)
Amount of Transactions and Co. Market Value (R$ million)
35
863.8
424.8247.8
1,334.1
654.0
1,614.4
2005 2006 2007
Amount of Transactions Co. Market Value

COMPANY PLANTSCOMPANY PLANTS

CAXIAS DO SUL/RS - BRAZIL
ANA RECH
37

CAXIAS DO SUL/RS - BRAZIL
PLANALTO
38

DUQUE DE CAXIAS/RJ - BRAZIL
CIFERAL IND. DE ÔNIBUS LTDA.
39

COIMBRA - PORTUGAL
MARCOPOLO INDÚSTRIA DE CARROÇARIAS LTDA.
40

SUPERPOLO S/A - NEW PLANT
41COTA - COLOMBIA
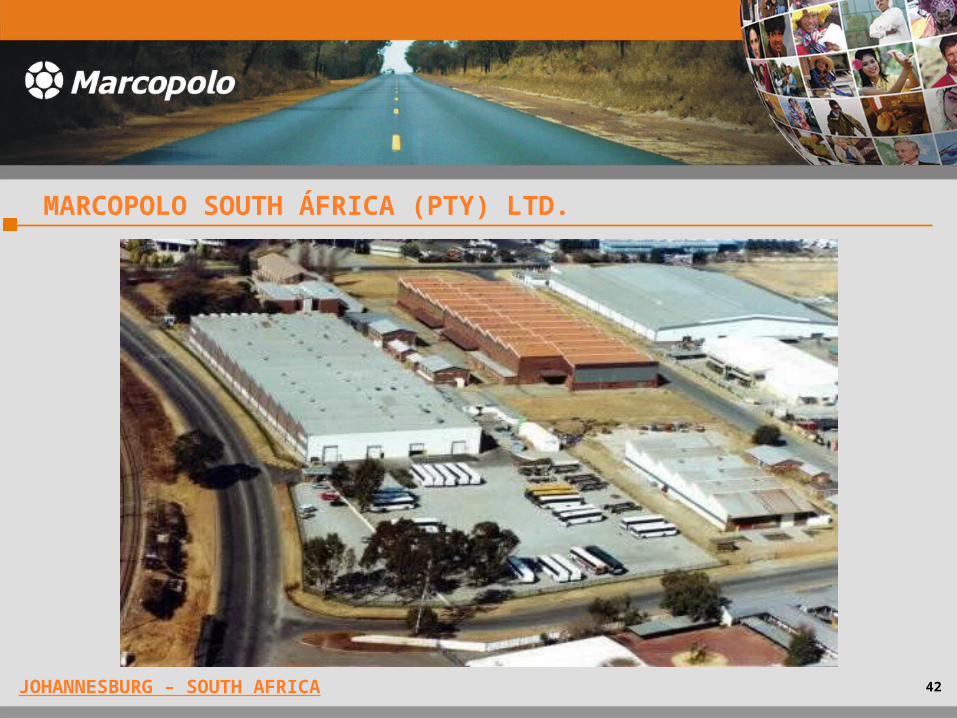
JOHANNESBURG – SOUTH AFRICA
MARCOPOLO SOUTH ÁFRICA (PTY) LTD.
42
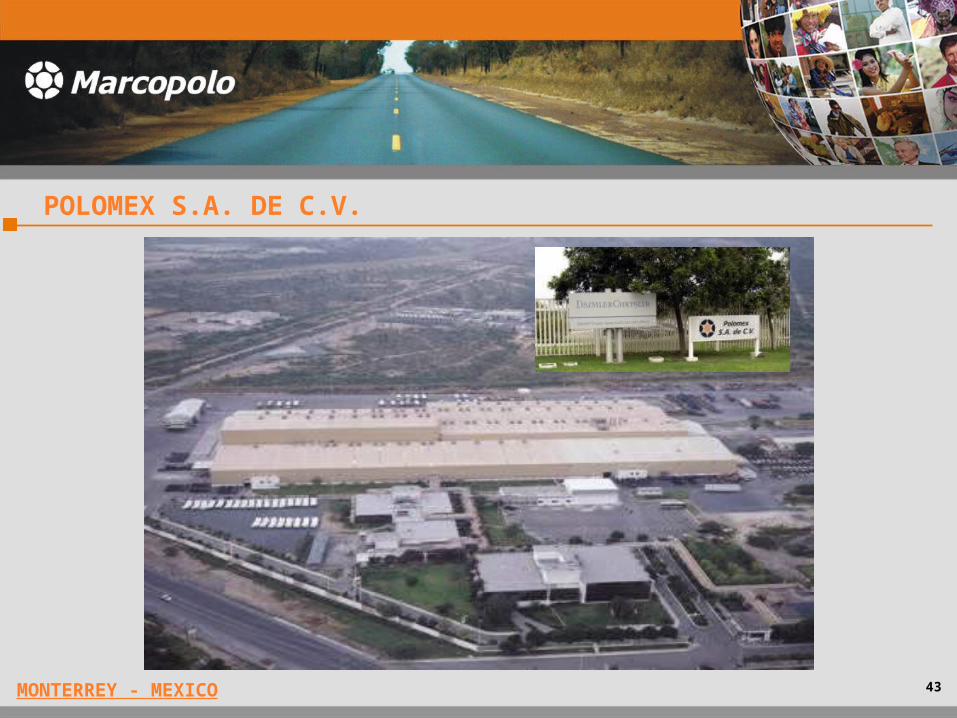
MONTERREY - MEXICO
POLOMEX S.A. DE C.V.
43

GOLITSINO - RUSSIA
RUSSIAN BUSES MARCO
44

LUCKNOW - INDIA
TATA MARCOPOLO MOTORS LMTD.
45

CAXIAS DO SUL/RS - BRAZIL
NEOBUS – SAN MARINO ÔNIBUS E IMPLEMENTOS LTDA.
46

LOMA HERMOSA - ARGENTINA
METALPAR
47

Carlos ZignaniInvestor’s Relations Director
Phone: (55) 54 2101.4115
João Luiz BorsoiInvestor’s Relations Manager
Phone: (55) 54 2101.4660
www.marcopolo.com.br
48
INVESTOR’s RELATIONS ...

This presentation contains future information. Such information is not
simply historical facts, but reflects the desires and the expectations of the
Company’s leadership. The words anticipates, desires, hopes, forecasts,
intends, plans, predicts, projects, wishes and similar ones, intend to identify
affirmations that necessarily involve known and unknown risks. Known risks
include uncertainties that are not limited to the impact of the
competitiveness of the prices and services, market acceptance of services,
the Company’s service transitions and its competitors, the approval of
regulations, currency, fluctuation in the exchange rate, changes in the mix
of services offered, and other risks described in the reports of the
Company. This presentantion is updated until the present date. However,
Marcopolo is not obligated to update it with new information and/or future
events.
49
OBSERVATION ...
Top Related