


Languages
Pages
Legal


University of Kentucky University of Kentucky
UKnowledge UKnowledge
Theses and Dissertations--Public Policy and Administration
Martin School of Public Policy and Administration
2016
Applying a Positive Theory of Organizations: A Closer Applying a Positive Theory of Organizations: A Closer
Examination of State Environmental Protection Agencies Examination of State Environmental Protection Agencies
Emily Bedwell University of Kentucky, [email protected] Digital Object Identifier: https://doi.org/10.13023/ETD.2016.509
Right click to open a feedback form in a new tab to let us know how this document benefits you. Right click to open a feedback form in a new tab to let us know how this document benefits you.
Recommended Citation Recommended Citation Bedwell, Emily, "Applying a Positive Theory of Organizations: A Closer Examination of State Environmental Protection Agencies" (2016). Theses and Dissertations--Public Policy and Administration. 20. https://uknowledge.uky.edu/msppa_etds/20
This Doctoral Dissertation is brought to you for free and open access by the Martin School of Public Policy and Administration at UKnowledge. It has been accepted for inclusion in Theses and Dissertations--Public Policy and Administration by an authorized administrator of UKnowledge. For more information, please contact [email protected].
STUDENT AGREEMENT: STUDENT AGREEMENT:
I represent that my thesis or dissertation and abstract are my original work. Proper attribution
has been given to all outside sources. I understand that I am solely responsible for obtaining
any needed copyright permissions. I have obtained needed written permission statement(s)
from the owner(s) of each third-party copyrighted matter to be included in my work, allowing
electronic distribution (if such use is not permitted by the fair use doctrine) which will be
submitted to UKnowledge as Additional File.
I hereby grant to The University of Kentucky and its agents the irrevocable, non-exclusive, and
royalty-free license to archive and make accessible my work in whole or in part in all forms of
media, now or hereafter known. I agree that the document mentioned above may be made
available immediately for worldwide access unless an embargo applies.
I retain all other ownership rights to the copyright of my work. I also retain the right to use in
future works (such as articles or books) all or part of my work. I understand that I am free to
register the copyright to my work.
REVIEW, APPROVAL AND ACCEPTANCE REVIEW, APPROVAL AND ACCEPTANCE
The document mentioned above has been reviewed and accepted by the student’s advisor, on
behalf of the advisory committee, and by the Director of Graduate Studies (DGS), on behalf of
the program; we verify that this is the final, approved version of the student’s thesis including all
changes required by the advisory committee. The undersigned agree to abide by the statements
above.
Emily Bedwell, Student
Dr. Edward T. Jennings, Major Professor
Dr. Eugenia Toma, Director of Graduate Studies

APPLYING A POSITIVE THEORY OF ORGANIZATIONS
A CLOSER EXAMINATION OF STATE ENVIRONMENTAL PROTECTION AGENCIES
DISSERTATION
A dissertation submitted in partial fulfillment of the requirements for the degree of Doctor of Philosophy in the
Martin School of Public Policy and Administration in the Graduate School at the University of Kentucky
By
Emily Bedwell
Lexington, Kentucky
Director: Dr. Edward T. Jennings, Jr., Professor of Public Policy, Administration, and Political Science
Lexington Kentucky
2016
Copyright @ Emily Bedwell 2016
ABSTRACT OF DISSERTATION
APPLYING A POSITIVE THEORY OF ORGANIZATIONS A CLOSER EXAMINATION OF STATE ENVIRONMENTAL PROTECTION AGENCIES
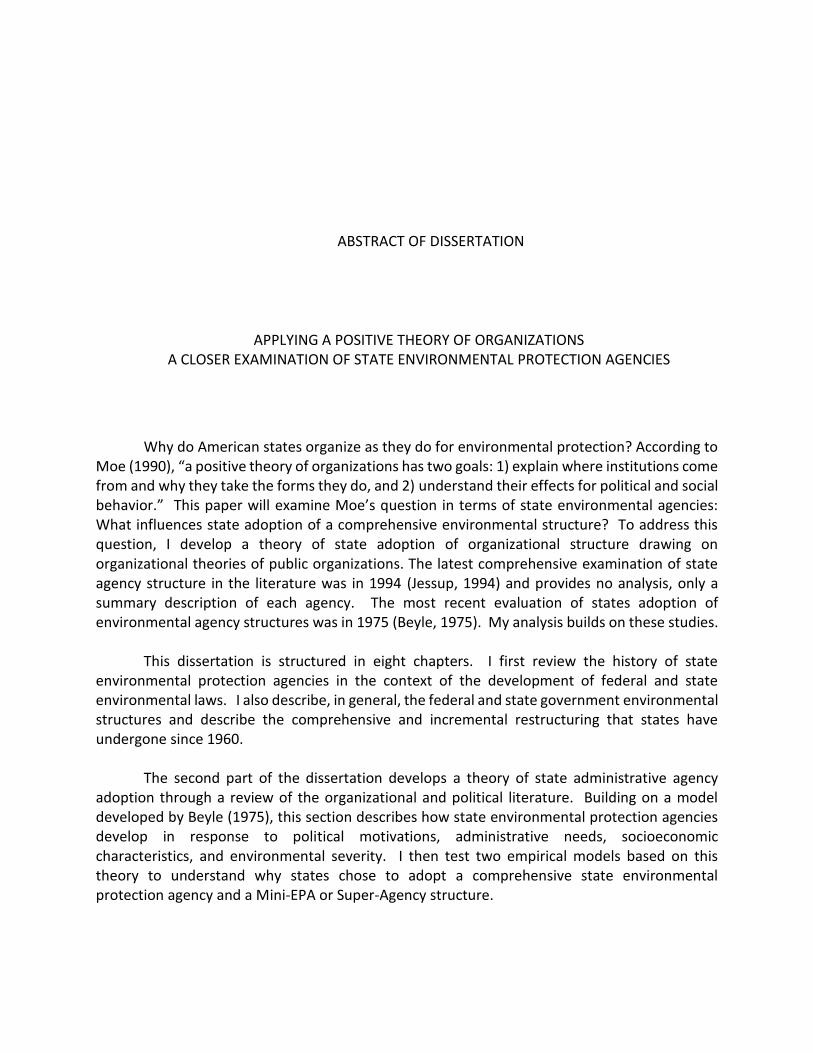
Why do American states organize as they do for environmental protection? According to Moe (1990), “a positive theory of organizations has two goals: 1) explain where institutions come from and why they take the forms they do, and 2) understand their effects for political and social behavior.” This paper will examine Moe’s question in terms of state environmental agencies: What influences state adoption of a comprehensive environmental structure? To address this question, I develop a theory of state adoption of organizational structure drawing on organizational theories of public organizations. The latest comprehensive examination of state agency structure in the literature was in 1994 (Jessup, 1994) and provides no analysis, only a summary description of each agency. The most recent evaluation of states adoption of environmental agency structures was in 1975 (Beyle, 1975). My analysis builds on these studies.
This dissertation is structured in eight chapters. I first review the history of state
environmental protection agencies in the context of the development of federal and state environmental laws. I also describe, in general, the federal and state government environmental structures and describe the comprehensive and incremental restructuring that states have undergone since 1960.
The second part of the dissertation develops a theory of state administrative agency
adoption through a review of the organizational and political literature. Building on a model developed by Beyle (1975), this section describes how state environmental protection agencies develop in response to political motivations, administrative needs, socioeconomic characteristics, and environmental severity. I then test two empirical models based on this theory to understand why states chose to adopt a comprehensive state environmental protection agency and a Mini-EPA or Super-Agency structure.
The third part of the dissertation outlines the theory of state adoption of environmental policies, focusing on the role of decisional systems and specifically the state agency structure. I apply this theory to explore the influence of structure on adoption of environmental policies to address second and third generation pollution problems. These 12 policies are used to create an index of innovativeness. The final chapter summarizes the conclusions from the analyses, and future research prospects. KEYWORDS: Environmental Policy, Organizational Theory,
State Policy, Policy Adoption, State Government
Emily Bedwell
Student’s Signature
December 9, 2016
Date
APPLYING A POSITIVE THEORY OF ORGANIZATIONS A CLOSER EXAMINATION OF STATE ENVIRONMENTAL PROTECTION AGENCIES
Dr. Edward T. Jennings Director of Dissertation
Dr. Eugenia Toma Director of Graduate Studies
December 9, 2016
iii
ACKNOWLEDGEMENTS
So many people helped me along the long road to finishing this dissertation. I want to acknowledge them here so they understand the contribution they made to this process.
I want to thank my committee for their support and understanding and help throughout this entire process. I especially want to thank my adviser, Dr. Ed Jennings for his patience, support, advice, and knowledge in helping me through this very long dissertation process.
I also want to thank my family, my husband and children for their continued encouragement to keep going and their help in making it possible for me to work and keep moving forward.
I want to thank Dr. J.S. Butler for his many hours helping me sort through and clean up my data – and make sense out of what I found. He donated so much time and energy to this dissertation even though he wasn’t on my committee.
Finally I want to thank the faculty and staff at the Martin School who have taught me so much over the past eight years and never stopped pushing me forward to finish.
iv
TABLE OF CONTENTS
Acknowledgements ........................................................................................................................ iii Chapter 1: Introduction .................................................................................................................. 1
Research Question .............................................................................................................................................................. 4
Organization of Study ....................................................................................................................................................... 5
Chapter 2: Development of State Environmental Protection Agencies ......................................... 7 Environmental Federalism ............................................................................................................................................. 9
Environmental Governance .......................................................................................................................................... 12
USEPA .......................................................................................................................................................................................... 12
State Environmental Protection Agency..................................................................................................................... 13
Development of State Pollution Control .................................................................................................................. 14
State and Local Control (Up to 1960) .......................................................................................................................... 16
Creeping Federalism (1960-1969) ................................................................................................................................ 19
Federal Activism (1970-1980) ......................................................................................................................................... 21
Devolution (1980-1990) ..................................................................................................................................................... 25
Evolving Federalism (1990-current) ............................................................................................................................ 26
Development of the Professionalism and Efficiency of State Government............................................... 30
Comprehensive State Agency Restructuring ............................................................................................................. 31
Incremental State Agency Restructuring ................................................................................................................... 33
Chapter 3: A Theory of State Agency Adoption ............................................................................ 35 Agency Structure ............................................................................................................................................................... 36
Model of State Adoption of Structure ....................................................................................................................... 38
Political Motivation .............................................................................................................................................................. 39
Administrative Motivations .............................................................................................................................................. 41
Socioeconomic Factors ........................................................................................................................................................ 43
Policy Problem ........................................................................................................................................................................ 43
Chapter 4: Empirical Analysis: Where Institutions Come From: Part 1 ........................................ 45 Model ..................................................................................................................................................................................... 48
Dependent Variable ......................................................................................................................................................... 49
Explanatory Variables ..................................................................................................................................................... 50
Political Motivations ............................................................................................................................................................ 50
Administrative Motivations .............................................................................................................................................. 54
Socioeconomic and Demographic Factors ................................................................................................................. 56
Policy Problem ........................................................................................................................................................................ 57
v
Results ................................................................................................................................................................................... 59
Discussion ............................................................................................................................................................................ 64
Political Motivations ............................................................................................................................................................ 64
Administrative Motivations .............................................................................................................................................. 65
Socioeconomic and Demographic Factors ................................................................................................................. 66
Policy Problem ........................................................................................................................................................................ 66
Conclusion ........................................................................................................................................................................... 67
Comprehensive Reorganization ...................................................................................................................................... 68
Interest Pressure .................................................................................................................................................................... 68
Improvements to Analysis ............................................................................................................................................ 68
Chapter 5: Empirical Analysis: Where Institutions Come From: Part 2 ........................................ 71 Typology ............................................................................................................................................................................... 72
Mini-EPA .................................................................................................................................................................................... 72
Super-Agency ........................................................................................................................................................................... 73
Health Department ............................................................................................................................................................... 73
Model ..................................................................................................................................................................................... 75
Dependent Variables ............................................................................................................................................................ 76
Explanatory Variables ......................................................................................................................................................... 76
Political Motivations ............................................................................................................................................................ 77
Administrative Motivations .............................................................................................................................................. 79
Socioeconomic and Demographic Factors ................................................................................................................. 81
Policy Problem ........................................................................................................................................................................ 81
Results ................................................................................................................................................................................... 83
Model 1: Super-Agency ........................................................................................................................................................ 87
Model 2: Mini-EPA ................................................................................................................................................................. 88
Discussion ............................................................................................................................................................................ 88
Political Motivations ............................................................................................................................................................ 89
Administrative Motivations .............................................................................................................................................. 90
Socioeconomic and Demographic Factors ................................................................................................................. 91
Policy Problem ........................................................................................................................................................................ 91
Conclusion ........................................................................................................................................................................... 91
Improvements to Analysis ............................................................................................................................................ 92
Chapter 6: State Adoption of Environmental Policies .................................................................. 94 Environmental Severity ................................................................................................................................................. 96
System Resources (industrialization, urbanization, income, education) .................................................. 96

vi
Demand Patterns (party organization, political leaderships, interests) ................................................... 97
Decisional Systems ........................................................................................................................................................... 99
Legislative Capacity .............................................................................................................................................................. 99
Bureaucratic Capacity ...................................................................................................................................................... 100
Horizontal and Vertical Diffusion ........................................................................................................................... 103
Chapter 7: Effects of Institutions on Policies: Environmental Innovation .................................. 105 Literature Review .......................................................................................................................................................... 106
First Generation vs Second and Third Generation Pollution Problems. ................................................. 107
Model .................................................................................................................................................................................. 109
Dependent Variables .................................................................................................................................................... 110
Developing the Indices ..................................................................................................................................................... 113
Policy Adoption Index ....................................................................................................................................................... 120
Dispersed Sources Pollution Policies Index ............................................................................................................. 121
Explanatory Variables .................................................................................................................................................. 122
Environmental Severity ................................................................................................................................................... 122
System Resources Variables ........................................................................................................................................... 124
Demand Variables .............................................................................................................................................................. 124
Decisional Systems Variables ........................................................................................................................................ 125
Model 1: Policy Adoption Index Results................................................................................................................. 132
Discussion ......................................................................................................................................................................... 134
Environmental severity .................................................................................................................................................... 135
System resources ................................................................................................................................................................. 136
Demand ................................................................................................................................................................................... 136
Decisional system ................................................................................................................................................................ 136
Model 2: Dispersed Sources Index Results ......................................................................................................... 137
Discussion ......................................................................................................................................................................... 139
Environmental severity .................................................................................................................................................... 140
System resources ................................................................................................................................................................. 140
Demand ................................................................................................................................................................................... 140
Decisional system ................................................................................................................................................................ 141
Conclusion ........................................................................................................................................................................ 141
Advisory/Rulemaking Board ......................................................................................................................................... 142
Agency Structure................................................................................................................................................................. 143
Environmental Severity ................................................................................................................................................... 143

vii
Improvements to Analysis ......................................................................................................................................... 144
Variables ................................................................................................................................................................................. 144
Typology .................................................................................................................................................................................. 145
Chapter 8: Summary, Conclusions, Research Prospects ............................................................ 147 Dissertation Summary ................................................................................................................................................. 148
Policy Implications ........................................................................................................................................................ 150
Limitations and Future Research ............................................................................................................................ 151
APPENDIX A: State Environmental Agency Structure Histories .................................................. 153 Alabama ............................................................................................................................................................................. 154
Department of Environmental Management ........................................................................................................ 154
Alaska ................................................................................................................................................................................. 156
Department of Environmental Conservation ........................................................................................................ 156
Arizona ............................................................................................................................................................................... 158
Department of Environmental Quality ..................................................................................................................... 158
Arkansas ............................................................................................................................................................................ 160
Department of Environmental Quality ..................................................................................................................... 160
California ........................................................................................................................................................................... 162
Environmental Protection Agency .............................................................................................................................. 162
Colorado ............................................................................................................................................................................ 164
Department of Public Health and Environment ................................................................................................... 164
Connecticut ....................................................................................................................................................................... 166
Department of Energy and Environmental Protection ..................................................................................... 166
Delaware ........................................................................................................................................................................... 168
Department of Natural Resources and Environmental Control ................................................................... 168
Florida ................................................................................................................................................................................ 170
Department of Environmental Protection .............................................................................................................. 170
Georgia ............................................................................................................................................................................... 172
Department of Natural Resources .............................................................................................................................. 172
Hawaii ................................................................................................................................................................................. 174
Department of Health ....................................................................................................................................................... 174
Idaho ................................................................................................................................................................................... 176
Department of Environmental Quality ..................................................................................................................... 176
Illinois ................................................................................................................................................................................. 178
Environmental Protection Agency .............................................................................................................................. 178
Indiana ............................................................................................................................................................................... 180
viii
Department of Environmental Management ........................................................................................................ 180
Iowa ..................................................................................................................................................................................... 182
Department of Natural Resources .............................................................................................................................. 182
Kansas................................................................................................................................................................................. 184
Department of Health and Environment ................................................................................................................. 184
Kentucky ............................................................................................................................................................................ 186
Energy and Environment Cabinet ............................................................................................................................... 186
Louisiana ........................................................................................................................................................................... 188
Department of Environmental Quality ..................................................................................................................... 188
Maine .................................................................................................................................................................................. 190
Department of Environmental Protection .............................................................................................................. 190
Maryland ........................................................................................................................................................................... 192
Department of the Environment ................................................................................................................................. 192
Massachusetts ................................................................................................................................................................. 194
Executive Office of Energy and Environmental Affairs ..................................................................................... 194
Michigan ............................................................................................................................................................................ 196
Department of Environmental Quality ..................................................................................................................... 196
Minnesota ......................................................................................................................................................................... 198
Department of Pollution Control ................................................................................................................................. 198
Mississippi ........................................................................................................................................................................ 200
Department of Environmental Quality ..................................................................................................................... 200
Missouri ............................................................................................................................................................................. 202
Department of Natural Resources .............................................................................................................................. 202
Montana ............................................................................................................................................................................. 204
Department of Natural Resources and Conservation ........................................................................................ 204
Nebraska............................................................................................................................................................................ 206
Department of Environmental Quality ..................................................................................................................... 206
Nevada ................................................................................................................................................................................ 208
Department of Conservation and Natural Resources ........................................................................................ 208
New Hampshire .............................................................................................................................................................. 210
Department of Environmental Services ................................................................................................................... 210
New Jersey ........................................................................................................................................................................ 212
Department of Environmental Protection .............................................................................................................. 212
New Mexico ...................................................................................................................................................................... 214

ix
Department of Environment ......................................................................................................................................... 214
New York ........................................................................................................................................................................... 216
Department of Environmental Conservation ........................................................................................................ 216
North Carolina ................................................................................................................................................................. 218
Department of Environmental and Natural Resources .................................................................................... 218
North Dakota ................................................................................................................................................................... 220
Department of Health ....................................................................................................................................................... 220
Ohio ..................................................................................................................................................................................... 222
Environmental Protection Agency .............................................................................................................................. 222
Oklahoma .......................................................................................................................................................................... 224
Secretary of Energy and Environment...................................................................................................................... 224
Oregon ................................................................................................................................................................................ 226
Department of Environmental Protection .............................................................................................................. 226
Pennsylvania .................................................................................................................................................................... 228
Department of Environmental Protection .............................................................................................................. 228
Rhode Island .................................................................................................................................................................... 230
Department of Environmental Management ........................................................................................................ 230
South Carolina ................................................................................................................................................................. 232
Department of Health and Environmental Control ............................................................................................ 232
South Dakota.................................................................................................................................................................... 234
Department of Environmental and Natural Resources .................................................................................... 234
Tennessee ......................................................................................................................................................................... 236
Department of Environment and Conservation ................................................................................................... 236
Texas ................................................................................................................................................................................... 238
Commission on Environmental Quality .................................................................................................................... 238
Utah ..................................................................................................................................................................................... 240
Department of Environmental Quality ..................................................................................................................... 240
Vermont ............................................................................................................................................................................. 242
Agency of Natural Resources......................................................................................................................................... 242
Virginia ............................................................................................................................................................................... 244
Secretary of Natural Resources.................................................................................................................................... 244
Washington ...................................................................................................................................................................... 246
Department of Ecology .................................................................................................................................................... 246
West Virginia ................................................................................................................................................................... 248
x
Department of Environmental Protection .............................................................................................................. 248
Wisconsin .......................................................................................................................................................................... 250
Department of Natural Resources .............................................................................................................................. 250
Wyoming ........................................................................................................................................................................... 252
Department of Environmental Quality ..................................................................................................................... 252
APPENDIX B: Federal Environmental Laws ................................................................................. 254
APPENDIX C: State Primacy Information .................................................................................... 259 Clean Air Act (CAA) ....................................................................................................................................................... 260
Clean Water Act (CAA)................................................................................................................................................. 262
Resource Conservation and Recovery (RCRA) .................................................................................................. 264
Safe Drinking Water Act (SDWA) ............................................................................................................................ 268
Toxic Substances Control Act (TSCA) .................................................................................................................... 270
Emergency Planning and Community Right to Know (EPCRA) ................................................................. 273
Federal Insecticide, Fungicide, and Rodenticide (FIFRA) ............................................................................. 275
Oil Pollution Act (OPA) ................................................................................................................................................ 277
APPENDIX D: Executive Branch Reorganizations ........................................................................ 279
APPENDIX E: Additional Tables: .................................................................................................. 283
APPENDIX F: Sources Used to Develop State Structure Information ......................................... 284
References .................................................................................................................................. 313
VITA ............................................................................................................................................. 322

xi
TABLE OF TABLES Table 1: Models of State Government.......................................................................................... 32
Table 2: Summary statistics for Comprehensive Structure .......................................................... 58
Table 3: Effect of Political, Administrative, Socioeconomic, and Policy Problem Variables on Adoption of Comprehensive Agency Structure (Event History Model Hazard Ratios and Standard Errors) ........................................................................................................................................... 60
Table 4: Marginal Effects of Political, Administrative, Socioeconomic, and Policy Problem Variables with Respect to Estimated Average Duration until Adoption of a Comprehensive Structure ....................................................................................................................................... 62
Table 5: Summary statistics .......................................................................................................... 82
Table 6: Effect of Political, Administrative, Socioeconomic, and Policy Problem Variables on Adoption of Super-Agency (Model 1) and Mini-EPA Adoption (Model 2) ................................... 84
Table 7: Marginal Effects of Political, Administrative, Socioeconomic, and Policy Problem Variables with Respect to Estimated Average Duration until Adoption of a Super-Agency and Mini-EPA Structure........................................................................................................................ 86
Table 8: State Adoption of Environmental Policies .................................................................... 111
Table 8: State Adoption of Environmental Policies .................................................................... 112
Table 9: Tetrachoric Correlations ............................................................................................... 115
Table 10: Factor Analysis ............................................................................................................ 117
Table 11: Rotated Factor Matrix ................................................................................................. 118
Table 8: State Adoption of Environmental Policies .................................................................... 127
Table 8: State Adoption of Environmental Policies .................................................................... 128
Table 13: Summary Statistics ...................................................................................................... 131
Table 14: Summary of Environmental Policy Adoption Index Results ....................................... 133
Table 15: Summary of Dispersed Sources Index Results ............................................................ 138
Table 16: Summary of Policy Adoption, Agency Structure, and Consolidation Year ................. 148
Table B-1: Federal Environmental Laws ..................................................................................... 254
Table C-1: Clean Air Act Designations ......................................................................................... 260
Table C-2: CWA State Delegations .............................................................................................. 262
Table C-3: RCRA State Delegations ............................................................................................. 265
Table C-4: SDWA State Delegations ............................................................................................ 268
Table C-5: TSCA State Delegations .............................................................................................. 271
Table C-6: EPCRA State Delegations ........................................................................................... 273
Table C-7: FIFRA State Delegations ............................................................................................. 275
Table C-8: OPA State Delegations ............................................................................................... 278
Table D-1: Executive Branch Reorganizations ............................................................................ 279
Table E-1 Unrotated Matrix Factors ........................................................................................... 283

xii
TABLE OF FIGURES Figure 1: Current State Environmental Protection Agency Structures ........................................... 3
Figure 2: USEPA Organizational Chart .......................................................................................... 13
Figure 3: State Adoption of Current Environmental Regulation Structure .................................. 15
Figure 4: Beyle (1975) Model of Agency Design ........................................................................... 38
Figure 5: State Adoption of Comprehensive Environmental Regulation Structure ..................... 46
Figure 6: State Adoption of Comprehensive Structure ................................................................ 49
Figure 7: State Environmental Protection Agency Structures ...................................................... 71
Figure 8: Environmental Regulation: Public Health Overlap (Shepherd et al., 1999) .................. 74
Figure 9: State Adoption of Super-Agency Structure vs. Mini-EPA Structure .............................. 75
Figure 10: Model of Environmental Policy Adoption (J. Lester, 1980; Ringquist, 1993; Salisbury, 1968) ............................................................................................................................................. 95
Figure 11: Bureaucratic Structure Direct and Indirect Effects ...................................................... 99
Figure 12: Rotated Loading Factors (Factor 1 and Factor 2) ...................................................... 119
Figure 13: Environmental Innovation Index ............................................................................... 120
Figure 14: Dispersed Sources Pollution Policies Index ............................................................... 121
Figure 15: Types of Agencies and Functions ............................................................................... 146

1
CHAPTER 1: INTRODUCTION
State environmental protection agencies are relatively new compared to more
traditional state agencies, such as transportation and agriculture. What started in a
handful of states as a patchwork of boards, commissions, and part of health and
sanitation agencies, has grown into a national network of executive level agencies with
approximately 50,000 employees spending over $4 billion per year. While most states
initially housed environmental regulation within public health departments (Health),
most now house it within its own stand-alone agency (Mini-EPA) or in superagencies that
can include agriculture, natural resources, and/or energy (Super-Agency). Regardless of
their location, these agencies develop, implement, and enforce environmental pollution
laws. These agencies report to the state governor and legislature, but also the United
States Environmental Protection Agency (USEPA) regional and national offices as they
implement and enforce both state and federal laws. In addition, these agencies develop
their own programs and policies for pollution control (Sapat, 2004). Understanding how
these agencies are organized and function is an important component of understanding
the diversity of environmental regulations across states.
State executive agencies are a key part of the decisional system component of a
policy adoption model. State administration has been described as a hidden component
of state government (Jennings & Woods, 2007). The structure that these agencies adopt
directly influences their capacity. In addition, the structure will affect the policy priorities,
level of enforcement, and level of innovation within the agency. While it is generally
accepted that the structure of bureaucratic agencies can affect policy outcomes, few

2
studies include detailed measures of the agency itself in their models. In environmental
policy literature, the few studies that have examined state environmental protection
agency structure found that the structure can have statistically significant effects on state
environmental policies. The most significant effect of structure on environmental policies
is whether the environmental protection agency is housed within a public health
department. States that house their pollution control functions within the health
department have lower levels of policy adoption, expenditures, and enforcement (A.
Bacot & Dawes, 1996; Hoornbeek, 2011; Hunter & Waterman, 1996; J. Lester, 1980).
Most of these studies examined data prior to 1990; many states have restructured their
agencies since 1990. It would be interesting to evaluate the impact on policy outputs
and enforcement of those states that moved their programs out of the department of
health after 1990.
The current structures of state environmental protection agencies have evolved
and developed over the past 50 years. What started as dispersed across multiple agencies
and independent boards and commissions has now evolved into primarily three main
structures: (1) Mini-EPA, (2) Super-Agency, or (3) Health Department. The environmental
and health literatures have depended on this basic typology, shown by state in Figure 1
below (Beyle, 1975; Jessup, 1988; Kotchian, 1997; Ringquist, 1993; Shepherd, West,
Hargrove, Schoemaker, & St. Peter, 1999; Sinclair & Whitford, 2012). Most states
centralized all pollution control functions (water, air, and land) into one cabinet-level
agency by the mid-1970s. However, almost half of states initially centralized pollution
control in the department of health. Between 1975 and 2000, 14 states moved their
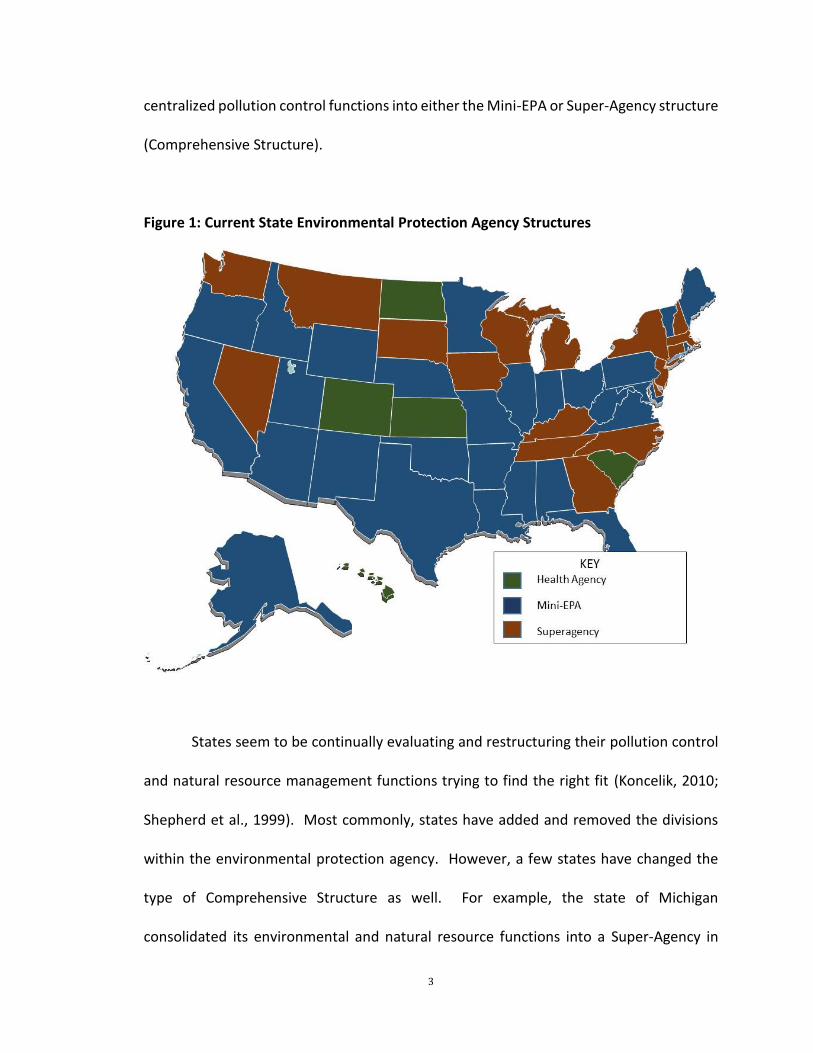
3
centralized pollution control functions into either the Mini-EPA or Super-Agency structure
(Comprehensive Structure).
Figure 1: Current State Environmental Protection Agency Structures
States seem to be continually evaluating and restructuring their pollution control
and natural resource management functions trying to find the right fit (Koncelik, 2010;
Shepherd et al., 1999). Most commonly, states have added and removed the divisions
within the environmental protection agency. However, a few states have changed the
type of Comprehensive Structure as well. For example, the state of Michigan
consolidated its environmental and natural resource functions into a Super-Agency in
4
2009 and subsequently in 2011 broke them back into separate agencies (via Executive
Orders). No state has moved the pollution control functions out of the Department of
Health since 2000.
Research Question
Ideally, public bureaucracies, such as state environmental protection agencies, are
designed to be as efficient and functional as possible with the appropriate horizontal and
vertical specifications to meet the regulatory mission of the agency. Early rational
organizational theorists argued for this type of apolitical design, providing guiding
management and structural principles (Gulick, 1937; Taylor, 1911; Weber, 1922).
However, in practice, the design of these agencies is subject to the political motivations
of those designing them, the sociological context of a state, and the economic constraints
at the time of creation. According to Moe (1990a), “a positive theory of organizations has
two goals: 1.) to explain where institutions come from and why they take the forms they
do, and 2.) understand their effects for political and social behavior (p 215).” The purpose
of this dissertation is to examine both of these questions in organizational theory in terms
of state environmental protection agencies. The first two empirical analyses address the
first goal posed by Moe:
What factors influence state adoption of a comprehensive environmental
structure?
What factors influence state adoption of a Mini-EPA versus Super-Agency
structure?
5
To address these questions, I develop a theory of state adoption of organizational
structure drawing on theories of public organizations.
The third empirical analysis addresses the second goal posed by Moe:
Does a Super-Agency structure promote state development of innovative
environmental policies?
To address this question, I develop a model of policy adoption that draws on internal
determinants and the innovation diffusion literature.
Organization of Study
This dissertation is structured in eight chapters. These chapters outline the history
of state environmental protection agencies, theories of state agency and state
environmental policy adoption, and the three main empirical analyses. This first chapter
provides an introduction and overview of the dissertation.
Chapter Two details the history of state environmental protection agencies in the
context of the development of federal and state environmental laws. This chapter also
describes, in general, the federal and state environmental government structures. Finally,
this chapter provides a description of comprehensive and incremental restructuring that
states have undergone since 1960.
Chapter Three develops a theory of state administrative agency adoption through
a review of the organizational and political literature. Building on a model developed by
Beyle (1975), this section describes how state environmental protection agencies develop

6
in response to political motivations, administrative needs, socioeconomic characteristics,
and environmental severity.
Chapters Four and Five present the empirical analyses that draw upon the theory
developed in the previous section to understand why states chose to adopt a
comprehensive state environmental protection agency and a Mini-EPA or Super-Agency
structure.
Chapter Six outlines the theory of state adoption of environmental policies,
focusing on the role of decisional systems and specifically the state agency structure.
Chapter Seven applies this theory to explore the influence of structure on adoption of
environmental policies to address second and third generation pollution problems. These
12 policies are used to create an index of innovativeness.
Chapter Eight is a summary of the conclusions from the analyses, and future
research prospects.

7
CHAPTER 2: DEVELOPMENT OF STATE ENVIRONMENTAL PROTECTION AGENCIES
Every level of government in the United States (US) from cities to the federal
government is involved in environmental pollution control in a system often described as
environmental federalism. This interrelated system of governance has developed both
from the bottom up and top down since the first local pollution ordinances were passed
in the mid-1800s and the first federal environmental pollution control legislation was
passed in 1899.1 States lie in the center of this federal system, responding to pressure
from their citizens, policies of their counties and cities, and federal mandates. The level
of authority and discretion exercised by cities, states, and federal government varies
across the numerous regulations. Each level of government has developed its own
regulatory structures to protect environmental quality in response to political,
administrative, and social pressure. The focus of this dissertation is on the structures that
have developed at the state level to manage pollution. However, given the interrelation
between the levels of government, it is important to understand how state agencies
developed within the federal system. This section outlines the history of environmental
regulation, focusing on the changing roles of states and the federal government and the
development of state environmental protection agencies.
Pollution control has moved through three phases: (1) local control, (2) multi-
agency or dispersed state control, and (3) centralized state pollution control (Hines,
1966). As pollution control functions have been adopted at each higher level of
1 River and Harbors Act of 1899
8
government, the lower levels of government retain some responsibilities, creating an
interrelated, intergovernmental system of governance.
The first pollution control regulations, adopted in the late 1800s, focused on water
pollution control.2 While a few municipalities had adopted air pollution control legislation
prior to 19103, focus on air pollution developed after water pollution control. During the
initial phase, municipalities and counties developed ordinances, primarily focused on
health impacts of pollution, in response to local concerns. As the severity of pollution
issues and cross-jurisdictional impacts increased, states began to respond with state
legislation in a piecemeal fashion, placing authority for regulation in multiple agencies
and boards.
Finally, states centralized their management of pollution into a single agency.
States were driven by two major influences toward a centralized pollution control system:
(1) political pressure to develop more effective pollution control systems to address the
complex pollution issues facing states; and (2) political pressure to improve the
professionalism and efficiency of state government. These two movements coincided
with each other, driving states to move to the final phase of centralized state control.
This chapter provides a description of the development of state pollution control
structure in context of these two influences.
2 Initial water pollution laws prohibited dumping of “poisons” and dead animals and declared discharge of
such material a “public nuisance. But these early laws were not very strong or comprehensive. Ohio in
1893 and Pennsylvania in 1905 were first states to adopt a regulatory authority for (non industrial) water
pollution (Andreen 2003). 3 Municipalities first began adopting legislation that declared emissions of smoke to be a public nuisance
in1881. Chicago and Cincinnati were the first two cities to adopt such legislation.

9
Environmental Federalism
The nature of environmental pollution defies the logic of federalism. The
American federal system was developed to tie together different levels of government
while maintaining “the existence and authority of both” (Elazar, 1984, p. 2). At its heart,
American federalism is the lack of centralization – the levels of government may be bigger
or smaller, but they do not lie in a hierarchy (Elazar, 1984). Within a federal system, states
and localities respond to issues within their borders and are thought to best represent
interests of their communities. However, this structure can create obstacles to address
environmental pollution, which may be created in one community (providing economic
growth) and negatively affect another community. When the first major federal air
pollution control legislation was passed in 1955, the responsibilities of each level of
government were clearly assigned with little overlap, like a ‘layer cake’ (USEPA, 1983). At
that time, no state had a comprehensive pollution control structure in place, but some
states had begun to enhance and develop their pollution control programs. The federal
government became involved in pollution control regulation in response to a concern that
states lacked the will or capacity to protect environmental quality. Even initially, the
federal government refrained from mandating state action, instead using financial and
technical assistance to incentivize states.
After the initial federal legislation, that was designed to empower states to
develop a regulatory structure, failed to achieve significantly improved state capacity, the
federal government increased its role in environmental protection. Starting in 1970, the
federal government assumed significant authority to regulate environmental pollution

10
through the passage of over 20 major federal statutes that cover air, water, and land
pollution. States, partly in response to federal regulation and political pressure, began to
more quickly develop pollution regulatory structures, entering into the final phase of
pollution regulation. Since 1970, the regulatory relationship between states and the
federal government has been described as coercive federalism, cooperative federalism,
creative federalism, creeping federalism, and new federalism. The current system
resembles more of a ‘marble cake’ with overlapping responsibilities across governments
that require cooperation between each level of government (USEPA, 1983) and often the
private sector.
This increased federal involvement created a hierarchy of regulatory control that
runs counter to the traditional theory of American federalism. Proponents of federal
involvement argue the Commerce Clause of the U.S. Constitution provides the authority.
The question that has dominated environmental policy literature since the 1950s, when
the federal government first became involved, is whether state or federal regulation of
environmental pollution would lead to the socially optimal level of environmental quality
across communities. Legal scholars, economists, and political scientists have all examined
environmental federalism over the past 40 years. The primary focus for much of the
literature has been an either-or-decision between federal or state control. Proponents of
a strong federal role in environmental protection argue that both the nature of
environmental problems and types of state government incentives require centralization
of control. Without the federal intervention, states would compete in a race-to-the-
bottom in environmental regulations to maintain economic development while ignoring

11
the local and interstate externalities associated with environmental pollution. Those
scholars arguing for devolution of authority to states dispute that the nature of
environmental problems require federal control, as many are local or regional in nature,
and are best addressed at those levels where local conditions and public preferences are
unique. In contrast, states would not compete in a race-to-the-bottom, but instead as
economic conditions improve, the public demand for environmental quality would
actually increase.
A ‘third generation scholarship’ is emerging now that argues that there is a
jurisdictional mismatch in many environmental regulations where the federal
government has control over local issues and local governments are assuming control
over federal issues (Adler, 2005; Esty & Geradin, 2001). Additionally, others are arguing
for a ‘civic environmentalism’ that focuses on partnerships between multiple levels of
government and industry and environmental groups to develop and implement
regulations that fit the nature of the environmental problem (Durant, Fiorino, & O'leary,
2004). Esty and Geradin (2001) summarize the general consensus in current scholarship:
“…regulatory systems should be set up with enough interjurisdictional cooperation (or
harmonization) to ensure that transboundary externalities and other market failures are
addressed, but with a sufficient degree of regulatory competition to prevent the resulting
governmental structure from becoming an untamed, overreaching, or inefficient
Leviathan”
12
Environmental Governance
In exploring state environmental protection agencies, it is important to define
what is meant by environmental protection and how that is different from natural
resource protection. Environmental protection policies are regulatory policies designed
to affect environmental quality, specifically focused on pollution control. Environmental
protection policies include the Clean Air Act (CAA), Clean Water Act (CWA), Resource
Conservation and Recovery Act (RCRA) that focus on reducing environmental pollution.
The goal of natural resource protection, distributive policies, is to conserve resources and
allocate public resources to specific groups (i.e. grazing access, mining rights, recreational
use) (Kraft, 2007). Generally, natural resource policies are developed to manage
resources such as forests and lakes, with a focus on quantity and consumption (Brown &
Marshall, 1996). Natural resource protection includes parks and recreation, forest
management, and water conservation.
USEPA
The mission of the USEPA is to “protect human health and the environment”
(USEPA). The EPA has a main headquarters office in Washington DC, but also has 10
regional offices, adding another interesting layer in the complex intergovernmental
relationship. Other federal agencies that have responsibility for environmental
governance include the Office of Surface Mining (OSM) in the Department of the Interior,
the Public Health Service (prior to creation of USEPA), US Fish and Wildlife Services,
Department of Agriculture, Department of State, Department of Transportation, Health
and Human Services, Department of Defense, Department of Justice, Council on

13
Environmental Quality, Homeland Security, Department of Labor, Department of Energy
(DOE), Housing and Urban Development (HUD) and the National Oceanic and
Atmospheric Administration (NOAA) in the Department of Commerce.
Figure 2: USEPA Organizational Chart
In addition to the various administrative offices, the USEPA is structured around
the type of pollution: water, air, solid waste, and chemical safety.
State Environmental Protection Agency
State environmental protection agencies manage pollution control for all major
media (water, air, land). Generally, the pollution control functions within a Super-Agency
14
and in a Mini-EPA are structured in a similar structure as the USEPA (the current structure
of each state’s pollution control, energy, natural resources management, parks and
recreation, and agriculture agencies is included in Appendix A). According to Ringquist
(1993), state activities in environmental policy fall into five categories: setting goals and
standards, designing and implementing programs, monitoring and enforcement, research
and development, and funding. The USEPA was initially distrustful of states’ ability or
capacity to manage environmental policy within any of these categories and did not freely
devolve authority to states. However, over time and in response to the general
devolution in the 1980s and improvements in state capacity, the USEPA increased
environmental devolution to the states (Ringquist, 1993). Under authority granted in
U.S. environmental laws, states have assumed primacy for the majority of federal statutes
(see table in Appendix D). Even in states that exercise delegated authority, the USEPA
does spot inspections and monitoring.
Development of State Pollution Control
Jenks and Wright (1993) identify five stages of state agency development between
1960 and 1990: first generation agencies, second generation agencies, third generation
agencies, fourth generations, and emergent agencies. The authors examined the
agencies that existed in at least two-thirds of states at the start of each decade. These
agencies that the authors identify can be divisions within larger agencies or the agencies
themselves. I will use department to describe the larger department (i.e. Department of
Environmental Protection) and division to describe subdivisions of the larger agencies (i.e.

15
mining, water resources, and air pollution). States’ pollution control structures developed
throughout this time period in a piecemeal fashion adding new divisions and boards to
address new issues. As states adopted new responsibilities and divisions, state leaders
began consolidating pollution control functions into a Comprehensive Structure. Figure
3 below shows the decade that each state moved its pollution control functions into a
Mini-EPA or Super-Agency structure.
Figure 3: State Adoption of Current Environmental Regulation Structure
The following discussion outlines the history of environmental regulation,
focusing on the changing roles of states and the federal government and the development
of state environmental protection agencies. I have divided the history of environmental
regulation into five periods based on multiple sources in the literature (Eisner, 2007; Klyza

16
& Sousa, 2008; Kraft, 2007; J. Lester, 1995; Ringquist, 1993; USEPA, 1983; Vig & Kraft,
2003). The five periods are: State and Local Control (up to 1960), Creeping Federalism
(1960-1969), Federal Activism (1970-1980), Devolution (1980-1990), and Evolving
Federalism (1990–current). A list of major federal laws is included in Appendix B.
State and Local Control (Up to 1960)
First generation state executive agencies, created prior to 1960, developed to
serve the traditional functions of states, including health, budgeting, and police (Jenks &
Wright, 1993). States were more focused on managing natural resources for human
consumption through agencies such as agriculture, fish and game, mining, oil and gas, and
forestry. After the dust bowl events, states expanded their focus to soil conservation. As
the conservation movement gained momentum, state governments expanded to include
water resources and parks and recreation divisions. Each of these functions was often
housed within separate agencies and/or independent boards with little coordination.
Traditionally, state legislatures often created a board or commission to oversee the
programs and agencies as an extra measure of maintaining control (Gargan, 1999, p. 17)
Local Control
Prior the 20th century, environmental pollution (air, water, land) was an issue
primarily regulated (if at all) by cities and counties (Haskins, 1969; Hatchard, 1962; Melosi,
2000; Stein, 1962; Stern & Professor, 1982). Cities began to develop policies and
programs to address smoke, sewage and sanitation issues at the end of the 19th century
in response to health effects of pollution. Between 1860 and 1896, over 3,000 public

17
water systems were constructed (Andreen, 2003; Goklany, 1998; E. Ringquist, 1993). The
development and growth of the public health movement coincided with many of these
local pollution regulations and services. Cities began adopting departments of health,
which often assumed responsibility for sanitation, air quality, and sewage. It is important
to note that the focus of sanitation programs was on pollution from sewage rather than
industrial pollution (Andreen, 2003). New York City established the first municipal health
department in 1866 and by 1900 the majority of larger cities had a health department
State Role
States began to take a more active role in pollution control at the turn of the
century because “localities were unable to control pollution coming from upstream and
had no incentive to control their own pollution” (Davies III, 1970, p. 121). The initial focus
of state pollution control was on the health impacts of pollution. Massachusetts created
the first state board of health in 1869 and by 1909 all states had a board of health
(Andreen, 2003). In response to urban pollution concerns, many states began creating
separate divisions or boards for water pollution control and air pollution control (Davies
III, 1970). By 1927, almost all states had a sanitary engineering division within their
departments of health. More than half of states (28) gave their boards of health
regulatory authority for controlling water pollution by 1946 (Melosi, 2000). By 1948,
every state had assumed control of water pollution from local governments, placing the
administration in the department of health or independent boards. States began to
actively develop environmental regulations in the 1950s (Davies III, 1970). States also

18
gave regulatory authority for water quality pollution to other agencies, such as parks and
natural resources (Andreen, 2003; Hines, 1966).
Oregon, in 1952, was the first state to pass comprehensive statewide air pollution
legislation and to establish a state air pollution control agency (Ringquist, 1993). By 1960,
15 states had passed some type of air pollution control legislation (Aborn & Axelrod, 1967;
Hatchard, 1962; Stern & Professor, 1982). In 1950, the US Public Health Service (USPHS)
published a Suggested Water Pollution Control Act, to encourage states to strengthen
their water pollution control laws. Over half of states responded with strengthened state
laws and agencies (Andreen, 2003). By 1956, 19 states housed water pollution control in
an independent board, commission, or agency, seven states housed it within the
department of health, and three states housed it within other existing agencies such as
fish and game commissions.
Federal-State Relationship
Prior to the 1950s, states managed environmental pollution problems as part of
their policing powers (Anderson & Hill, 1997; Percival, 1995; Ringquist, 1993). The federal
government intervened rarely and only if issues dealt with interstate commerce (such as
the Refuse Act of 1899 that prevented refuse in interstate rivers). States used the court
system to address interstate spillovers of environmental pollution. The issue of
environmental pollution was not a salient one in the public dialogue until the 1960s.
The federal government began developing federal regulations to address
environmental pollution starting with the Water Pollution Control Act in 1948 and the Air
19
Pollution Control Act in 1955. These initial federal regulations primarily provided funding
to states to encourage them to establish pollution control regulations and infrastructures.
“The federal environmental programs…were premised on the notion that environmental
problems were the responsibility of state and local governments” (Percival, 1995, p.
1156). The federal government tried to provide states with the tools to develop the
capacity and infrastructure to implement a pollution control system while keeping
authority and control at the state level. While many states had created some capacity,
either housed within health departments or independent air and water pollution control
boards, no state had created a comprehensive state agency.
Creeping Federalism (1960-1969)
Second generation agencies developed in the 1960s in response to current issues
of the day such as civil rights, citizen activism, “Great Society” policy initiatives, and
environmental concerns. The majority of states created an air quality division during this
time period (Jenks & Wright, 1993). By 1968, 44 states had passed some type of air quality
legislation (Regens & Reams, 1988; Wang, Dennis, & Tu, 2007; Waterman & Meier, 1998).
It was not until the late 1960s that states began to create independent agencies that
combined air and water quality and solid waste regulation. The majority of states still
housed these functions either in independent boards or within the department of health.
Eight states adopted a comprehensive structure for environmental regulation in the later
part of this decade (1967-1969).

20
During the 1960s, increasing scrutiny of state pollution programs found four main
faults: (1) inadequate statutory authority, (2) lack of forceful administration, (3)
inappropriateness of the public health domain, and (4) lack of central authority (Reenock
& Poggione, 2004). While the initial focus of pollution control was on the health effects
of biological contaminants, increasingly concern had grown for the effects on agriculture
and recreation, and the effect of industrial pollution (Scorsone & Plerhoples, 2010).
States began consolidating programs and increasing the effectiveness of these programs
during this time period. However, there was a wide variation in state administrative
capacity in general and in terms of environmental regulation. State spending for air
pollution control was 0.0006 percent of total state expenditures in 1962; less than six of
the 32 states that had some kind of air regulations were actually enforcing those
regulations in 1963; and by 1970, over half of state air pollution control agencies had
staffs of fewer than 10 people (Ringquist, 1993).
While the initial federal legislation in the 1950s clearly maintained state
responsibility for development and implementation of environmental pollution control
laws, the amendments during the 1960s and 1970s ultimately established a federal role
in pollution control. The FWQA of 1948 provided states with funding and technical
assistance, but the Water Quality Act of 1965 granted the federal government authority
to establish water quality standards for interstate waterways. While intrastate
waterways were still under state control, these amendments required states to develop
water quality standards for interstate waterways within their borders. The Clean Air Act
of 1963 authorized the Public Health Service to develop emissions standards and the Air

21
Quality Act in 1967 authorized the PHS to enforce interstate air pollution standards.
However, the process for implementation for these laws was complicated and difficult to
enforce.
Federal Activism (1970-1980)
During the 1970s, the third generation agencies that developed, “constituted the
administrative foundation stones for state resurgence in the 1980s” (Jenks & Wright,
1993, p. 81). These agencies included energy and environmental protection agencies.
The burst of federal environmental regulations drove states to expand their capacity for
environmental regulation. States continued developing environmental protection
agencies either as stand-alone agencies or as part of new superagencies combined with
related functions, such as natural resource management. The majority of the 23 states
that adopted a Comprehensive Structure during this decade did so within the first three
years after the creation of the USEPA.
While the federal government had been incrementally increasing its role in
environmental pollution protection since 1955, it drastically increased its role with a
series of laws passed in the early 1970s. As described in the literature, policies generally
increase incrementally unless there is some punctuation or focusing event to drive a more
dramatic change (Birkland, 1997; True, Jones, & Baumgartner, 2007). The dramatic
change was propelled by a “quite phenomenal rise in public concern for the environment”
(Jones, 1974, p. 78). One public opinion poll found that the number of people concerned
about air pollution between 1965 and 1970 jumped 41 percent (Jones, 1974).
22
Kingdon (1995) argues that there are streams in agenda setting: problem, policy
and politics. The beginning of the 1970s was an unusual time when the “problem, policy
and politics streams converged” (Kraft, 2007). First, problems captured the attention of
policy makers, scientists and public health officials who became aware of the negative
health and environmental consequences of water, air, and land pollution. The federal
government, during the 1950s and 1960s invested millions of dollars to identify the
“problem” of environmental pollution. Second, the policy makers developed policies to
address this problem. The federal government passed increasingly more aggressive
policies throughout the 1960s to address the problem. However, the final policy stream
of politics did not fall into place until 1970 when the problem captured the attention of
the public. This section describes how the final policy stream of public opinion converged
to dramatically increase the federal role in environmental regulation.
Public opinion was driven by increased availability of information, major
environmental disasters, and a nationalization of media, especially television. Major
popular works were published about the effects of environmental pollution such as
Rachel Carson’s Silent Spring, in 1962 and Paul Ehrlich’s Population Bomb, in 1968. These
books not only identified the effects of pollution, but also highlighted the limits of the
planet to manage human development. In January of 1969, an error on an offshore
drilling rig caused up to 100,000 barrels of oil to spill off the coast of Santa Barbara,
California. In June of 1969, an oil slick on the Cuyahoga River in Cleveland, Ohio caught
fire. While the Cuyahoga River had caught fire previously, a picture appeared on the cover
of Time magazine that same year (ironically of a previous fire). These two events angered

23
the public and generated public support for environmental regulation. The national
media brought images into the homes across the country of the Cuyahoga River on fire
and the Santa Barbara oil spill, generating public opinion support for environmental
groups (Adler, 2004). The first Earth Day was celebrated in April 1970, drawing even more
public attention to the problem of environmental pollution. There was strong bipartisan
political support in the US Congress and in the White House to respond to the problem.
President Nixon created the USEPA in 1970 via executive order.
It is important to clarify that there was public support not just for a government
response to environmental pollution, but more specifically for a federal government
response to this problem. The argument at the time was that federal intervention was
required to account for the “regional and interstate nature of environmental pollution”
and address the concern that variations in state programs could “threaten economic
equity and efficiency” (USEPA, 1983). The environmental movement followed the Civil
Rights movement and the New Deal, where confidence in the federal government was
high; the variation in state response to the Civil Rights Movement had weakened public
opinion of the efficacy of state control (Anderson & Hill, 1997). The federal government
had given states almost two decades to respond to the problem and the argument was
made that the states did not have the ability or will to respond. At this time, only eight
states had a comprehensive environmental protection agency to implement regulations.
Many scholars have also highlighted the influence of environmental and industrial
interests. In general, at the end of the 1960s, there were no “well-defined” interests
lobbying for environmental pollution control (Butler & Macey, 1996). The Sierra Club and
24
Audubon Society had been established in 1892 and 1905 respectively, but focused on
conservation, not environmental pollution. The first interests to focus on environmental
pollution, Environmental Defense Fund and the Natural Resources Defense Council were
established in 1967 and 1970, respectively (J. Lester, 1995). In response to public opinion,
the Sierra Club and Audubon Society were able to expand their mission to include
pollution control (Percival, 1995). As a result, the Sierra Club, which had 35,000 members
in 1970, had over 180,000 by 1980 (J. Lester, 1995). Finally, as states with the
administrative and financial capacity began developing environmental regulations,
industry groups pushed for national regulations to reduce their costs of compliance. For
example, in response to state vehicle emission standards, the automobile industry pushed
for national emission standards (Adler, 2004).
Driven by public opinion and support, the federal government assumed control
over pollution control across air, land, and water. Nine major environmental laws were
passed and amended many times during this decade. These federal laws increased the
federal role in regulating pesticides, mobile and stationary air pollution sources, water
pollution sources, noise pollution, mining operations, chemical manufacturing, and
hazardous waste management and disposal. The Clean Air Act (CAA) and Clean Water Act
(CWA) established a regulatory relationship in which the Federal government establishes
standards and the states may then develop and implement a plan to achieve those
standards. If USEPA approves the state water quality plan, the state may then assume
primacy for enforcement of those standards. States can assume authority for standard
setting and enforcement authority if their standards are at least as stringent as the

25
Federal standards. In addition, under the CAA, each state that wants enforcement
authority must develop and update State Implementation Plans (SIP) describing how they
will meet the NAAQS that the USEPA must approve. If a state does not submit a SIP, the
USEPA will impose a Federal Implementation Plan on that state. The SIP process is an
evolutionary process in which states submit plans for specific pollutants, or metropolitan
areas, or category of emission sources (Ringquist, 1993).
Devolution (1980-1990)
The high productivity of the Congress in the 1970s in passing environmental
legislation faced a threatening political response in 1980 with the election of President
Ronald Reagan. In general, President Reagan felt that the federal government was too
large, inefficient, and negatively affected economic development. Environmental
pollution control was part of the President Ronald Reagan’s New Federalism push to
devolve authority over regulatory programs back to the states (Percival, 1995; Stewart,
1976). Reagan’s New Federalism included (1) administrative initiatives to reduce the
burden of current regulations, decrease the number of future regulations, and return
power to the states for enforcement of many laws; and (2) consolidation of block grants
to provide states more autonomy (Zimmerman, 1991). One strategy used to return
power to the states was to push states to assume primacy delegation under the major
environmental laws (Crotty, 1987). During the 1980s, states transformed their
institutional capacity, including their environmental administrative capacity (J. Lester,
1995; Stewart, 1976). Although the executive branch was working to reduce federal

26
control, Congress enacted many new laws and amendments to the first wave of
environmental laws in the 1970s, often strengthening federal control (some speculate
this was in response to New Federalism) (Percival, 1995).
States adopted less than 10 new types of divisions during the 1980s (fourth
generation) because states focused more on consolidation than creation. (Jenks & Wright,
1993) Again, activities at the federal level impacted state division creation as federal laws
related to hazardous waste passed in the late 1970s pushed states to create new related
agencies. States created divisions for hazardous waste, groundwater management, and
underground storage tanks. Six states adopted a Comprehensive Structure during this
decade, and many states applied for and were granted primacy to enforce various federal
environmental regulations.
Evolving Federalism (1990-current)
Between 1970 and 1990, states significantly developed their capacity to develop,
manage, and enforce environmental laws. By the mid-1990s, seven more states adopted
a Comprehensive Structure for environmental regulation. More states were willing to
apply for primacy and the USEPA was forced to acknowledge this capacity and facilitate
more devolution of authority to states. Within these overlapping responsibilities across
governments, like marble cake, states and the federal government have had to evolve in
their relationship to cooperate (cooperative federalism) (USEPA, 1983). Since 1990, the
relationship between the levels of governments has continuously evolved through
cooperation and conflict.

27
Cooperation
By the mid-1990s, a majority of states had assumed primacy over at least one
aspect of the CWA and CAA implementation (See Appendix D for state primacy
information). While states pushed for more authority, the USEPA attempted to improve
the relationship with the states. During the 1990s, the focus was on improving the
working relationships between the federal and state agencies. As states enhanced their
capacity during the 1980s and assumed more responsibility for enforcement of federal
regulations, tension developed between the USEPA and state environmental protection
agencies. States pushed back against “unfunded mandates” that gave states additional
regulatory responsibilities without additional funding necessary to implement. The
Unfunded Mandate Reform Act (UMRA) was passed in 1995 to reduce the ability of the
federal government to impose additional mandates and responsibilities on states without
adequate funding. While the UMRA has not completely eliminated unfunded mandates,
it has reduced their number and increased focus on to the fiscal effects of federal
legislation on state and local governments (Dilger & Beth, 2014). In addition, the USEPA
developed the National Environmental Performance Partnership System (NEPPS) to
improve federal-state relations. This program was supposed to focus on achieving
measurable outcomes, providing states with greater flexibility, and enhancing
accountability. Performance Partnerships Agreements (PPAs) were entered into between
the federal and state governments; and states were provided with block grants and able
to direct that funding toward their own priorities In addition, OSM adopted the REG 8
Directive to improve federal-state relationships in surface mining regulation
28
implementation and enforcement (Scheberle, 2004). Governance literature has
examined the impact of these various management activities on environmental policy
outputs and outcomes.
Type and Efficiency of Regulations
In addition, an increased focus in the 1990s on the efficiency of environmental
regulations, developed in response command and control regulations of the 1970s, led to
more cost benefit analyses and new types of regulations (Clean Air Act Amendments
1990). After the early 1990s, very few major federal environmental laws were passed.
Under President Clinton, the USEPA began to create and market voluntary programs, such
as the lead and radon programs.
Second and Third Generation Pollution Problems
The focus began to shift from first generation pollution problems to second and
third generation problems. The environmentally-related divisions created since 1990 are
focused on more state-specific characteristics and addressing these types of pollution
problems, such as coastal zone management and mining reclamation. States also began
to adopt more collaborative management policies and ecosystem management.
“Collaborative public management is a concept that describes the process of
facilitating and operating in multi-organizational arrangements to solve problems that
cannot be solved by single organizations” (O'Leary & Bingham, 2009). Collaborative
government promotes coordination and cooperation across multiple levels of
government, multiple government agencies, interests, and private stakeholders. States

29
have adopted collaborative management techniques to address environmental policies
that span jurisdictions, are generated by multiple dispersed sources, and cross
environmental media.
The focus of environmental and natural resource policy evolved during the 1990s
from controlling pollution from a single source or managing a single resource, such as a
lake or a park, to a more ecosystem-focused management. This evolution was founded
in an understanding that individual resources were part of a larger ecosystem and
changes in one part of that ecosystem can affect the whole ecosystem. The USEPA began
a transition to ecosystem management in 1993 by convening a working group to
investigate “if the agency could use ecosystem management to solve some intractable
problems facing it” (Brown & Marshall, 1996). The first comprehensive work on
ecosystem management, Ecosystem Management for Parks and Wilderness, by James
Agee and Darryll Johnson, was published in 1988. This book was a summary of a
workshop on the topic cosponsored by the National Park Service and the USDA Forest
Service. Since the early 1990s, at least 20 states have adopted a watershed management
approach, which is founded in the concept of ecosystem management.
Conflictual
The relationship between the federal and state governments is often conflictual
with some states pushing back on some federal regulations and other states moving
forward to address pollution problems that the federal government has not addressed.
Examples include the conflict over hazardous waste facility siting in the 1990s and the

30
recent court battles over CO2 regulations that will have a severe impact on coal (“War on
Coal”). On the other end, many states have moved forward aggressively with climate
change and renewable energy legislation in response to lack of action at the federal level.
Development of the Professionalism and Efficiency of State Government
Since the early 1900s, multiple waves of structural, constitutional, and
management reforms have transformed state governments into a more competent,
efficient, active, and professional level of government (Bowman & Kearney, 1986; Jenks
& Wright, 1993). The reforms did not happen at once, but instead in four distinct waves,
with different driving factors and outcomes. The first three waves, driven by reports of
federal commissions, focused solely on the executive branch in 1917, 1937, and 1945.
The fourth, and longest wave, in the late 1960s and early 1970s, has encompassed
reforms to all three branches of the government (Bowman & Kearney, 1986). The
executive branch reforms during this time have included reforms to the governor’s office
and the state bureaucratic structure (Berkman & Reenock, 2004; Bowman & Kearney,
1986; Jenks & Wright, 1993). Bureaucratic reforms include reorganization and
consolidation of existing functions, creation of new functions, and increased
professionalization. States have made incremental changes since this last wave of reform.
One major bureaucratic reform, adopted by over 20 states, was to give the governor
power to reorganize the executive branch through Executive Order.
State environmental protection agencies developed within this fourth wave of
reforms, and like all other reforms, reflect the characteristics of the state, the existing
31
structure of the bureaucracy, funding available, federal mandates, and changing social
pressures (Jenks & Wright, 1993). State environmental protection agencies have
developed and changed as part of comprehensive state reorganizations, incremental
state reorganizations, and focused environmental regulation reorganizations. It is
important to understand the history of state executive branch reorganization and
restructuring to understand why states have adopted the different environmental
structures.
Comprehensive State Agency Restructuring
Prior to the 1960s, the state executive branch had very little power or authority.
Many executive branch officials, in addition to the governor, were elected positions,
including the attorney general and secretary of state. While many states still have a
number of elected executive branch officials, the strength of the governor’s office has
increased across all states in terms of appointment power and veto power. State
legislatures often established a governing board or commission to oversee programs and
agencies, and often these members reported to the state legislature and not the governor
(Garga, 2000). Initially, many state environmental regulation functions were housed
within these types of boards and commissions.
Between 1965 and 1979, the executive branch in 21 states underwent a
comprehensive reorganization (See Appendix C for list of states and reorganization).
Twelve states during this time adopted a comprehensive environmental structure during
the reorganization. Reforms were directed at addressing duplication and overlap of
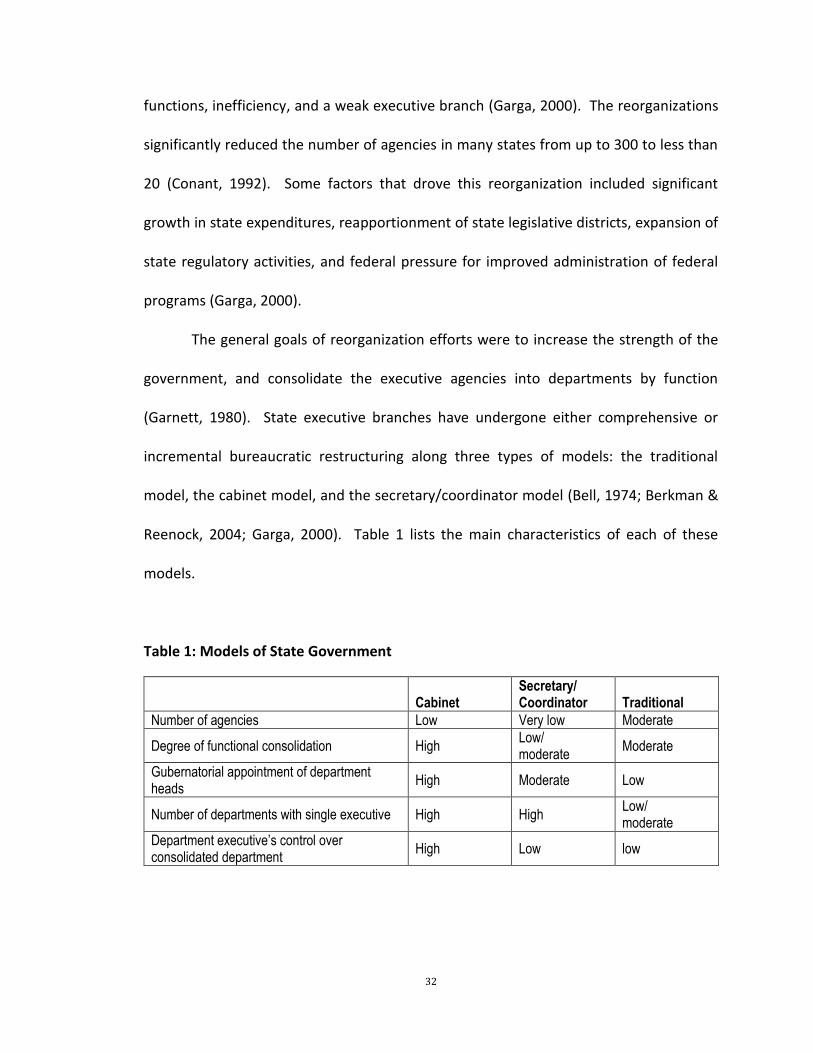
32
functions, inefficiency, and a weak executive branch (Garga, 2000). The reorganizations
significantly reduced the number of agencies in many states from up to 300 to less than
20 (Conant, 1992). Some factors that drove this reorganization included significant
growth in state expenditures, reapportionment of state legislative districts, expansion of
state regulatory activities, and federal pressure for improved administration of federal
programs (Garga, 2000).
The general goals of reorganization efforts were to increase the strength of the
government, and consolidate the executive agencies into departments by function
(Garnett, 1980). State executive branches have undergone either comprehensive or
incremental bureaucratic restructuring along three types of models: the traditional
model, the cabinet model, and the secretary/coordinator model (Bell, 1974; Berkman &
Reenock, 2004; Garga, 2000). Table 1 lists the main characteristics of each of these
models.
Table 1: Models of State Government
Cabinet Secretary/ Coordinator Traditional
Number of agencies Low Very low Moderate
Degree of functional consolidation High Low/ moderate
Moderate
Gubernatorial appointment of department heads
High Moderate Low
Number of departments with single executive High High Low/ moderate
Department executive’s control over consolidated department
High Low low
33
The traditional or standard model of government required less restructuring and
maintained a large number of agencies. Under this structure, many of the boards and
commissions that developed to support and manage agencies are maintained. The
agency heads can be appointed by the governor, but many are still elected (commissions
and boards) (Bell, 1974; Garnett, 1980). In the cabinet model, the governor appoints the
heads of each agency and those managers are responsible to the governor. Divisions tend
to be grouped into a smaller number of agencies that manage a wide range of activities
(Bell, 1974). Agencies in the secretary/coordinator model incorporate a broad set of
divisions and activities and a secretary is appointed by the governor to manage the
multiple divisions within the agency (Bell, 1974). This third model consolidates many
smaller agencies and generally has the fewest number of agencies. (See Appendix C for
state reorganization dates, types, and models used).
Another major wave of state reorganizations during the 1980s was driven more
by fiscal stress than duplication or limited executive branch authority and focused on
reducing employment and spending (Conant, 1992). Five states underwent
reorganizations during the 1980s. While some of these states’ reorganizations were
driven by the desire to reduce duplication, many were also trying to reduce the size of
state budgets.
Incremental State Agency Restructuring
Between 1900 and 1975, approximately 44 percent of state reorganizations were
partial or incremental reorganizations (Garnett & Levine, 1980). A partial or incremental
34
reorganization only focuses on one or two departments at a time. For example, Oregon
reorganized a few departments over the course of a few years in the late 1960s and 1970s,
including their pollution control functions. An environmentally-focused reorganization
would be considered an incremental reorganization. Over time, the incremental
reorganization reduces the number of agencies and restructures the executive
government through focused agency consolidations and reorganizations. However, the
size of the reduction of executive branch entities is less under these incremental
restructurings than under a comprehensive restructuring (Berkman & Reenock, 2004).
The initial states to adopt the Comprehensive Structure (1967-1975) did so as part of an
(incremental) environmentally-focused reorganization (Beyle 1975). Sometimes, state
leaders find it more politically viable to push through restructuring in an incremental
process over a longer period of time (Berkman & Reenock, 2004; Garnett & Levine, 1980).
35
CHAPTER 3: A THEORY OF STATE AGENCY ADOPTION
The literature examining state adoption of environmental protection agency
structures is very sparse (Beyle, 1975; Claveria & Kaito, 1985; Haskell & Price, 1973;
Shepherd et al., 1999; Sinclair & Whitford, 2012). The general findings in the literature
are that that state environmental protection agencies were initially created to manage
the increased magnitude of environmental programs administered by states, meet
political demands for change, consolidate power, and respond to increased federal
actions and other states’ adoption of similar agencies. Many states also adopted the
Comprehensive Structure as part of an overall state executive branch reorganization
(Beyle, 1975). This section, drawing on these studies and political and organizational
theory, develops a theory of state adoption of state agency structure. The theory can be
applied to state adoption of a comprehensive environmental protection agency and the
specific type of that agency (Mini-EPA or Super-Agency). This theory can also be applied
to adoption of other types of state agencies including higher education, health, and
transportation.
While early rational organizational theorists argue that public bureaucracies are
designed with a focus on efficiency and function, in practice, political motivations,
economic constraints, and socioeconomic characteristics of states often drive the
development of these agencies. The literature on design of public bureaucracies is
primarily theoretical (Hammond, 1986; Moe, 1984, 1990a, 1990b; Williamson, 1981,
1999). The empirical literature that does exist has primarily focused on design of federal
and not state bureaucracies (McCubbins, Noll, & Weingast, 1989; Wood & Bohte, 2004;

36
Wood & Waterman, 1993). The general theory argues that “administrative design reflects
the efforts of enacting coalitions to maximize future political benefits while minimizing
future potential losses” (Wood & Bohte, 2004).
Agency Structure
Structure is an important component of institutional capacity. Institutional
capacity is the “capability of an agency to make and implement policy, net partisan and
ideological differences” (Krause & Woods, 2014). This capacity includes financial, capital,
and human resources; constitutional and legal authority; and management expertise
(Jennings & Woods, 2007). Another way to consider bureaucratic capacity is as resources
(budgetary, clientele, and reputational) and structure/processes. Resources provide the
input and the structure and processes provide the formal organizational context (Krause
& Woods, 2014). According to Honadle (1981), capacity is the ability to:
1. Anticipate and influence change.
2. Make informed, intelligent decisions about policy.
3. Develop programs to implement policy.
4. Attract and absorb resources.
5. Manage resources.
6. Evaluate current activities to guide future actions.
This framework suggests that agency budgets alone are not the only measure of
capacity. Instead an agency with high capacity must also be able to manage those
financial and human resources to implement policy. An agency’s organizational structure

37
and mission will influence an agency’s ability to implement these components of the
framework. “State government capability has at its core the selection and development
of institutional arrangements to carry out a broad range of activities” (Hawkins Jr., 1980).
Organizational structure is a normative construction of rules and roles specifying
who does what, how they do it, and how each relates to the other (Peters & Pierre, 2003;
Scott & Davis, 2007). Organizational structures vary by: size, horizontal and vertical
specialization, demography, locus, and level of institutionalization. Of special interest for
this analysis is the variance in horizontal and vertical specialization. Horizontal
specialization refers to how different specializations (i.e. environmental regulation and
natural resources or water quality and water conservation) are coupled or decoupled
together (Gulick, 1937). Agencies can be organized by: clientele served, territory,
purpose, or function. Vertical specialization describes the level of centralization of the
hierarchical structure and the levels of hierarchy within an organization.
Seidman (1970) proposes that public institutions also vary in terms of the directing
authority (single headed or multi headed) and existence of an advisory or regulatory
council or committee. Many state environmental protection departments report to a
regulatory commission. These commissions range from five members to 15 members and
include governor appointed experts, citizen representatives, and elected officials. Most
of these commissions provide final approval of agency regulations and arbitrate appeals
of agency permitting and enforcement decisions. In most states, state agency directors
report to the commission; however in Virginia and California, the boards are located
within the agency structure.
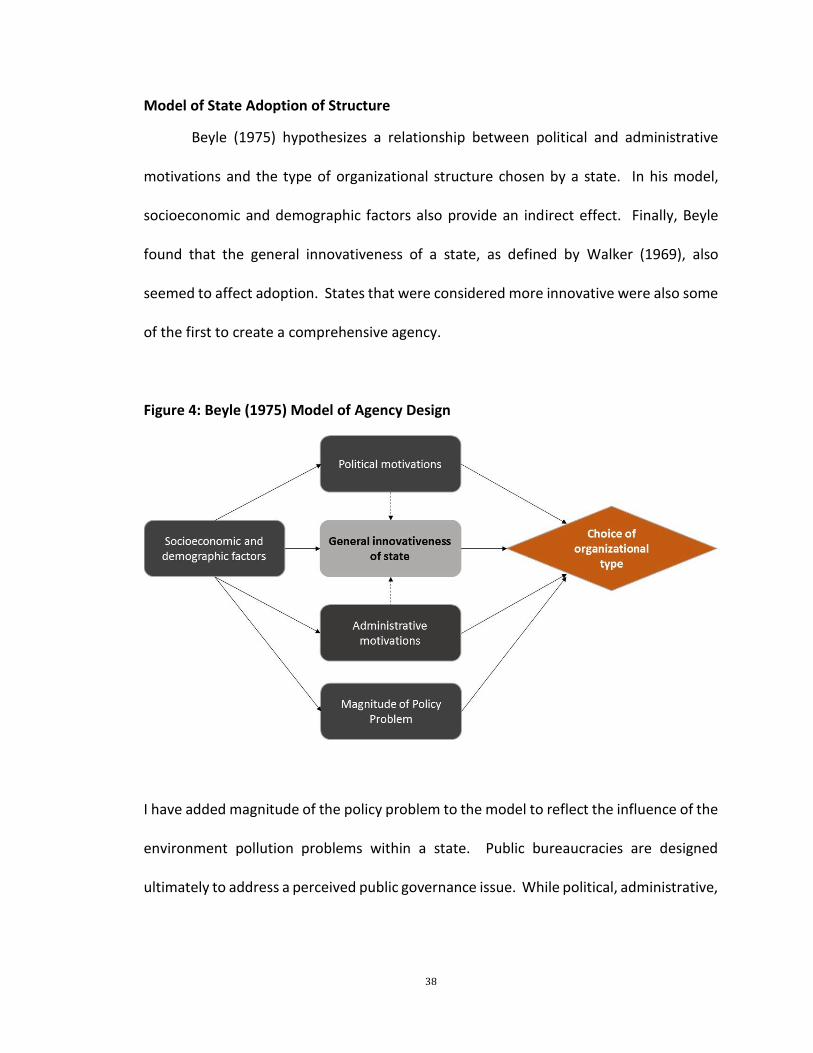
38
Model of State Adoption of Structure
Beyle (1975) hypothesizes a relationship between political and administrative
motivations and the type of organizational structure chosen by a state. In his model,
socioeconomic and demographic factors also provide an indirect effect. Finally, Beyle
found that the general innovativeness of a state, as defined by Walker (1969), also
seemed to affect adoption. States that were considered more innovative were also some
of the first to create a comprehensive agency.
Figure 4: Beyle (1975) Model of Agency Design
I have added magnitude of the policy problem to the model to reflect the influence of the
environment pollution problems within a state. Public bureaucracies are designed
ultimately to address a perceived public governance issue. While political, administrative,
39
and socioeconomic factors can influence that final design, ultimately the problem itself
must be considered.
Political Motivation
According to Moe (1990a), “political institutions arise from politics of structural
choice.” Politicians play a similar role to the entrepreneur in the private sector in
designing political agencies. However, where the private entrepreneur is motivated by
efficiency and profit, the political entrepreneur is motivated by reelection. Politicians
strive to serve their constituencies, reward financial and political supporters, avoid
conflict, and take symbolic stands (Moe, 1984). The political motivations driving policy
outputs can be described as political pressure from constituents and interests and
individual politician’s desire for political control.
Politicians want to be reelected and can respond to pressure from interests and
citizens to ensure reelection. Elected officials can also take symbolic stands on issues to
appear responsive. Some governors were motivated, initially, to take a symbolic stand in
support of environmental protection when they created a new comprehensive
environmental protection agency (Haskell & Price, 1973; Rabe, 1986). State
environmental policy is driven by competing pressure applied by relevant interests,
including manufacturing and mining groups, that want to minimize environmental
regulations and environmental groups that want to maximize regulations. Many
politicians were partially motivated by a growing environmental movement. “It should
be emphasized that the present situation (creation of comprehensive agency) has come
40
about…from intense public concern expressed for the environment recently” (Beyle,
1975). Many of the first states to adopt a Comprehensive Structure were more
environmentally-conscious states.
Political control is an area not examined as thoroughly, but should have a
significant effect on agency structure. In designing agencies, politicians strive for control
over the current system and also future coalition changes. Under new economics of
organization and transaction cost theories, agency structure results from strategic choices
and political comprises of rational individual actors. The actors include the executive,
legislators, and outside interests. The structure of the agency will reflect the level of
political uncertainty at the time of creation, share the goals of the enacting coalition
(including outside interests), and include controls for bureaucratic drift (McCubbins et al.,
1989; Moe, 1984, 1990a, 1990b; Williamson, 1999). In addition, the capacity, power, and
professionalism of the legislature and executive branch (bureaucracy and governor) will
affect agency design (Krause & Woods, 2014; Reenock & Poggione, 2004).
Ultimately the goal of the enacting coalition is “to maximize policy benefits, given
various uncertainties at the time of policy benefits” (Wood & Bohte, 2004). The enacting
coalition will put ex post and/or ex ante controls on agency design (and policies for that
matter) to control against future coalitional changes (Epstein & O'Halloran, 1999;
McCubbins et al., 1989; Wood & Bohte, 2004). For example, a primary goal of the state
of Washington in creating a comprehensive agency in 1970 was to reduce the power of
the existing independent water and air quality boards whose appointees were not under
the control of the governor (Haskell & Price, 1973). Agencies are ultimately designed by

41
the winners who are concerned about creating an effective organization, but also
protecting that organization from an uncertain future (Moe, 1990b).
Administrative Motivations
As stated earlier, state adoption of comprehensive environmental protection
agencies was often part of larger state reorganizations. Even if the creation of the new
agency was a single agency-focused reorganization, both processes are influenced by
similar administrative motivations. According to Mosher (1967), reorganization can be
motivated by a poor fit between administrative values and actual organizational
structure, a changing belief as to the proper role of government in the policy area, and/or
changes in organizational programs and tensions about organizational purpose.
According to contingency theory, organizations are in a constant process of adjusting to
changes in the organizational environment, such as the increase in state responsibility for
environmental regulation (Lawrence & Lorsch, 1967). The sheer size of environmental
programs and responsibilities that state governments assumed during the 1960s and
1970s required many states to reorganize to increase their institutional capacity to
implement these programs (Beyle, 1975). As states assumed more responsibility for
environmental regulation, the lack of fit between environmental regulation and public
health became more obvious. At the same time the federal government was passing
environmental legislation, it also created the Medicare and Medicaid programs which also
placed a new and large administrative responsibility on states. The focus of health
departments became divided between public health and healthcare management

42
(Gordon, 1998; Kotchian, 1997). Many states began combining departments of health
with departments of public welfare to manage Medicare, Medicaid, food stamps, social
security, senior programs, and other welfare programs from one agency.
Institutional theory proposes that organizations facing the same environmental
conditions will resemble one another through coercive isomorphism (in terms of public
organizations this could be regulatory pressure) and mimetic and/or normative
isomorphism (state-to-state). Mimetic isomorphism results from similar responses by
organizations to similar levels of uncertainty (technical, environmental). States often
have to develop agency structures in response to uncertain and changing information.
The level of uncertainty associated with both environmental regulation and healthcare
regulation during the 1970s was very high. States were still gathering information about
the complexity and nature of environmental pollution problems and the best regulatory
solutions to those problems. Mimetic isomorphism describes a process by which
organizations begin to resemble each other as they respond to uncertainty (DiMaggio &
Powell, 1983). In addition, states interact through professional organizations, chief
executive organizations, such as the National Governors Association, and through border-
related environmental issues and could therefore begin to adopt similar structures
through normative isomorphism. Beyle (1975) identified by region leader states, which
were the first states to adopt a Comprehensive Structure that influenced other states.
Many later adopters in those regions adopted similar structures (Mini-EPA or
superagencies). According to the theory, organizations will imitate organizations that
share similar traits and/or those that have had positive outcomes.

43
Organizations also develop in response to formal and informal pressures (coercive
isomorphism) (DiMaggio & Powell, 1983). States developed their environmental and
health agency structures in response to increasing federal control and mandates.
Formally, states must receive approval from the USEPA to assume primacy for
implementation and enforcement of federal environmental mandates. Informally, states
function within a regional USEPA system where they interact regularly with their regional
USEPA office. It seems likely that this relationship between the USEPA and state
environmental agencies would influence states choice to adopt the Mini-EPA structure.
Socioeconomic Factors
Organizations are affected by the broader socioeconomic processes outside the
organization itself (Hannan & Freeman, 1986). Socioeconomic characteristics of a state
indirectly affect agency design by constraining and enhancing state administrative and
political motivations. Wealthier states have greater resources available to support
smaller, more focused agencies that poorer states may not be able to afford. Urban,
wealthier states tend to be more liberal and supportive of environmental regulation.
Policy Problem
Generally, the environmental literature has found a fit between environmental
policies and environmental pollution issues facing the state (Blomquist, 1991; Lowry,
1992). The same fit should exist in terms of a state’s choice to create a comprehensive
environmental protection agency. States that adopt environmental policies are
responding to a need within the state. States with higher levels of groundwater
44
contamination are more likely to adopt groundwater regulations (Blomquist, 1991).
States that face more severe environmental pollution issues should be more likely to
adopt a comprehensive environmental protection agency to address those issues.
The fit can also be defined as a resource to protect. For example, states that rely
more heavily on groundwater for their water supply are more likely to adopt groundwater
regulations (Blomquist, 1991). States with higher levels of agricultural land are more
likely to adopt innovative NPS programs (Lowry, 1992). States that have greater amounts
of natural resources may be more likely to adopt a Super-Agency structure than those
with less.

45
CHAPTER 4: EMPIRICAL ANALYSIS: WHERE INSTITUTIONS COME FROM: PART 1
States made a conscious decision to move their environmental regulation
functions out of health departments and/or independent boards into either a Mini-EPA
or Super-Agency structure between 1967 and 2000 (Comprehensive Structure). A few
states adopted this Comprehensive Structure prior to the environmental movement of
the 1970s, while the majority of states adopted the structure during the 1970s. Since the
1970s, 15 states have moved their environmental regulation programs from the state
health department into either a Mini-EPA or Super-Agency structure. Generally, once a
state adopts a Super-Agency or Mini-EPA structure, they retain that structure over time
although the individual divisions within the agency may change. However, a few states
have changed their structure over time. For example, Mississippi originally created a
Super-Agency in 1978, which was separated into a Mini-EPA and natural resource agency
in 1989. Michigan has moved between a Mini-EPA and Super-Agency structure five times
since the first creation in 1963. Figure 5 below shows the decade that each state moved
its environmental protection functions into a Mini-EPA or Super-Agency structure.

46
Figure 5: State Adoption of Comprehensive Environmental Regulation Structure
States are driven by two major influences to centralize the pollution control
system. Starting in 1970, political pressure to develop more effective pollution control
systems to address the complex pollution issues facing states increased dramatically. The
majority of states (29) adopted a comprehensive environmental agency structure
between 1967 and 1975, when the federal government passed a series of environmental
laws and public support for pollution regulations increased dramatically. Starting in 1965,
political pressure to improve the professionalism and efficiency of state government also
drove 26 states to significantly reorganize and consolidate their executive branch
agencies (1965-1995). Almost one-third of states that adopted a Comprehensive
Structure between 1967 and 1975 adopted the structure through a comprehensive
executive branch reorganization. Additionally, another 10 states that underwent a
comprehensive executive branch reorganization later adopted a Comprehensive
47
Structure (two of the five states that still house pollution prevention in the health
department also underwent a comprehensive executive branch reorganization).
However, most states that have adopted this structure have not done so as part of a larger
state restructuring.
The goal of this chapter is evaluate both of these major drivers, in addition to other
characteristics of states, to determine what factors drove states to consolidate their
pollution control functions into a comprehensive agency. My analysis will draw on theory
described in the previous chapter and build on the existing literature on state
environmental and health organizational structure (Beyle, 1975; Burke, Shalauta, Tran, &
Stern, 1997; Claveria & Kaito, 1985; Haskell & Price, 1973; Kotchian, 1997; Shepherd et
al., 1999; Sinclair & Whitford, 2012). These previous analyses are mostly descriptive in
nature and do not provide a comprehensive analysis of state adoption of environmental
agency structure over the 34 years that states have reorganized their pollution control
function. Beyle (1975) evaluates survey data about states that consolidated their
programs between 1967 and 1974. Haskell and Price (1973) rely on detailed case studies
to describe the process six states underwent to consolidate their pollution control
programs. Two of the studies are descriptions of agency functions and structures (Burke
et al., 1997; Jessup, 1988, 1990, 1994). Two studies were conducted for individual states
to evaluate the feasibility of moving environmental functions from the Health
Department to a Comprehensive Structure (Claveria & Kaito, 1985; Shepherd et al., 1999).
The most recent study, (Sinclair & Whitford, 2012) estimates state health and
environmental agency structures based on 1965 data using MLN models.
48
Model
The goal of this event history analysis is to determine what factors influence a
state adoption of a comprehensive environmental agency structure between 1967 and
2000. The empirical model is based on the model of Organizational Type Adoption
described in the previous chapter and includes 49 states and 34 years.4
P(adopt) = f(POLITICAL, ADMINISTRATIVE, SOCIOECONOMIC, POLICY PROBLEM,)
State adoption of a Comprehensive Structure should be driven by political factors,
including political control, political uncertainty, and political preferences; internal and
external administrative pressures, the socioeconomic characteristics of a state, and the
pollution problems faced by the state. Figure 6 below shows state adoption of a
Comprehensive Structure over time.
4 Nebraska is excluded from analysis because it has a unicameral legislature and so does not have turnover
or unified government data.

49
Figure 6: State Adoption of Comprehensive Structure
There was an initial burst of state adoptions between 1967 and 1975. From 1975 to 2000,
states adopted the Comprehensive Structure at a slower pace. The majority of states had
adopted a Comprehensive Structure by 1975.
Dependent Variable
The dependent variable, or risk set, is the probability that a state i will adopt a
Comprehensive Structure in a given year t or not. Once a state adopts the Comprehensive
Structure, it is dropped out of the risk set.5 The adoption data was compiled from a
number of sources, including reviewing states websites, documents, and archives (Haskell
5 Two states adopted Comprehensive Structure and then returned pollution control functions back to the department of health. South Carolina adopted a Mini-EPA structure from 1971-1973, but returned functions to the Department of Health. New Mexico adopted a Mini-EPA structure in 1970, but returned pollution functions to the Department of Health in 1977. In 1991, New Mexico then readopted a Mini-EPA Structure. In the model, these states are dropped out of the model after their initial adoption.
0
5
10
15
20
25
30
35
40
45
50
19
67
19
68
19
69
19
70
19
71
19
72
19
73
19
74
19
75
19
76
19
77
19
78
19
79
19
80
19
81
19
82
19
83
19
84
19
85
19
86
19
87
19
88
19
89
19
90
19
91
19
92
19
93
19
94
19
95
19
96
19
97
19
98
19
99
20
00
Nu
mb
er o
f St
ates
Year

50
& Price, 1973; Hunter & Waterman, 1996; Jessup, 1988, 1990, 1994; Reenock & Poggione,
2004; Ringquist, 1993) (See Appendix E for list of sources used to develop adoption data).
Explanatory Variables
The explanatory variables in the model measure political motivations,
administrative motivations, socioeconomic characteristics, and policy problem measures.
Summary statistics for each variable are listed in Table 2. The following section describes
these variables in more detail.
Political Motivations
Political motivation variables evaluate the effect of the political entrepreneur in
both the executive and legislative branch on state adoption of a Comprehensive
Structure. Both branches of the state government play an important role in designing
state agencies and so the model includes measurements of both as it pertains to
measuring levels of political uncertainty during this time period. Governors and
legislators are influenced by political support from competing interests impacted by
pollution control policies and both strive to maintain political control. Finally, each policy
maker has their own political motivations and ideologies that drive their choices.
Political Uncertainty
The theoretical literature proposes that politicians respond to the level of political
uncertainty in the current government and controlling for future uncertainty (Moe,
1990b). Politicians are less likely to adopt significant policies when the level of

51
uncertainty is high. States in which the executive and legislative branches are controlled
by the same political party are more likely to undergo an executive branch reorganization
(Garnett, 1980). Executive-legislative conflict (Unified Government) measures whether
the governor and the legislative bodies are under control of different parties (0), or same
party (1). The level of uncertainty is reduced when there is lower executive-legislative
conflict and preference alignment (Volden, 2002; Wood & Bohte, 2004). States with a
unified government will be more likely to adopt a Comprehensive Structure. In addition,
higher turnover of individual members of the legislature can also increase the level of
uncertainty. Legislative Turnover measures the percent of the legislature that changes
over time. States with high membership turnover will be less likely to adopt a
Comprehensive Structure.
Political Control
Designing a state agency structure involves strategic decisions by the controlling
coalition to maximize control over policy outcomes. More professional legislatures are
less likely to impose ex post controls on an agency (Reenock & Poggione, 2004). In
addition, legislators are more likely to delegate more authority to the executive branch
when they have confidence in the capacity of the agency (Krause & Woods, 2014). During
the time period of this study, the power and professionalism of the governor and
legislature increased. Governors in 26 states gained the power to reorganize executive
branch agencies through an executive order (see Appendix D for list of states). The
strength of the governor’s office (Governor Power) is an institutional score of governor’s

52
overall power. States with more powerful governors, will be more likely to adopt a
Comprehensive Structure. This measure includes an average of scores for tenure
potential, appointment powers, budgetary power, and veto power. Legislative
professionalism is measured by the Squire Index, which includes three variables: legislator
pay, staff per legislator, and total days in session. States with more professional
legislatures will be more likely to adopt a Comprehensive Structure.
Political Pressure
Politicians are ultimately motivated by reelection and will respond to both the
interests that supported them and the constituencies that elected them. Political
pressure is measured as the percentage of gross state product (GSP) of three relevant
interests: manufacturing, mining, and agriculture (Manufacturing GDP, Mining GDP, and
Agriculture GDP). These three interests are directly affected by pollution control
legislation. It is unclear what effect groups representing these interests will have on
consolidation of pollution functions. Industry groups tend to favor more uniform
legislation (often pushing for federal control to unify across states). However,
consolidating functions into a single agency could increase the strength of pollution
control regulations. In addition, the model includes a measure of Environmental Group
Strength as the number of members of the Sierra Club per 1000 people in a state.
Environmental group membership and influence increased significantly during this time
period. The model also includes a dichotomous variable that indicates data that was
obtained directly (electronically) from the Sierra Club (Personal Communication Sierra

53
Club [email protected] May, 5, 2015). The Sierra Club data before 1982 was
extrapolated from membership data retrieved from the Colby Library at University of
California – Berkley, which houses the Sierra Club files. The membership data was listed
by club name (which initially included many states). I assigned membership to each state
based on the overall proportion by state in the data from 1982-2012 provided by the
Sierra Club electronically.
Constituency pressure is measured using a Citizen Ideology index. This index
ranges on a scale from zero to 100 with the higher scores indicating a more liberal
citizenry (W. D. Berry, Ringquist, Fording, & Hanson, 1998). Sinclair and Whitford (2012)
found that more liberal states were more likely to adopt separate agencies for
environmental protection and health. It is expected that more liberal states would prefer
a consolidated pollution agency.
Politicians’ Preference
Finally, politicians also have their own ideology and political preferences, which
influence their choices. Political preferences is measured by the Berry et al (1998)
Government Ideology index. Similarly to the citizen ideology index, this index ranges on
a scale from zero to 100 with higher scores indicating a more liberal legislative and
executive branch (W. D. Berry et al., 1998). As with the Citizen Ideology, it is expected
that states with a more liberal government will prefer adoption of a comprehensive
agency.
54
Administrative Motivations
Politicians are also influenced by both internal and external administrative
concerns in designing state agencies. Organizations are in a constant process of adjusting
to changes in the organizational environment (Lawrence & Lorsch, 1967). The
organizational environment for pollution control and public health/healthcare has
changed drastically over the past 60 years. States have responded to internal
administrative pressures, but also states often respond to choices neighboring or similar
states have made. In a report analyzing whether the state of Kansas should move their
pollution control functions out of the health department, Shepherd et al. (1999) described
five states of similar environmental and agricultural issues to help in the decision-making
process.
Internal Administrative
Based on his survey data, Beyle (1975) found that states adopted a comprehensive
agency structure partly in response to the increased state administrative and regulatory
responsibilities for states in terms of pollution control. Between 1970 and 1980, the
federal government passed nine major environmental laws that instituted major
regulatory responsibilities on states. During this same time period 26 states
comprehensively reorganized the executive branch. A dichotomous variable (Executive
Reorganization) is included in the model to measure whether a state created the
comprehensive environmental agency structure as part of an overall state restructuring
event (1) or as an incremental environmentally-specific organization (0). States that have
undergone an executive reorganization will be more likely to adopt a Comprehensive

55
Structure. Many states reorganized individual agencies or functions over this same time
period in response to changing demands and financial constraints. A measure of the
Fiscal Health of a state is include as measured by the annual difference (measured in
$100,000) between total expenditures and total revenues (Wang et al., 2007). States
may be more likely to consolidate functions and reduce the size of the bureaucracy as a
way to save money if they are under fiscal stress. States with better fiscal health may be
more likely to adopt a comprehensive structure as a way to maintain that fiscal health as
well. Thus, it is unclear what the effect of fiscal health will be on a state’s adoption of a
Comprehensive Structure.
As states were restructuring their pollution control functions, they were also
restructuring their health departments into either independent public health
departments or health superagencies that included public health, welfare, and healthcare
management. The focus of public health has changed drastically with the passage of
Medicare and Medicaid (Gordon, 1998). States assumed the regulatory responsibility to
manage these programs. While environmental health was initially a primary focus of
state health departments, over time managing of healthcare began to divide the focus of
health departments (Kotchian, 1997). States either created independent agencies for
public health, welfare, and healthcare or created a health super-agency to manage both
health and welfare. State creation of a Health Superagency should increase the likelihood
that a state would move pollution control functions out of the Health Department. This
is a dichotomous variable measuring whether a state has a Health Superagency (1) or
not (0).
56
External Administrative6
In addition, there was regulatory pressure from the federal government to
implement environmental regulations that could have contributed to states reorganizing
their environmental regulation functions (Beyle, 1975; Mosher, 1967). The majority of the
28 states that adopted a Comprehensive Structure between 1967 and 1975 adopted the
structure following the creation of the USEPA. In the American federal system, states face
both horizontal and vertical influences in their policy and structural choices. The model
measures the percentage of a state’s contiguous neighbors that have adopted a
Comprehensive Structure to measure horizontal influences (Neighbor Adoption). The
federal government has a huge influence on state environmental policy and would likely
influence state adoption of a comprehensive environmental agency. Federal influence is
measured by the federal share of overall state revenue measured as a percentage
(Federal Revenue). Measuring federal influence is difficult because of availability of data.7
Socioeconomic and Demographic Factors
Socioeconomic and demographic factors can have an indirect influence on state
agency design by providing constraints and resources to the state. The state policy
diffusion literature has found that socioeconomic factors can influence the ideology and
policy priorities of a state, including adoption of environmental policies (A. Bacot &
6 External administrative pressures are vertical and horizontal administrative pressure, due to mimetic and
normative isomorphism. These pressures are traditionally considered political pressures in policy adoption
models. I include them here to be consistent with organizational literature – in describing how
organizations respond to other organizations in the same organizational field. 7 An earlier version of the model included a measure of EPA Region to capture USEPA influence on state
structure. However, this measure was not statistically significant and a little skewed in that some regions
only included 2 states, while others included more than five states.
57
Dawes, 1996; A. H. Bacot & Dawes, 1997; Bromley-Trujillo, 2012; E. Ringquist, 1993).
Beyle (1975) found that urban (Urbanization) and wealthier states (Per Capita Income in
thousands) were more likely to adopt a Comprehensive Structure. Many initial state
pollution control regulations originated as a response to urban smoke and sewage, so
likely more urban states. Sinclair and Whitford (2012) found that states with larger
populations (Population in millions) and larger physical size (Land Area in thousand square
miles) were more likely to adopt separate health and environmental agencies. Larger and
wealthier states likely have more resources available to develop more independent
agencies. The wealth of a state might also indirectly influence adoption of a
Comprehensive Structure as poorer states might increase the level of Medicaid recipients
and more demand for a separate health agency. 8
Policy Problem
Ideally, the model would include a measure of environmental quality or pollution
severity. Unfortunately, no consistent and reliable measure exists for the time period of
the data. I have included a measure of the total vehicle miles (in thousands) driven per
capita per state as a proxy measurement of air pollution (Vehicle Miles).
In addition, the model includes measures of natural resources within a state and
consumption of those resources to try to capture the policy problem within a state. The
following resource variables are included in the model: Water area of each state
8 In 2016, 11 states housed Medicaid/Medicare in a Health Superagency (Health and Welfare), seven states
housed them within the Health Department, 13 were within a Department of Human Services, and 19 had
stand-alone agencies. However, these structures have evolved over time and initially many states housed
Medicaid/Medicare in the Department of Health.
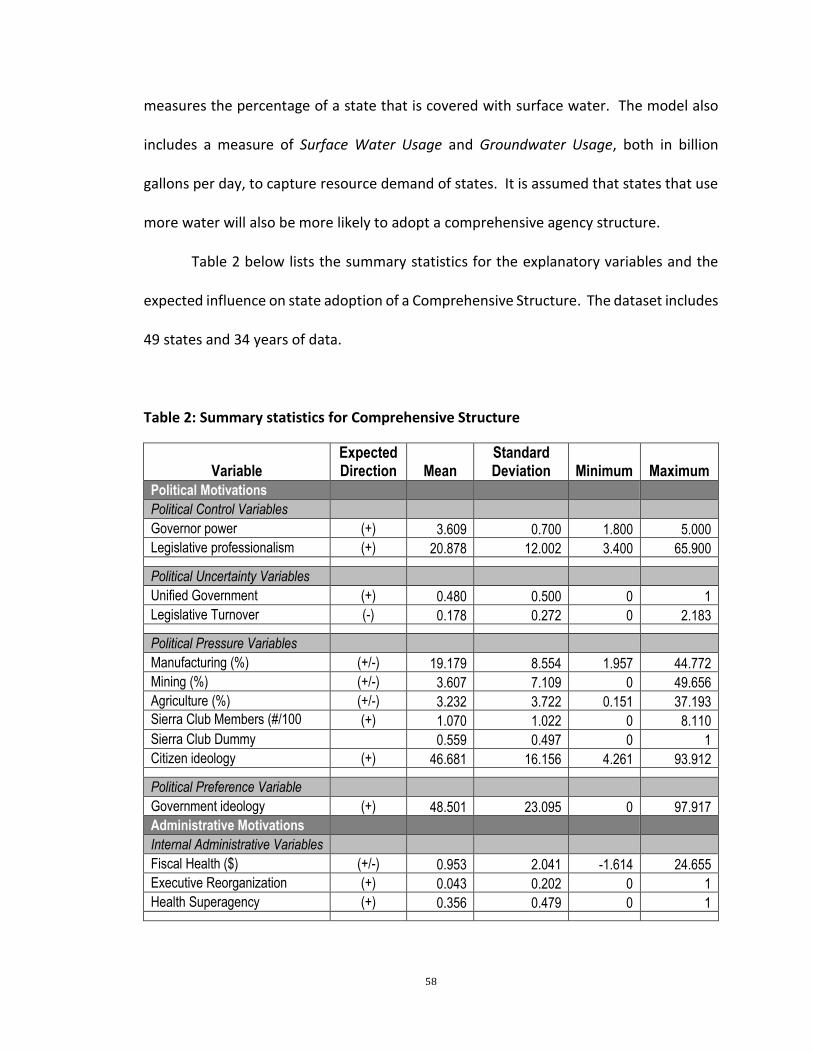
58
measures the percentage of a state that is covered with surface water. The model also
includes a measure of Surface Water Usage and Groundwater Usage, both in billion
gallons per day, to capture resource demand of states. It is assumed that states that use
more water will also be more likely to adopt a comprehensive agency structure.
Table 2 below lists the summary statistics for the explanatory variables and the
expected influence on state adoption of a Comprehensive Structure. The dataset includes
49 states and 34 years of data.
Table 2: Summary statistics for Comprehensive Structure
Variable Expected Direction Mean
Standard Deviation Minimum Maximum
Political Motivations
Political Control Variables
Governor power (+) 3.609 0.700 1.800 5.000
Legislative professionalism (+) 20.878 12.002 3.400 65.900
Political Uncertainty Variables
Unified Government (+) 0.480 0.500 0 1
Legislative Turnover (-) 0.178 0.272 0 2.183
Political Pressure Variables
Manufacturing (%) (+/-) 19.179 8.554 1.957 44.772
Mining (%) (+/-) 3.607 7.109 0 49.656
Agriculture (%) (+/-) 3.232 3.722 0.151 37.193
Sierra Club Members (#/100 pop)
(+) 1.070 1.022 0 8.110
Sierra Club Dummy 0.559 0.497 0 1
Citizen ideology (+) 46.681 16.156 4.261 93.912
Political Preference Variable
Government ideology (+) 48.501 23.095 0 97.917
Administrative Motivations
Internal Administrative Variables
Fiscal Health ($) (+/-) 0.953 2.041 -1.614 24.655
Executive Reorganization (+) 0.043 0.202 0 1
Health Superagency (+) 0.356 0.479 0 1
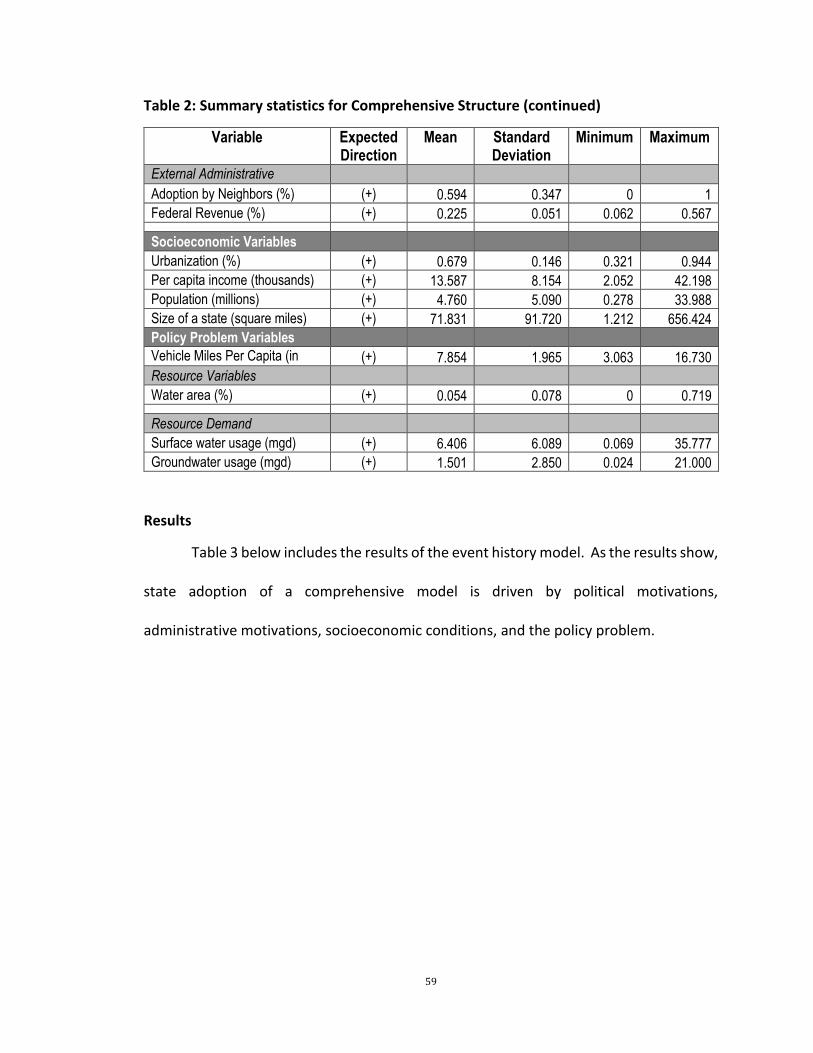
59
Table 2: Summary statistics for Comprehensive Structure (continued)
Variable Expected Direction
Mean Standard Deviation
Minimum Maximum
External Administrative Variables
Adoption by Neighbors (%) (+) 0.594 0.347 0 1
Federal Revenue (%) (+) 0.225 0.051 0.062 0.567
Socioeconomic Variables
Urbanization (%) (+) 0.679 0.146 0.321 0.944
Per capita income (thousands) (+) 13.587 8.154 2.052 42.198
Population (millions) (+) 4.760 5.090 0.278 33.988
Size of a state (square miles) (+) 71.831 91.720 1.212 656.424
Policy Problem Variables
Vehicle Miles Per Capita (in 1000s)
(+) 7.854 1.965 3.063 16.730
Resource Variables
Water area (%) (+) 0.054 0.078 0 0.719
Resource Demand
Surface water usage (mgd) (+) 6.406 6.089 0.069 35.777
Groundwater usage (mgd) (+) 1.501 2.850 0.024 21.000
Results
Table 3 below includes the results of the event history model. As the results show,
state adoption of a comprehensive model is driven by political motivations,
administrative motivations, socioeconomic conditions, and the policy problem.
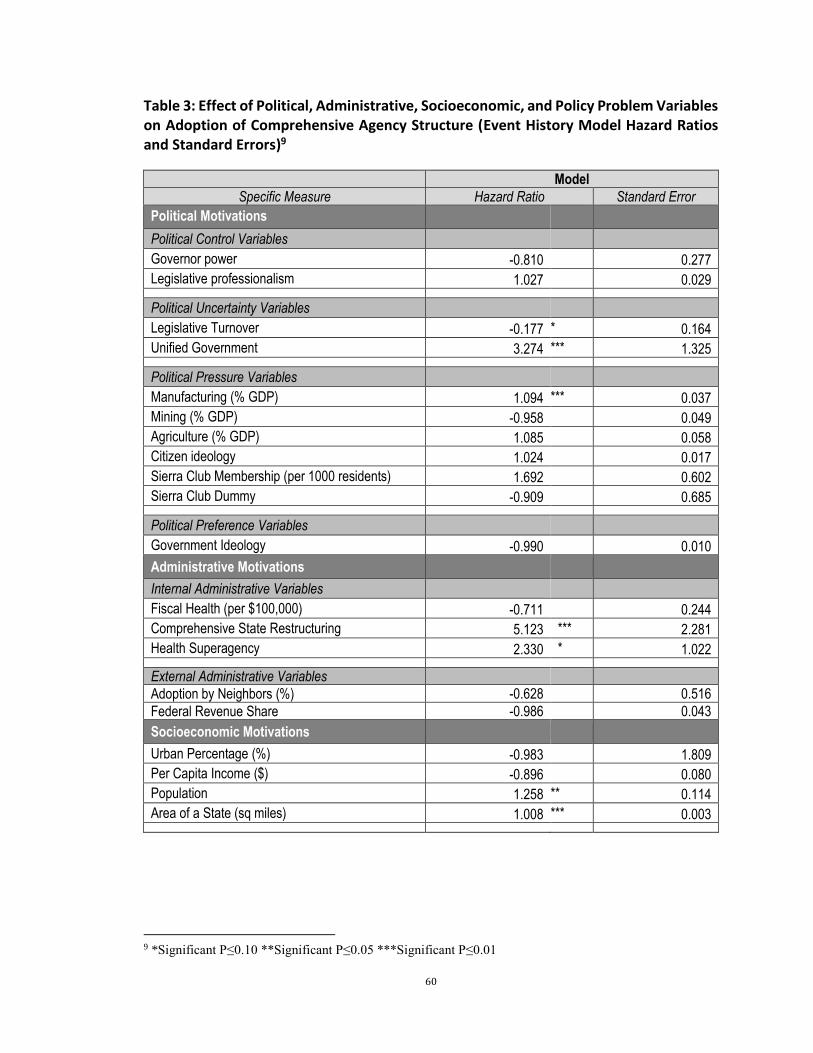
60
Table 3: Effect of Political, Administrative, Socioeconomic, and Policy Problem Variables on Adoption of Comprehensive Agency Structure (Event History Model Hazard Ratios and Standard Errors)9
Model
Specific Measure Hazard Ratio Standard Error
Political Motivations
Political Control Variables
Governor power -0.810 0.277
Legislative professionalism 1.027 0.029
Political Uncertainty Variables
Legislative Turnover -0.177 * 0.164
Unified Government 3.274 *** 1.325
Political Pressure Variables
Manufacturing (% GDP) 1.094 *** 0.037
Mining (% GDP) -0.958 0.049
Agriculture (% GDP) 1.085 0.058
Citizen ideology 1.024 0.017
Sierra Club Membership (per 1000 residents) 1.692 0.602
Sierra Club Dummy -0.909 0.685
Political Preference Variables
Government Ideology -0.990 0.010
Administrative Motivations
Internal Administrative Variables
Fiscal Health (per $100,000) -0.711 0.244
Comprehensive State Restructuring 5.123 *** 2.281
Health Superagency 2.330 * 1.022
External Administrative Variables
Adoption by Neighbors (%) -0.628 0.516
Federal Revenue Share -0.986 0.043
Socioeconomic Motivations
Urban Percentage (%) -0.983 1.809
Per Capita Income ($) -0.896 0.080
Population 1.258 ** 0.114
Area of a State (sq miles) 1.008 *** 0.003
9 *Significant P≤0.10 **Significant P≤0.05 ***Significant P≤0.01
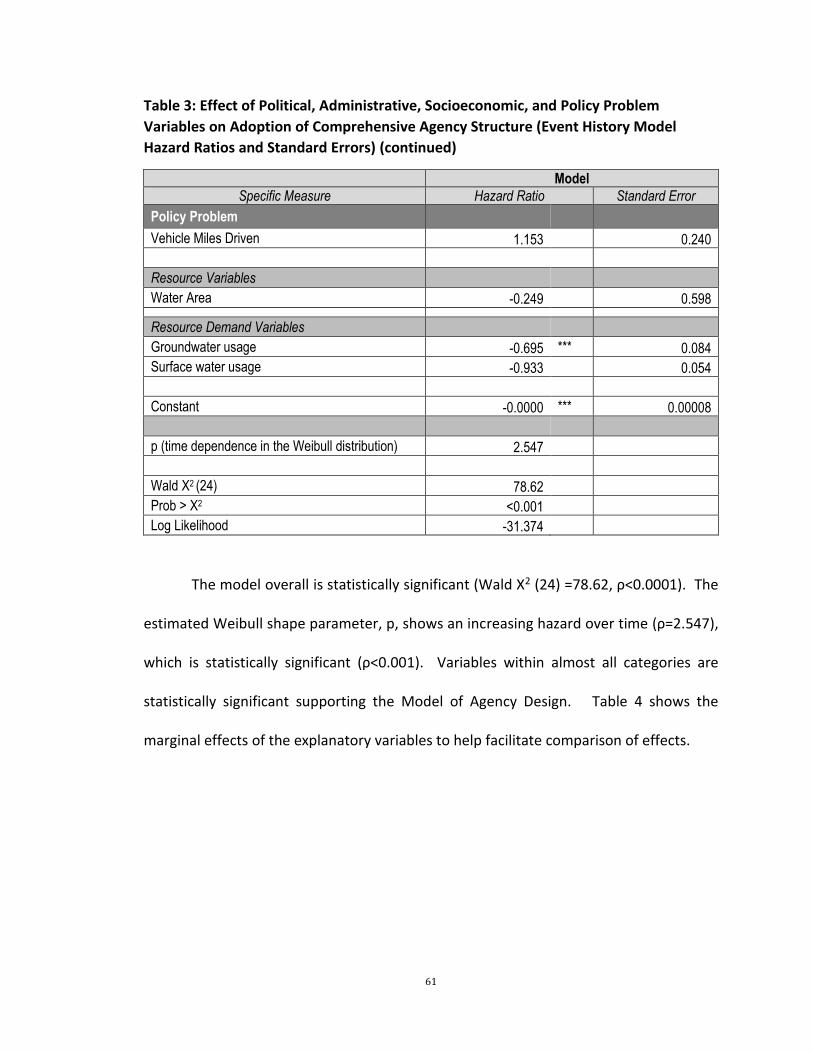
61
Table 3: Effect of Political, Administrative, Socioeconomic, and Policy Problem
Variables on Adoption of Comprehensive Agency Structure (Event History Model
Hazard Ratios and Standard Errors) (continued)
Model
Specific Measure Hazard Ratio Standard Error
Policy Problem
Vehicle Miles Driven 1.153 0.240
Resource Variables
Water Area -0.249 0.598
Resource Demand Variables
Groundwater usage -0.695 *** 0.084
Surface water usage -0.933 0.054
Constant -0.0000 *** 0.00008
p (time dependence in the Weibull distribution) 2.547
Wald Χ2 (24) 78.62
Prob > Χ2 <0.001
Log Likelihood -31.374
The model overall is statistically significant (Wald Χ2 (24) =78.62, ρ<0.0001). The
estimated Weibull shape parameter, p, shows an increasing hazard over time (ρ=2.547),
which is statistically significant (ρ<0.001). Variables within almost all categories are
statistically significant supporting the Model of Agency Design. Table 4 shows the
marginal effects of the explanatory variables to help facilitate comparison of effects.

62
Table 4: Marginal Effects of Political, Administrative, Socioeconomic, and Policy Problem Variables with Respect to Estimated Average Duration until Adoption of a Comprehensive Structure10
Model
Specific Measure dydx Standard Error z
Political Motivations
Political Control Variables
Governor power 1.508 2.505 0.600
Legislative professionalism -0.193 0.210 -0.920
Political Uncertainty Variables
Legislative Turnover 12.398 * 7.527 1.650
Unified Government -8.492 ** 3.667 -2.320
Political Pressure Variables
Manufacturing (% GDP) -0.643 ** 0.271 -2.380
Mining (% GDP) 0.304 0.372 0.820
Agriculture (% GDP) -0.584 0.381 -1.530
Citizen ideology -3.767 2.856 -1.320
Sierra Club Membership (per 1000 residents) 0.686
5.368 0.130
Sierra Club Dummy -0.173 0.117 -1.470
Political Preference Variables
Government Ideology 0.074 0.069 1.070
Administrative Motivations
Internal Administrative Variables
Fiscal Health (per $100,000) 2.437 2.577 0.950
Comprehensive State Restructuring -11.698 *** 4.721 -2.480
Health Superagency -6.057 * 3.461 -1.750
External Administrative Variables
Adoption by Neighbors (%) 3.335 5.413 0.620
Federal Revenue Share 0.098 0.309 0.320
Socioeconomic Motivations
Urban Percentage (%) 0.119 13.171 0.010
Per Capita Income ($) 0.787 0.636 1.240
Population -1.644 ** 0.765 -2.150
Area of a State (sq miles) -0.057 ** 0.024 -2.420
10 *Significant P≤0.10 **Significant P≤0.05 ***Significant P≤0.01
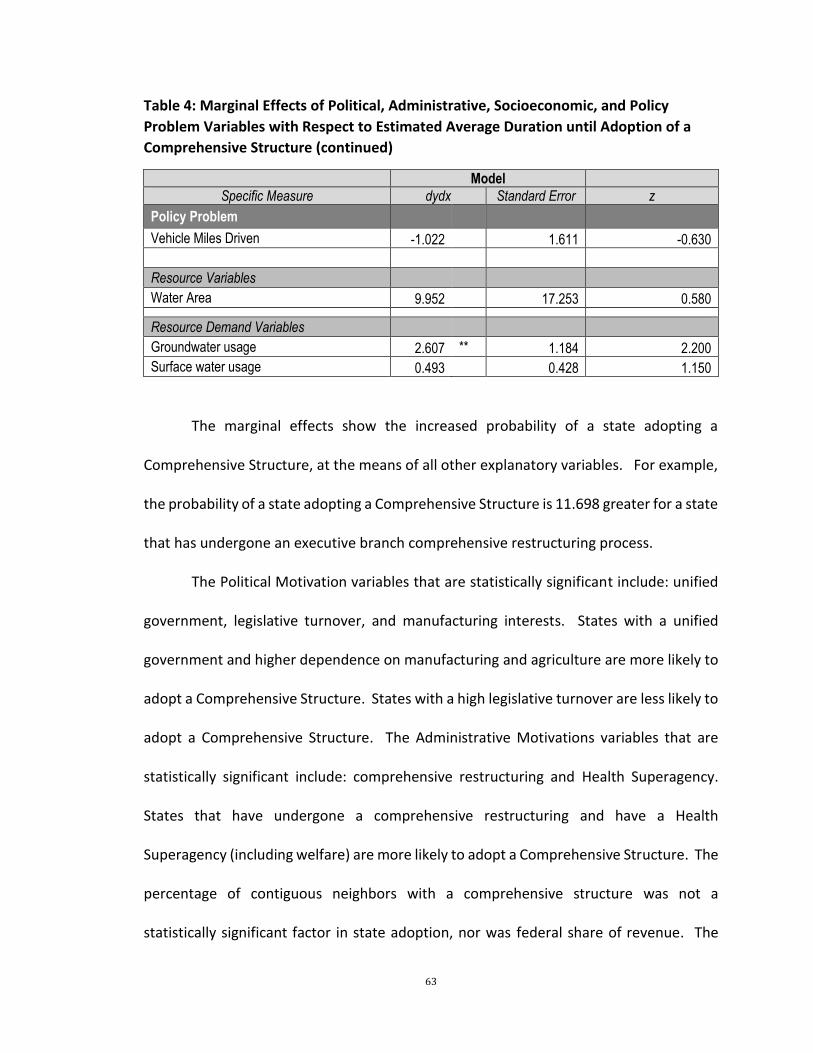
63
Table 4: Marginal Effects of Political, Administrative, Socioeconomic, and Policy
Problem Variables with Respect to Estimated Average Duration until Adoption of a
Comprehensive Structure (continued)
Model
Specific Measure dydx Standard Error z
Policy Problem
Vehicle Miles Driven -1.022 1.611 -0.630
Resource Variables
Water Area 9.952 17.253 0.580
Resource Demand Variables
Groundwater usage 2.607 ** 1.184 2.200
Surface water usage 0.493 0.428 1.150
The marginal effects show the increased probability of a state adopting a
Comprehensive Structure, at the means of all other explanatory variables. For example,
the probability of a state adopting a Comprehensive Structure is 11.698 greater for a state
that has undergone an executive branch comprehensive restructuring process.
The Political Motivation variables that are statistically significant include: unified
government, legislative turnover, and manufacturing interests. States with a unified
government and higher dependence on manufacturing and agriculture are more likely to
adopt a Comprehensive Structure. States with a high legislative turnover are less likely to
adopt a Comprehensive Structure. The Administrative Motivations variables that are
statistically significant include: comprehensive restructuring and Health Superagency.
States that have undergone a comprehensive restructuring and have a Health
Superagency (including welfare) are more likely to adopt a Comprehensive Structure. The
percentage of contiguous neighbors with a comprehensive structure was not a
statistically significant factor in state adoption, nor was federal share of revenue. The
64
socioeconomic variables that were statistically significant were population and size of
state. Larger states with larger population were more likely to adopt. Finally, of the
variables measuring the magnitude of the policy problem, only groundwater was
statistically significant. States with a higher reliance on groundwater are less likely to
adopt a Comprehensive Structure.
Discussion
In general, the results support the model of state agency design described above.
This section includes a general discussion of the results, while highlighting areas where
the model could be improved. The choice to adopt a Comprehensive Structure is driven
by both administrative and political motivations. Internal motivations and factors exert a
greater influence on state adoption of a Comprehensive Structure than external
pressures. A state’s socioeconomic characteristics also affected state choices to adopt a
Comprehensive Structure.
Political Motivations
Of the political motivation variables, the political uncertainty and political
pressure variables have statistically significant influence on state adoption. The political
preference variable of government ideology was not statistically significant. A measure
of this variable that is focused more on political preferences for environmental regulation,
such as the League of Conservation Voters (LCV) Scorecard rating, might better capture
this variable. Overall, however, the analysis supports the theoretical literature that
agency design is a heavily political process.
65
States with high levels of political uncertainty, those without a unified government
and with high legislative turnover, are less likely to adopt a Comprehensive Structure.
This result is in the expected direction, supporting the conclusion that it is easier to pass
major restructuring legislation with a unified government. What is more interesting is
that states with a higher percentage of GDP from manufacturing are more likely to adopt
a Comprehensive Structure. This data could be capturing more of a response to policy
problem than political pressure. Another possibility is that manufacturers benefit from
a more comprehensive and consolidated pollution control program. Literature has found
that industry interests tend to support federal control of regulatory programs because it
provides consistency across states. This concept could be at work here, in that industry
prefers to have one agency to regulate pollution, rather than multiple agencies.
Administrative Motivations
Looking at internal administrative motivations, the financial health of a state did
not statistically significantly influence whether a state adopts a Comprehensive Structure.
However, as predicted, whether a state had undergone an executive branch
reorganization did influence state adoption of a Comprehensive Structure. States that
have undergone an overall state restructuring, are more likely to adopt a Comprehensive
Structure than states that have not reorganized their government. States that adopted a
Health Superagency (including welfare) are also more likely adopt a Comprehensive
Structure.

66
States were not influenced by external administrative motivations to adopt a
Comprehensive Structure. Neither the measure of neighbor adoption nor the federal
revenue share was significant. It is surprising that none of the external administrative
measures were statistically significant; however, perhaps the measures used are not the
best measures of federal influence or neighbor influence in a state.
Socioeconomic and Demographic Factors
The socioeconomic or demographic factors that were statistically significant in
adoption were size and population of a state. The first pollution control laws at the state
and local level were in response to problems in urban areas, so it is surprising that the
level of urbanization did not have a statistically significant effect on adoption. In Beyle’s
model, these factors are indirect effects, so it is likely that the effects of these
characteristics are captured through more direct measures in the model.
Policy Problem
As discussed above, a policy problem can be defined by environmental quality and
as a resource to protect. The model does not include a measure of environmental quality
because such a measure does not exist for the entire time period of the analysis. The
measure we included in the model to try to capture environmental quality, Vehicle Miles
Driven, was not statistically significant. However, there are a few measures of resources
that had a statistically significant influence on state adoption of a Comprehensive
Structure including groundwater and surface water withdrawal. States with a higher
67
reliance on groundwater are less likely to adopt a Comprehensive Structure. Western
states are more reliant on groundwater than eastern states.
Conclusion
What influences state adoption of a comprehensive environmental agency
structure? The analysis in this chapter tells us that a little bit of everything affects state
adoption. While political motivations do influence the choice of structure, overall
administrative drivers also affect that choice. The analysis supports the adapted model
of state organizational type – that administrative, political, socioeconomic, and policy
problem all influence the selection of agency structure. States were driven by three major
influences toward a comprehensive environmental agency: (1) political pressure to
develop more effective pollution control systems to address the complex pollution issues
facing states; (3) administrative pressure to manage the Medicare and Medicaid
programs, and (2) political pressure to improve the professionalism and efficiency of state
government. While state environmental agency design is not a strictly apolitical process
as early rational organizational theorists supported (Gulick, 1937; Taylor, 1911; Weber,
1922), it is not a strictly political process either. In addition, as organizational theorists
propose, state agencies are responding to their organizational environment. This section
highlights a few key points from the analysis, highlights areas where the model could be
improved, and future research to build on the analysis in this paper.

68
Comprehensive Reorganization
States that have undergone a comprehensive reorganization are 85 percent more
likely to adopt a Comprehensive Structure than those states that have not. Clearly, the
choice to consolidate environmental programs is being made in the larger context in state
government organization overall. Choices made in other areas of government can affect
pollution control. The overwhelming influence of comprehensive reorganization could
help explain why the ideology variables were not statistically significant.
Interest Pressure
Surprisingly, states with a higher dependence on agriculture and manufacturing
were more likely to adopt a Comprehensive Structure. These are two industries that
would be most affected by enhanced pollution control regulations and enforcement that
could accompany a consolidated regulatory agency. It could be that interests’ preference
for a consistent and central regulatory authority rather than multiple regulatory agencies
overpowers their desire to minimize regulations. An alternative explanation is that the
size of the interest in a state indicates the magnitude of the environmental pollution
problem in a state.
Improvements to Analysis
The empirical analysis could be enhanced with additional or alternative variable
measures and addressing limitations to the current model
Administrative Response to Federal Regulation: Currently, the model does not
have a measure that captures the increased responsibilities placed on states

69
between 1967 and 2000. Over 20 federal laws were passed with additional
amendments requiring compliance from states.
Environmental Quality: Not having any consistent measure of environmental
quality makes it difficult to assess to what extent the severity or nature of the
pollution problem affect state adoption of agency structure.
Environmental Group Pressure: Presumably, one of the main drivers of state
centralizing their pollution functions and adopting a Comprehensive Structure of
any type was political pressure from environmental groups. I include a measure
of Sierra Club membership per state, but the literature suggests this may not be
the most valid measure of environmental group membership (Andrews, 1998;
Bosso, 2003; Wikle, 1995). A measure that includes membership of a number of
environmental groups would be more robust, as would other measures of
mobilization.
Influence of other states: Beyle (1975) found in his analysis that states were
influenced by their neighbors. In a study for the State of Kansas about whether
to move pollution programs out of the state health department, Shepherd et al.
(1999), described the agency structures other states with similar populations,
economies, and levels of urbanization had adopted. In the mid-1980s, the State
of Hawaii looked at what other structures other states adopted to determine
whether to move their pollution programs out of the Department of Health
(Claveria & Kaito, 1985) A better measure of the influence of other states on a

70
state agency design could be found using a dyad analysis (comparing each state
to each state).
Board/Commission: As discussed in more detail in Chapter Seven, 34 states still
have a board that serves either in a regulator or an advisory role. Initially, the
majority of states had either independent pollution control boards or these
boards were connected to the department of health. The model could be
enhanced by an inclusion of these boards, and even might help explain the
influence of the citizen ideology variable.
Exceptions to the model: One of the main limitations of the model is that it does
not capture the changing structures within two states (South Carolina and New
Mexico). While these two states should not substantially change the results, the
fact that their changes between a Comprehensive Structure and health are not
captured means the model is not complete
Adding these measures to the model could provide a clearer picture of what has
influenced state adoption of environmental agency structures.

71
CHAPTER 5: EMPIRICAL ANALYSIS: WHERE INSTITUTIONS COME FROM: PART 2
Just as states made a conscious decision to move their environmental regulation
functions out of health departments or stand along boards into a Comprehensive
Structure over the past 50 years, they have also chosen the type of comprehensive agency
to house the environmental protection functions. The primary two Comprehensive
Structures used by states are: (1) Mini-EPA and (2) Super-Agency. The environmental
and health literature have depended on this basic typology, shown by state in Figure 7
below noting those states that changed their type of Comprehensive Structure (Beyle,
1975; Jessup, 1988; Kotchian, 1997; Ringquist, 1993; Shepherd et al., 1999; Sinclair &
Whitford, 2012)
Figure 7: State Environmental Protection Agency Structures

72
Typology
Today, the majority of states have moved their environmental protection divisions
into either a stand-alone Mini-EPA organization or within a larger Super-Agency. Most
states have adopted a structure for the pollution control agencies and not changed that
structure over time. However, there are a few exceptions. Figure 7 above shows those
states that have adopted more than one structure since 1967. Five states initially adopted
a Super-Agency structure, but later adopted a Mini-EPA structure (Florida, Louisiana,
Mississippi, Pennsylvania, and West Virginia). Michigan has reorganized its
environmental agencies multiple times since it first adopted a Super-Agency structure in
1973. It has fluctuated between a Mini-EPA structure (1995-2009, 2011-current) and a
Super-Agency structure (1975-1995, 2009-2011). North Carolina, New Mexico, and South
Carolina have fluctuated between a Comprehensive Structure and a health department.
Kentucky, Nevada, and South Dakota initially adopted a Mini-EPA structure and then
changed to a Super-Agency. Each of the three structures to house pollution control
functions has strengths and weaknesses.
Mini-EPA
Mini-EPA agencies are generally called “Department of Environmental Quality” or
“Department of Environmental Protection.” Proponents of this structure argue that a
state agency that is structured similarly to the federal agency facilitates state-federal
coordination. In addition, having a smaller, more focused agency allows that agency to
address the relevant issues without competing with other divisions. A Mini-EPA structure
allows for a clearly-defined mission as a purely regulatory agency. However, separating

73
pollution control from other environmentally-focused agencies can hinder integration
and coordination with those agencies. States with a Mini-EPA structure may not be able
to successfully implement ecosystem management programs. Environmental quality
outcomes could be affected if one agency is managing water development and another is
trying to regulate water pollution control, for example. Since the mid-1980s, most states
have adopted the Mini-EPA structure. Currently, 27 states use this structure.
Super-Agency
The Super-Agency structure is used by 18 states to combine environmental
protection functions with other functions, such as natural resource management,
agriculture, and/or energy. These agencies house divisions with differing missions, which
could either complement or compete, depending on the issue. Proponents of this
structure argue that it promotes integration and coordination for a more “ecological
perspective” (Haskell & Price, 1973). Opponents argue that housing pollution control
functions into larger natural resource agencies could minimize the effectiveness of these
programs. The resource management (e.g., forestry, recreation, and mining) focus of the
agency could take priority over pollution control.
Health Department
Only five states still house their environmental regulation functions in the
Department of Health. Proponents of this structure argue that there is an overlap in
programs between public health and environmental regulation that support this
structure. “The public health model is critical to environmental issues because all

74
environmental issues are environmental health issues” (Shepherd et al., 1999, p. 27).
Figure 8 shows that environmental health activities overlap both programs.
Figure 8: Environmental Regulation: Public Health Overlap (Shepherd et al., 1999)
Many health departments grew out of state sanitation departments that managed
solid waste disposal within the state. As population and urbanization levels increased,
the responsibilities were expanded to include air and water quality. “Historically, public
health and its environmental component were inseparably interwoven” (Gordon, 1998,
p. 32). The fit seemed reasonable initially because public health departments had a
monitoring and enforcement structure that could be useful to environmental regulations.
However, state health departments shared responsibility for healthcare, disease
prevention, and health promotion, which increasingly consumed the focus of state health
departments. Public health employees tended to be physicians, while environmental
regulatory agencies relied on engineers (Beyle 1975).

75
Model
Initially, states adopted the Super-Agency and Mini-EPA structure at similar rates.
However, as is clear in Figure 9 below, over time, more states have adopted the Mini-EPA
structure than the Super-Agency structure. Between 1975 and 1985, more states used
the Super-Agency structure, but since 1986, the majority of states now use a Mini-EPA
structure.
Figure 9: State Adoption of Super-Agency Structure vs. Mini-EPA Structure
The empirical model is based on the model of Organizational Type Adoption described in
the previous chapter and includes 49 states and 34 years.11
P(adopt) = f(POLITICAL, ADMINISTRATIVE, SOCIOECONOMIC, POLICY PROBLEM)
11 Nebraska is excluded from analysis because it has a unicameral legislature and so does not have turnover
or unified government data.
0
5
10
15
20
25
30
35
19
67
19
68
19
69
19
70
19
71
19
72
19
73
19
74
19
75
19
76
19
77
19
78
19
79
19
80
19
81
19
82
19
83
19
84
19
85
19
86
19
87
19
88
19
89
19
90
19
91
19
92
19
93
19
94
19
95
19
96
19
97
19
98
19
99
20
00
Nu
mb
er o
f St
ates
Year
Adoption of Superagency Adoption of Mini-EPA
76
The analysis looks at state adoption of agency structure (Mini-EPA and Super-
Agency) from 1967 to 2000. The analysis relies on two models, with two different
dependent variables.
Dependent Variables
In Model 1, the dependent variable or risk set is the probability that a state i will
adopt a Super-Agency structure in a given year t or not. Once a state adopts the Super-
Agency structure, it is dropped out of the risk set. The dependent variable in Model 2 is
the probability that a state i will adopt a Mini-EPA structure in a given year t or not. Once
a state adopts the Mini-EPA structure, it is dropped out of the risk set.12 The adoption
data was compiled from a number of sources, including reviewing states websites,
documents, and archives (Haskell & Price, 1973; Hunter & Waterman, 1996; Jessup, 1988,
1990, 1994; Reenock & Poggione, 2004; Ringquist, 1993).
Explanatory Variables
The explanatory variables in the model measure the same explanatory variables
as the model described in Chapter 4: political motivations, administrative motivations,
socioeconomic characteristics, and policy problem measures. Summary statistics for each
variable are listed in Table 4. The following section describes how these explanatory
variables will affect the adoption of either a Mini-EPA or Super-Agency structure.
12 Model does not account for states that have changed their structure between a Mini-EPA and a Super-Agency structure over time. Once a state adopts one structure it is dropped out of the risk set.
77
Political Motivations
Similarly to the model in Chapter 4, political motivation variables evaluate the
effect of the political entrepreneur in both the executive and legislative branch on state
adoption of a specific structure: Super-Agency or Mini-EPA. The level of political
uncertainty, struggle for political control, strength of political pressure, and individual
politician’s preferences should influence the design of pollution control agencies into a
stand-alone regulatory agency (Mini-EPA) or a division within a larger natural resources
or recreation agency (Super-Agency).
Political Uncertainty
Executive-legislative conflict (Unified Government) measures whether the
governor and the legislative bodies are under control of different parties (0), or same
party (1). A unified government reduces political uncertainty. States with a unified
government were more likely to adopt a Comprehensive Structure in the previous
analysis. It seems logical then, that states with a unified government will also be more
likely to adopt either a Mini-EPA or Super-Agency structure. However, many governors
chose to adopt a Mini-EPA initially as a political statement (Beyle, 1975; Haskell & Price,
1973). I expect that states will be more likely to adopt a Mini-EPA structure than a Super-
Agency structure under a unified government. In addition, higher turnover of individual
members of the legislature can also increase the level of uncertainty. Legislative Turnover
measures the percent of the legislature that changes over time.

78
Political Control
The strength of the governor’s office (Governor Power) is an institutional score of
governor’s overall power. This measure includes an average of scores for tenure
potential, appointment powers, budgetary power, and veto power. Legislative
professionalism is measured by the Squire Index, which includes three variables: legislator
pay, staff per legislator, and total days in session. Neither political control variable was
statistically significant in the previous model. However, placing pollution control
functions in a stand-alone regulatory agency versus as part of a larger Super-Agency
would provide governors and legislators differing levels of control. In addition, legislators
are more likely to delegate more authority to the executive branch when they have
confidence in the capacity of the agency (Krause & Woods, 2014).
Political Pressure
As in the previous model, political pressure is measured as the percentage of gross
state product (GSP) of three relevant economic interests: manufacturing, mining, and
agriculture (Manufacturing GDP, Mining GDP, and Agricultural GDP). These three
interests are directly affected by pollution control legislation. It seems that industries
would likely prefer a Super-Agency structure, where the mission of the regulatory agency
could be diluted by the overall mission of the agency (mining, forestry, agriculture). In
addition, the model includes a measure of Environmental Group Strength as the number
of members of the Sierra Club per 1000 people in a state. I have also included the
dichotomous variable, Sierra Club Dummy, that indicates data retrieved prior 1982 (0) and
after 1982 (1) to indicate the source of membership data described in previous chapter.

79
While Environmental Group Strength was not statistically significant in the last model, I
expect states with higher environmental group membership are more likely to adopt a
Mini-EPA structure than a Super-Agency structure. Constituency pressure is measured
using a Citizen Ideology index. This index ranges on a scale from zero to 100 with the
higher scores indicating a more liberal citizenry (W. D. Berry et al., 1998). It is expected
that more liberal states would prefer a Mini-EPA structure.
Politicians’ Preference
Finally, politicians also have their own ideology and political preferences, which
influence their choices. Political preferences are measured by the Berry et al (1998)
Government Ideology index. Similarly to the citizen ideology index, this index ranges on
a scale from zero to 100 with higher scores indicating a more liberal legislative and
executive branch (W. D. Berry et al., 1998). As with the citizen ideology, it is expected
that states with a more liberal government will prefer adoption of a Mini-EPA structure.
Administrative Motivations
Politicians are also influenced by both internal and external administrative
concerns in designing state agencies. Just as administrative motivations influenced state
adoption of a Comprehensive Structure, they also should affect a state’s adoption of a
specific type of Comprehensive Structure (Mini-EPA or Super-Agency). Likely internal
administrative pressures should drive states toward adopting a Super-Agency structure,
while external administrative pressures should push states toward a Mini-EPA structure.
80
Internal Administrative
A dichotomous variable (Executive Reorganization) is included in the model to
measure whether a state created the comprehensive environmental agency structure as
part of an overall state restructuring event (1) or as an incremental environmentally-
specific organization (0). States that have undergone an executive reorganization will be
more likely to adopt a Super-Agency structure, as the goal of most reorganizations was
consolidation of agencies. A measure of the Fiscal Health of a state is include as
measured by the annual difference, in $100,000, between total expenditures and total
revenues (Wang et al., 2007). States may be more likely to consolidate functions and
reduce the size of the bureaucracy as a way to save money if they are under fiscal stress.
Therefore, states with poorer fiscal health are more likely to adopt a Super-Agency
structure. Finally, states that adopted a Health Superagency would be more likely to
adopt a Super-Agency (environmental pollution and natural resources). Again, as in the
previous chapter, the dichotomous variable indicates a state does have a Health
Superagency (1) or it does not (0).
External Administrative
In the American federal system, states face both horizontal and vertical influences
in their policy and structural choices. The model measures the percentage of a state’s
contiguous neighbors that have adopted either a Mini-EPA or Super-Agency structure to
measure horizontal influences. The federal government has a huge influence on state
environmental policy and would likely influence state adoption of a comprehensive
81
environmental agency. Federal influence is measured as the federal share of state annual
revenue (Federal Revenue).
Socioeconomic and Demographic Factors
Socioeconomic and demographic factors can have an indirect influence on state
agency design by providing constraints and resources to the state. Beyle (1975) found
that larger (Size in thousand square miles) and wealthier states (Per Capita Income in
thousands) were more likely to adopt a Super-Agency structure. More Urban states were
equally likely to maintain pollution control in a health department or to adopt a Super-
Agency structure. In addition, larger states and wealthier states likely have more
resources available to develop more independent agencies. I expect states with more
people (Population), measured in thousands, will also be more likely to adopt a Super-
Agency structure
Policy Problem
Ideally, the model would include a measure of environmental quality or pollution
severity. Unfortunately, no consistent and reliable measure exists for the time period of
the data. I have included a proxy measure of Vehicle Miles, measured in thousands, driven
by population to try to capture pollution levels. In addition, the model does include
measures of natural resources within a state and consumption of those resources to try
to capture the policy problem within a state. The following resource variables are
included in the model: Water area of each state measure the percentage of a state that
is covered with surface water. The model also includes a measure of Surface Water
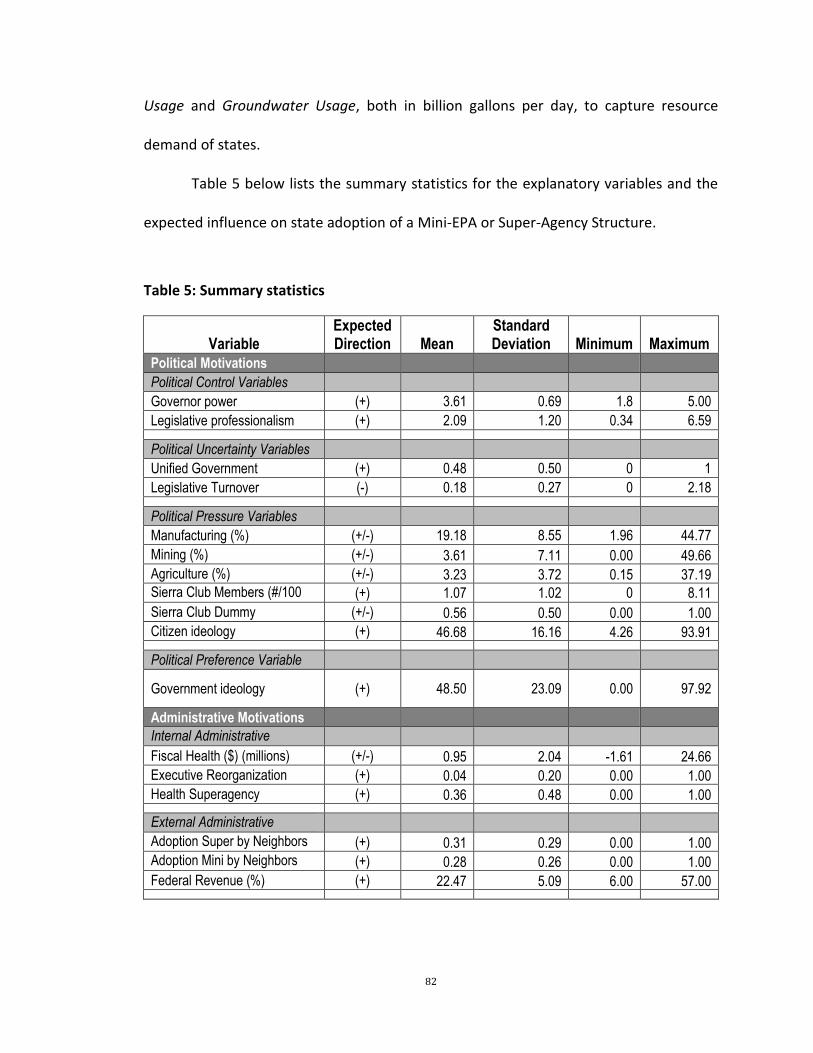
82
Usage and Groundwater Usage, both in billion gallons per day, to capture resource
demand of states.
Table 5 below lists the summary statistics for the explanatory variables and the
expected influence on state adoption of a Mini-EPA or Super-Agency Structure.
Table 5: Summary statistics
Variable Expected Direction Mean
Standard Deviation Minimum Maximum
Political Motivations
Political Control Variables
Governor power (+) 3.61 0.69 1.8 5.00
Legislative professionalism (+) 2.09 1.20 0.34 6.59
Political Uncertainty Variables
Unified Government (+) 0.48 0.50 0 1
Legislative Turnover (-) 0.18 0.27 0 2.18
Political Pressure Variables
Manufacturing (%) (+/-) 19.18 8.55 1.96 44.77
Mining (%) (+/-) 3.61 7.11 0.00 49.66
Agriculture (%) (+/-) 3.23 3.72 0.15 37.19
Sierra Club Members (#/100 pop)
(+) 1.07 1.02 0 8.11
Sierra Club Dummy (+/-) 0.56 0.50 0.00 1.00
Citizen ideology (+) 46.68 16.16 4.26 93.91
Political Preference Variable
Government ideology (+) 48.50 23.09 0.00 97.92
Administrative Motivations
Internal Administrative Variables
Fiscal Health ($) (millions) (+/-) 0.95 2.04 -1.61 24.66
Executive Reorganization (+) 0.04 0.20 0.00 1.00
Health Superagency (+) 0.36 0.48 0.00 1.00
External Administrative Variables
Adoption Super by Neighbors (%)
(+) 0.31 0.29 0.00 1.00
Adoption Mini by Neighbors (%)
(+) 0.28 0.26 0.00 1.00
Federal Revenue (%) (+) 22.47 5.09 6.00 57.00
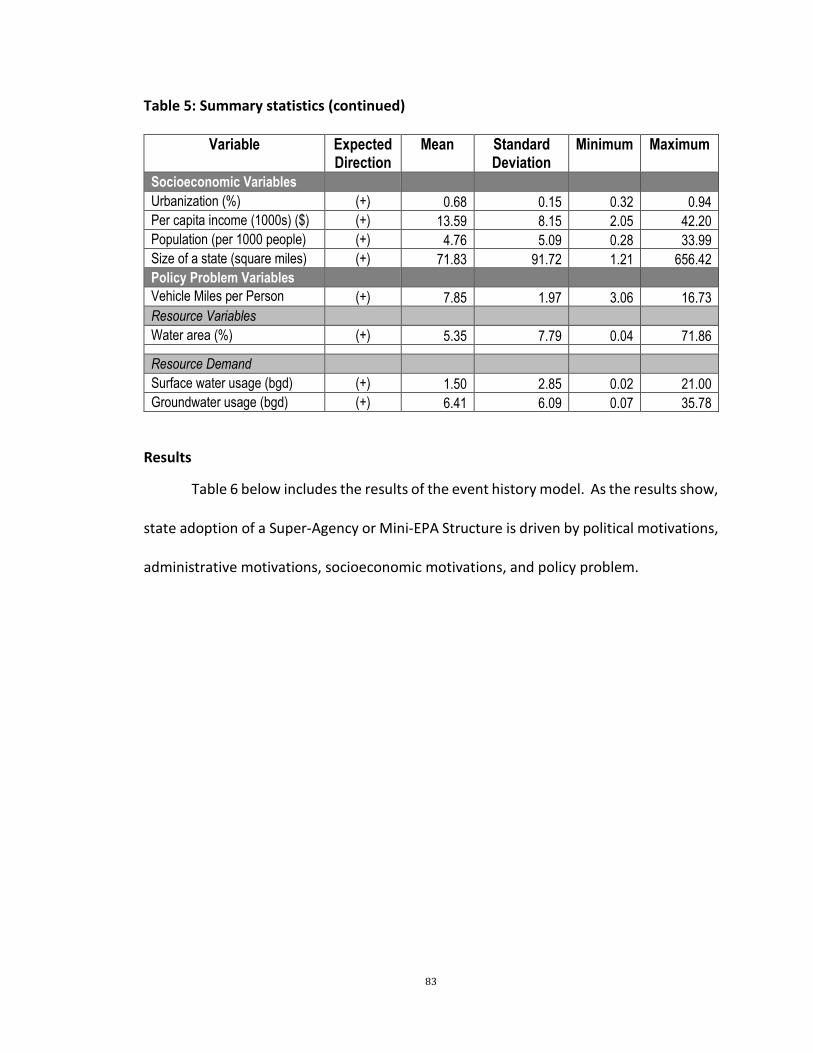
83
Table 5: Summary statistics (continued)
Variable Expected Direction
Mean Standard Deviation
Minimum Maximum
Socioeconomic Variables
Urbanization (%) (+) 0.68 0.15 0.32 0.94
Per capita income (1000s) ($) (+) 13.59 8.15 2.05 42.20
Population (per 1000 people) (+) 4.76 5.09 0.28 33.99
Size of a state (square miles) (+) 71.83 91.72 1.21 656.42
Policy Problem Variables
Vehicle Miles per Person (1000s)
(+) 7.85 1.97 3.06 16.73
Resource Variables
Water area (%) (+) 5.35 7.79 0.04 71.86
Resource Demand
Surface water usage (bgd) (+) 1.50 2.85 0.02 21.00
Groundwater usage (bgd) (+) 6.41 6.09 0.07 35.78
Results
Table 6 below includes the results of the event history model. As the results show,
state adoption of a Super-Agency or Mini-EPA Structure is driven by political motivations,
administrative motivations, socioeconomic motivations, and policy problem.
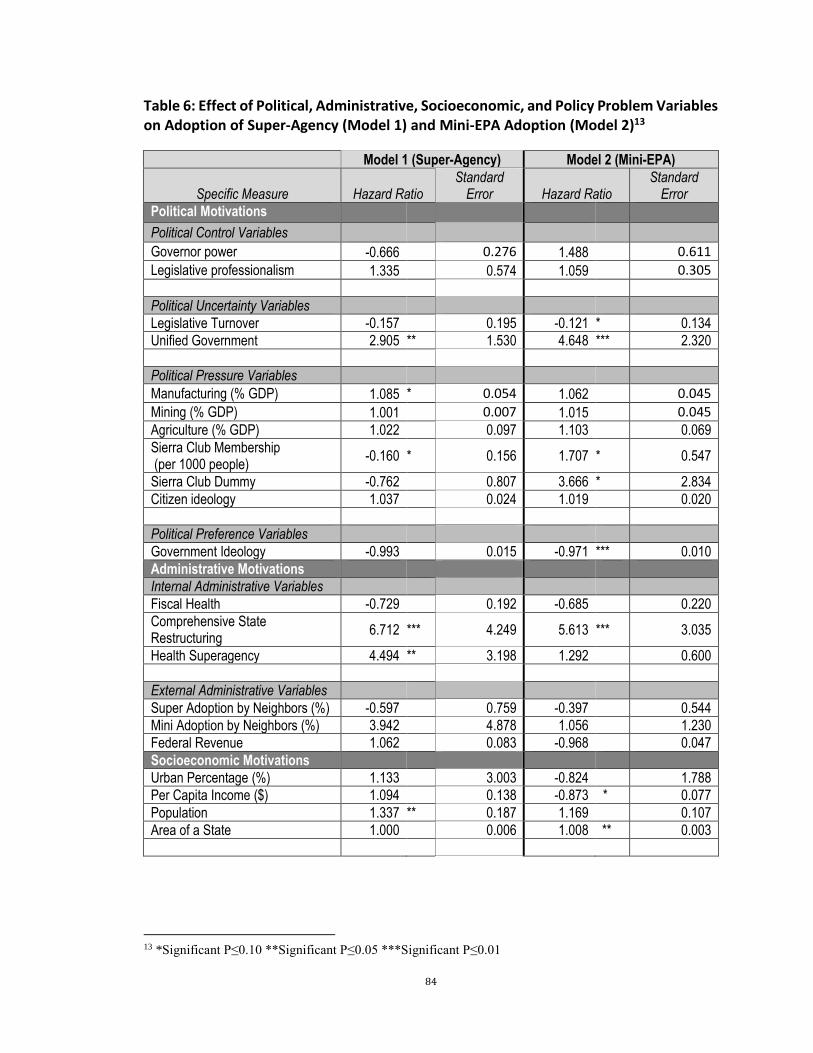
84
Table 6: Effect of Political, Administrative, Socioeconomic, and Policy Problem Variables on Adoption of Super-Agency (Model 1) and Mini-EPA Adoption (Model 2)13
Model 1 (Super-Agency) Model 2 (Mini-EPA)
Specific Measure Hazard Ratio Standard
Error Hazard Ratio Standard
Error
Political Motivations
Political Control Variables
Governor power -0.666 0.276 1.488 0.611
Legislative professionalism 1.335 0.574 1.059 0.305
Political Uncertainty Variables
Legislative Turnover -0.157 0.195 -0.121 * 0.134
Unified Government 2.905 ** 1.530 4.648 *** 2.320
Political Pressure Variables
Manufacturing (% GDP) 1.085 * 0.054 1.062 0.045
Mining (% GDP) 1.001 0.007 1.015 0.045
Agriculture (% GDP) 1.022 0.097 1.103 0.069
Sierra Club Membership (per 1000 people)
-0.160 * 0.156 1.707 * 0.547
Sierra Club Dummy -0.762 0.807 3.666 * 2.834
Citizen ideology 1.037 0.024 1.019 0.020
Political Preference Variables
Government Ideology -0.993 0.015 -0.971 *** 0.010
Administrative Motivations
Internal Administrative Variables
Fiscal Health -0.729 0.192 -0.685 0.220
Comprehensive State Restructuring
6.712 *** 4.249 5.613 *** 3.035
Health Superagency 4.494 ** 3.198 1.292 0.600
External Administrative Variables
Super Adoption by Neighbors (%) -0.597 0.759 -0.397 0.544
Mini Adoption by Neighbors (%) 3.942 4.878 1.056 1.230
Federal Revenue 1.062 0.083 -0.968 0.047
Socioeconomic Motivations
Urban Percentage (%) 1.133 3.003 -0.824 1.788
Per Capita Income ($) 1.094 0.138 -0.873 * 0.077
Population 1.337 ** 0.187 1.169 0.107
Area of a State 1.000 0.006 1.008 ** 0.003
13 *Significant P≤0.10 **Significant P≤0.05 ***Significant P≤0.01

85
Table 6: Effect of Political, Administrative, Socioeconomic, and Policy Problem
Variables on Adoption of Super-Agency (Model 1) and Mini-EPA Adoption (Model 2)
(continued)
Model 1 (Super-Agency) Model 2 (Mini-EPA)
Specific Measure Hazard Ratio Standard
Error Hazard Ratio Standard
Error
Policy Problem
Vehicle Miles Driven -0.625 0.215 1.195 0.254
Resource Variables
Water Area 1.007 0.029 -0.992 0.030
Resource Demand Variables
Groundwater usage -0.903 0.183 0.807 * 0.095
Surface water usage -0.893 0.090 0.963 0.059
Constant -0.00003 ** <0.001 -0.00004 ** <0.001
p (time dependence in Weibull distribution) 2.619
1.819
Wald Χ2 (26) 64.83 53.33
Prob > Χ2 0 0.0008
Log Likelihood -30.890 -41.323
Both models overall are statistically significant (Model 1: Wald Χ2 (25) = 64.83,
ρ>0.0001; Model 2: Wald Χ2 (25) = 53.33, ρ=0.0008). The estimated Weibull shape
parameter, p, shows an increasing hazard over time for both models. Variables within
each category are statistically significant supporting the Model of Agency Design. Table
7 below lists the marginal effects of the explanatory variables on the estimated average
duration until adoption of the two agency structure.

86
Table 7: Marginal Effects of Political, Administrative, Socioeconomic, and Policy Problem Variables with Respect to Estimated Average Duration until Adoption of a Super-Agency and Mini-EPA Structure14
Model 1 (Super-Agency) Model 2 (Mini-EPA)
Specific Measure dydx Std
Error z dydx Std
Error z
Political Motivations
Political Control Variables
Governor power 7.402 8.559 0.860 -8.601 10.154 -0.850
Legislative professionalism -5.254 8.461 -0.620 -1.242 6.255 -0.200
Political Uncertainty Variables
Legislative Turnover 33.672 28.636 1.180 45.590 33.466 1.360
Unified Government -19.402 13.777 -1.410 -33.222 * 20.653 -1.610
Political Pressure Variables
Manufacturing (% GDP) -1.488 1.213 -1.230 -1.305 1.009 -1.290
Mining (% GDP) -0.249 1.216 -0.210 -0.324 0.974 -0.330
Agriculture (% GDP) -0.397 1.751 -0.230 -2.115 1.538 -1.380
Sierra Club Membership (per 1000 people)
33.311 27.784 1.200 -11.560 9.370 -1.230
Sierra Club Dummy 4.950 19.158 0.260 -28.090 25.657 -1.090
Citizen ideology -0.666 0.543 -1.230 -0.416 0.424 -0.980
Political Preference Variables
Government Ideology 0.135 0.274 0.490 0.646 * 0.368 1.760
Administrative Motivations
Internal Administrative Variables
Fiscal Health 5.762 5.656 1.020 8.168 8.352 0.980
Comprehensive State Restructuring
-34.634 * 21.212 -1.630 -37.302 * 22.272 -1.670
Health Superagency -27.336 21.348 -1.280 -5.547 9.912 -0.560
External Administrative Variables
Super Adoption by Neighbors (%) 9.381 21.200 0.440 19.965 27.608 0.720
Mini Adoption by Neighbors (%) -24.952 29.962 -0.830 -1.176 25.438 -0.050
Federal Revenue -1.094 1.609 -0.680 0.713 1.146 0.620
Socioeconomic Motivations
Urban Percentage (%) -2.270 48.072 -0.050 4.178 47.032 0.090
Per Capita Income ($) -1.627 2.743 -0.590 2.928 2.406 1.220
Population -5.281 3.601 -1.470 -3.376 2.629 -1.280
Area of a State -0.002 0.105 -0.020 -0.176 0.115 -1.520
14 *Significant P≤0.10 **Significant P≤0.05 ***Significant P≤0.01

87
Table 7: Marginal Effects of Political, Administrative, Socioeconomic, and Policy
Problem Variables with Respect to Estimated Average Duration until Adoption of a
Super-Agency and Mini-EPA Structure (continued)
Model 1 (Super-Agency) Model 2 (Mini-EPA)
Specific Measure dydx Std
Error z dydx Std
Error z
Policy Problem
Vehicle Miles Driven 8.553 7.127 1.200 -3.845 5.653 -0.680
Resource Variables
Water Area -12.815 52.777 -0.240 16.608 64.974 0.260
Resource Demand Variables
Groundwater usage 1.860 3.707 0.500 4.628 3.536 1.310
Surface water usage 2.058 2.007 1.030 0.815 1.392 0.590
Model 1: Super-Agency
The Political Motivation variables that are statistically significant include: unified
government, Sierra Club membership, and manufacturing interests. States with a unified
government and higher dependence on manufacturing are more likely to adopt a Super-
Agency structure. States with more Sierra Club members are less likely to adopt the
Super-Agency structure. The Administrative Motivations variables that are statistically
significant are comprehensive restructuring, Health Superagency. States that have
undergone a comprehensive restructuring and/or have adopted a Health Superagency
were more likely to adopt a Super-Agency structure. Of the Socioeconomic Factors, the
size of the population is statistically significant, increasing the likelihood of state adoption.
Urbanization does not have a statistically significant impact on state adoption of a Mini-
EPA or Super-Agency structure. Finally, none of the variables measuring the magnitude
of the policy problem were statistically significant.

88
Model 2: Mini-EPA
The Political Motivation variables that are statistically significant include: unified
government, legislative turnover, Sierra Club members, and government ideology. States
with a unified government, larger numbers of Sierra Club members, and a liberal citizenry
are more likely to adopt a Mini-EPA structure. States with more liberal governments and
high legislative turnover are less likely to adopt a Mini-EPA structure. The Administrative
Motivations variable that is statistically significant is comprehensive restructuring. States
that have undergone a comprehensive restructuring were more likely to adopt a Mini-
EPA structure. The Socioeconomic Factors that affect the likelihood of state adoption of
the Mini-EPA structure include per capita income and the size of the state. Of the
variables measuring the magnitude of the policy problem, only groundwater usage was
statistically significant. States with a higher reliance on groundwater are less likely to
adopt a Mini-EPA. Adoption by neighbors was not statistically significant.
Discussion
In general, the results support the model of state agency design described above.
This section includes a general discussion of the results, while highlighting areas where
the model could be improved. The choice to adopt a Super-Agency structure appears to
be strongly motivated by administrative pressures in the executive branch. Political
uncertainty, pressure and preference had a greater influence on the adoption of a Mini-
EPA structure than a Super-Agency Structure.

89
Political Motivations
States with a unified government were more likely to adopt either a Mini-EPA or
a Super-Agency structure. This result, as in the previous chapter, confirms what has been
found in the literature – that it is easier to reorganize the executive branch when one
political party controls both branches of government. While government ideology does
not affect adoption of a Super-Agency structure, it does affect adoption of a Mini-EPA
structure. In addition, states with higher legislative turnover are less likely to adopt a
Mini-EPA structure; but legislative turnover does not affect adoption of a Super-Agency.
This difference could be due to the more political nature of a Mini-EPA structure. Counter
to what was expected, states with more liberal governments are less likely to adopt a
Mini-EPA structure. Perhaps, environmentalists and liberals support the Super-Agency
model more than the Mini-EPA model. Those states that adopted a Mini-EPA after 1980
tended to be more conservative states, which may be adopting the Mini-EPA structure in
hopes of better gaining approval to manage their own programs.
As in the previous chapter, industry groups influence agency design. However,
the manufacturing variable is only statistically significant in the Super-Agency model.
States with greater dependence on manufacturing were more likely to adopt a Super-
Agency structure. This result seems to confirm the idea that locating pollution control
functions in a larger agency could dilute the overall power or mission of the pollution
control functions. Further supporting this idea, states with more Sierra Club members
were less likely to adopt a Super-Agency structure, but more likely to adopt a Mini-EPA
structure.
90
The fact that the Sierra Club membership affects the adoption of the Mini-EPA
confirms finding in the literature that many states adopted the Mini-EPA structure to
make a political statement of the state’s commitment to environmental protection (Beyle,
1975; Haskell & Price, 1973)
Administrative Motivations
As in the previous model, the financial health of a state did not statistically
significantly influence whether a state adopts either a Mini-EPA or Super-Agency
structure. However, as predicted whether a state had undergone an executive branch
reorganization did influence state adoption of both a Super-Agency and Mini-EPA
structure. States that have undergone an overall state restructuring, are more likely to
adopt both types of structure than states that have not reorganized their government.
States that adopted a Health Superagency were, as expected, more likely to adopt
a Super-Agency structure, but not a Mini-EPA structure. This result makes sense because
as a state combined health with welfare, it is logical to then move environmental
protection out to another agency.
States do not appear to be influenced by external influences in choosing between
a Super-Agency and a Mini-EPA structure. The federal share of state revenue does not
have a statistically significant effect on adoption. In addition, a state’s likelihood of
adoption of either structure does not increase as the percentage of its neighbor’s
adoption increases.

91
Socioeconomic and Demographic Factors
Of all the socioeconomic or demographic factors, only the population was
statistically significant in state adoption of a Super-Agency Structure and PCI and state
size were statistically significant in the adoption of a Mini-EPA. It is unclear why state
size would affect Mini-EPA adoption but population would affect Super-Agency adoption.
The fact that PCI only affects the adoption of the Mini-EPA makes sense in that states with
higher PCI more likely are wealthier states that are able to create more focused agencies.
Policy Problem
As discussed above, policy problem can be defined by environmental quality and
as a resource to protect. The model does not include a measure of environmental quality
because such a measure does not exist for the entire time period of the analysis. The
proxy measure, vehicle miles driven, was not statistically significant. However, there are
a few measures of resources that had a statistically significant influence on state adoption
of either a Mini-EPA or Super-Agency structure. States that rely on groundwater are less
likely to adopt a Mini-EPA structure.
Conclusion
This chapter set out to not only determine what influences state adoption of
either a Super-Agency or Mini-EPA environmental agency structure, but also evaluate if
the factors are significantly different between the two structures. The analysis supports
the Agency Design model - that administrative, political, socioeconomic, and policy
problem all influence the selection of agency structure. The results are especially

92
interesting in the highlighting the differences between states that adopted a Super-
Agency Structure and those that adopted a Mini-EPA structure. The choice to adopt a
Super-Agency Structure seems to be more influenced administrative motivations, while
the Mini-EPA adoption is more influenced by political motivations. States are more
influenced by their neighbors in adopting the Super-Agency structure than in adoption of
the Mini EPA structure. The level of uncertainty in the legislature reduced the likelihood
of a state adopting a Mini-EPA, but not in adopting a Super-Agency. This result is likely
due to the more political nature of the Mini-EPA structure.
Improvements to Analysis
The empirical analysis could be enhanced with additional or alternative variable
measures and addressing limitations to the current model. These enhancements are
similar as in the previous chapter.
Administrative Response to Federal Regulation: Currently, the model does not
have a measure that captures the increased responsibilities placed on states
between 1967 and 2000. Over 10 federal laws were passed with additional
amendments requiring compliance from states.
Environmental Quality: Not having any consistent measure of environmental
quality make it difficult to assess to what extent the severity or nature of the
pollution problem affect state adoption of agency structure. The model includes
a measure of vehicle miles driven, which is an indirect measure of environmental
emissions.
93
Environmental Group Pressure: One of the main drivers of state centralizing their
pollution functions and adoption of a Comprehensive Structure of any type was
political pressure from environmental groups. The model includes a measure of
the Sierra Club membership, which may not be the most completely measure of
environmental group activity (Andrews, 1998; Bosso, 2003; Wikle, 1995)
Influence of other states: Beyle (1975) found in his analysis that states were
influenced by their neighbors. It is surprising that neighboring states had no
effect in the previous chapter or in these two models. A better measure of the
influence of other states on a state agency design could be found using a dyad
analysis (comparing each state to each state).
Board/Commission: As discussed in more detail in Chapter Seven, 34 states still
have a board that serves either as rulemaking or advisory entity. Initially, the
majority of states had either independent pollution control boards or these
boards were connected to the department of health. The model could be
enhanced by an inclusion of these boards, and even might help explain the
influence of the citizen ideology variable.
Exceptions to the model: One of the main limitations of the model is that it does
not capture the changing structures within many states. While the number of
states that changed their structure between a Super-Agency and Mini-EPA is
small, the model could be enhanced by inclusion of a measure of these changes
Adding these measures to the model could provide a clearer picture of what has
influenced state adoption of environmental agency structures.

94
CHAPTER 6: STATE ADOPTION OF ENVIRONMENTAL POLICIES
In describing his theory of public organizations, Moe (1990) argued that the design
of agencies and the impact of that design are linked, in that, politicians design agencies
to implement their political goals. In the late 1960s, as states were facing increased local
and federal pressure to address environmental pollution, scholars argued that the
existing organizational structures were not adequate to address the pollution problem
(Haskell & Price, 1973; Hines, 1966). The next two chapters explore the second goal of a
positive theory of organizations: understand the effect of the structure on policy
adoptions. The small literature that has examined the role of state environmental
protection agency structure has found that it does have a statistically significant impact
on policies, enforcement, and expenditures of a state (A. Bacot & Dawes, 1996; A. H.
Bacot & Dawes, 1997; Hoornbeek, 2011; Hunter & Waterman, 1996; J. Lester, 1980). The
goal of this chapter is to place the environmental agency structure within the context of
the wider environmental policy adoption literature and develop theory of how
bureaucratic structure affects policy adoption. The next chapter tests that theory
empirically.
States policy adoption is influenced by internal characteristics of states and
external influences outside of states. Internally, state policies develop through
interactions between system resources, demand patterns, and decisional systems
(Salisbury, 1968). A state’s socio-economic, political, and ideological characteristics
impact state policy outputs. (F. S. Berry & Berry, 1990, 1991; Gray, 1973; Volden, 2006;
Volden, Ting, & Carpenter, 2008; Walker, 1969). States also respond to policies adopted

95
by other states (F. S. Berry & Berry, 1990; Gray, 1973). The effect of political, economic,
and ideological characteristics of a state is mediated through the decisional system of that
state, as is shown in Figure 11 below. This model is developed from a model of policy
adoption first proposed by Salisbury (1968) and later amended by Lester (1980) and
Ringquist (1993a).
Figure 10: Model of Environmental Policy Adoption (J. Lester, 1980; Ringquist, 1993; Salisbury, 1968)
Environmental policy adoption literature has generally focused on the effect of
system resources, demand patterns, and environmental problem severity influences on
policy outputs (Bromley-Trujillo, 2012; Daley & Garand, 2005; Hays, Esler, & Hays, 1996;
E. Ringquist, 1993). Ultimately, the adoption of an environmental policy is made within
the decisional system of a state that includes the executive and legislative branches of the
government. Decisional systems describe the structure and capacity of the executive and
legislative branch to use system resources to translate demand patterns and

96
environmental severity into policy outputs (J. Lester, 1980). When studies do include a
measure of the decisional system, the measure focuses on the capacity of the legislative
branch, rather than the agency design.
Environmental Severity
Public policies are designed to address a perceived policy problem. The primary
intention of environmental regulation is to reduce levels of environmental pollution.
Environmental severity can be described as the quality of state physical resources (air,
land water) and as the threat of contamination to a resource. Studies have found that
there is a level of “matching” in state environmental policy making, even controlling for
the socioeconomic, political, and structural systems within a state (A. Bacot & Dawes,
1996; Daley & Garand, 2005; J. P. Lester, Franke, Bowman, & Kramer, 1983; Lowry, 1992;
Sapat, 2004). In addition, studies have found that states adopt certain types of
environmental policies in response to the importance of a resource within a state. For
example, states that have adopted groundwater protection innovations tend to have
larger quantities of groundwater supplies (Blomquist, 1991). Hoornbeek (2011) found
that coastal states are more likely to have active nonpoint source pollution programs.
System Resources (industrialization, urbanization, income, education)
System resources describe the resources available to a state. The socioeconomic
conditions within the state will influence policy adoption (Dawson & Robinson, 1963; Dye,
1979; Jennings, 1979). Socioeconomic conditions include citizen characteristics such as
97
income and education, and macro-economic conditions including gross state product and
unemployment rates. Walker (1969) argued that there are leading or pioneering states
that are constantly innovating and developing new solutions to policy problems. He
found that leader or innovating states were more industrialized and urban (Walker, 1969).
Analysis in environmental policy literature has found that states with more wealthy,
educated, and liberal citizens are more likely to adopt environmental protection policies
(Ringquist, 1993, 1994). Wealthier states have the financial resources to manage more
robust environmental programs (A. H. Bacot & Dawes, 1997; Bromley-Trujillo, 2012; Daley
& Garand, 2005; Konisky & Woods, 2012). Bromley-Trujillo (2012) found that states with
a higher per capita income were more likely to adopt innovative environmental policies.
Demand Patterns (party organization, political leaderships, interests)
Demand patterns describe the political demand for policies within a state. As
stated earlier, elected officials are motivated by reelection and can be influenced by
political pressure from constituents and interests. This demand is measured by citizen
ideologies and level and types of interests active within a state. More liberal governments
and citizens generally demand more environmental regulations. Citizen demand can be
measured by general citizen ideology indices or by public opinion surveys. Many studies
of how public opinion about environmental quality is translated to policy focus on
national level surveys, with few examining the process at the state level. National studies
have found that, unlike other issues, environmental issues are not generally ‘wedge
issues’ in that they determine who an individual votes for in an election (Davis & Wurth,

98
2003; Guber, 2001). Using data from the 2007 Cooperative Congressional Election Study
(CCES), (Konisky, Milyo, & Richardson, 2008), found that public opinion about the
environment varies based on the geographic scale of the environmental issue. The public
cares more about national and local issues (drinking water quality, smog) than global
issues (climate change, ozone depletion) and the majority would support either ‘a lot’ or
‘a little bit more’ government effort to address various environmental issues (Konisky et
al., 2008).
In addition, the power of environmental and the affected industry interests will
also influence the adoption of environmental protection policies (Oates, 2004). Theories
of political economy propose that interests could impact the stringency of state
environmental regulations as elected officials try to assess public opinion. The two main
interests that could influence environmental regulations are industry groups and
environmental (green) groups. In addition, theories of political control argue that
bureaucrats are motivated to increase their budget and maximize political support from
elected officials. Many studies have attempted to determine the level of influence that
these groups (interests and elected officials) have on regulators. These studies include
surveys of interests, elected officials, and state environmental regulators; and cross-
sectional and panel data analysis of state regulatory decisions. For example, (Potoski,
2001) found that the number of environmental groups per 1000 residents in a state had
a statistically significant impact on state decisions to exceed USEPA criteria pollutant
standards, while the power of industry did not.

99
Decisional Systems
“Public policy is made by institutions within the political system” (E. Ringquist,
1993). The decisional systems component of a policy adoption model measures the
institutions within the state. The decisional system describes the capacity of the
legislative and administrative branches, which is measured as resources (financial, capital,
and human) and the structure. Figure 11 below, shows how the executive and legislative
branches of the government affect policy adoption.
Figure 11: Bureaucratic Structure Direct and Indirect Effects
Each branch of government can directly adopt new policies; and indirectly
influence the adoption of policies. Both branches of government influence policy
adoption, but are not always included in models of environmental policy adoption.
Legislative Capacity
The primary measure of the decisional system in environmental policy literature
is one of legislative capacity. The majority of major policies are adopted by the legislature
rather than administrative agencies, so the capacity of that branch of government should

100
have a significant impact on the types and number of policies adopted. Legislatures with
more resources and “professional capacity” are more likely to adopt more innovative
policies (Huber, Shipan, & Pfahler, 2001; Walker, 1969). Legislators have more time and
staffing support to process more information and consider more policy options. Studies
have found that legislative professionalism can affect the level of environmental
commitment among states (Bromley-Trujillo, 2012; Hays et al., 1996; Konisky & Woods,
2012).
Bureaucratic Capacity
Bureaucratic capacity matters. While the legislature is the primary policy adopter
in states, many state agencies also adopt new policies outside of the legislature and
influence legislative decisions. Capacity has been measured as agency staffing levels,
financial resources, and agency design. While Bacot and Dawes (1996) found no statistical
relationship between the capacity of the agency, as measured by number of employees
and level of environmental expenditures, Sapat (2004) found that agencies with more
hazardous waste employees adopted more hazardous waste policies. The focus of the
empirical analysis in the next chapter is on agency structure. The level of influence of
bureaucratic structure on state policies varies based on agency, culture, and capacity
(Barrilleaux, Feiock, & Crew Jr, 1992; Jennings & Woods, 2007; Krause & Woods, 2014).
While much of the bureaucratic agency literature evaluates the effect of structure at the
federal level, there has been some analysis at the state level. Much of the literature at
the state level has focused on higher education structures and their direct effect on policy

101
outputs (Knott & Payne, 2004; Nicholson-Crotty & Meier, 2003; Volkwein & Tandberg,
2008). A small number of scholars have found that agency structures affect
environmental policy adoption, enforcement, and outcomes (A. Bacot & Dawes, 1996; A.
H. Bacot & Dawes, 1997; Hoornbeek, 2011; Hunter & Waterman, 1996; J. Lester, 1980).
The structure of public agencies has a direct effect on the capacity of agencies to enforce
and implement policies. It makes sense, then, that studies have found that the structure
of environmental protection agencies can affect the level of enforcement activities and
environmental quality (Hoornbeek, 2011; Hunter & Waterman, 1996). In addition, many
agencies have flexibility to develop innovative programs to address broader pollution
issues, such as hazardous waste, climate change, and nonpoint source water pollution.
However, studies have found that agency structure can affect more than just direct
actions by the agencies themselves. Agency structure can also affect legislative policy
adoption and levels of environmental expenditures (A. H. Bacot & Dawes, 1997;
Hoornbeek, 2011). Legislators respond to agency capacity and structure in designing
policies (Jennings & Woods, 2007; Krause & Woods, 2014).
Direct Impact
Bureaucratic structure directly impacts how resources are allocated, how
information is processed, and what priorities are pursued. In addition, public
organizational structures can also determine the level of influence of special interests and
legislators. For example, the greater the centralization of an agency structure, the lower
the transaction costs for individuals seeking to influence that agency (Nicholson-Crotty &

102
Meier, 2003). In terms of environmental policy, the impact of structure can be seen in
level of enforcement activity, development of innovative programs, and environmental
quality outcomes. Previous studies generally found that horizontal specialization does
impact policy outputs and outcomes. States that located their environmental regulation
programs within health departments had lower environmental innovation (J. Lester,
1980), had lower levels of nonpoint source pollution activism (Hoornbeek, 2011), and
fewer number of enforcement actions (Hunter & Waterman, 1996). Hunter and
Waterman (1996) also found that states that located environmental regulations in a
health department had lower water quality outcomes. Interestingly, when delving
deeper into specific regulatory permit stringency, Hoornbeek (2011) found that non-
health agencies actually had less stringent water permits related to whole effluent toxicity
(WET) policies than health agencies. He theorized that this difference could be attributed
to the fact that WET is more common in the health field than in environmental fields.
WET describes the aggregate toxic effect of a water sample, or its impact on the health of
an organism.
Indirect Impact
Legislators respond to agency capacity and structure in designing policies
(Jennings & Woods, 2007; Krause & Woods, 2014). Legislators, rational individuals
motivated by reelection and maintaining power, design and support policies that align
with their own political views, please their constituencies, and are effectively
implemented by the executive agency (Moe, 1990a). Depending on how specifically a
103
statute defines a policy and implementation, the agency may have a lot of discretion in
implementation which leads to uncertainty. Structural design is especially influential in
reducing the level of implementation uncertainty, or ability of an agency to coordinate
and implement specific policies (O’Toole Jr & Meier, 2003). Structural design can improve
the efficiency and effectiveness of an agency. Therefore, more effective agencies with
high levels of capacity will likely have more discretion in implementation and also be
delegated more complicated or innovative policies. Under the agency theory, legislators
have to protect against bureaucratic drift and a more centralized agency structure
reduces the chances of bureaucratic drift (Moe, 1990a). In a state where the executive
and legislative branches are managed by different political parties, legislators will
consider how politically insulated an agency is in terms of management appointments,
existence of oversight boards and commissions, and funding. (Krause & Woods, 2014).
Horizontal and Vertical Diffusion
Horizontal and vertical influences from outside of the state will also influence
policy adoption. Diffusion of innovations in public institutions occurs as a process of
learning and conformity (F. S. Berry & Berry, 1991) and competition. States seek to
simplify the complex processes of decision making by looking at how other states are
addressing problems and learning lessons (Shipan & Volden, 2008). States are influenced
by other states through national communications networks (Gray, 1973; Walker, 1969)
and regional influences (F. S. Berry & Berry, 1990). The adoption of an innovation by a
state’s neighbors can influence the probability that a state will also adopt it (Balla, 2001;
104
Mintrom, 1997). In addition to these various forms of horizontal diffusion patterns, states
will also implement innovations under mandated or implied pressure from the federal
government in a vertical diffusion pattern (F. S. Berry & Berry, 1990).

105
CHAPTER 7: EFFECTS OF INSTITUTIONS ON POLICIES: ENVIRONMENTAL INNOVATION
The structures of public agencies “set the rules of the game…advantage some
groups over others” (Nicholson-Crotty & Meier, 2003). By its very nature, organizational
structure shapes the goals pursued and policy choices considered relevant. The structure
creates information networks based on who is located where on the hierarchy.
Hammond (1986) proposes that public bureaucratic structure functions in the same way
a legislative agenda acts by defining “what options [are] to be compared, in what
sequence, and by whom.” Moe (1990) argued that politicians select an agency structure
to further their political goals. Therefore, the choice to place pollution prevention within
a stand-alone agency or house it within a health agency or other natural resource agency
is made with policy goals in mind.
Each agency will have its own mission statement, internal hierarchy, and strengths
and weaknesses. These agency characteristics will either facilitate or hinder its ability to
respond to pollution challenges within the state – whether from large stationary polluters
or from small dispersed sources that span geographic and political boundaries. The later
types of pollution, called second and third generation pollution problems, require
innovation, flexibility, coordination across government agencies (horizontally and
vertically), and collaboration with the private sector. Those states with Mini-EPAs should
be better able to innovate because there are no other conflicting missions and demands.
However, if a Super-Agency is functioning as envisioned, with integration and cooperation
between the pollution control and natural resource functions, it might be more able to
respond to pollution challenges that span geographic areas.
106
The focus of this analysis is on policy outputs, rather than policy outcomes. The
theory in the literature is that policy outputs lead to policy outcomes. Environmental
policy outcomes include environmental outcomes, political outcomes, and economic
outcomes. Environmental outcomes are changes in environmental quality within a state,
such as improvements in air quality or reduction in asthma rates. Political outcomes
include effects on political participation (civic engagement), political power of various
interests (environmental groups vs. industry groups), the electoral well-being of elected
officials and political parties, and effects on interagency and intergovernmental dynamics
(state agency cooperation and state-federal cooperation). Finally, economic outcomes
measure effects of policies on state economic and financial conditions (J. Lester, 1995;
Ringquist, 1993). The focus of environmental literature is generally on policy outputs,
often due to data limitations for measuring outcomes. Ringquist (1993) found a
connection between policy outputs and environmental outcomes. States with a stronger
regulatory air quality and water quality program reduced the concentration of many
common air and water pollutants.
Literature Review
The few studies that have explored a relationship between agency structure and
policy adoption have found conflicting results, but these studies have also used different
policy indices to measure policy adoption. Bacot and Dawes (1997) used the Fund for
Renewable Energy and the Environment (FREE) index of environmental policies and found
no effect of agency structure on state ranking along this index. However, Lester (1980),
107
using an Index of Environmental Control (he created), found states that retained pollution
control in their health department were less likely to adopt the policies included in his
index (i.e. adoption of wetlands management, adoption of floodplain management
legislation, and severity of requirements for statewide environmental impact
statements). Most recently, Hoornbeek (2011) found that states that housed their
pollution control functions outside of the department of health were more active in
adopting nonpoint source (NPS) policies (measured by an index he created).
Each of the three studies discussed above developed their policy indices from data
measuring state policy adoption during different time periods (1967-1975; 1987; 1997-
2002). The number of states that had not adopted a Super-Agency or Mini-EPA structure
varies across these time periods, as do the policies included in the indices. In addition,
these studies each used cross-sectional data, rather than time-series. This chapter will
build on these early studies to explore the impact of agency structure on state policy
adoption over time. Specifically, I want to evaluate what effect agency structure has on
state adoption of environmental policies that address second and third generation
pollution problems.
First Generation vs Second and Third Generation Pollution Problems.
The original environmental pollution control regulations in the 1970s tended to
address first generation pollution problems. First generation environmental problems
primarily deal with clean air and water and are caused by pollutants that remain in one
medium (i.e. water, air) and often come from large, concentrated sources (Fiorino, 2006;

108
E. Ringquist, 1993). This type of pollution can be described as smokestack and water pipe
types of problems that are generally addressed with pollution control technology on the
pipe or stack. The Mini-EPA and USEPA structures developed primarily to address first
generation pollution problems that fell within a specific category (air, water, land) and
were regulated at the source through the permitting process.
Second generation pollution problems are caused by pollutants that easily move
through multiple media and stem from small, dispersed sources. Groundwater pollution
from poor hazardous waste disposal would be an example of these types of problems.
Regulating underground storage tanks and solid waste programs (such as electronics
recycling) target both land pollution and potential groundwater contamination. Reducing
contamination from lead paint targets millions of individual homeowners rather than a
few large private companies. These externalities “require a coordinated and integrated
approach to environmental protection” not considered when the traditional
environmental regulations were developed (E. Ringquist, 1993). The regulations that
have been passed to address these issues have incorporated partnerships with private
industries and local governments. Both public and private green building standards are
developed to target the millions of buildings, rather than specific industries.
Finally, third generation environmental problems are problems that have cross
media impacts, but also can have an effect at regional, national, and global levels. These
problems include acid rain, tropical deforestation, and climate change (E. Ringquist,
1993). Many of the energy-related polices adopted by states since the 1990s are primarily
driven by concern for climate change. Many scholars argue that second and third

109
generation problems require a new federal-state relationship that could also include
partnerships with private industry to address these problems more “cooperatively,
holistically, and cost-effectively in the long-run” (Durant et al., 2004). The USEPA and
states have adopted and promoted ecosystem-based and watershed management
programs to address the regional nature of many pollution issues.
Model
To evaluate the effect of agency structure on environmental policy adoption, I use
a regression model with state fixed effects.15 I develop two indices of environmental
policy: an Index of Environmental Policy Adoption and a Dispersed Sources Pollution Policy
Index. These indices are developed around 12 different environmental policies adopted
by states between 1988 and 2012. These policies were adopted to address second and
third generation pollution problems. Using a fixed-effects regression, I test two internal
determinants models to determine the effect of agency structure on policy adoption. In
this analysis, I am interested in the level of policy adoption by a state. I am examining the
question of whether the structure of the agency facilitates policy adoption. Future
analyses that could build on this model would pull out individual policies to examine the
effect of structure on adoption of those policies using a Hazard Model.
15 My model has heteroskadasticity and therefore, I use robust standard errors. While some of the variables
are collinear, this multicollinearity does not pose a significant issue due to my large sample size.

110
The empirical model is based on the Model of Environmental Policy Adoption
described in the previous chapter and includes 49 states and 25 years.16 The dependent
variable ADOPTION, is a categorical variable measuring the policy adoption index for a
state i in year t.
ADOPTIONit = β1SEVERITYit + β2RESOURCESit + β3DEMANDit + β4SYSTEMit +αi + μit
In this regression model, β’s are estimated coefficients; SEVERITY measures the
problem severity, RESOURCES, measures the system resources available in a state;
DEMAND measures citizen and interest group demand; finally SYSTEM measures the
decisional system within a state. α is the unknown intercept for each state (i) and μ is the
error term. I am assuming that the error terms across states are not correlated.
Dependent Variables
The dependent variables in this analysis are additive indices of policy adoption. I
have developed two individual indices, based on a factor analysis, to evaluate the effect
of agency structure on policy adoption: Policy Adoption Index and Dispersed Pollution
Sources Policies Index. Table 8 below describes the policies included in these indices.
The Policy Adoption Index includes all 12 policies in the table. Based on the factor
analysis, seven policies loaded especially strongly together with a very high alpha.
Therefore, I created an additional index the capture the unique characteristic of these
policies. The Dispersed Pollution Sources Index only includes the first seven policies. I
chose to use indices, rather than individual policies, because I wanted to measure a wide
16 Nebraska is excluded from analysis because it has a unicameral legislature and so does not have turnover
or unified government data.
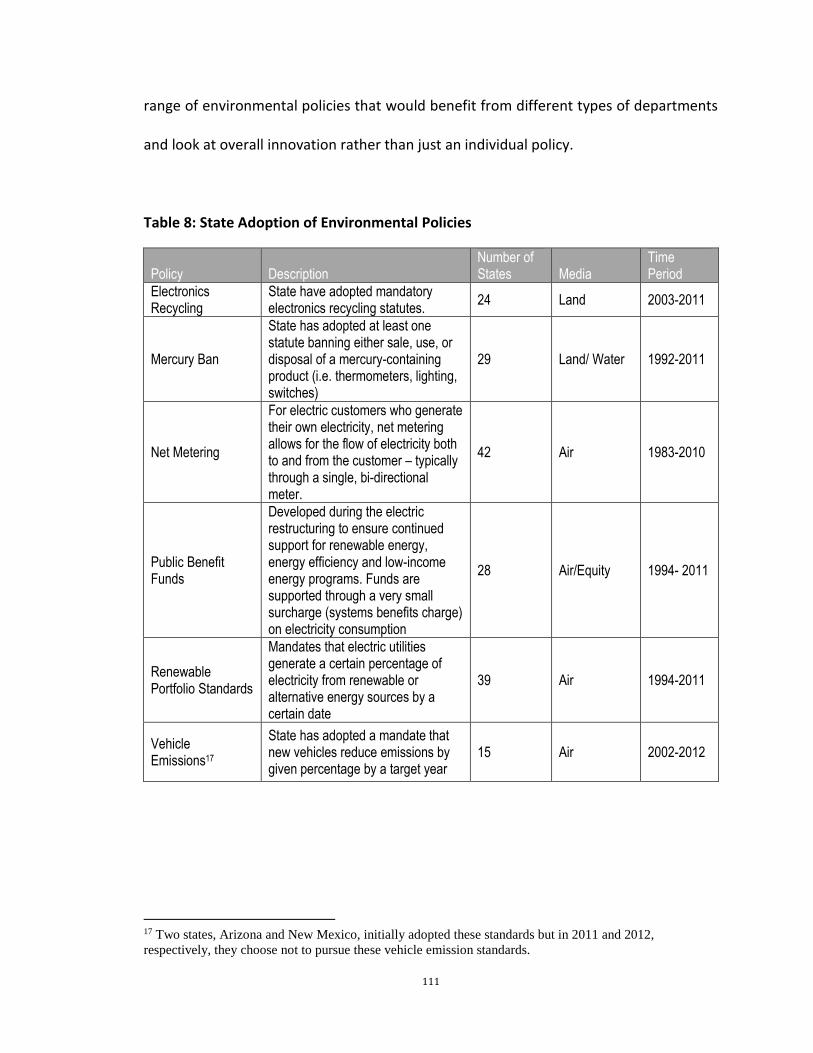
111
range of environmental policies that would benefit from different types of departments
and look at overall innovation rather than just an individual policy.
Table 8: State Adoption of Environmental Policies
Policy Description Number of States Media
Time Period
Electronics Recycling
State have adopted mandatory electronics recycling statutes.
24 Land 2003-2011
Mercury Ban
State has adopted at least one statute banning either sale, use, or disposal of a mercury-containing product (i.e. thermometers, lighting, switches)
29 Land/ Water 1992-2011
Net Metering
For electric customers who generate their own electricity, net metering allows for the flow of electricity both to and from the customer – typically through a single, bi-directional meter.
42 Air 1983-2010
Public Benefit Funds
Developed during the electric restructuring to ensure continued support for renewable energy, energy efficiency and low-income energy programs. Funds are supported through a very small surcharge (systems benefits charge) on electricity consumption
28 Air/Equity 1994- 2011
Renewable Portfolio Standards
Mandates that electric utilities generate a certain percentage of electricity from renewable or alternative energy sources by a certain date
39 Air 1994-2011
Vehicle Emissions17
State has adopted a mandate that new vehicles reduce emissions by given percentage by a target year
15 Air 2002-2012
17 Two states, Arizona and New Mexico, initially adopted these standards but in 2011 and 2012,
respectively, they choose not to pursue these vehicle emission standards.
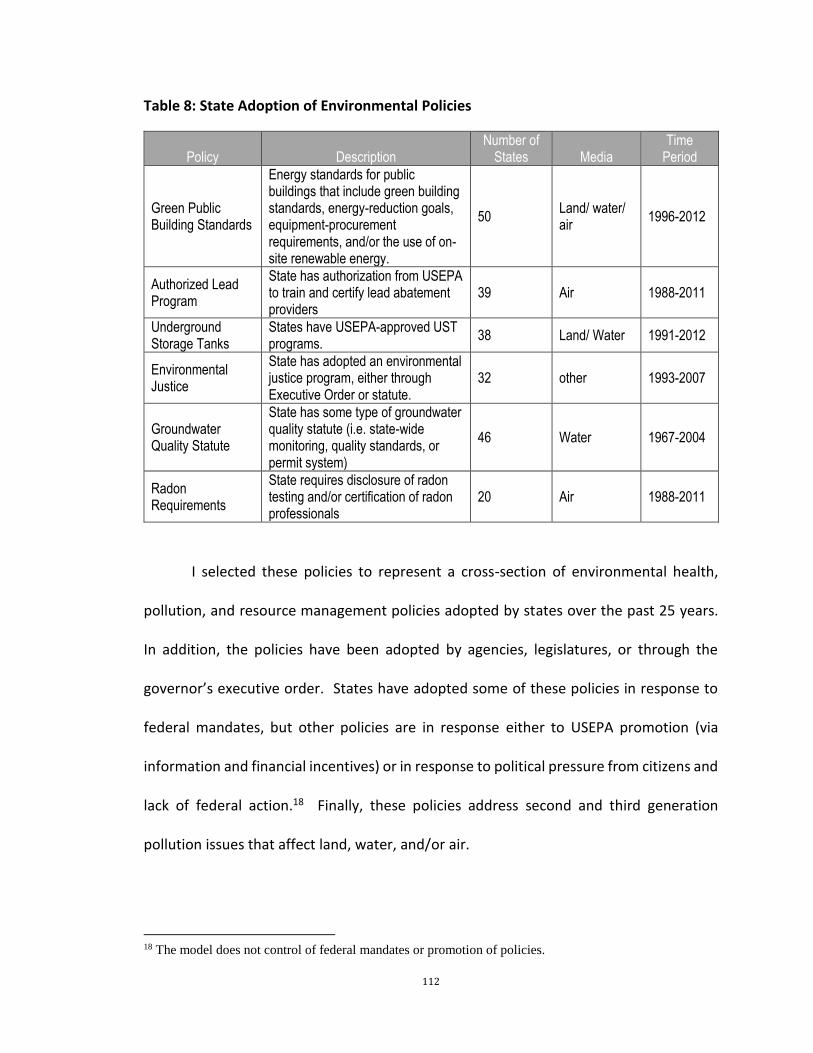
112
Table 8: State Adoption of Environmental Policies
Policy Description Number of
States Media Time
Period
Green Public Building Standards
Energy standards for public buildings that include green building standards, energy-reduction goals, equipment-procurement requirements, and/or the use of on-site renewable energy.
50 Land/ water/ air
1996-2012
Authorized Lead Program
State has authorization from USEPA to train and certify lead abatement providers
39 Air 1988-2011
Underground Storage Tanks
States have USEPA-approved UST programs.
38 Land/ Water 1991-2012
Environmental Justice
State has adopted an environmental justice program, either through Executive Order or statute.
32 other 1993-2007
Groundwater Quality Statute
State has some type of groundwater quality statute (i.e. state-wide monitoring, quality standards, or permit system)
46 Water 1967-2004
Radon Requirements
State requires disclosure of radon testing and/or certification of radon professionals
20 Air 1988-2011
I selected these policies to represent a cross-section of environmental health,
pollution, and resource management policies adopted by states over the past 25 years.
In addition, the policies have been adopted by agencies, legislatures, or through the
governor’s executive order. States have adopted some of these policies in response to
federal mandates, but other policies are in response either to USEPA promotion (via
information and financial incentives) or in response to political pressure from citizens and
lack of federal action.18 Finally, these policies address second and third generation
pollution issues that affect land, water, and/or air.
18 The model does not control of federal mandates or promotion of policies.

113
Developing the Indices
To test the effect of structure on policy adoption, I wanted to develop valid and
reliable indices. I used statistical analyses to evaluate the relationship between a set of
policies to test the reliability and validity of my index. I set out to answer three questions:
1. Are these policies correlated with each other (Tetrachoric Correlation
Analysis)?
2. What is the relationship among the policies (Factor Analysis)?
3. What is the best way to group these policies to measure environmental policy
adoption (Factor Analysis)?
Based on the analyses, I developed two indices. The Environmental Policy
Adoption Index and Dispersed Pollution Sources Index were developed based on the
correlation and factor analysis. 19 While I used the factor analysis to analyze and test the
validity of my indices, I do not use the factors generated as my dependent variable in my
model. I am interested in the total number of policies not a level of “environmentalism”.
An index using the factor scores would pull out the “environmentalism” that is shared
among the policies and not necessarily the total adoption of the policies themselves. In
addition, the previous studies that have used an index of policy adoptions have used an
additive index, and not a factor score. As I am building on these studies, I wanted to be
consistent with these other studies. However, I felt that it was important to ensure that
the policies I have chosen share some common factors and have some relationship with
19 Two policies: Watershed Management and energy efficiency codes for private buildings were removed
from the analysis based on these analyses because they were so statistically different than the rest of the
policies.
114
each other. I used the factor analysis to confirm the policies I chose have some common
factors, which they do. But I am more interested in the effect of structure on adoption of
these main policies, promoted by USEPA, that address second and third generation
pollution problems. In the future, if I am interested in measuring the innovativeness or
level of “environmentalism of a state, I will use the factor scores.20 In addition, the
previous studies that I am building upon, use additive indices to measure the effect of
structure on policy adoption. Therefore, I use an additive index or the sum of the total
policies (1-12).
Policy Correlations
There is a large variation in the level of correlation among the 12 policies. Table 9
below shows the tetrachoric correlations among the individual policies.21 The correlations
among policies range from 0.01 to 1.0. Every policy is at least moderately correlated with
at least one other policy. I have highlighted those correlations that are close or equal to
one.
20 I ran an alternative analysis using the factor scores and found that some of the results varied, the
variables of interest: Decision System variables do not change. 21 I use the tetrachoric correlations rather than Pearson correlations because I am looking for correlation coefficients for dummy variables. Pearson correlations cannot estimate the entire range of correlations (plus/minus one) because the distribution is limited.

115
Table 9: Tetrachoric Correlations22
RP
S
PB
F
Veh
icle
Em
issi
ons
Net
met
er
Mer
cury
Ecy
clin
g
Gre
en
Pub
lic B
ldg
Lead
US
T
Gro
und-
wat
er
Rad
on
EJ
Pro
gram
RPS 1.0
PBF 0.8 1.0
Vehicle
Emissions0.8 0.8 1.0
Netmeter 0.8 0.6 0.5 1.0
Mercury 0.7 0.6 0.8 0.6 1.0
Ecycling 0.8 0.6 0.7 0.6 0.7 1.0
Green
Public Bldg0.8 0.6 0.8 0.7 0.8 0.9 1.0
Lead 0.5 0.5 0.2 0.3 0.5 0.5 0.4 1.0
UST 0.4 0.2 0.2 0.3 0.2 0.4 0.4 0.7 1.0
Ground-
water0.4 1.0 1.0 0.5 1.0 1.0 0.4 0.4 0.2 1.0
Radon 0.3 0.5 0.3 0.4 0.4 0.3 0.2 0.2 0.0 0.5 1.0
EJ
Program0.4 0.5 0.5 0.5 0.5 0.5 0.6 0.4 0.3 0.5 0.2 1.0
Not surprisingly, the energy-related policies (RPS, PBF, Netmetering, and Green
Public Buildings) are highly correlated. There are some interesting correlations across
policies. For example, groundwater quality policies are highly correlated with other
policies that are developed to address groundwater pollution: mercury abatement and
electronics recycling. There is a strong correlation between underground storage tank
22 Correlations above 0.5 are in italics. Correlations between 0.5 and 0.7 are considered moderate positive
correlations. Correlations above 0.7 are italics and outlined in a black line. Correlations between 0.7 and
0.9 are considered high positive correlations; those above 0.9 are very high positive correlations.

116
policies and lead abatement policies. These are both policies that address older buildings
and sites. Groundwater policies are perfectly correlated with vehicle emissions and PBF.
I am not sure why groundwater quality policies would be so closely correlated with vehicle
emissions and PBF.
Factor Analysis
Correlations can show whether policies have some type of relationship, but
further analysis is needed to evaluate what that relationship looks like. I used factor
analysis to determine the relationship among policies and develop the indices. The results
of the factor analysis supported a general relationship among these policies. All policies
load on the first factor indicating that there is an underlying environmental factor within
each policy. 23 The policies fall into four primary factors (see Table 10 below). The model
is statistically significant (chi2 (66) = 4,193.66) at the p<0.0001 level. The first factor
explains over 35 percent of the variance and combined the first four factors explain over
65 percent of total variance.
23 I used 0.32 as a cutoff to include a variable as loading on a factor for the unrotated matrix. For
evaluating the rotated factor matrix, I used 0.50. The unrotated matrix is included in Appendix G.
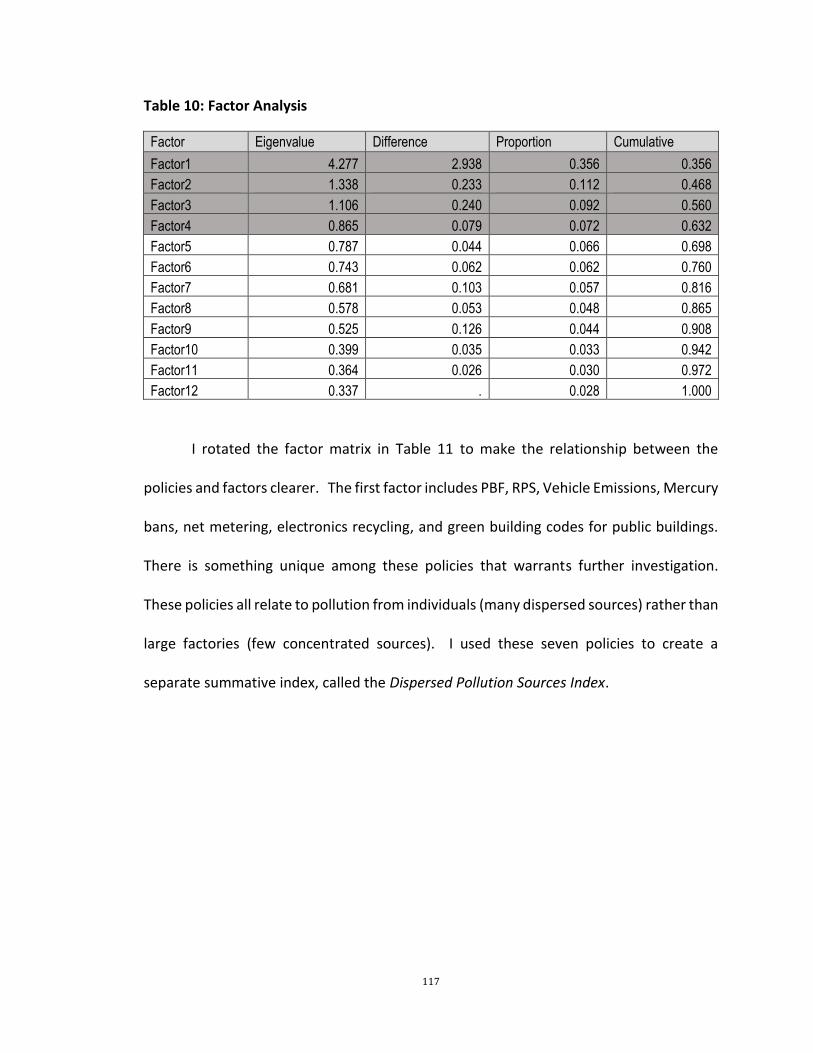
117
Table 10: Factor Analysis
Factor Eigenvalue Difference Proportion Cumulative
Factor1 4.277 2.938 0.356 0.356
Factor2 1.338 0.233 0.112 0.468
Factor3 1.106 0.240 0.092 0.560
Factor4 0.865 0.079 0.072 0.632
Factor5 0.787 0.044 0.066 0.698
Factor6 0.743 0.062 0.062 0.760
Factor7 0.681 0.103 0.057 0.816
Factor8 0.578 0.053 0.048 0.865
Factor9 0.525 0.126 0.044 0.908
Factor10 0.399 0.035 0.033 0.942
Factor11 0.364 0.026 0.030 0.972
Factor12 0.337 . 0.028 1.000
I rotated the factor matrix in Table 11 to make the relationship between the
policies and factors clearer. The first factor includes PBF, RPS, Vehicle Emissions, Mercury
bans, net metering, electronics recycling, and green building codes for public buildings.
There is something unique among these policies that warrants further investigation.
These policies all relate to pollution from individuals (many dispersed sources) rather than
large factories (few concentrated sources). I used these seven policies to create a
separate summative index, called the Dispersed Pollution Sources Index.

118
Table 11: Rotated Factor Matrix
Variable Factor 1 Factor 2 Factor 3 Uniqueness
RPS 0.703 0.239 0.194 0.411
PBF 0.572 0.085 0.421 0.488
Vehicle Emissions 0.744 -0.082 0.083 0.432
Net Metering 0.530 0.189 0.340 0.568
Mercury 0.670 0.113 0.253 0.474
Ecycling 0.719 0.150 -0.040 0.459
Public Green Buildings 0.815 0.199 0.000 0.297
Lead 0.134 0.824 0.149 0.282
UST 0.109 0.848 -0.060 0.266
Groundwater 0.047 0.246 0.636 0.533
Radon 0.104 -0.053 0.792 0.359
EJ program 0.395 0.323 0.168 0.711
Factor 2 includes policies that address pollution on buildings and grounds
including UST policies and lead abatement policies. Factor 3 includes radon abatement
certification and groundwater quality programs. To help understand how the policies are
loading, I graphed the first two rotated factor below in Figure 14.

119
Figure 12: Rotated Loading Factors (Factor 1 and Factor 2)
rps
pbf
vehicle_emit
netmeter
mercuryecycl ing
energy_bld~b
leadust
groundwater
radon
ej_program
-0.200
0.000
0.200
0.400
0.600
0.800
1.000
0.000 0.100 0.200 0.300 0.400 0.500 0.600 0.700 0.800 0.900
Fact
or
2
Factor 1
The third factor includes groundwater quality and radon abatement. These
policies seem to be clustered together because they are somehow different than the
other policies. These policies are tied closely to natural resources – water and land (radon
is related to rock formations). These two policies also tend to include other agencies
(health, natural resources) and relate to the geography and resources of a state. While
all the policies load on the first factor, the policies above in the graph that are clustered
together on the right all load the heaviest and are all second and third generation
pollution problems and many relate to climate change. Finally, environmental justice is
not clustered with any other policies and does not load on any other factor. Of all the
variables, environmental justice has the highest uniqueness value (see table 9) of over 70
percent. While this policy is an environmental policy - it is also a unique type of policy.
Factor 2
Factor 1
Factor 3

120
Policy Adoption Index
The Policy Adoption Index includes all 12 policies listed in Table 6 above. The
Cronbach Alpha for this index is 0.8097, indicating a strong relationship across these
policies. Second and third generation pollution problems often require innovative and
collaborative management programs because they span multiple media and multiple
sources.
Figure 13: Environmental Innovation Index
States that have adopted the most policies tend to be coastal states and
traditionally liberal states. However, there are few states that score high on the index,

121
which are not generally thought of as environmental or liberal states, including, Utah and
Indiana. All states have adopted at least one of these policies.
Dispersed Sources Pollution Policies Index
The Dispersed Sources Pollution Index includes seven policies adopted in the last
20 years to address second and third generation pollution problems from large numbers
of dispersed sources and includes: PBF, RPS, net metering, ecycling, mercury bans, vehicle
emissions, and green building standards for public buildings. The Cronbach Alpha for this
index is 0.8372, indicating a strong relationship across these policies Figure 14 below
shows which states have adopted the most of these policies.
Figure 14: Dispersed Sources Pollution Policies Index

122
Those states that have adopted the most policies tend to be the coastal and more
liberal states, including California, New York, and Illinois.
Explanatory Variables
The explanatory variables can be divided into four categories: environmental
severity variables, system resources variables, demand variables, and decisional system
variables. Summary statistics for each variable are listed in Table 11. The following section
describes these variables in more detail.
Environmental Severity
Environmental Severity variables measure the environmental quality within a
state using two pollution variables and three resource variables. In general, the
environmental literature has found a level of matching between polices and
environmental quality – that environmental policies are adopted in response to perceived
environmental problems (Daley & Garand, 2005; J. P. Lester et al., 1983; Lowry, 1992). In
those studies that have included a measure of agency structure, the results have been
mixed (A. Bacot & Dawes, 1996; Hoornbeek, 2011; J. Lester, 1980; J. P. Lester et al., 1983).
According to Lombard and Lester (1990), the pollution severity argument is that increased
industrialization increases pressure for environmental policy responses. Those studies
that have found a positive relationship between problem severity and policy adoption.
However, the results depend on the measure of problem severity. Studies that include a
direct measure of pollution levels or environmental quality find a positive relationship,

123
while studies with an indirect measure generally find a negative relationship (A. Bacot &
Dawes, 1996; J. Lester, 1986; Sapat, 2004).
The two pollution variables used in this analysis are indirect measures of
environmental pollution. The first pollution variable is total releases (air, water, land)
from the Toxic Release Inventory data from the USEPA (Toxic Release Data). The Toxic
Release Date is measured as 10 million pounds per person. It is expected that states with
higher quantities of toxic releases will adopt more of the environmental policies.
However, in two studies that have included TRI release data and agency structure, higher
quantities of TRI releases reduces the likelihood of policy adoption (A. Bacot & Dawes,
1996; Hoornbeek, 2011). In addition, a measure of the total vehicle miles travelled within
a state is included as an estimate of air pollution within that state (Vehicle Miles). Vehicle
Miles is measured as thousand vehicle miles per person. It is expected that as number of
vehicle miles increases, policy adoption will also increase, especially because so many of
these policies are related to air emissions and climate change.
The following resource variables are included in the model: water area, surface
water usage, and groundwater usage.24 Water area of each state measure the percent of
a state that is covered with surface water. The model also includes a measure of Surface
Water Usage and Groundwater Usage, both in billion gallons per day, to capture resource
demand of states. States with greater water area and higher reliance on surface and
groundwater will be more likely to adopt environmental policies.
24 As described in the previous chapter, I have divided the Environmental Severity variables into two
categories: policy problem (pollution measurement) and the type and quantity of environmental resources
in a state (water, land, etc).

124
System Resources Variables
The system resources included in this model capture the wealth of the population
and the wealth and resources available to the state government. Socioeconomic and
demographic factors can have an indirect influence on state agency design by providing
constraints and resources to the state. Larger (Size and Population) states with greater
wealth (Per Capita Income) should be more likely to adopt environmental policies. Size
of states is measured in ten-thousand square miles. Population is measured in number
of people in ten-thousands. Per Capita Income is measured in thousands. More Urban
states should also be more likely to adopt environmental policies. In addition, states with
higher levels of debt (Fiscal Health), should be less likely to adopt new environmental
policies. Fiscal Health is measured as annual revenues minus expenditures in millions.
Studies that have included system resource and agency structure variables have found
differing influence of system resources. Bacot and Dawes (1997) found that state fiscal
health had no statistically significant effect on policy adoption. However, Hoornbeek
(2011), found that per capita income and population increased the likelihood of state NPS
policy activism.
Demand Variables
Demand variables measure the demand from constituency and interests.
Constituency pressure is measured using a Citizen Ideology index. This index ranges on a
scale from zero to 100 with the higher scores indicating a more liberal citizenry (W. D.
Berry et al., 1998). It is expected that more liberal states would adopt more
environmental policies. Interest group demand is measured as the percentage of gross

125
state product (GSP) of three relevant interests: manufacturing, mining, and agriculture.
These three groups are directly affected by pollution control legislation. It is expected
that as the reliance on one of these industries increases, states will be less likely to adopt
environmental policies. Environmental interest demand is measured as Sierra Club
members per 1000 residents per state (Sierra Club). It is expected that states with higher
membership levels will be more likely to adopt environmental policies. Previous studies
have found that environmental interests have a statistically significant effect on policy
adoption; while industry interests do not (A. Bacot & Dawes, 1996; Hoornbeek, 2011).
Decisional Systems Variables
Decisional system variables measure the strength of the governor’s office,
capacity of the legislature, the political orientation of the government and the agency
structure. The strength of the governor’s office (Governor Power) is an institutional score
of governor’s overall power. This measure includes an average of scores for tenure
potential, appointment powers, budgetary power, and veto power. States with more
powerful governors will likely be more likely to adopt environmental policies. Legislative
professionalism is measured by the Squire Index, which includes three variables: legislator
pay, staff per legislator, and total days in session. States with more professional
legislatures should be more likely to adopt environmental policies. The political
orientation of the decision system is measured as Government Ideology. It is expected
that more liberal governments are more likely to adopt environmental policies.

126
Agency Structure
This paper uses the generally accepted typology of state agencies-- Mini-EPA,
Super-Agency, and Health-- to measure agency structure. Proponents of each structure
find characteristics of each that make their structure the most effective in promoting
environmental quality and health. While it is expected that there will be a relationship
between the agency type and type of environmental policies adopted, it is unclear which
type of agency will most affect the overall Policy Adoption Index. Based on the literature,
it is expected that states with their pollution control functions in the department of health
will be less innovative.
Advisory or Rulemaking Board
Many states (33) have an environmental board or commission that either serves
in an advisory role or in a rulemaking role or to hear appeals (Board). The Board variable
is a dichotomous variable where states that have an appeals, advisory, or rulemaking
board (1) or have no such board (0). These boards, generally appointed by the governor
and confirmed by the senate, include citizen representatives, experts, and sometimes
government officials. These boards or commissions vary across states, as is clear in Table
12 below. It is expected that states with a board will be less likely to adopt environmental
policies. These boards often include members of the affected industries and therefore
would be more cautious in adopting regulations.

127
Table 8: State Adoption of Environmental Policies
State Advisory Commission Members Terms Appointment Advisory or Rulemaking
Alabama Environmental Management Commission
7 6-year Appointed by Governor, confirmed by Senate
Rulemaking
Arkansas Pollution Control and Ecology Commission
13 4-year Appointed by Governor
Rulemaking
California
Air Resources Board 11 N/A Appointed by Governor
Rulemaking
Water Resource Board 5 4-year Appointed by Governor, confirmed by Senate
Rulemaking
Colorado
Water Quality Control Commission
9 3-year Appointed by Governor, confirmed by Senate
Rulemaking
Air Quality Commission 9 3-year Appointed by Governor, confirmed by Senate
Rulemaking
Solid & Hazardous Waste Commission
9 3-year Appointed by Governor, confirmed by Senate
Rulemaking
Connecticut Council on Environmental Quality
9 8-year 5 by Governor 2 by the Senate 2 by the House.
Advisory
Florida Environmental Regulation Commission
7 4-year Appointed by Governor
Rulemaking
Illinois25 Pollution Control Board 5 3-year Appointed by Governor, confirmed by Senate
Rulemaking
Indiana Environmental Rules Board
16 4-year Appointed by Governor
Rulemaking
Iowa Environmental Protection Commission
9 4-year Appointed by Governor, confirmed by senate
Rulemaking
Kentucky Environmental Quality Commission (EQC)
7 4-year Appointed by Governor
Advisory
Maine Environmental Improvement Commission
7 4-year Appointed by Governor, confirmed by legislature
Rulemaking
25 The Illinois Pollution Control Board is an independent agency, separate from the Illinois Environmental
Protection Agency, whereas the rest of the rulemaking and advisory boards are connected to the
environmental agency. Wyoming Environmental Quality Council also functions as an independent agency.

128
Table 8: State Adoption of Environmental Policies (continued)
State Advisory Commission Members Terms Appointment Advisory or Rulemaking
Massachusetts Water Resources Commission
13 3-year Appointed by Governor
Advisory
Minnesota
Legislative-Citizen Commission on Minnesota Resources (LCCMR)
17 4-year
5 by the Governor, 1 by the Senate 1 by the House.
Advisory
Mississippi Commission on Environmental Quality
7 7-year Appointed by Governor, confirmed by Senate
Rulemaking
Missouri
Clean Water Commission
7 4-year Appointed by Governor, confirmed by senate
Rulemaking
Air Conservation Commission
7 4-year Appointed by Governor, confirmed by senate
Rulemaking
Hazardous Waste Management Commission
7 4-year Appointed by Governor, confirmed by senate
Rulemaking
Solid Waste Advisory Board
25 3-year Appointed by Director of Department of Natural Resources
Advisory
Safe Drinking Water Commission
9 4-year Appointed by Governor, confirmed by senate
Rulemaking
Montana
Board of Environmental Review
7 N/A Appointed by Governor
Rulemaking
Clean Air Act Advisory Committee
N/A N/A N/A Advisory
Solid Waste Advisory Committee
11 N/A N/A Advisory
Water Pollution Control Advisory Council
11 N/A Appointed by Governor
Advisory
Nebraska Environmental Quality Council
17 4-year Appointed by Governor, confirmed by Legislature
Rulemaking
Nevada State Environmental Commission
11 N/A Appointed by Governor
Rulemaking
New Jersey Clean Air Council 18 4-year Appointed by Governor
Advisory
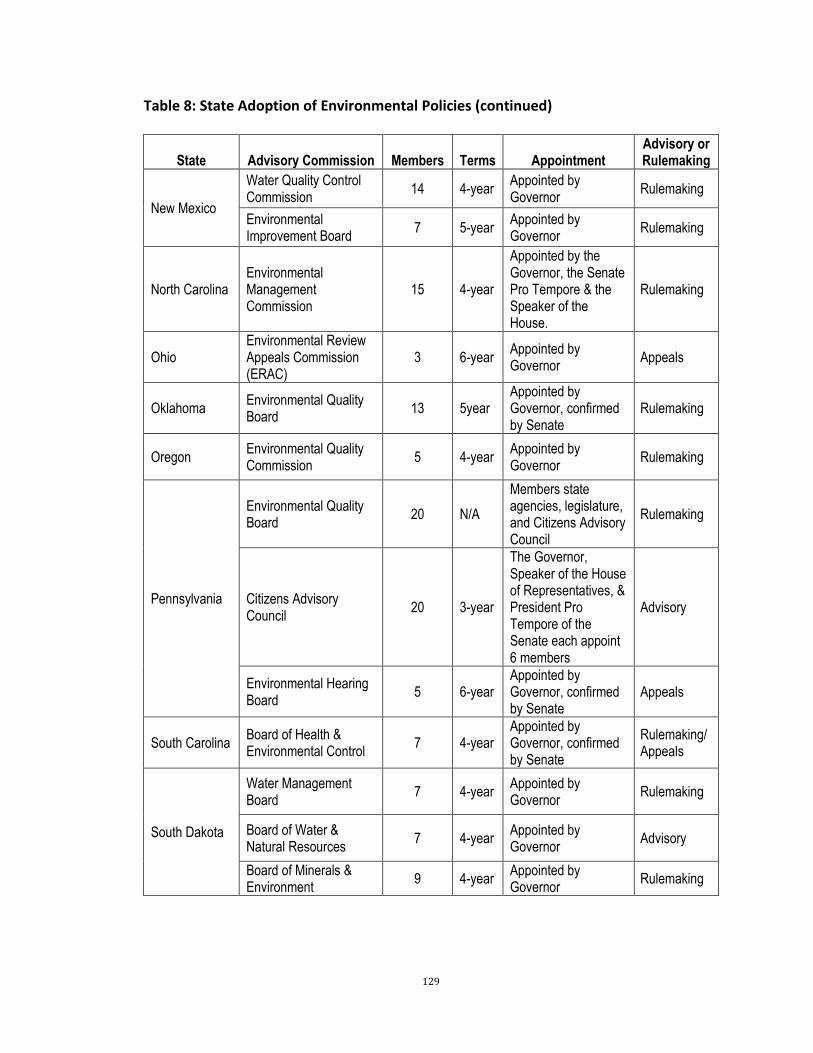
129
Table 8: State Adoption of Environmental Policies (continued)
State Advisory Commission Members Terms Appointment Advisory or Rulemaking
New Mexico
Water Quality Control Commission
14 4-year Appointed by Governor
Rulemaking
Environmental Improvement Board
7 5-year Appointed by Governor
Rulemaking
North Carolina Environmental Management Commission
15 4-year
Appointed by the Governor, the Senate Pro Tempore & the Speaker of the House.
Rulemaking
Ohio Environmental Review Appeals Commission (ERAC)
3 6-year Appointed by Governor
Appeals
Oklahoma Environmental Quality Board
13 5year Appointed by Governor, confirmed by Senate
Rulemaking
Oregon Environmental Quality Commission
5 4-year Appointed by Governor
Rulemaking
Pennsylvania
Environmental Quality Board
20 N/A
Members state agencies, legislature, and Citizens Advisory Council
Rulemaking
Citizens Advisory Council
20 3-year
The Governor, Speaker of the House of Representatives, & President Pro Tempore of the Senate each appoint 6 members
Advisory
Environmental Hearing Board
5 6-year Appointed by Governor, confirmed by Senate
Appeals
South Carolina Board of Health & Environmental Control
7 4-year Appointed by Governor, confirmed by Senate
Rulemaking/Appeals
South Dakota
Water Management Board
7 4-year Appointed by Governor
Rulemaking
Board of Water & Natural Resources
7 4-year Appointed by Governor
Advisory
Board of Minerals & Environment
9 4-year Appointed by Governor
Rulemaking
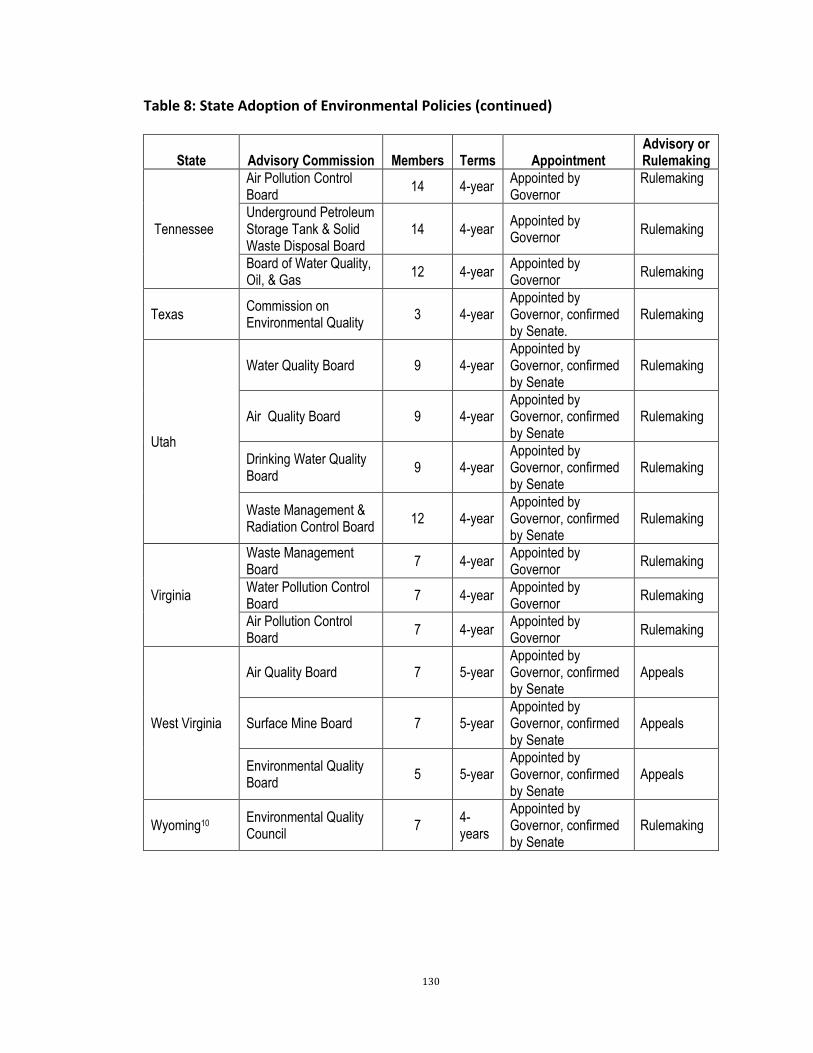
130
Table 8: State Adoption of Environmental Policies (continued)
State Advisory Commission Members Terms Appointment Advisory or Rulemaking
Tennessee
Air Pollution Control Board
14 4-year Appointed by Governor
Rulemaking
Underground Petroleum Storage Tank & Solid Waste Disposal Board
14 4-year Appointed by Governor
Rulemaking
Board of Water Quality, Oil, & Gas
12 4-year Appointed by Governor
Rulemaking
Texas Commission on Environmental Quality
3 4-year Appointed by Governor, confirmed by Senate.
Rulemaking
Utah
Water Quality Board 9 4-year Appointed by Governor, confirmed by Senate
Rulemaking
Air Quality Board 9 4-year Appointed by Governor, confirmed by Senate
Rulemaking
Drinking Water Quality Board
9 4-year Appointed by Governor, confirmed by Senate
Rulemaking
Waste Management & Radiation Control Board
12 4-year Appointed by Governor, confirmed by Senate
Rulemaking
Virginia
Waste Management Board
7 4-year Appointed by Governor
Rulemaking
Water Pollution Control Board
7 4-year Appointed by Governor
Rulemaking
Air Pollution Control Board
7 4-year Appointed by Governor
Rulemaking
West Virginia
Air Quality Board 7 5-year Appointed by Governor, confirmed by Senate
Appeals
Surface Mine Board 7 5-year Appointed by Governor, confirmed by Senate
Appeals
Environmental Quality Board
5 5-year Appointed by Governor, confirmed by Senate
Appeals
Wyoming10 Environmental Quality Council
7 4-years
Appointed by Governor, confirmed by Senate
Rulemaking

131
Many of the states with rulemaking boards originally housed their pollution
control functions in independent boards prior to consolidation of functions into one
department.
Table 13 below lists the summary statistics for the explanatory variables and the
expected influence on state scores on both policy adoption indices (Policy Adoption Index
and Dispersed Pollution Sources Index).
Table 13: Summary Statistics
Variable Expected Direction Mean
Standard Deviation Minimum Maximum
Environmental Severity Variables
TRI (total release per population)
(+) 32.005 109.258 0.267 1,450.000
Vehicle Miles (miles/year/population)
(+) 9.990 1.808 5.091 18.296
Water area (%) (+) 0.076 0.092 0.001 0.662
Surface water usage (billion gallons per day)
(+) 6.358 5.961 0.089 35.777
Groundwater usage (billion gallons per day)
(+) 1.511 2.467 0.025 15.395
System Resources Variables
Urbanization (%) (+) 0.713 0.148 0.322 0.950
Per capita income (per $10,000) (+) 29.041 9.241 11.685 59.687
Population (per 10,000) (+) 5.654 6.173 0.453 38.000
Size of a state (sq mile) (1000s) (+) 74.225 94.902 1.231 665.384
Fiscal Health (per $1,000,000) (+/-) 1.098 7.570 -140.703 66.998
Demand Variables
Manufacturing (%) (-) 0.150 0.066 0.018 0.315
Mining (%) (-) 0.029 0.061 0.000 0.397
Agriculture (%) (-) 0.018 0.020 0.001 0.126
Sierra Club (per 1000 residents) (+) 1.944 1.181 0.292 8.113
Citizen ideology (+) 50.707 15.051 8.450 95.972

132
Table 13: Summary Statistics (continued)
Variable Expected Direction Mean
Standard Deviation Minimum Maximum
Decision System
Adoption of Super-Agency Structure
(+/-) 0.364 0.481 0 1
Adoption of Mini-EPA Structure (+/-) 0.489 0.500 0 1
Adoption of Health Structure (+/-) 0.131 0.338 0 1
Adoption of other type of Structure
(-) 0.016 0.124 0 1
Board/Commission (+/-) 0.540 0.499 0 1
Government ideology (+) 50.540 27.001 0 99.167
Governor power (+) 3.448 0.426 2.300 4.700
Unified Government (+) 0.448 0.498 0 1
Legislative professionalism (+) 0.196 0.128 0.027 0.659
Legislative turnover (-) 0.214 0.278 0.000 2.161
Model 1: Policy Adoption Index Results
Overall, the theory of policy adoption is supported by the model, meaning the
environmental quality, system resources, demand for policies, and decisional system all
influence state adoption of environmental policies. In general, as well, the model
supports conclusions from previous studies of environmental policy adoption that more
liberal, wealthier states are more likely to adopt environmental policies. The results,
summarized in Table 14 below, support the model of policy adoption. While none of the
agency structure variables was statistically significant, the presence of a board reduced
the likelihood of adoption of these policies.
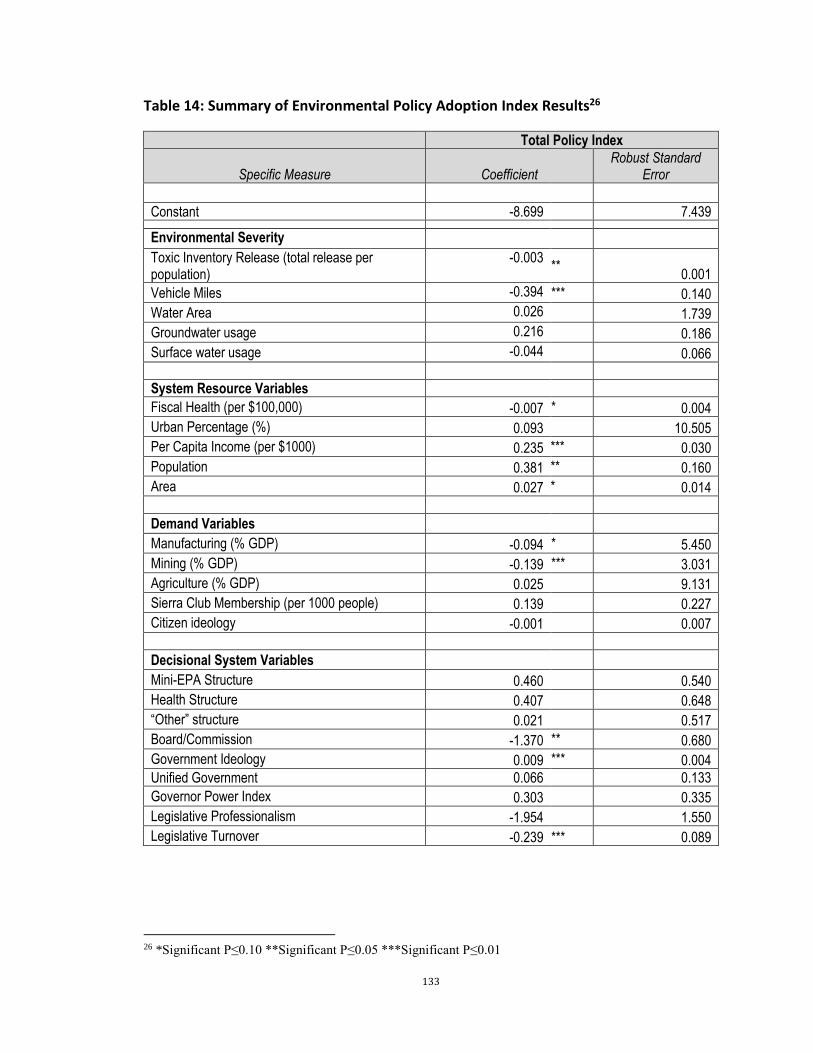
133
Table 14: Summary of Environmental Policy Adoption Index Results26
Total Policy Index
Specific Measure Coefficient Robust Standard
Error
Constant -8.699 7.439
Environmental Severity
Toxic Inventory Release (total release per population)
-0.003 **
0.001
Vehicle Miles -0.394 *** 0.140
Water Area 0.026 1.739
Groundwater usage 0.216 0.186
Surface water usage -0.044 0.066
System Resource Variables
Fiscal Health (per $100,000) -0.007 * 0.004
Urban Percentage (%) 0.093 10.505
Per Capita Income (per $1000) 0.235 *** 0.030
Population 0.381 ** 0.160
Area 0.027 * 0.014
Demand Variables
Manufacturing (% GDP) -0.094 * 5.450
Mining (% GDP) -0.139 *** 3.031
Agriculture (% GDP) 0.025 9.131
Sierra Club Membership (per 1000 people) 0.139 0.227
Citizen ideology -0.001 0.007
Decisional System Variables
Mini-EPA Structure 0.460 0.540
Health Structure 0.407 0.648
“Other” structure 0.021 0.517
Board/Commission -1.370 ** 0.680
Government Ideology 0.009 *** 0.004
Unified Government 0.066 0.133
Governor Power Index 0.303 0.335
Legislative Professionalism -1.954 1.550
Legislative Turnover -0.239 *** 0.089
26 *Significant P≤0.10 **Significant P≤0.05 ***Significant P≤0.01

134
The model explains 95 percent of the variance of the policy index and overall
supports the model of policy adoption described in the previous chapter. Of the
Environmental Severity variables, the toxic release inventory, vehicle miles, and water
area variables are statistically significant. States with greater toxic releases and more
vehicle miles travelled are less likely to adopt these environmental policies. The water
area of a state had the most significant effect on the Environmental Policy Adoption Index,
with a one-percentage increase in water area resulting in an increase in the expected
index of 2.57. States with more water as a percent of the total area are more likely to
adopt these policies. The System Resources that are statistically significant include per
capita income, population, and size of state. Larger, wealthier states are more likely to
adopt these environmental policies. An increase in population of one unit increases the
index by 0.381. The Demand variable that is statistically significant is mining as a percent
of GDP. States with greater reliance on mining are less likely to adopt these policies. Of
the Decision System variables, the presence of a rulemaking or advisory board,
government ideology, and legislative turnover were statistically significant. States with a
board or commission reduce their expected index by 1.370.
Discussion
In general, the results of the Environmental Innovativeness Index support the
theory of policy adoption, but they fail to identify an effect of agency structure.. This
section includes a general discussion of the results, while highlighting areas where the
model could be improved. Variables measuring each aspect of the Model of Policy
Adoption (described in Chapter 6) were statistically significant.

135
Environmental severity
As discussed above, environmental severity can be defined by environmental
quality and as a resource to protect. The measure included in these models, total toxic
releases to land, air, and water was statistically significant and negative. This result is
surprising, but may be explainable. The TRI measures large “smokestack” industry
releases, while these policies are directed at addressing more dispersed sources of
pollution. States that have large pollution releases may be focusing on developing policies
to address those releases, rather than the second and third generation pollution sources
included in this model. Bacot and Dawes (1997) found that TRI releases positively
influenced state environmental expenditures, but negatively affected state
environmental activism rankings (states that were more environmentally active as
measured by an index, will have lower levels of releases). In addition, Hoornbeek (2011)
also found that TRI had a negative effect on non-point source policy activism. It is also
possible that states with higher pollution levels face higher industry pressure and
economic concerns to reduce regulation.
The Vehicle Miles variable had a similar negative impact on policy activism. This
result was unexpected, given many of the policies relate to air emissions. If states were
responding to the level of environmental severity in the state, the relationship should be
positive. When examining the data more closely, those states that have the highest
vehicle miles per person are larger, more rural states, such as Wyoming, Mississippi, and
136
North Dakota. Likely, this variable is not exactly capturing levels of environmental
pollution.
System resources
As expected, generally states with more system resources are more likely to adopt
environmental policies. This result is consistent with the environmental policy literature.
Larger, wealthier and more populous states are more likely to adopt environmental
policies.
Demand
Only one demand variable is statistically significant: mining. States with a greater
reliance on mining were less likely to adopt these policies. The mining industry result is
consistent with the literature that has found that states with a greater dependence on
polluting industries will be less likely to adopt more aggressive or innovative policies.
Decisional system
One element of the decisional system of a state did have a statistically significant
influence on policy adoption. The presence of an advisory or rulemaking board had a
statistically significant negative effect on policy adoption. These boards often include a
diverse group of individuals, including representatives from industry, who may influence
the types of policies adopted by the agency. The board may just increase caution within
the agency and state itself.

137
The surprising result is that the agency structure itself did not have a significant
effect. My model differs from other models, in that I separate out Mini-EPA and Super-
Agency, but also I have included a category for other, which includes those states that
housed their pollution functions across a number of agencies. In addition, the policies
chosen may be less likely to be influenced by agency structure, since they address second
and third generation problems.
The variables measuring political uncertainty, legislative turnover and unified
government, were not statistically significant. The power of the governor’s office and
legislative professionalism were not statistically significant. Lester (1980), found that
states with a more professional legislature were more likely to adopt environmental
policies, while Hoornbeek (2011) found no statistically significant impact on policy
adoption.
Model 2: Dispersed Sources Index Results
As with the Policy Adoption Index Model, this model also supports the
Environmental Policy Adoption Model (described in Chapter 6). Elements of
environmental quality, system resources, demand for policies, and the decisional system
all influence state adoption of these seven dispersed sources policies. The results are
summarized in Table 15 below.

138
Table 15: Summary of Dispersed Sources Index Results27
Dispersed Sources Policy Index
Specific Measure Coefficient Standard Error
Constant 8.026 * 4.447
Environmental Severity
Toxic Inventory Release (total release per 10 million) -0.002
* 0.001
Vehicle Miles -0.692 *** 0.086
Water Area 0.031 *** 1.154
Groundwater usage -0.011 0.144
Surface water usage -0.090 0.058
System Resource Variables
Fiscal Health (per $100,000) -0.007 * 0.004
Urban Percentage (%) -0.094 6.201
Per Capita Income (per $1000) 0.201 *** 0.019
Population 0.244 * 0.135
Area 0.004 0.008
Demand Variables
Manufacturing (% GDP) -0.050 4.084
Mining (% GDP) -0.250 *** 3.182
Agriculture (% GDP) 2.495 5.542
Sierra Club Membership (per 1000 people) 0.119 0.173
Citizen ideology 0.006 0.006
Decisional System Variables
Mini-EPA Structure 0.134 0.299
Health Structure -0.108 0.331
“Other” structure 0.611 * 0.347
Board/Commission -1.217 *** 0.344
Government Ideology 0.010 *** 0.002
Unified Government 0.119 0.091
Governor Power Index 0.106 0.199
Legislative Professionalism 0.236 1.532
Legislative Turnover -0.026 0.061
27 *Significant P≤0.10 **Significant P≤0.05 ***Significant P≤0.01
139
The model explains 86 percent of the variance of the Dispersed Pollution Sources
Index. Of the Environmental Severity variables, the TRI, vehicle miles, and water area
variables are statistically significant. Again, water area has the most significant effect on
the index score with a one-percentage increase in water area resulting in an increase of
the Dispersed Pollution Sources Index of 0.031. States with more vehicle miles travelled
and greater toxic releases are less likely to adopt dispersed pollution source policies.
States with greater quantity of water are more likely to adopt these policies. The System
Resources that are statistically significant include PCI and population. Larger
(population), wealthier states are more likely to adopt these policies. Mining as a percent
of GDP is the only Demand variable that is statistically significant. A one-percentage
increase in mining as a percent of GDP results in a decrease of the Dispersed Pollution
Sources Index by 8.866. Of the Decision System variables, adoption of the “Other”
structure, the presence of a rulemaking or advisory board, government ideology were
statistically significant. Liberal states government are more likely to adopt these policies.
However, states with a board or commission and an “Other” structure are less likely to
adopt these policies. States with a board or commission have 1.217 lower expected
Dispersed Pollution Sources Index score.
Discussion
In general, the results of the Dispersed Pollution Sources Index support the theory
of policy adoption. This section includes a general discussion of the results, while
highlighting areas where the model could be improved. While many of the same factors
affected adoption of these specific policies, there were some clear differences in the
140
results between this model and the Policy Adoption Index model. Political characteristics
of a state were much more influential in adoption of these policies than in the Policy
Adoption Index.
Environmental severity
As in the Policy Adoption Index model, the level of toxic releases and the number
of vehicle miles travelled in a state had a statistically significant effect on policy adoption
and none of the resource variables were statistically significant. States with higher
number of vehicle miles and higher toxic releases were less likely to adopt polices
included in this index. This finding is consistent with the literature, in that states with
higher level of pollution tend to have lower policy adoption (A. H. Bacot & Dawes, 1997).
System resources
As in the Policy Adoption Index model, wealthier, more populous states are more
likely to adopt environmental policies. However, the physical size of the state does not
affect the adoption of these policies. These results are consistent with the environmental
policy adoption literature. As in the first model, states with poorer fiscal health were less
likely to adopt these policies. This result is also consistent with the literature.
Demand
The only demand variable that was statistically significant was mining as a percent
of GDP. States with a greater reliance on mining were less likely to adopt these policies,
as was found in the Policy Adoption Index. However, while manufacturing was

141
statistically significant in the first model, it does not have a statistically significant effect
on the adoption of the policies in the Dispersed Pollution Sources Index. Surprisingly,
given the type of policies included in this index, the ideology of the citizenry does not have
a statistically significant impact on adoption of the policies.
Decisional system
The decisional system of a state did have a statistically significant influence on
policy adoption. As with the Environmental Innovativeness Index, the presence of an
advisory or rulemaking board had a statistically significant negative effect on policy
adoption. However, states with an “Other” structure were more likely to adopt these
policies. This result is a little difficult to interpret because “Other” generally means that
the pollution functions are not housed in a single agency. Texas and California are good
examples of this “Other” structure as they did not consolidate their functions into a single
agency until the 1990s. States with more liberal governments are more likely to adopt
environmental policies overall, which again seems logical.
Conclusion
Does agency structure affect policy adoption? Ultimately, this analysis shows that
bureaucratic structure matters. Organizational theorists argue that structure defines the
goals pursued and policy choices preferred. This section highlights a few key points from
the analysis, highlights where the model could be improved, and identifies future
research to build on the analysis in this paper.
142
Advisory/Rulemaking Board
One of the most interesting results, was the significant influence that an advisory or
rulemaking board can have on policy adoption. None of the previous studies of
environmental agency structure included a measure of the presence of a board. The
literature on the role of boards and commissions on policy adoption at the state level is
very limited and non-existent in environmental policy literature. However, other studies
of structure have found that this type of a board can affect agency outcomes (Knott &
Payne, 2004; Meier, 1980; Mitchell, 1997). Often these boards are created as a way to
protect a political priority against future uncertainty (Volden, 2002). Meier (1980) found
that departmental regulatory agencies tend to be more supportive of regulation than
independent regulatory commissions. Agencies have larger budgets and more
decentralization than a regulatory commission. Therefore, they are more flexible to
adopt new policies. In addition, studies have found that boards can tend to serve
particular interests (Mitchell, 1997). Depending on the members of the board, a board
could be influenced by interests that are resistant to policy adoption. In higher education
literature, states with more centralized boards have lower tuition and overall costs (Knott
& Payne, 2004). In addition, just having to find an agreement among the diverse interests
represented on the board could be challenging, leading to no new policies being adopted.
These boards vary significantly across states, with some having more power to manage
the agency and others acting strictly in a support capacity. The diversity of these boards
and the influence over time would be a very interesting area for future research. Many

143
of these boards began as stand-alone agencies and their role and place in the hierarchy
has changed over time
Agency Structure
Based on these analyses, the structure of an agency does not significantly affect adoption
of these environmental policies. The only structure variable that had a statistically
significant affect was the “Other” structure. This result is interesting, given that previous
studies found that both Mini-EPA and Super-Agency structures facilitated policy adoption
(A. Bacot & Dawes, 1996). It would be interesting to see what effect structure has on
more traditional first-generation pollution policies, such as air or water emissions levels.
Environmental Severity
The two environmental severity measures had an opposite effect on policy
adoption than was expected. States with more vehicle miles driven (and assumed higher
levels of vehicle emissions) and higher levels of toxic releases (air, land, and water) were
less likely to adopt these policies. It is unclear if this result is because the variable is not
the best measure of the type of environmental pollution problems these policies are
developed to address, or if states with higher levels of pollution are less likely to adopt
innovative policies. States with higher levels of pollution could be less likely to adopt
innovative policies due to economic pressure from industry groups.
144
Improvements to Analysis
This empirical model could be improved with additional variables, better
measures of certain variables, and a more detailed typology of agency structure. In
addition, the model only measures internal characteristics of a state, and does not
account for horizontal or vertical influences on state policy adoption. The models capture
between 78 and 88 percent of the variation in the indices; it is likely that external
influences would capture that missing variation. Future analysis could use event history
models to examine each individual policy to evaluate the role of diffusion in adoption of
these policies.
Variables
While the model performed relatively well, there are a few variables that could be
improved upon to better measure the characteristics of a state in the model. Those
variables include environmental quality, environmental group pressure, and citizen
political preference for environmental policy.
Environmental Quality: Finding a consistent, relevant measure of environmental
quality for this time period is a challenge. The TRI and vehicle measure was
negatively significant in the models. Perhaps a measure that addresses the type
of pollutants these policies are addressing would enhance the model.
Environmental Group Pressure: As stated above, the Sierra Club membership
variable is only capturing one aspect of environmental group participation, and
inclusion of member data from additional national or local groups would better
capture this characteristic of the Demand.

145
Typology
The model relies on the generally accepted typology in the literature for
environmental agency structure. However, this typology may not be the most accurate
way to capture agency structure. This typology does not completely account for the role
of a rulemaking board, may oversimplify the diversity of the Super-Agency category, and
may not reflect the competing priorities within the agencies. I have added the presence
of an advisory or rulemaking board into the model, an addition that no previous study has
included. A more accurate typology would label agencies with a rulemaking board as a
type of hybrid-agency because of the strength of the board. The way my model currently
captures the board combines advisory and regulatory boards together. I assume that
each type of board would have a different impact on policy adoption. The “Super-
Agency” category can include combined functions of agriculture, energy, or natural
resources which all could have different impacts on policy outcomes. Both Massachusetts
and Connecticut have added a division of energy to their Super-Agency in the past five
years.
While the USEPA, has divisions focused on air quality, radiation protection,
hazardous waste prevention, solid waste, and water quality (includes drinking water,
surface water, coastal water, and groundwater), states’ Mini-EPA agencies can include
additional functions. For example, while the Montana Department of Environmental
Quality regulates mines in that state, the Iowa Department of Agriculture regulates mines
within its borders. Figure 15 below lists the state agencies that can house some or all of

146
related functions. The various functions related to environmental protection and the
state agencies that house these various functions.
Figure 15: Types of Agencies and Functions
Some of these functions in the diagram are environmental protection functions,
while others are related to environmental protection and often combined in super
agencies. The initial focus of state governments was on air quality and water quality.
However, as these agencies matured, new issues arose, and the federal government
passed more environmental laws, the focus began to expand. Each state has combined
these functions into its own state structure based on its goals and needs.

147
CHAPTER 8: SUMMARY, CONCLUSIONS, RESEARCH PROSPECTS
“They (political institutions) arise out of a politics of structural choice in which the winners
use their temporary hold on public authority to design new structures and impose them
on the polity as a whole. These structures are simply vehicles by which they pursue their
own interest, often at the expense of losers” (Moe, 1990a).
Rational organizational theorists argued that public bureaucracies should be
designed efficiently to meet the regulatory mission of the agency (Gulick, 1937; Taylor,
1911; Weber, 1922). However, as Moe (1990a) argued, in practice, the design of public
bureaucracies is a political exercise to achieve political goals. This dissertation set out to
answer two main questions in terms of the design of state pollution prevention agencies:
1. How are the agencies designed?
2. What is the impact of that design on policy adoption?
Following the introduction and historical overview, the dissertation is designed
around answering the two main questions above. Chapter 3 develops a theory of state
administrative agency adoption based on organizational and political literature.
Chapters 4 and 5 empirically test this theory to understand why states adopted a
comprehensive environmental agency and then more specifically why a state would
adopt either a Super-Agency or Mini-EPA structure. Chapter 6 develops a theory of state
adoption of environmental policies and Chapter 7 uses that theory to empirically examine
what role agency structure plays in environmental policy adoption. This conclusion
reviews the general findings of the dissertation, policy implications of the findings, and
limitations of the analyses and potential future research directions.

148
Dissertation Summary
Bureaucratic structure does matter. Because structure affects agency outcomes,
the design of agencies is a political exercise. Governors and legislators have designed
state environmental agencies to either aggressively reduce pollution within a state, or
“balance” pollution prevention with economic and recreational interests within a state.
In addition, in accordance with organizational theory, state environmental and health
agencies responded to changes in the organizational environment. As states faced
greater administrative responsibilities from the USEPA and from the Medicare and
Medicaid programs, the conflicting missions required an organizational change. Finally,
environmental programs were redesigned as part of a larger push to create a more
professional, competent and efficient state government. Table 16 below provides a
summary of policy adoption by state, agency structure type, and year that state
consolidated their pollution control functions outside of the department of health. In
addition, the table lists what percentage of the total index each individual type of policies
comprises.
Table 16: Summary of Policy Adoption, Agency Structure, and Consolidation Year
State Structure Structure Adopted Innovation Index
Maine Mini-EPA 1972 12
New Jersey Super-Agency 1970 12
Pennsylvania Mini-EPA 1970 12
Oregon Mini-EPA 1969 12
Virginia Mini-EPA 1993 11
New Hampshire Mini-EPA 1987 11
Washington Super-Agency 1970 11

149
Table 16: Summary of Policy Adoption, Agency Structure, and Consolidation Year (continued)
State Structure Structure Adopted Innovation Index
New York Super-Agency 1970 10
North Carolina Super-Agency 1971 10
California Mini-EPA 1991 10
Connecticut Super-Agency 1971 10
Illinois Mini-EPA 1970 10
Indiana Mini-EPA 1986 10
Minnesota Mini-EPA 1967 10
Utah Mini-EPA 1991 10
Vermont Super-Agency 1969 10
West Virginia Mini-EPA 1989 9
New Mexico Mini-EPA 1991 9
Rhode Island Mini-EPA 1978 9
Colorado Health N/A 9
Hawaii Health N/A 9
Maryland Mini-EPA 1987 9
Massachusetts Super-Agency 1975 9
Texas Mini-EPA 1993 9
Wisconsin Super-Agency 1967 9
Delaware Super-Agency 1969 8
Michigan Super-Agency 1973 8
Florida Mini-EPA 1969 8
Iowa Super-Agency 1972 8
Montana Super-Agency 1995 8
Ohio Mini-EPA 1972 8
Missouri Mini-EPA 1974 7
South Carolina Health N/A 7
Tennessee Super-Agency 1991 7
Arkansas Mini-EPA 1971 6
Georgia Super-Agency 1972 6
Louisiana Mini-EPA 1979 6
Oklahoma Mini-EPA 1993 6
North Dakota Health N/A 5
Alabama Mini-EPA 1982 5
Arizona Mini-EPA 1987 5
Kentucky Super-Agency 1972 5
South Dakota Super-Agency 1973 4
Idaho Mini-EPA 2000 4

150
Table 16: Summary of Policy Adoption, Agency Structure, and Consolidation Year (continued)
State Structure Structure Adopted Innovation Index
Kansas Health N/A 4
Mississippi Mini-EPA 1978 4
Nevada Super-Agency 1973 4
Alaska Mini-EPA 1971 2
Wyoming Mini-EPA 1973 2
Looking at the data in the table above, of those states that adopted 10 or more
policies, approximately 56 percent use the Mini-EPA structure and adopted that structure
prior to 1975. There are also two states with their pollution prevention functions within
the department of health that have adopted at least 10 of the policies.
Policy Implications
There are two primary policy implications of the research in this dissertation:
aspects of bureaucratic structure matters and its design is influenced by more than
efficiency or politics. While the political pressure to respond to environmental pollution
did drive states to consolidate their pollution control functions into a single agency,
additional administrative pressures also strongly influenced agency design. While
initially, many governors pushed for a single agency as a political statement in support of
environmental protection or political control over unaffiliated boards (Haskell & Price,
1973), many agencies also developed out of statewide restructuring efforts.
The structures of state environmental agencies did not have a statistically
significant impact on policy adoption. However, the more consistent influence on policy

151
adoption was the presence of an advisory or rulemaking board. This board is a significant
influence on policy adoption across agency types and seems to reduce policy adoption.
While the analysis does not differentiate between rulemaking and advisory or inclusion
of politicians versus experts on the board, the role of this board should not be
underestimated.
Limitations and Future Research
The empirical analysis provide interesting insight into the development of
bureaucratic structure at the state level and the impact that structure has on policy
adoption. However, there are a few primary limitations and areas where the analysis
could be enhanced and expanded upon in the future.
The analyses are limited by the lack of consistent, reliable measure of many of the
primary variables for the entire time period. It is difficult to ascertain how environmental
quality has impacted state adoption of environmental agency structure, and whether
states that faced high levels of pollution were more or less likely to adopt a
Comprehensive Structure. In addition, while anecdotally we know that the growth in
membership and activity of environmental groups influenced state politicians, without a
strong measure of this membership for the entire time period, this influence cannot be
estimated.
In addition, the dissertation relies on the accepted typology in the literature of
Health, Mini-EPA, and Super-Agency. However, as is clear from the impact of the
board/commission variable, there is additional variation in structure across states that

152
may be captured more accurately in a better typology. It may be that structure does play
more of a role in policy adoption than is estimated using this typology. The typology used
in this analysis is a very high-level classification that may not capture the variety across
states. For example, my typology includes in the Super-Agency classification those states
with and without a secretariat system. It is likely these two types of Super-Agencies
actually function very differently and the pollution department within the Secretariat
system has much more autonomy than within the other types of systems.
Finally, the policy adoption model is an internal determinants model and does not
measure external influences on policy adoption. The analysis included in Chapter 7 uses
policy indices to measure levels of policy activism within a state. An event history
analyses could help capture the role of the external influences on policy adoption. The
trade-off between the model used here and the event history analysis is between
capturing external influences and measuring policy adoption of specific policies and
overall levels of policy activism.

153
APPENDIX A: STATE ENVIRONMENTAL AGENCY STRUCTURE HISTORIES
Appendix A includes, for each state, executive branch organizational charts that summarize all
the following agencies within each state: health, environmental, natural resources,
conservation, welfare, energy-related, and agricultural. In addition, this appendix includes a
diagram that shows the flow and development of each states’ environmental pollution
programs through the various agencies to the current structure. Below is a key to the diagrams.
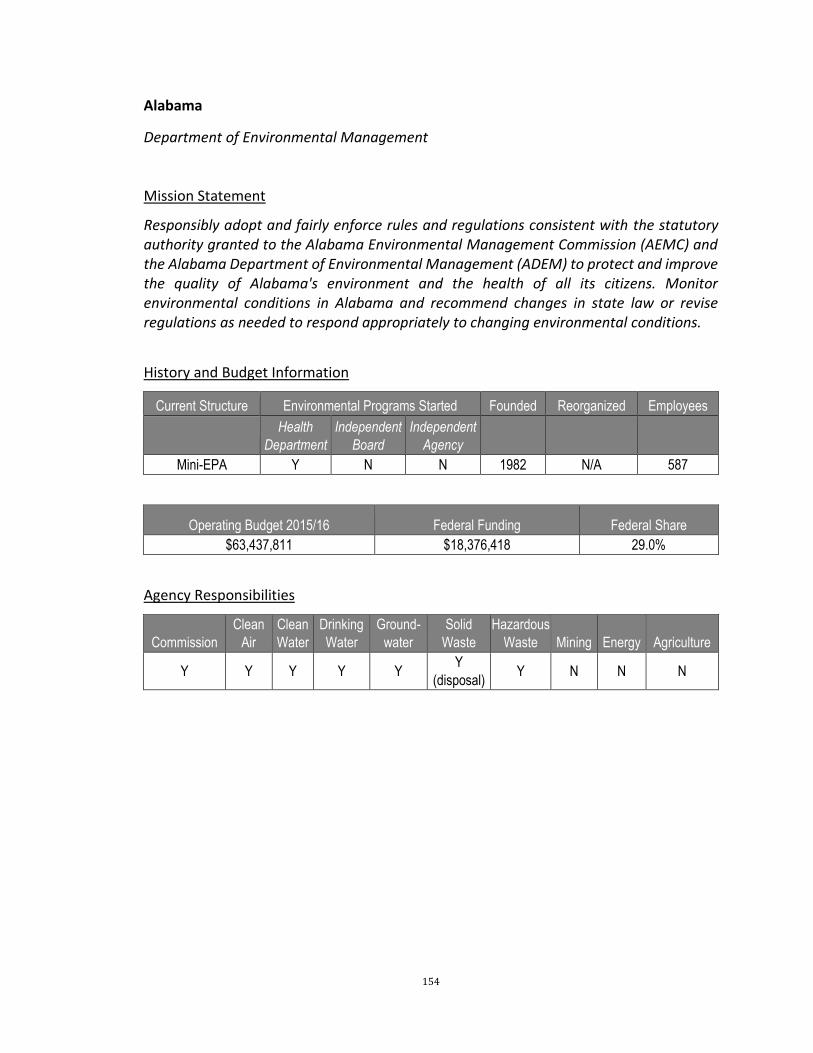
154
Alabama
Department of Environmental Management
Mission Statement
Responsibly adopt and fairly enforce rules and regulations consistent with the statutory authority granted to the Alabama Environmental Management Commission (AEMC) and the Alabama Department of Environmental Management (ADEM) to protect and improve the quality of Alabama's environment and the health of all its citizens. Monitor environmental conditions in Alabama and recommend changes in state law or revise regulations as needed to respond appropriately to changing environmental conditions.
History and Budget Information
Current Structure Environmental Programs Started Founded Reorganized Employees
Health
Department
Independent
Board
Independent
Agency Mini-EPA Y N N 1982 N/A 587
Operating Budget 2015/16 Federal Funding Federal Share
$63,437,811 $18,376,418 29.0%
Agency Responsibilities
Commission
Clean
Air
Clean
Water
Drinking
Water
Ground-
water
Solid
Waste
Hazardous
Waste Mining Energy Agriculture
Y Y Y Y Y Y
(disposal) Y N N N

155
Alabama
Department of Environmental Management
Governor
Land
Department of Conservation & Natural
Resources
Department of Economic
& Community
Affairs
Office of Water
Resources
Wild & Freshwater
Fisheries
Marine Resources
State Parks
State Land
Air
Water
Agriculture & Industries
Commissioner
Department of Agriculture
Board of Health
State Committee of
Health
Department of Public Health
State Geologist
Geological Survey
Oil & Gas Board
Public Utilities
Commission
Surface Mining
Commission
Department of Human Resources
Department of Public Health (1982)
Water Improvement Commission (1947)
Water Improvement Commission (1971)Air Pollution Control Commission (1971)
Environmental Management Commission
Alabama
Department of Public Health (1971)
Department of Environmental Management (1982)
Board of Certification of Water and Wastewater
Systems Personnel
Water Wells and Standards Board (1971)
Coastal Area Board
(1976-1979)
Department of Public Health
Board of Public Health (1875)
Water Improvement Commission (1966) Department of Public HealthDepartment of Public Health (1966)
Department of Mental Health
(1965)
Medicaid Services (1977)
Medicaid Agency (1981)
Department of Public Health (1971)
Department of Public Health
Department of Public Health (1966)

156
Alaska
Department of Environmental Conservation
Mission Statement
To conserve, improve, and protect its natural resources and environment and control
water, land, and air pollution, in order to enhance the health, safety, and welfare of the
people of the state and their overall economic and social well-being.
History and Budget Information
Current Structure Environmental Programs Started Founded Reorganized Employees
Health
Department
Independent
Board
Independent
Agency Mini-EPA Y N N 1971 N/A 511
Operating Budget 2015/16 Federal Funding Federal Share
$ 85,353,600 $ 2,362,890 27.7%
Agency Responsibilities
Commission
Clean
Air
Clean
Water
Drinking
Water
Ground-
water
Solid
Waste
Hazardous
Waste Mining Energy Agriculture
N Y Y N Y Y Y N N N
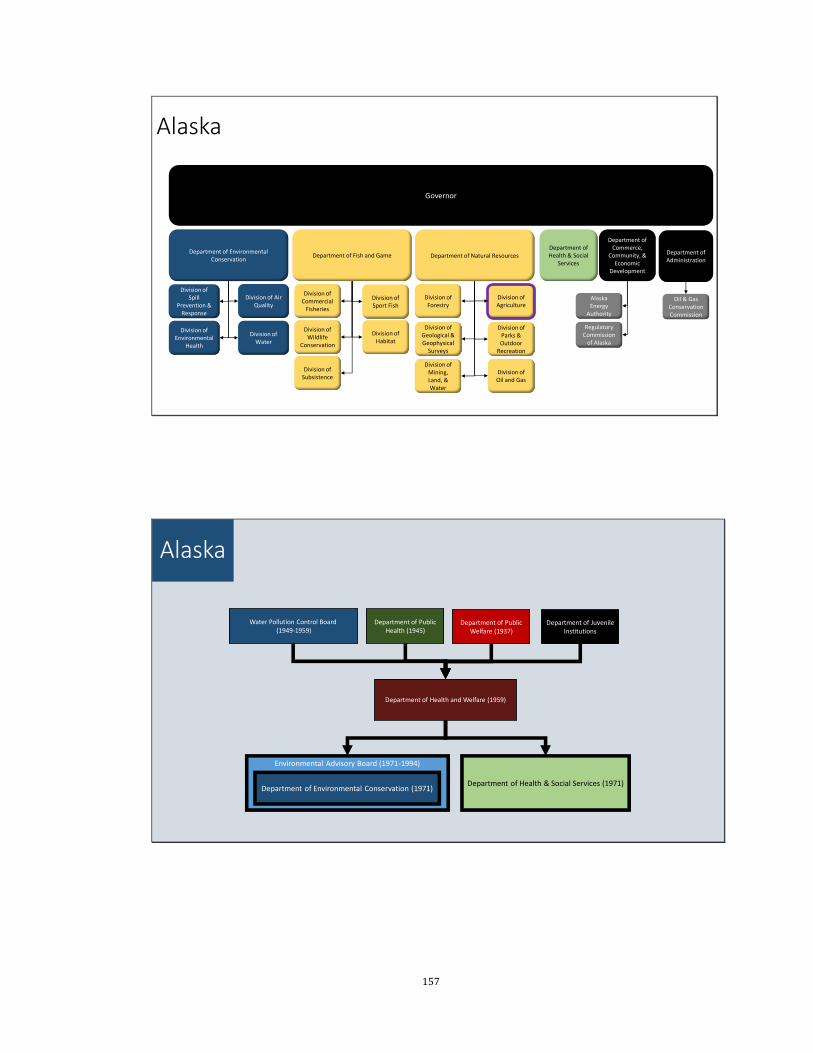
157
Alaska
Department of Environmental Conservation
Governor
Division of Water
Division of Air Quality
Department of Fish and Game Department of Natural ResourcesDepartment of Health & Social
Services
Department of Commerce,
Community, & Economic
Development
Alaska Energy
Authority
Regulatory Commission
of Alaska
Division of Parks & Outdoor
Recreation
Division of Oil and Gas
Division of Mining, Land, & Water
Division of Geological & Geophysical
Surveys
Division of Forestry
Division of Agriculture
Division of Habitat
Division of Wildlife
Conservation
Division of Commercial
Fisheries
Division of Sport Fish
Division of Subsistence
Division of Spill
Prevention & Response
Division of Environmental
Health
Department of Administration
Oil & Gas Conservation Commission
Environmental Advisory Board (1971-1994)
Alaska
Department of Health and Welfare (1959)
Department of Environmental Conservation (1971)Department of Health & Social Services (1971)
Water Pollution Control Board(1949-1959)
Department of Public Health (1945)
Department of Public Welfare (1937)
Department of Juvenile Institutions

158
Arizona
Department of Environmental Quality
Mission Statement
DEQ's goal is to lead Arizona and the nation in protecting and enhancing the
environment and improving the quality of life for the people of our state. The agency
helps Arizonans respect the balance between the natural world and the people who
depend on it for sustenance, prosperity and a fulfilling quality of life.
History and Budget Information
Current Structure Environmental Programs Started Founded Reorganized Employees
Health
Department
Independent
Board
Independent
Agency
Mini-EPA Y N N 1987 N/A 612
Operating Budget 2015/16 Federal Funding Federal Share
$ 129,268,000 $ 15,204,000 11.8%
Agency Responsibilities
Commission
Clean
Air
Clean
Water
Drinking
Water
Ground-
water
Solid
Waste
Hazardous
Waste Mining Energy Agriculture
N Y Y Y Y Y Y N N N

159
Arizona
Department of Environmental Quality
Governor
Department of Game and Fish
Department of Water
Resources
Department of Health Services
Department of
Agriculture
State Mine Inspector
State Parks Board
Regulated Storage Tanks
Division
Solid Waste Management
Division
Hazardous Waste Division
Air Division
Water DivisionMining Division
Colorado River
Water Planning
Surface Water
Division
Department of Economic
Security
Department of Child Safety
Air Pollution Control Hearing Board (1967-2005)Water Quality Control Council (1967)
Air Pollution Control Hearing Board (1967)Water Quality Control Council (1967)
Air Pollution Control Hearing Board (1967)Water Quality Control Council (1967)
Arizona
Department of Health (1940)
Department of Environmental Conservation (1987)
Board of Health (1903)
Department of Health Services (1974)
Department of Health Services (1987)

160
Arkansas
Department of Environmental Quality
Mission Statement
We protect, enhance and restore the natural environment for the well-being of all
Arkansans.
History and Budgetary Information
Current Structure Environmental Programs Started Founded Reorganized Employees
Health
Department
Independent
Board
Independent
Agency Mini-EPA Y N N 1971 N/A 337
Operating Budget 2015/16 Federal Funding Federal Share
$ 102,927,734 $ 18,626,685 18.1%
Agency Responsibilities
Commission
Clean
Air
Clean
Water
Drinking
Water
Ground-
water
Solid
Waste
Hazardous
Waste Mining Energy Agriculture
Y Y Y N N Y Y Y N N

161
Arkansas
Department of Environmental Quality
Governor
Natural Resources Commission
Department of Health
Department of Agriculture
Department of Parks & Tourism
Economic Development Commission
Energy Office
Surface Mining &
Reclamation Division
Solid Waste Management
Division
Hazardous Waste Division
Air Division
Water Division
Water Resources
Management
Water Resources
Development
Conservation Management
Department of Human Services
Arkansas Control and Ecology Commission
Arkansas Control and Ecology Commission
Water Pollution Control Commission (1949)
Arkansas Department of Health (1949)
Pollution Control Commission (1965)
Department of Pollution Control and Ecology (1971)
Department of Environmental Quality (1999)
Department of Human Services (1977)
Department of Health & Human Services (2005)
Department of Human Services (2007)Department of Health (2007)
Department of Health (1965)
Department of Social and Rehabilitative
Services (1971)

162
California
Environmental Protection Agency
Mission Statement
To restore, protect, and enhance the environment, to ensure public health,
environmental quality, and economic vitality
History and Budgetary Information
Current Structure Environmental Programs Started Founded Reorganized Employees
Health
Department
Independent
Board
Independent
Agency Mini-EPA N Y N 1991 N/A 5810
Operating Budget 2015/16 Federal Funding Federal Share
$ 4,285,033,000 N/A N/A
Agency Responsibilities
Commission
Clean
Air
Clean
Water
Drinking
Water
Ground-
water
Solid
Waste
Hazardous
Waste Mining Energy Agriculture
Y Y Y Y Y Y Y N N N

163
California
Environmental Protection Agency
Governor
Natural Resources Agency Health and Human Services Agency
Department of Food & Agriculture
Air Resources Board
Dept. of Resources
Recycling & Recovery
Dept. of Toxic Substances
State Water Resources
Board
Dept. of Pesticide
Regulation
Department of Fish & Wildlife
State Lands Commission
Department of Conservation
Public Utilities Commission
Office of Environmental Health Hazard
Assessment
Department of Water
Resources
Department of Parks &
Recreation
California Energy
Commission
Department of Forestry & Fire
Protection
State Water Rights Board (1956)Water Quality Control Board
Water Resources Control BoardAir Resources Board
Resources Agency (1961)
California Water Pollution Control Board (1949)
Environmental Protection Agency (1991)
State Water Board (1913)
Air Resources Board (1967)
Secretary of Environmental Affairs
(1981)
Department of Conservation
State Water Rights Board (1956)
Water Quality Control Board
Department of Water Resources (1956)
Parks & Recreation Department
Fish & Game Department
Department of Social Welfare
Department of Mental Hygiene
Health and Welfare Agency (1961)
Health & Human Services Agency (1999)
Board of Health (1870)
Department of Health Services
Natural Resources Agency (2009)
Resources Agency (2009)
Department of Health (1949)
Department of Social Welfare

164
Colorado
Department of Public Health and Environment
Mission Statement
The mission of the Colorado Department of Public Health and Environment is to protect and improve the health of Colorado’s people and the quality of its environment.
History and Budgetary Information
Current Structure Environmental Programs Started Founded Reorganized Employees
Health
Department
Independent
Board
Independent
Agency Health Y N N N/A N/A 1276
Operating Budget 2015/16 Federal Funding Federal Share
$ 548,628,367 $ 292,816,022 53%
Agency Responsibilities
Commission
Clean
Air
Clean
Water
Drinking
Water
Ground-
water
Solid
Waste
Hazardous
Waste Mining Energy Agriculture
N Y Y Y Y Y Y N N N

165
Colorado
Department of Public Health and Environment
Governor
Department of Regulatory
AgenciesAgricultureDepartment of Natural Resources
Department of Labor &
Employment
Water Quality Control Division
Division of Oil & Public Safety
Hazardous Materials &
Waste Management
Division
Air Pollution Division
Public Utilities Commission
Division of Reclamation, Mining
& Safety
Colorado Geological Survey
Colorado Oil & Gas Conservation
Water Conservation Board
State Board of Land Commissioners
Division of Water Resources
Division of Parks & Wildlife
Department of Human Services
Water Quality Control Commission (1966)Air Quality Control Commission (1977)
Hazardous Waste Commission (1992-2006)Solid & Hazardous Waste Commission (2006)
Colorado
Department of Public Health and Environment (1993)
Water Quality Control Commission (1966)Air Pollution Control Commission (1970-1977)
Air Quality Control Commission (1977)
Board of Health (1877)
Department of Health (1967)
Department of Human Services (1993)
Department of Social Services & Institutions
(1967)
Department of Public Welfare
Department of Rehabilitation
Commission on Aging
Department of Veterans Affairs
Department of Health Care Policy and Financing (1993)

166
Connecticut
Department of Energy and Environmental Protection
Mission Statement
Charged with conserving, improving and protecting the natural resources and the environment of the state of Connecticut as well as making cheaper, cleaner and more reliable energy available for the people and businesses of the state. The agency is also committed to playing a positive role in rebuilding Connecticut’s economy and creating jobs – and to fostering a sustainable and prosperous economic future for the state. History and Budgetary Information
Current Structure Environmental Programs Started Founded Reorganized Employees
Health
Department
Independent
Board
Independent
Agency
Super-Agency N Y N 1971 2011 1022
Operating Budget 2015/16 Federal Funding Federal Share
$169,630,775 $35,434,518 20.9%
Agency Responsibilities
Commission
Clean
Air
Clean
Water
Drinking
Water
Ground-
water
Solid
Waste
Hazardous
Waste Mining Energy Agriculture
Y Y Y Y Y Y Y N Y N
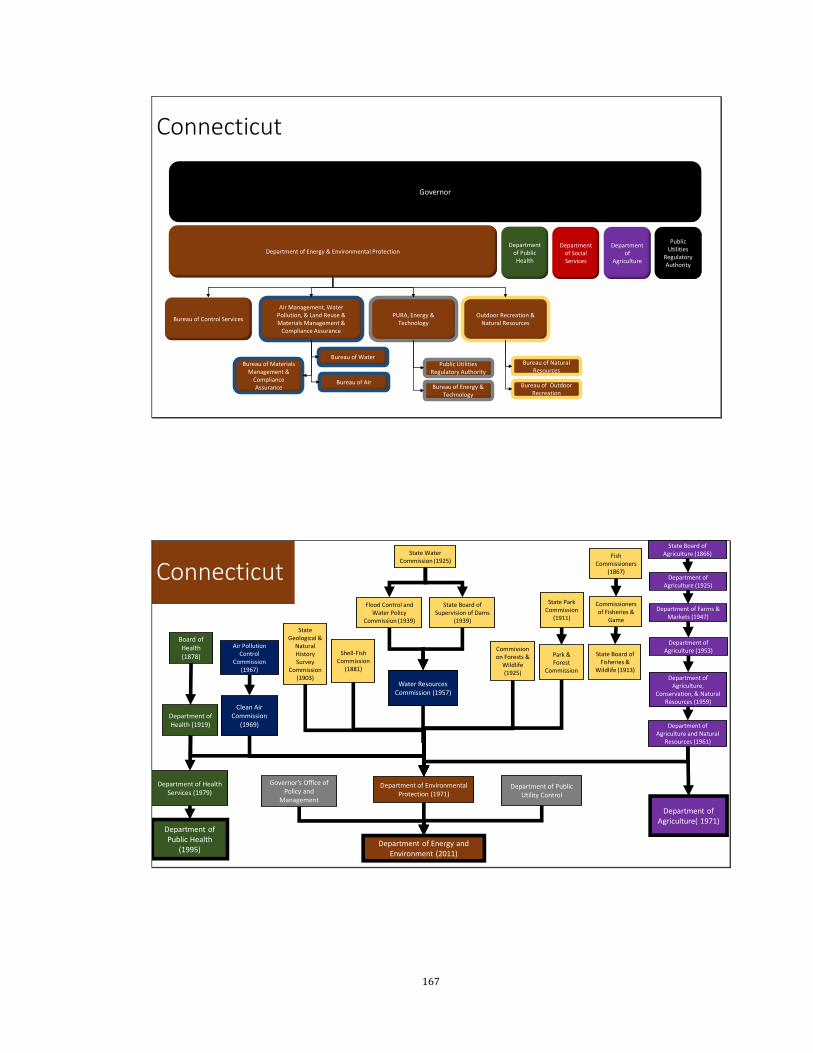
167
Connecticut
Department of Energy & Environmental Protection
Governor
Public Utilities
Regulatory Authority
Department of
Agriculture
Department of Public Health
Air Management, Water Pollution, & Land Reuse & Materials Management &
Compliance Assurance
PURA, Energy & Technology
Outdoor Recreation & Natural Resources
Bureau of Control Services
Bureau of WaterBureau of Materials
Management & Compliance Assurance
Bureau of Air
Bureau of Natural Resources
Bureau of Outdoor Recreation
Public Utilities Regulatory Authority
Bureau of Energy & Technology
Department of Social Services
Connecticut
Water Resources Commission (1957)
Department of Environmental Protection (1971)
State Water Commission (1925)
Flood Control and Water Policy
Commission (1939)
State Board of Supervision of Dams
(1939)
Department of Energy and Environment (2011)
Department of Public Utility Control
Governor’s Office of Policy and
Management
Park & Forest
Commission
Commission on Forests &
Wildlife (1925)
Shell-Fish Commission
(1881)
State Geological &
Natural History Survey
Commission (1903)
Clean Air Commission
(1969)
State Park Commission
(1911)
State Board of Fisheries &
Wildlife (1913)
Fish Commissioners
(1867)
Commissioners of Fisheries &
Game
Air Pollution Control
Commission (1967)
Board of Health (1878)
Department of Health (1919)
State Board of Agriculture (1866)
Department of Agriculture (1925)
Department of Farms & Markets (1947)
Department of Agriculture (1953)
Department of Agriculture( 1971)
Department of Agriculture,
Conservation, & Natural Resources (1959)
Department of Agriculture and Natural
Resources (1961)
Department of Public Health
(1995)
Department of Health Services (1979)
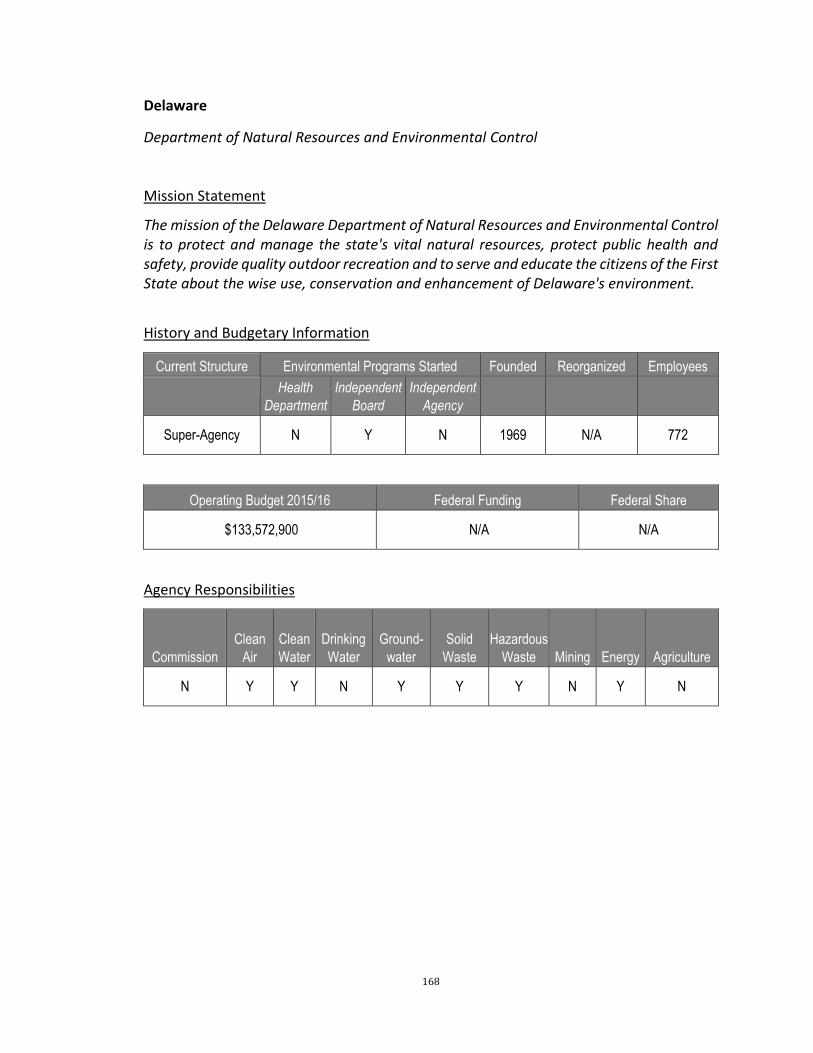
168
Delaware
Department of Natural Resources and Environmental Control
Mission Statement
The mission of the Delaware Department of Natural Resources and Environmental Control is to protect and manage the state's vital natural resources, protect public health and safety, provide quality outdoor recreation and to serve and educate the citizens of the First State about the wise use, conservation and enhancement of Delaware's environment.
History and Budgetary Information
Current Structure Environmental Programs Started Founded Reorganized Employees
Health
Department
Independent
Board
Independent
Agency
Super-Agency N Y N 1969 N/A 772
Operating Budget 2015/16 Federal Funding Federal Share
$133,572,900 N/A N/A
Agency Responsibilities
Commission
Clean
Air
Clean
Water
Drinking
Water
Ground-
water
Solid
Waste
Hazardous
Waste Mining Energy Agriculture
N Y Y N Y Y Y N Y N
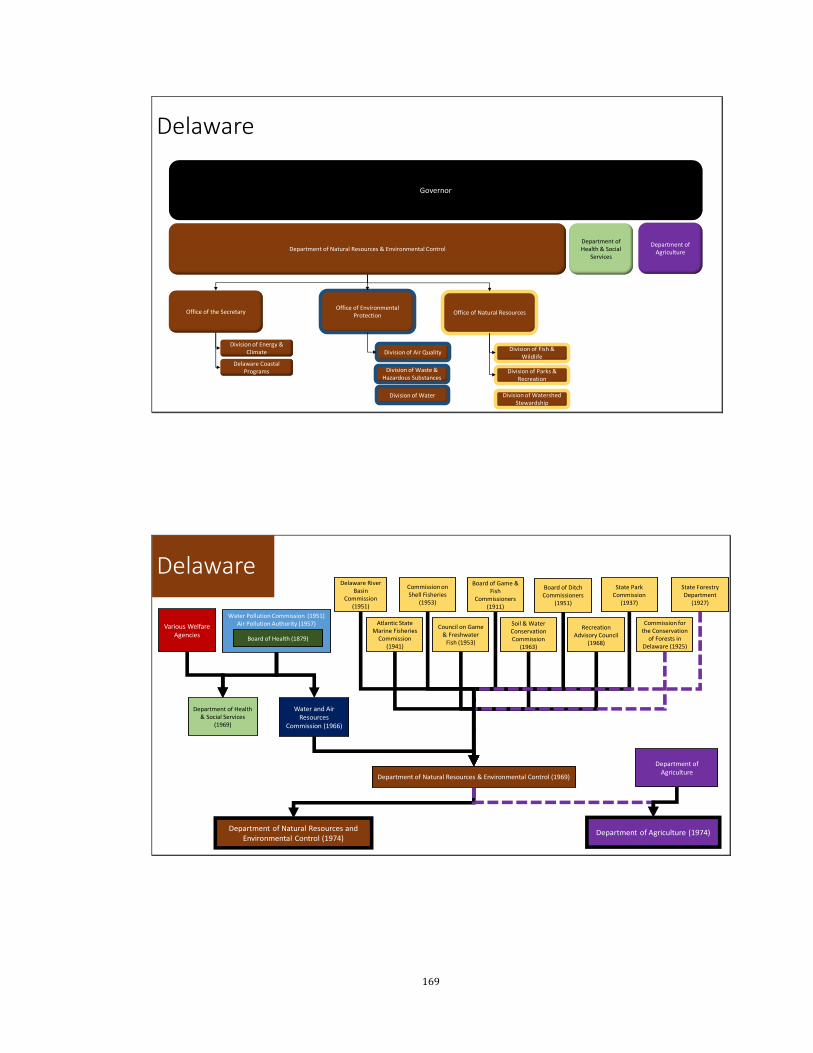
169
Delaware
Governor
Department of Agriculture
Department of Health & Social
ServicesDepartment of Natural Resources & Environmental Control
Office of the Secretary Office of Natural ResourcesOffice of Environmental
Protection
Division of Energy & Climate
Delaware Coastal Programs
Division of Fish & Wildlife
Division of Parks & Recreation
Division of Air Quality
Division of Waste & Hazardous Substances
Division of Water Division of Watershed Stewardship
Delaware
Water and Air Resources
Commission (1966)
Department of Natural Resources & Environmental Control (1969)
Water Pollution Commission (1951)Air Pollution Authority (1957)
Board of Game & Fish
Commissioners (1911)
Commission on Shell Fisheries
(1953)
Atlantic State Marine Fisheries
Commission (1941)
State Park Commission
(1937)
State Forestry Department
(1927)
Recreation Advisory Council
(1968)
Soil & Water Conservation Commission
(1963)
Board of Ditch Commissioners
(1951)
Delaware River Basin
Commission (1951)
Department of Agriculture (1974)
Council on Game & Freshwater
Fish (1953)
Commission for the Conservation
of Forests in Delaware (1925)
Board of Health (1879)
Department of Natural Resources and Environmental Control (1974)
Department of Health & Social Services
(1969)
Various Welfare Agencies
Department of Agriculture

170
Florida
Department of Environmental Protection
Mission Statement
The Department of Environmental Protection (DEP) protects, conserves and manages
Florida's natural resources and enforces the State's environmental laws.
History and Budgetary Information
Current Structure Environmental Programs Started Founded Reorganized Employees
Health
Department
Independent
Board
Independent
Agency
Mini-EPA N Y N 1969 1993 2822
Operating Budget 2015/16 Federal Funding Federal Share
$1,522,137,513 N/A N/A
Agency Responsibilities
Commission
Clean
Air
Clean
Water
Drinking
Water
Ground-
water
Solid
Waste
Hazardous
Waste Mining Energy Agriculture
Y Y Y Y Y Y Y N N N
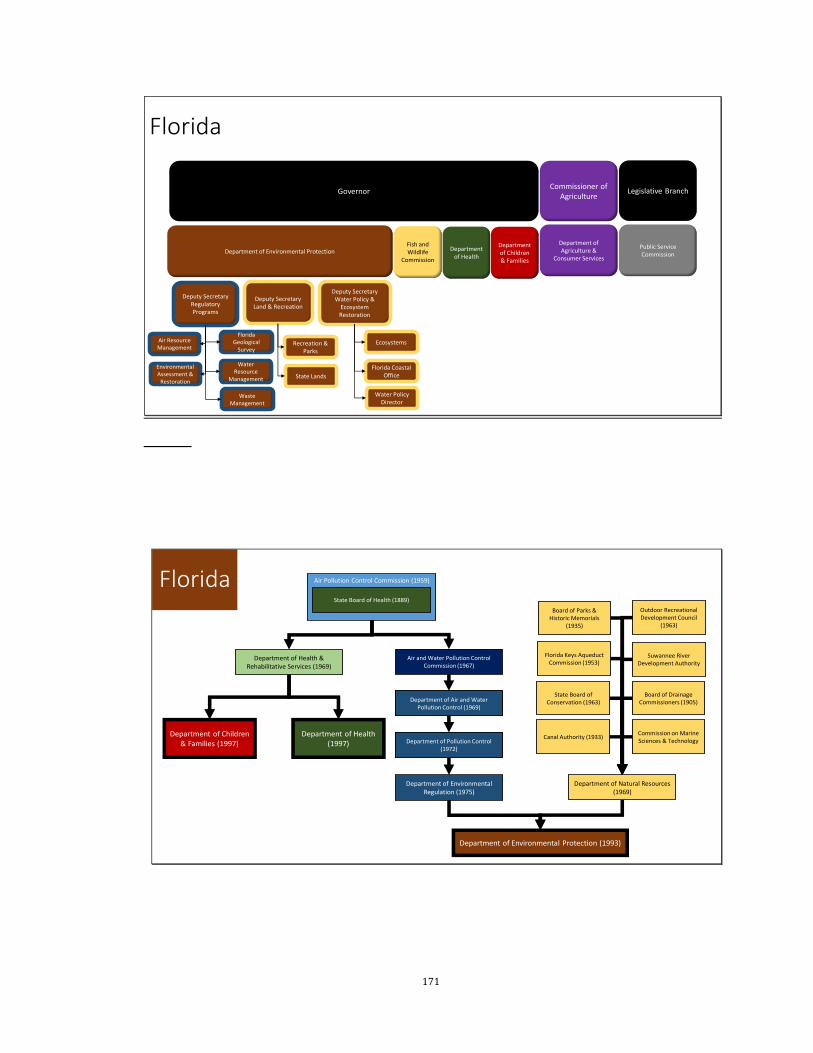
171
Florida
Department of Environmental Protection
Governor
Fish and Wildlife
Commission
Department of Health
Department of Agriculture &
Consumer Services
Commissioner of Agriculture
Public Service Commission
Legislative Branch
Air Resource Management
Environmental Assessment &
Restoration
Waste Management
Recreation & Parks
Water Resource
Management
Florida Geological
Survey
Deputy Secretary Regulatory Programs
Deputy Secretary Water Policy &
Ecosystem Restoration
Deputy Secretary Land & Recreation
State Lands
Ecosystems
Florida Coastal Office
Water Policy Director
Department of Children & Families
Department of Pollution Control (1972)
Department of Environmental Protection (1993)
Department of Air and Water Pollution Control (1969)
Air and Water Pollution Control Commission (1967)
Air Pollution Control Commission (1959)
Department of Environmental Regulation (1975)
Department of Natural Resources (1969)
State Board of Conservation (1963)
Canal Authority (1933)Commission on Marine Sciences & Technology
Florida Keys Aqueduct Commission (1953)
Board of Parks & Historic Memorials
(1935)
Outdoor Recreational Development Council
(1963)
Board of Drainage Commissioners (1905)
Suwannee River Development Authority
State Board of Health (1889)
Department of Health (1997)
Department of Health & Rehabilitative Services (1969)
Department of Children & Families (1997)
Florida
Department of Pollution Control (1972)
Department of Air and Water Pollution Control (1969)
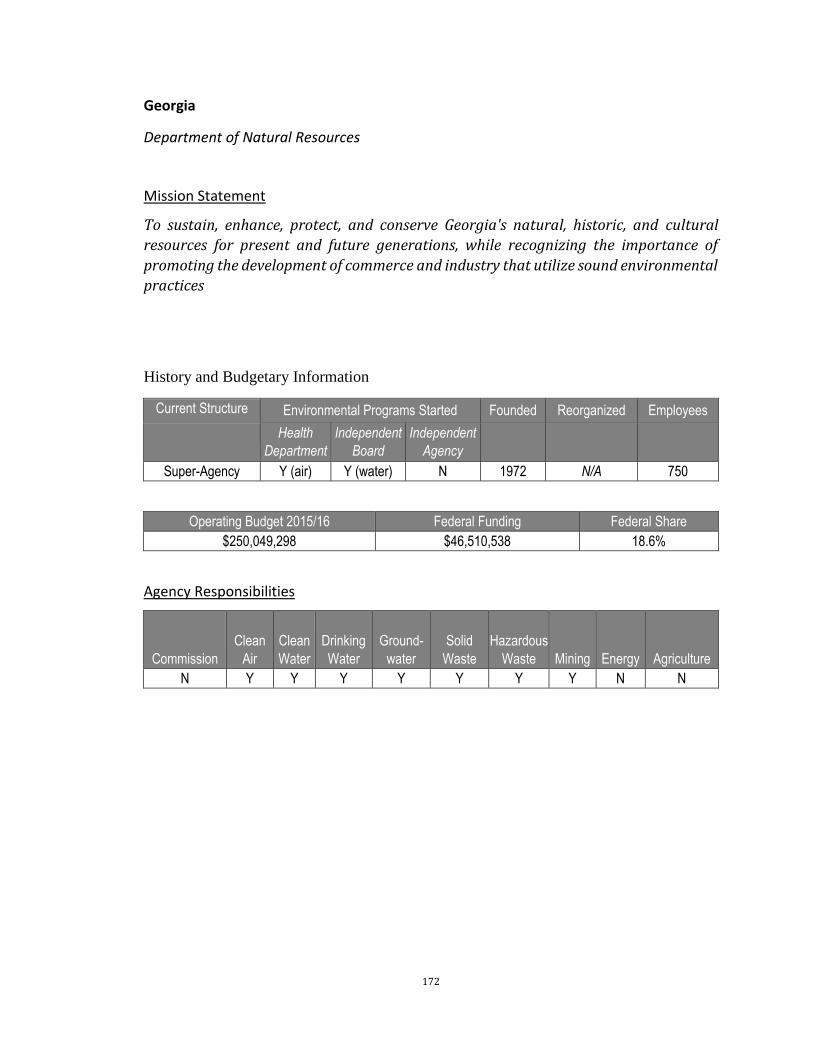
172
Georgia
Department of Natural Resources
Mission Statement
To sustain, enhance, protect, and conserve Georgia's natural, historic, and cultural
resources for present and future generations, while recognizing the importance of
promoting the development of commerce and industry that utilize sound environmental
practices
History and Budgetary Information
Current Structure Environmental Programs Started Founded Reorganized Employees
Health
Department
Independent
Board
Independent
Agency
Super-Agency Y (air) Y (water) N 1972 N/A 750
Operating Budget 2015/16 Federal Funding Federal Share
$250,049,298 $46,510,538 18.6%
Agency Responsibilities
Commission
Clean
Air
Clean
Water
Drinking
Water
Ground-
water
Solid
Waste
Hazardous
Waste Mining Energy Agriculture
N Y Y Y Y Y Y Y N N

173
Georgia
Governor
State Forestry Commission
Department of Community
Health
Department of Agriculture
Commissioner of Agriculture
Utilities Division
Public Service Commissioner
Board of Natural Resources
Department of Natural Resources
Coastal Resources Law Enforcement
Historic Preservation
Parks, Recreation, & Historic Sites
Environmental Protection
Wildlife Resources
Department of Public Health
Department of Human Services
Board of Natural Resources (1972)
Water Quality Control Board (1964)
Georgia
Department of Natural Resources (1972)
Department of Health
Department of Human Services (1972)
Water Quality Council (1957)
Board of Health
Department of Public Health (2011)Department of Human Services (2011)
25 Conservation Agencies
Board of Public Welfare (1919)
Department of Public Welfare (1937)
Board of Social Security (1943)
Department of Public Welfare (1960)
Department of Family & Children (1963)
Other Welfare Agencies

174
Hawaii
Department of Health
Mission Statement
The mission of the Department of Health is to protect and improve the health and
environment for all people in Hawaii.
History and Budgetary Information
Current Structure Environmental Programs Started Founded Reorganized Employees
Health
Department
Independent
Board
Independent
Agency
Health Y N N N/A N/A 2596
Operating Budget 2015/16 Federal Funding Federal Share
$929,841,910 $87,164,911 9.4%
Agency Responsibilities
Commission
Clean
Air
Clean
Water
Drinking
Water
Ground-
water
Solid
Waste
Hazardous
Waste Mining Energy Agriculture Y Y Y Y Y Y Y N N
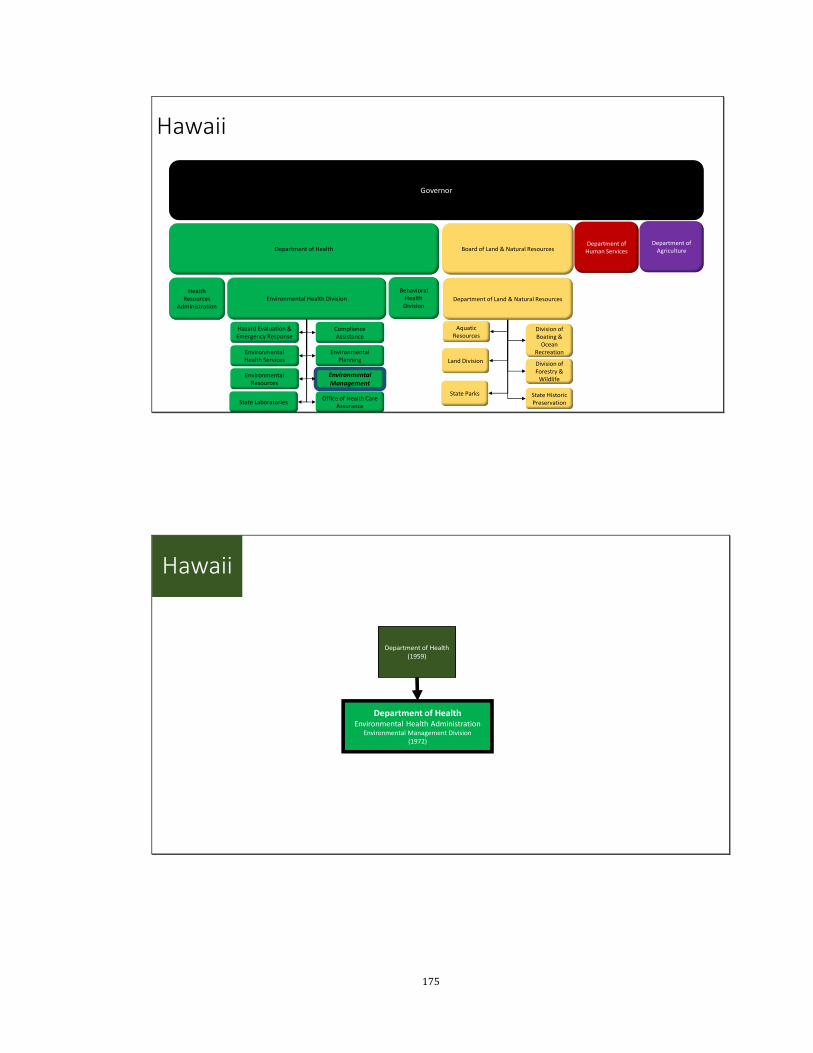
175
Hawaii
Department of Health
Governor
Department of AgricultureBoard of Land & Natural Resources
Health Resources
AdministrationEnvironmental Health Division
Behavioral Health
DivisionDepartment of Land & Natural Resources
Hazard Evaluation & Emergency Response
Office of Health Care Assurance
Environmental Management
Compliance Assistance
Division of Forestry &
Wildlife
Division of Boating &
Ocean Recreation
State Parks
Aquatic Resources
Land Division
State Historic Preservation
Environmental Health Services
Environmental Resources
State Laboratories
Environmental Planning
Department of Human Services
Hawaii
Department of Health (1959)
Department of HealthEnvironmental Health Administration
Environmental Management Division(1972)
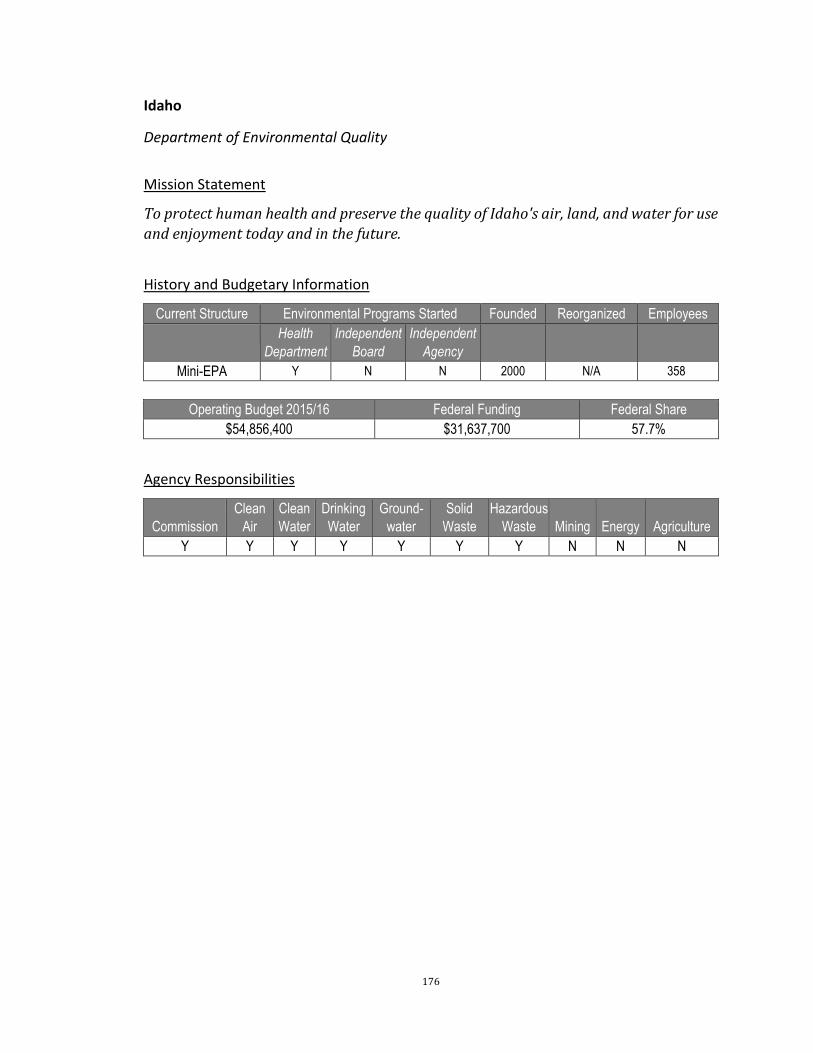
176
Idaho
Department of Environmental Quality
Mission Statement
To protect human health and preserve the quality of Idaho's air, land, and water for use
and enjoyment today and in the future.
History and Budgetary Information
Current Structure Environmental Programs Started Founded Reorganized Employees
Health
Department
Independent
Board
Independent
Agency
Mini-EPA Y N N 2000 N/A 358
Operating Budget 2015/16 Federal Funding Federal Share
$54,856,400 $31,637,700 57.7%
Agency Responsibilities
Commission
Clean
Air
Clean
Water
Drinking
Water
Ground-
water
Solid
Waste
Hazardous
Waste Mining Energy Agriculture
Y Y Y Y Y Y Y N N N
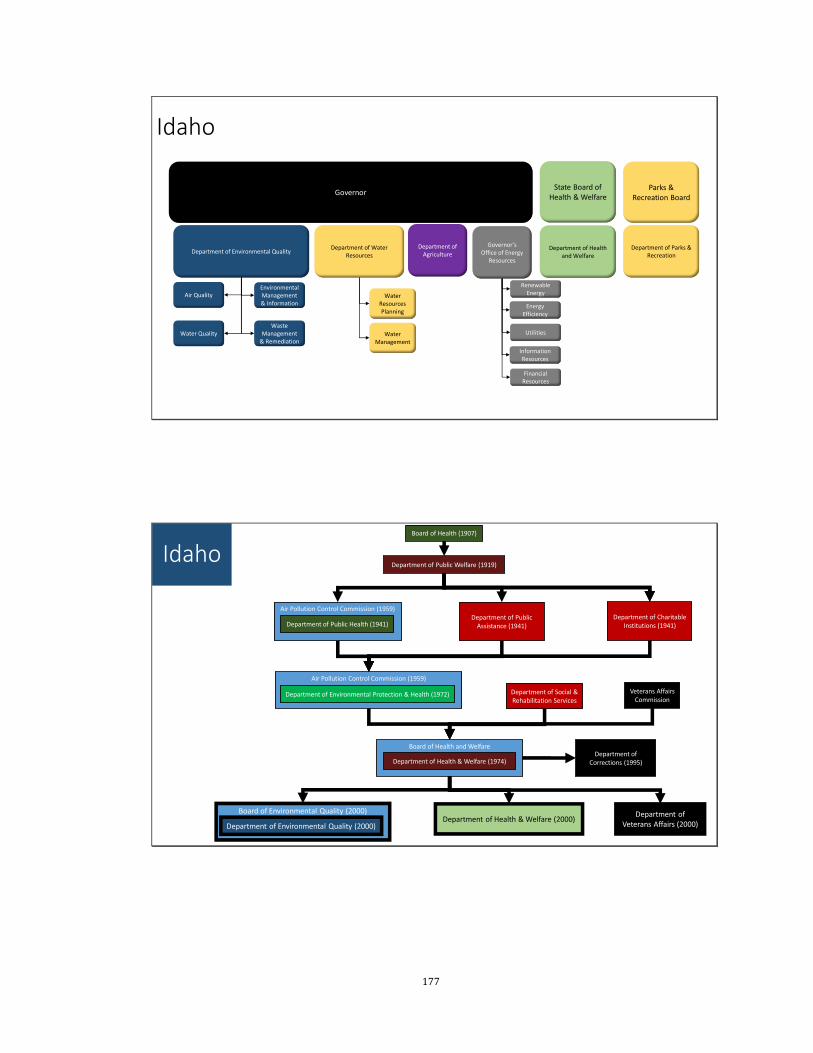
177
Idaho
Department of Environmental Quality
Governor
Department of Water Resources
Department of Health and Welfare
Department of Agriculture
State Board of Health & Welfare
Department of Parks & Recreation
Parks & Recreation Board
Governor’s Office of Energy
Resources
Air Quality
Water QualityWaste
Management & Remediation
Environmental Management & Information
Utilities
Financial Resources
Energy Efficiency
Renewable Energy
Information Resources
Water Management
Water Resources Planning
Air Pollution Control Commission (1959)
Department of Environmental Protection & Health (1972)
Air Pollution Control Commission (1959)
Board of Environmental Quality (2000)
Board of Health and Welfare
IdahoBoard of Health (1907)
Department of Environmental Quality (2000)
Department of Public Welfare (1919)
Department of Public Health (1941)Department of Public
Assistance (1941)Department of Charitable
Institutions (1941)
Department of Health & Welfare (1974)
Department of Health & Welfare (2000)
Department of Social & Rehabilitation Services
Veterans Affairs Commission
Department of Corrections (1995)
Department of Veterans Affairs (2000)

178
Illinois
Environmental Protection Agency
Mission Statement
To safeguard environmental quality, consistent with the social and economic needs of
the State so as to protect health, welfare, property, and the quality of life.
History and Budgetary Information
Current Structure Environmental Programs Started Founded Reorganized Employees
Health
Department
Independent
Board
Independent
Agency
Mini-EPA Y Y (sanitation
board) N 1970 N/A 726
Operating Budget 2015/16 Federal Funding Federal Share
$297,178,700 $63,640,300 21.4%
Agency Responsibilities
Commission
Clean
Air
Clean
Water
Drinking
Water
Ground-
water
Solid
Waste
Hazardous
Waste Mining Energy Agriculture
Y Y Y Y Y Y Y N N N

179
Illinois
Governor
Department of
Agriculture
Department of Public Health
Environmental Protection Agency Department of Natural Resources
Air Land Water
Department of
Commerce & Economic Opportunity
Energy OfficeWater
Resources
Coal Development
Mines & Minerals
Land Management
Coastal Management
Program
Department of Human Services
Pollution Control Board
Illinois
Board of Health (1877)
Environmental Protection Agency (1970)
Sanitary Water Board (1929)
Air Pollution Control Board (1963)
Department of Public Health (1970)Pollution Control Board (1970)
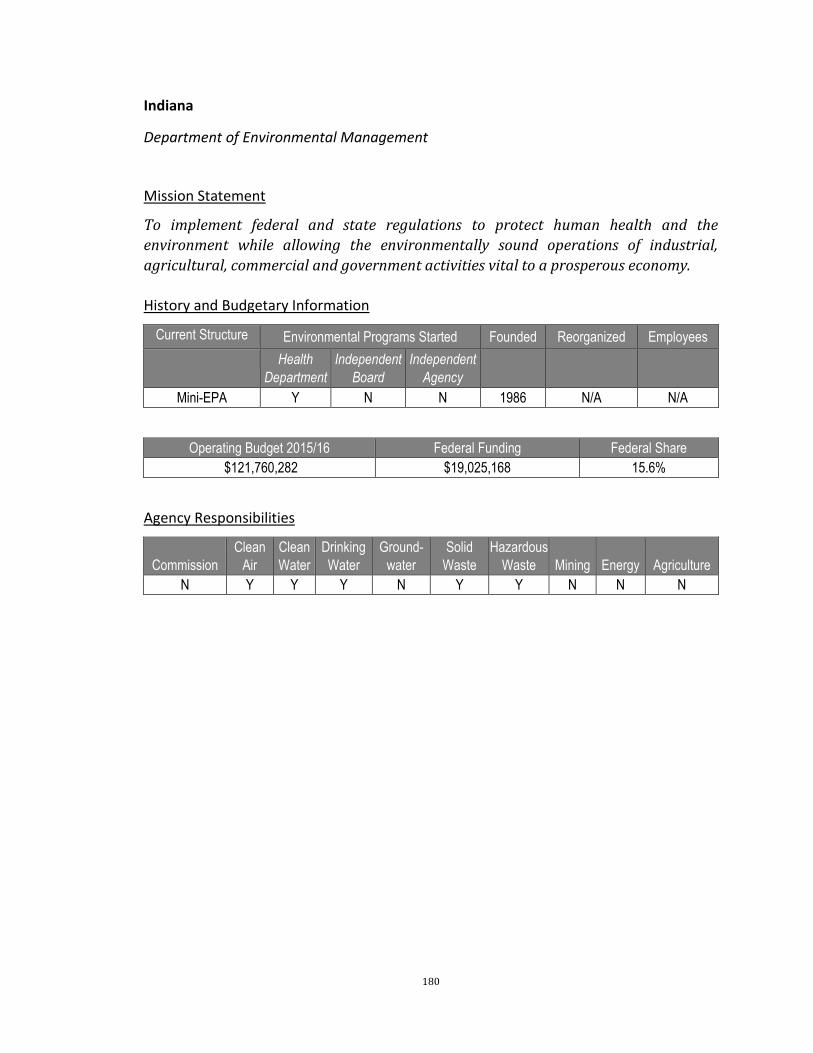
180
Indiana
Department of Environmental Management
Mission Statement
To implement federal and state regulations to protect human health and the
environment while allowing the environmentally sound operations of industrial,
agricultural, commercial and government activities vital to a prosperous economy.
History and Budgetary Information
Current Structure Environmental Programs Started Founded Reorganized Employees
Health
Department
Independent
Board
Independent
Agency
Mini-EPA Y N N 1986 N/A N/A
Operating Budget 2015/16 Federal Funding Federal Share
$121,760,282 $19,025,168 15.6%
Agency Responsibilities
Commission
Clean
Air
Clean
Water
Drinking
Water
Ground-
water
Solid
Waste
Hazardous
Waste Mining Energy Agriculture
N Y Y Y N Y Y N N N

181
Indiana
Governor
Department of
Agriculture
Department of Health
Department of Environmental Management Department of Natural Resources
Utility Regulatory
Commission
Air Quality Land Quality
Water Quality
Fish & Wildlife
Forestry
Land Acquisition Nature Preserves
Outdoor Recreation
State Parks & Reservoirs
Historic Preservation
Oil & Gas
Reclamation
Water
Electricity
Natural Gas
Pipeline Safety
Water/ Wastewater
Family & Social Services
Administration
Indiana
Air Pollution Control Board (1961)
Department of Health
Department of Health (1986)
Stream Pollution Control Board (1947)
Air Pollution Control Board (1985-2013)Water Pollution Control Board (1985-2013)
Solid Waste Management Board (1985 2013)Environmental Rules Board (2013)
Department of Environmental Management (1986)
Board of Health (1887)
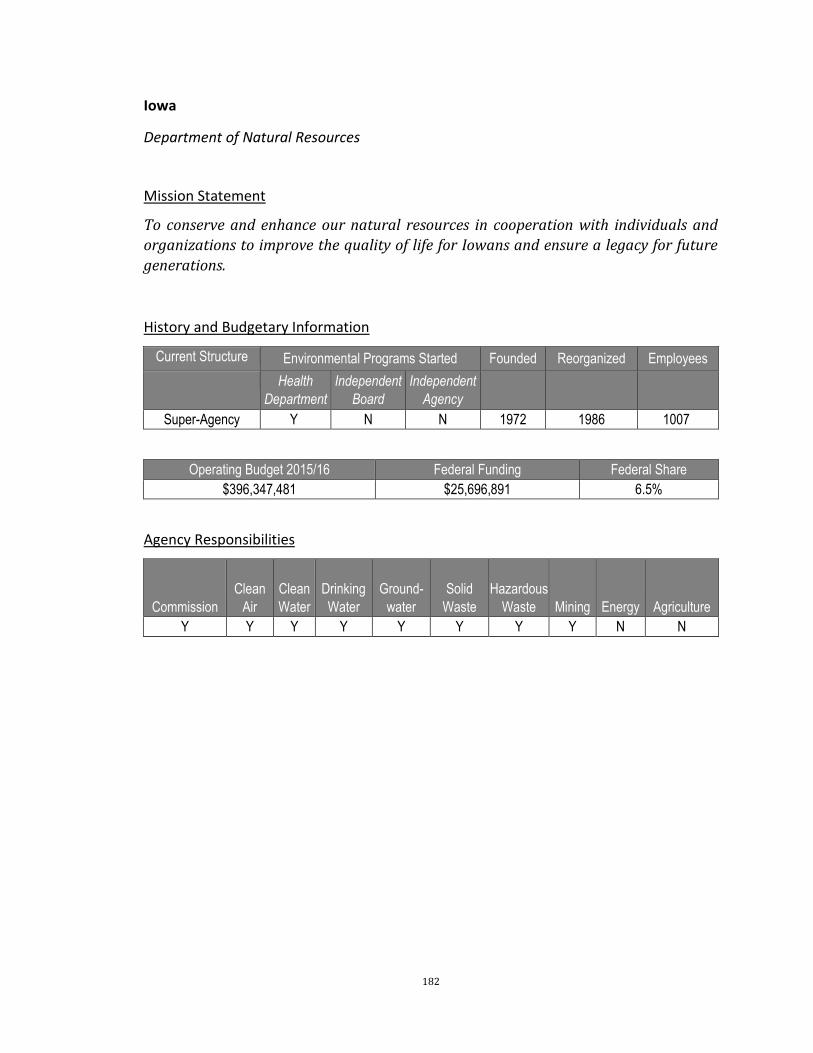
182
Iowa
Department of Natural Resources
Mission Statement
To conserve and enhance our natural resources in cooperation with individuals and
organizations to improve the quality of life for Iowans and ensure a legacy for future
generations.
History and Budgetary Information
Current Structure Environmental Programs Started Founded Reorganized Employees
Health
Department
Independent
Board
Independent
Agency
Super-Agency Y N N 1972 1986 1007
Operating Budget 2015/16 Federal Funding Federal Share
$396,347,481 $25,696,891 6.5%
Agency Responsibilities
Commission
Clean
Air
Clean
Water
Drinking
Water
Ground-
water
Solid
Waste
Hazardous
Waste Mining Energy Agriculture
Y Y Y Y Y Y Y Y N N

183
Iowa
Department of Natural Resources
Governor
Department of Public Health
Department of Agriculture & Land
Stewardship
Secretary of Agriculture
Environmental Services
Water Quality
Conservation & Recreation
Air Quality
Land Quality Fisheries
Forestry
Wildlife
State Parks
Land & Waters
Department of Human Services
Iowa
Department of Natural Resources (1985/86)
Department of Environmental Quality
(1972)
Conservation Commission (1935/36)
Iowa Geological Survey (1892)
Department of Water, Air, Waste Management (1983)
Fish and Game Commission (1931)
State Board of Conservation (1917)
Iowa Natural Resources Council (1949)
Energy Policy Council (1974)
Water Pollution Control Commission (1965)Air Pollution Control Commission (1969)
Department of Health (1923)
Department of Public Health (1972)
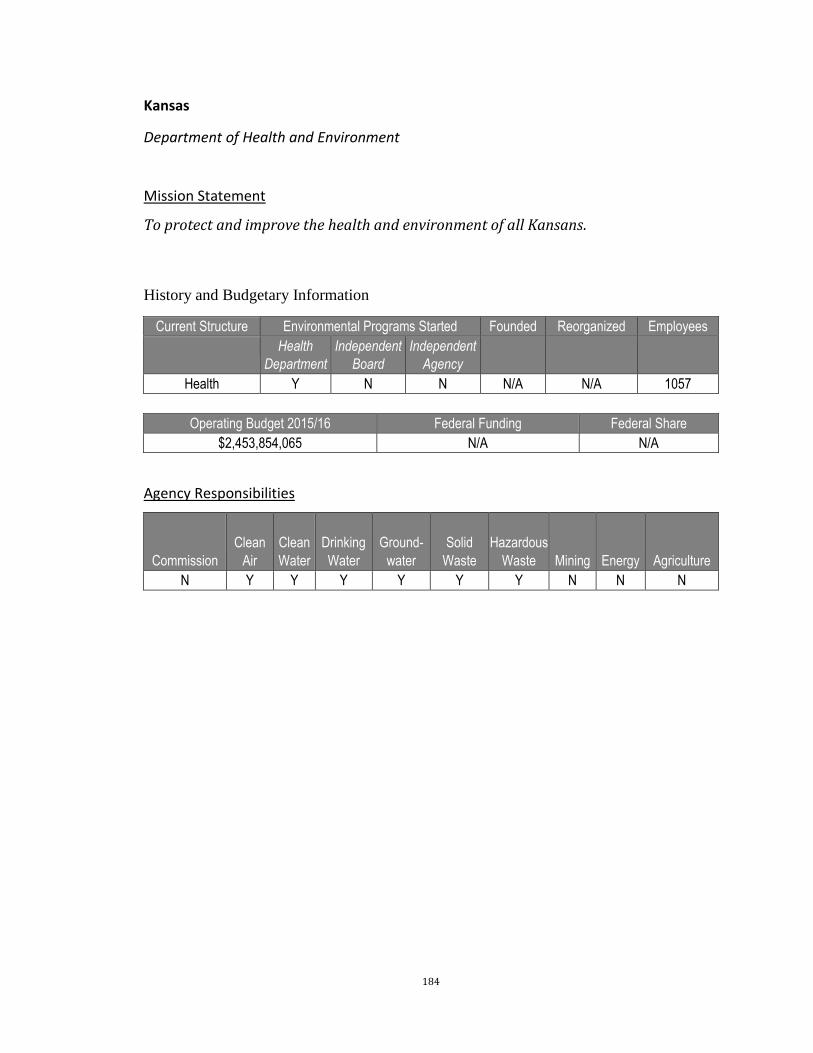
184
Kansas
Department of Health and Environment
Mission Statement
To protect and improve the health and environment of all Kansans.
History and Budgetary Information
Current Structure Environmental Programs Started Founded Reorganized Employees
Health
Department
Independent
Board
Independent
Agency
Health Y N N N/A N/A 1057
Operating Budget 2015/16 Federal Funding Federal Share
$2,453,854,065 N/A N/A
Agency Responsibilities
Commission
Clean
Air
Clean
Water
Drinking
Water
Ground-
water
Solid
Waste
Hazardous
Waste Mining Energy Agriculture
N Y Y Y Y Y Y N N N
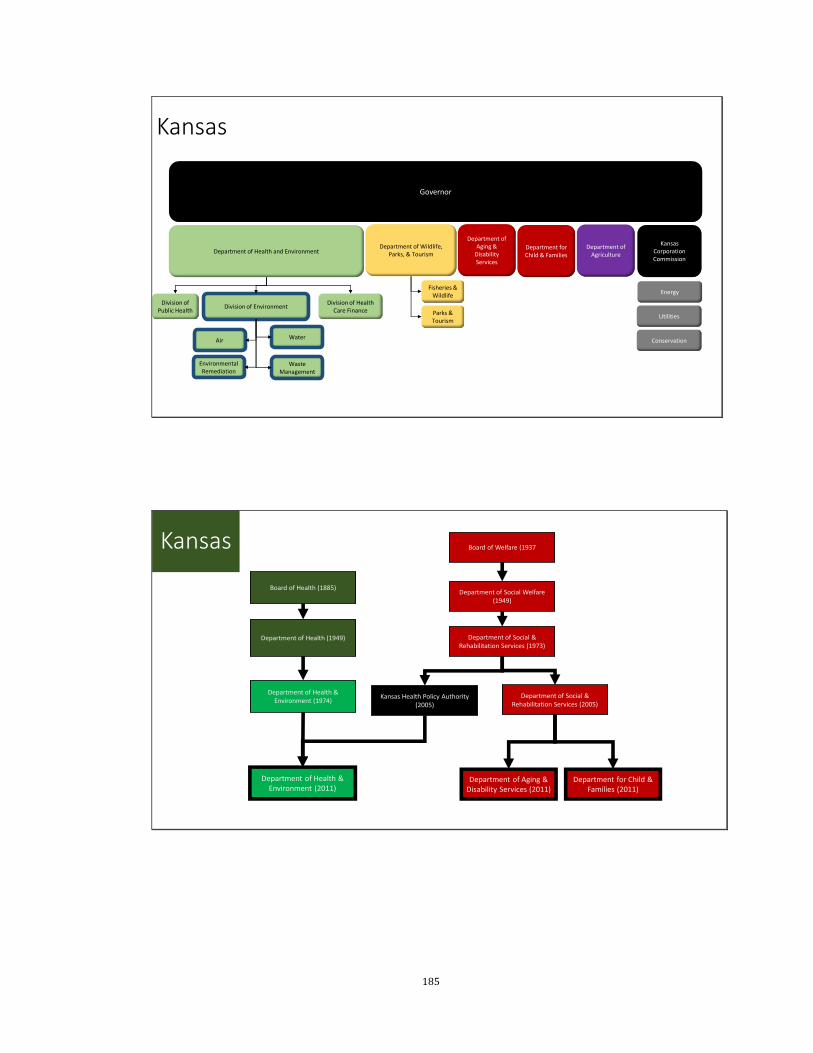
185
Kansas
Governor
Department of Agriculture
Department of Health and EnvironmentDepartment of Wildlife,
Parks, & Tourism
Division of Public Health
Division of EnvironmentDivision of Health
Care Finance
Air
Environmental Remediation
Waste Management
Water
Fisheries & Wildlife
Parks & Tourism
Kansas Corporation Commission
Energy
Utilities
Conservation
Department of Aging &
Disability Services
Department for Child & Families
Kansas
Department of Health (1949)
Board of Health (1885)
Department of Health & Environment (1974)
Board of Welfare (1937
Department of Social Welfare (1949)
Department of Social & Rehabilitation Services (1973)
Department of Aging & Disability Services (2011)
Department for Child & Families (2011)
Kansas Health Policy Authority (2005)
Department of Social & Rehabilitation Services (2005)
Department of Health & Environment (2011)

186
Kentucky
Energy and Environment Cabinet
Mission Statement
To Protect and Enhance Kentucky’s Environment
History and Budgetary Information
Current Structure Environmental Programs Started Founded Reorganized Employees
Health
Department
Independent
Board
Independent
Agency
Super-Agency Y N N 1973 N/A 765
Operating Budget 2015/16 Federal Funding Federal Share
$262,150,123 $69,030,513 26.3%
Agency Responsibilities
Commission
Clean
Air
Clean
Water
Drinking
Water
Ground-
water
Solid
Waste
Hazardous
Waste Mining Energy Agriculture
Y Y Y Y Y Y Y N N N

187
Kentucky
Secretary of Energy and Environment Cabinet
Governor
Cabinet for Health & Family Services
Department of Agriculture
Secretary of
Agriculture
Department for Environmental
Protection
Forestry
Department for Natural Resources
Department for Energy Development & Independence
Environmental Quality
Commission
State Nature Preserves
Commission
Mine Safety Review
Commission
Waste Management
Air Quality
Water
Mine Permits
Conservation
Abandoned Mine Lands
Mine Reclamation & Enforcement
Mine Safety & Licensing
Oil & Gas
Public Service
Commission
Efficiency & Conservation Renewable
Energy
BiofuelsEnergy
Generation, Transmission, & Distribution
Carbon Management
Fossil Energy Development
Water Pollution Control Commission (1940s)Air Pollution Control Commission (1966)
KentuckyDepartment of Health (1934)
Energy & Environment Cabinet (2008)
Department for Natural Resources & Environmental Protection (1973)
Environmental & Public Protection Cabinet (2003)
Labor Cabinet (2008)Public Protection
Cabinet (2008)
Department of Environmental Protection (1972)Department of Natural
Resources (1964)
Department of Conservation (1936)
Department of Energy (1978)
Natural Resources & Environmental Protection Cabinet (1982)
Public Protection & Regulation Cabinet
Labor Cabinet
Governor’s Office for Coal & Energy Policy (1989)
Energy Cabinet (1982)
Cabinet for Human Resources (1972)
Department of Child Welfare
(1960)
Department of Economic
Security (1948)
Department of Human Resources
(1973)
Cabinet for Human Resources (1982)
Cabinet for Health Services
(1995)
Cabinet for Families &
Children (1995)
Cabinet for Health & Family Services (2004)
Water Pollution Control Commission (1940s)Air Pollution Control Commission (1966)
Department of Health (1934)
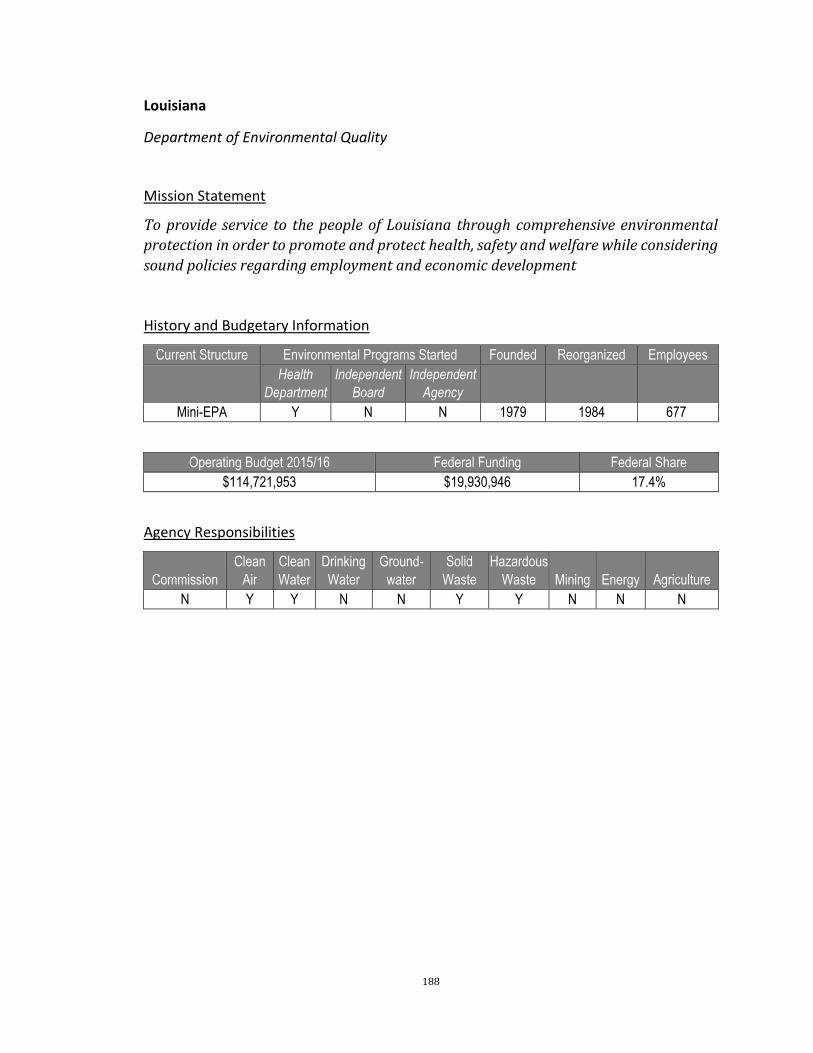
188
Louisiana
Department of Environmental Quality
Mission Statement
To provide service to the people of Louisiana through comprehensive environmental
protection in order to promote and protect health, safety and welfare while considering
sound policies regarding employment and economic development
History and Budgetary Information
Current Structure Environmental Programs Started Founded Reorganized Employees
Health
Department
Independent
Board
Independent
Agency
Mini-EPA Y N N 1979 1984 677
Operating Budget 2015/16 Federal Funding Federal Share
$114,721,953 $19,930,946 17.4%
Agency Responsibilities
Commission
Clean
Air
Clean
Water
Drinking
Water
Ground-
water
Solid
Waste
Hazardous
Waste Mining Energy Agriculture
N Y Y N N Y Y N N N

189
Louisiana
Department of Environmental Quality
Governor
Department of Health
and Hospitals
Department of Agriculture &
Forestry
Public Service Commission
Department of Natural Resources
Department of Wildlife &
Fisheries
Coastal Protection & Restoration
Board
Commissioner of Agriculture
Environmental Services
Environmental Compliance
Air Permits
Water Permits
Waste Permits
Enforcement
Assessment
Inspection
Conservation
Coastal Management
Mineral Resources
Public Utilities
Department Children &
Family Services
Louisiana
Department of Natural Resources (1976)
Air Pollution Commission (1950s)
Department of Fish & Wildlife (1944)
Department of Environmental Quality (1984)
Stream Control
Commission (1949)
Department of Conservation (1918)(originally created under different name 1910)
Forestry Commission
(1944)
Department of Conservation (1944)
Department of Natural Resources (1979)
Department of Agriculture & Forestry (1980s)
Wildlife & Fisheries
Commission (1952)
Department of Natural Resources (1979)
Department of Health
Department of Health & Human Services (1979)
Department of Agriculture &
Forestry
Board of Health (1877)
Department of Health & Hospitals (1988)
Department of Public Welfare
Health & Human
Resource Administration
Department of Social Services
(1988)
Board of Public
Welfare
Department of Children & Family Services (2010)

190
Maine
Department of Environmental Protection
Mission Statement
To prevent, abate, and control the pollution of the air, water, and land. To preserve,
improve, and prevent diminution of the natural environment of the state. To protect and
enhance the public's right to use and enjoy the State's natural resources.
History and Budgetary Information
Current Structure Environmental Programs Started Founded Reorganized Employees
Health
Department
Independent
Board
Independent
Agency
Mini-EPA N Y N 1972 N/A N/A
Operating Budget 2015/16 Federal Funding Federal Share
$74,970,812 N/A N/A
Agency Responsibilities
Commission
Clean
Air
Clean
Water
Drinking
Water
Ground-
water
Solid
Waste
Hazardous
Waste Mining Energy Agriculture
N Y Y N Y Y Y Y N N
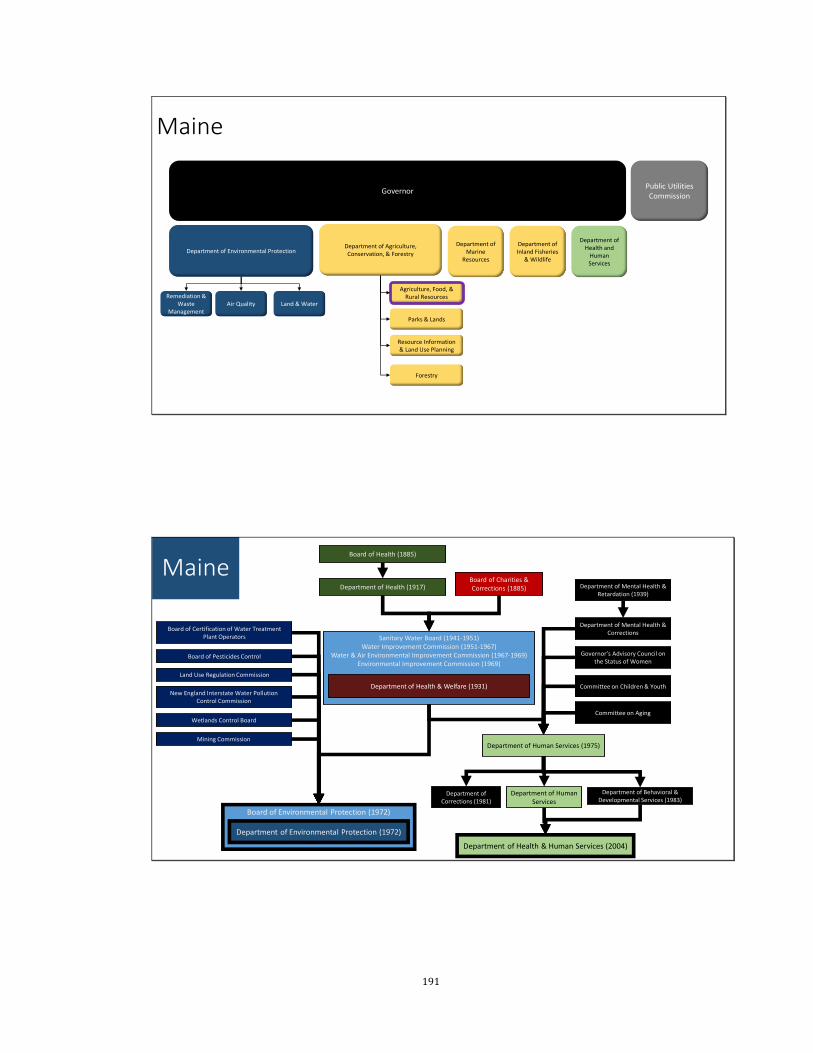
191
Maine
Department of Environmental Protection
Governor
Department of Health and
Human Services
Public Utilities Commission
Department of Agriculture, Conservation, & Forestry
Department of Marine
Resources
Department of Inland Fisheries
& Wildlife
Remediation & Waste
ManagementAir Quality Land & Water
Agriculture, Food, & Rural Resources
Parks & Lands
Forestry
Resource Information & Land Use Planning
Maine
Board of Environmental Protection (1972)
Department of Environmental Protection (1972)
Board of Health (1885)
Sanitary Water Board (1941-1951)Water Improvement Commission (1951-1967)
Water & Air Environmental Improvement Commission (1967-1969)Environmental Improvement Commission (1969)
Department of Health & Welfare (1931)
Department of Corrections (1981)
Land Use Regulation Commission
Department of Mental Health & Corrections
Committee on Aging
Committee on Children & Youth
Governor’s Advisory Council on the Status of Women
Board of Certification of Water Treatment Plant Operators
New England Interstate Water Pollution Control Commission
Wetlands Control Board
Mining CommissionDepartment of Human Services (1975)
Department of Behavioral & Developmental Services (1983)
Department of Health & Human Services (2004)
Board of Pesticides Control
Department of Health (1917)Board of Charities & Corrections (1885) Department of Mental Health &
Retardation (1939)
Department of Human Services

192
Maryland
Department of the Environment
Mission Statement
To protect and restore the quality of Maryland's air, water, and land resources, while
fostering smart growth, a thriving and sustainable economy and healthy communities
History and Budgetary Information
Current Structure Environmental Programs Started Founded Reorganized Employees
Health
Department
Independent
Board
Independent
Agency
Mini-EPA Y Y(WATER) N 1987 N/A 1008
Operating Budget 2015/16 Federal Funding Federal Share
$393,005,002 $76,526,503 19.5%
Agency Responsibilities
Commission
Clean
Air
Clean
Water
Drinking
Water
Ground-
water
Solid
Waste
Hazardous
Waste Mining Energy Agriculture
N Y Y Y Y Y Y Y N N

193
Maryland
Governor
Department of Agriculture
Department of Environment Department of Natural ResourcesDepartment of
Health & Mental Hygiene
Air & Radiation Management
Land Management
Water Management
Land Resource
Aquatic Resources
Park Service
Forest Service
Wildlife & Heritage Service
Land Acquisition & Planning
Engineering & Construction
Chesapeake & Coastal Service
Boating Service
Fisheries Service
Resource Assessment
Integrated Policy & Review
Critical Area Commission-
Department of Human Resources
Board of Natural Resources (1941)
Maryland
Department of the Environment (1987)
Department of Health (1910)
Board of Health (1874)
Department of Health & Mental Hygiene (1969)
State Lunacy Commission
(1886)
Board of Mental Hygiene (1922)
Department of Welfare (1922)
Department of Mental Hygiene (1949)
Conservation Commission (1916)
Department of Natural Resources (1969)
Conservation Department (1922)
Water Resources Commission (1933)
State Game Warden (1896)
State Geological Survey (1834)
State Geological & Economic Survey (1896)
State Oyster Police Force (1868)
State Fishery Force (1874)
Department of Health & Mental Hygiene (1987)
Department of Corrections
Department of Natural Resources (1969)

194
Massachusetts
Executive Office of Energy and Environmental Affairs
Mission Statement
Responsible for ensuring clean air and water, the safe management of toxics and
hazards, the recycling of solid and hazardous wastes, the timely cleanup of hazardous
waste sites and spills, and the preservation of wetlands and coastal resources.
History and Budgetary Information
Current Structure Environmental Programs Started Founded Reorganized Employees
Health
Department
Independent
Board
Independent
Agency
Super-Agency Y N N 1969 1975, 2007 N/A
Operating Budget 2015/16 Federal Funding Federal Share
$247,227,000 $73,311,377 29.7%
Agency Responsibilities
Commission
Clean
Air
Clean
Water
Drinking
Water
Ground-
water
Solid
Waste
Hazardous
Waste Mining Energy Agriculture
N Y Y Y Y Y Y N Y Y
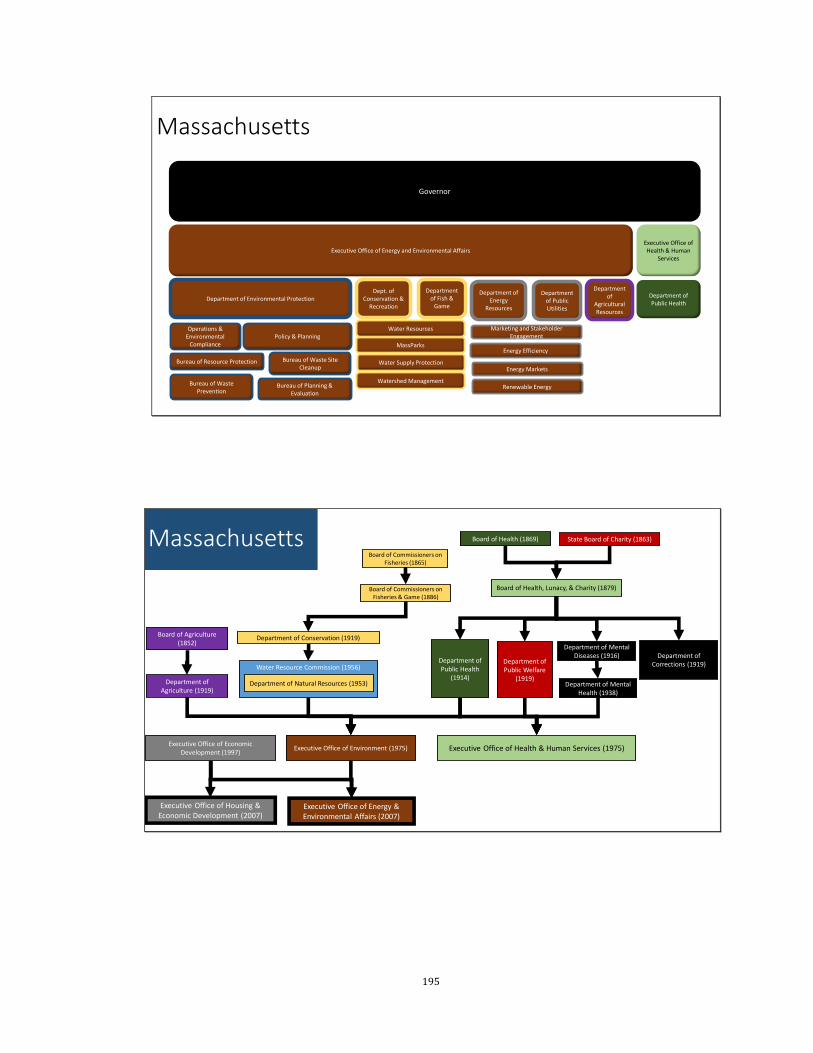
195
Massachusetts
Governor
Department of
Agricultural Resources
Executive Office of Energy and Environmental Affairs
Department of Public Health
Department of Energy
Resources
Executive Office of Health & Human
Services
Dept. of Conservation &
RecreationDepartment of Environmental Protection
Department of Fish &
Game
Department of Public Utilities
Operations & Environmental
CompliancePolicy & Planning
Bureau of Planning & Evaluation
Bureau of Resource Protection
Bureau of Waste Prevention
Bureau of Waste Site Cleanup
MassParks
Water Supply Protection
Watershed Management
Water Resources
Energy Efficiency
Energy Markets
Marketing and Stakeholder Engagement
Renewable Energy
Massachusetts
Water Resource Commission (1956)Department of Public Health
(1914)
Executive Office of Environment (1975)
Executive Office of Energy & Environmental Affairs (2007)
Executive Office of Economic Development (1997)
Department of Natural Resources (1953)
Executive Office of Health & Human Services (1975)
Department of Public Welfare
(1919)
State Board of Charity (1863)
Department of Corrections (1919)
Board of Health (1869)
Department of Mental Diseases (1916)
Board of Health, Lunacy, & Charity (1879)
Department of Mental Health (1938)
Executive Office of Housing & Economic Development (2007)
Department of Agriculture (1919)
Board of Agriculture (1852)
Board of Commissioners on Fisheries (1865)
Board of Commissioners on Fisheries & Game (1886)
Department of Conservation (1919)
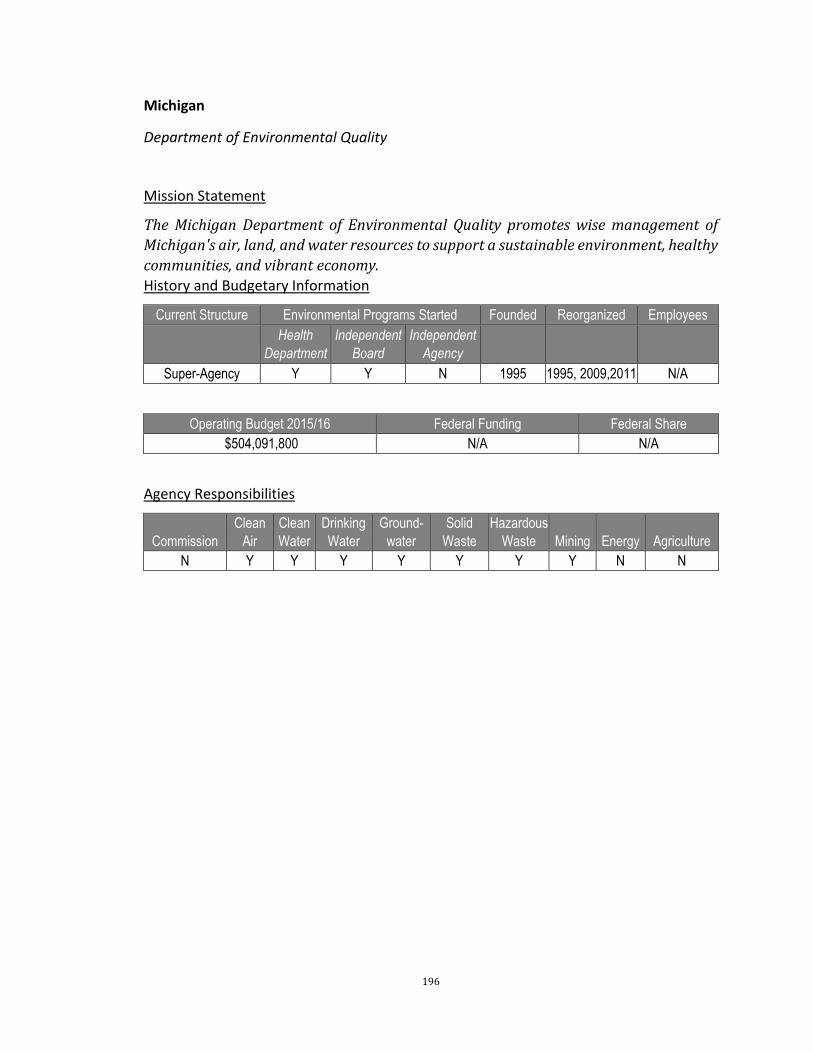
196
Michigan
Department of Environmental Quality
Mission Statement
The Michigan Department of Environmental Quality promotes wise management of
Michigan's air, land, and water resources to support a sustainable environment, healthy
communities, and vibrant economy.
History and Budgetary Information
Current Structure Environmental Programs Started Founded Reorganized Employees
Health
Department
Independent
Board
Independent
Agency
Super-Agency Y Y N 1995 1995, 2009,2011 N/A
Operating Budget 2015/16 Federal Funding Federal Share
$504,091,800 N/A N/A
Agency Responsibilities
Commission
Clean
Air
Clean
Water
Drinking
Water
Ground-
water
Solid
Waste
Hazardous
Waste Mining Energy Agriculture
N Y Y Y Y Y Y Y N N

197
Michigan
Governor
Department of Agriculture &
Rural Development
Department of Natural ResourcesDepartment of
Health & Human Services
Department of Licensing &
Regulatory Affairs
Air Quality
Department of Environmental Quality
Oil, Gas, & Minerals
Waste Management &
Radiological Protection
Drinking Water & Municipal Assistance
Remediation& Redevelopment
Water Resources
Fisheries
Law Enforcement
Parks & Recreation
Forest Resources
Minerals Management
Wildlife Public Services Commission
Air Pollution Control Commission (1965)
Michigan
Department of Public Health (1973)
Department of Natural Resources (1968)
Department of Natural Resources (1973)
Department of Environmental Quality (1995)
Department of Community Health
(1996)
Department of Agriculture (1921)
Department of Agriculture (1973)
Department of Mental
Health (1965)
Department of Social Services (1963)
Department of Social Welfare (1939)
Family Independence Agency (1996)
Department of Human Services (2005)
Department of Welfare (1921)
Board of State Commissioners for General Supervision of Charitable, Penal, Pauper & Reformatory Institutions (1871)
Department of Health & Human Services (2015)
Department of Natural Resources (1995)
State Council of Health (1919)
Water Resources Commission (1949)
Department of Conservation (1965)
Stream Pollution Control Commission (1929)
Department of Conservation
(1921) 4 recreational commissions
Department of Natural Resources & Environment (2009)
Department of Environmental Quality (2011)Department of Natural Resources (2011)
Department of Public Health (1965)
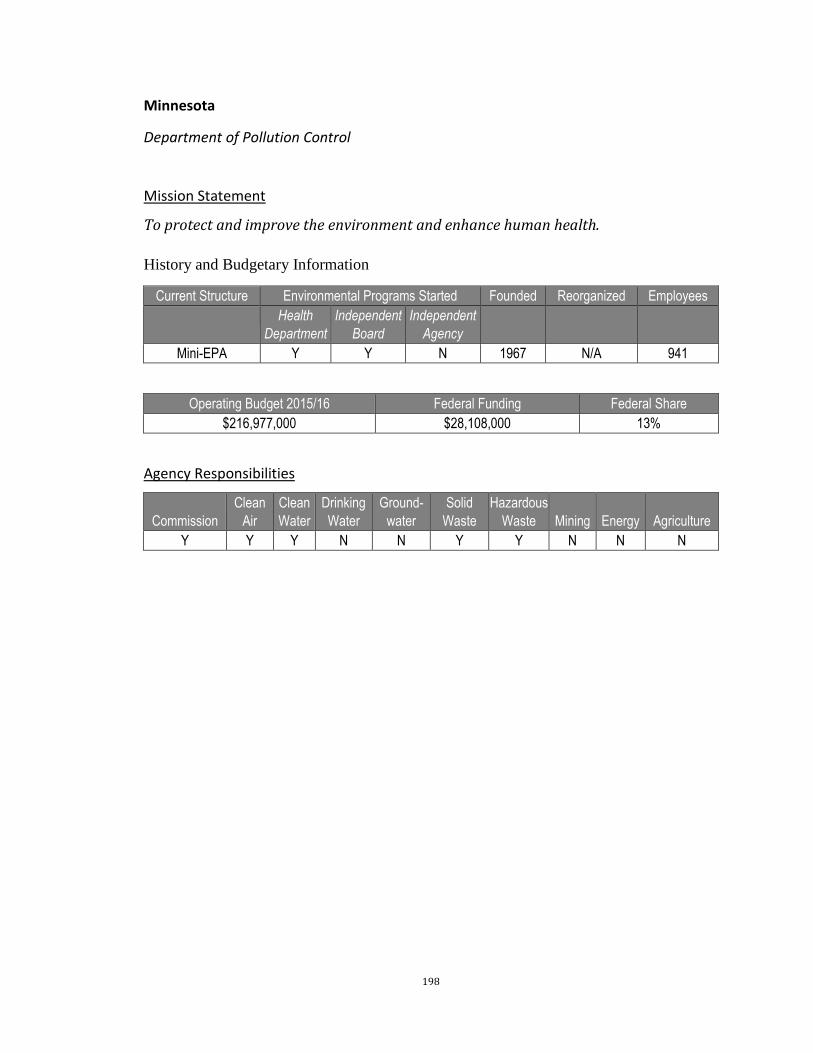
198
Minnesota
Department of Pollution Control
Mission Statement
To protect and improve the environment and enhance human health.
History and Budgetary Information
Current Structure Environmental Programs Started Founded Reorganized Employees
Health
Department
Independent
Board
Independent
Agency
Mini-EPA Y Y N 1967 N/A 941
Operating Budget 2015/16 Federal Funding Federal Share
$216,977,000 $28,108,000 13%
Agency Responsibilities
Commission
Clean
Air
Clean
Water
Drinking
Water
Ground-
water
Solid
Waste
Hazardous
Waste Mining Energy Agriculture
Y Y Y N N Y Y N N N
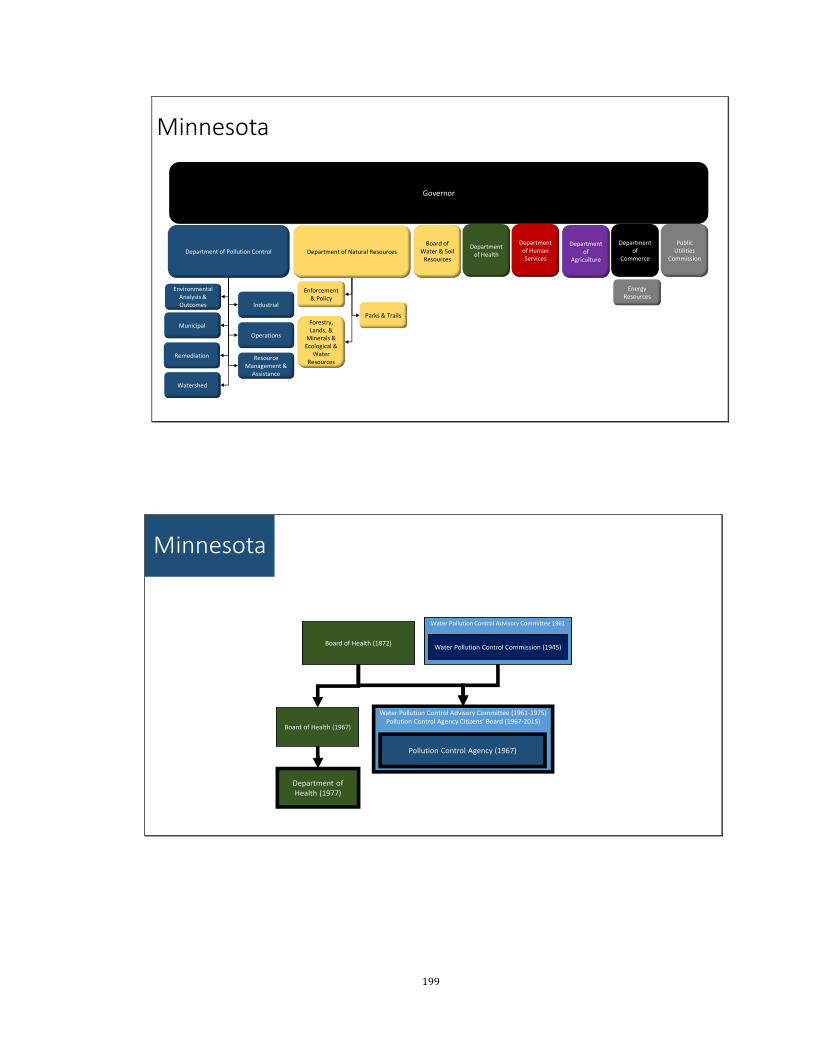
199
Minnesota
Department of Pollution Control
Public Utilities
Commission
Governor
Department of
Commerce
Department of Health
Board of Water & Soil
ResourcesDepartment of Natural Resources
Environmental Analysis & Outcomes
Municipal
Remediation
Watershed
Industrial
Operations
Resource Management &
Assistance
Enforcement& Policy
Forestry, Lands, &
Minerals & Ecological &
Water Resources
Parks & Trails
Energy Resources
Department of Human Services
Department of
Agriculture
Water Pollution Control Advisory Committee (1961-1975)Pollution Control Agency Citizens’ Board (1967-2015)
Water Pollution Control Advisory Committee 1961
Minnesota
Board of Health (1872)
Pollution Control Agency (1967)
Board of Health (1967)
Water Pollution Control Commission (1945)
Department of Health (1977)

200
Mississippi
Department of Environmental Quality
Mission Statement
To safeguard the health, safety, and welfare of present and future generations of
Mississisppians by conserving and improving our environment and fostering wise
economic growth through focused research and responsible regulation.
History and Budgetary Information
Current Structure Environmental Programs Started Founded Reorganized Employees
Health
Department
Independent
Board
Independent
Agency
Mini-EPA N Y N 1978 1989 491
Operating Budget 2015/16 Federal Funding Federal Share
$139,147,504 $34,131,941 24.5%
Agency Responsibilities
Commission
Clean
Air
Clean
Water
Drinking
Water
Ground-
water
Solid
Waste
Hazardous
Waste Mining Energy Agriculture
Y Y Y N Y Y Y Y N N

201
Mississippi
Department of Environmental Quality
Public Service
Commission
Governor
Department of Health
Department of Wildlife, Fisheries, & Parks
Pollution Control
Land & Water
Geology
Inland Fisheries
Wildlife
State Parks
Museum of Natural Science
Department of Marine Resources
Forestry Commission
Coastal Ecology
Marine Fisheries
Marine Patrol
Coastal Management
& Planning
Department of Human Services
Department of
Agriculture &
Commerce
Mississippi
Department of Natural Resources (1978)
Geological Survey (1850)
Board of Water Commissioners
Air and Water Pollution Control Commission
(1966)Park Commission
Mineral Lease Commission
Department of Environmental Quality (1989)
Department of Health (1982)
Department of Wildlife, Fisheries, and Parks (1989)
Board of Health (1877)
Board of Health (1978)

202
Missouri
Department of Natural Resources
Mission Statement
To protect, preserve, and enhance Missouri's natural, cultural and energy resources
History and Budgetary Information
Current Structure Environmental Programs Started Founded Reorganized Employees
Health
Department
Independent
Board
Independent
Agency
Super-Agency Y N N 1974 N/A 1694
Operating Budget 2015/16 Federal Funding Federal Share
$558,319,893 N/A N/A
Agency Responsibilities
Commission
Clean
Air
Clean
Water
Drinking
Water
Ground-
water
Solid
Waste
Hazardous
Waste Mining Energy Agriculture
N Y Y Y Y Y Y Y N N
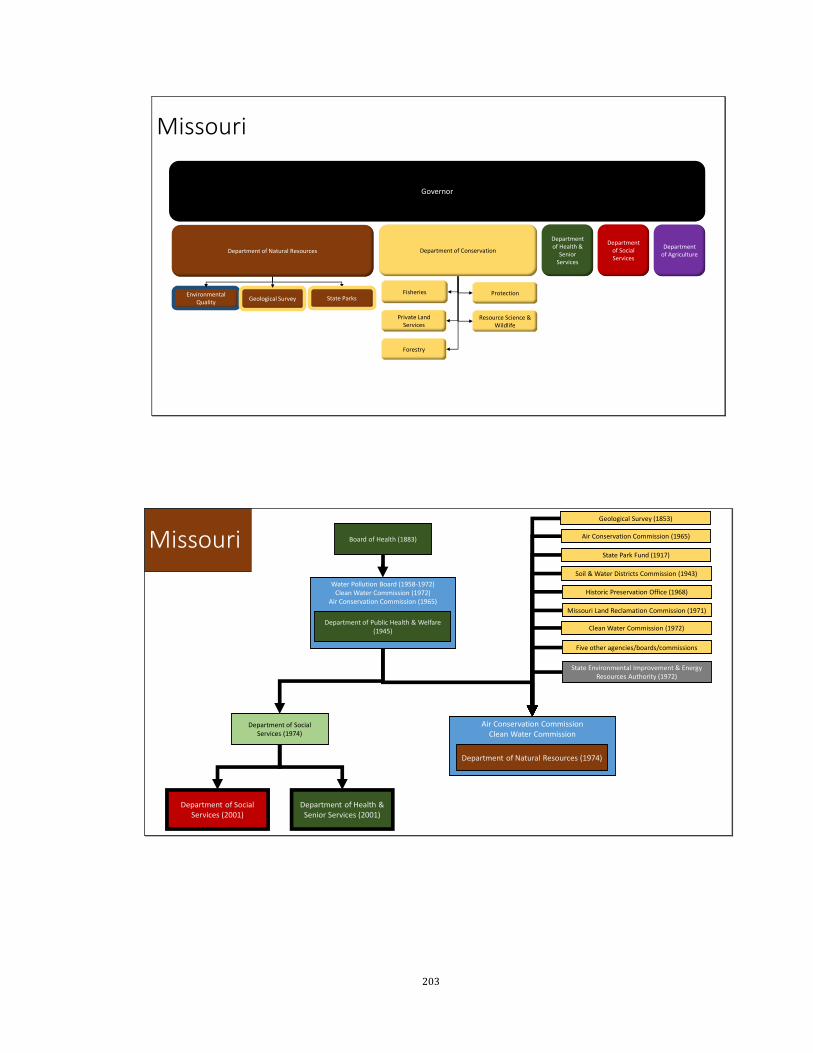
203
Missouri
Governor
Department of Agriculture
Department of Health &
Senior Services
Department of ConservationDepartment of Natural Resources
Environmental Quality
Geological Survey State Parks
Forestry
Private Land Services
Resource Science & Wildlife
Fisheries Protection
Department of Social Services
Air Conservation CommissionClean Water Commission
Water Pollution Board (1958-1972)Clean Water Commission (1972)
Air Conservation Commission (1965)
Missouri
Department of Natural Resources (1974)
Department of Public Health & Welfare (1945)
Department of Health & Senior Services (2001)
Geological Survey (1853)
State Park Fund (1917)
Soil & Water Districts Commission (1943)
Air Conservation Commission (1965)
Historic Preservation Office (1968)
Missouri Land Reclamation Commission (1971)
Clean Water Commission (1972)
State Environmental Improvement & Energy Resources Authority (1972)
Five other agencies/boards/commissions
Department of Social Services (1974)
Department of Social Services (2001)
Board of Health (1883)
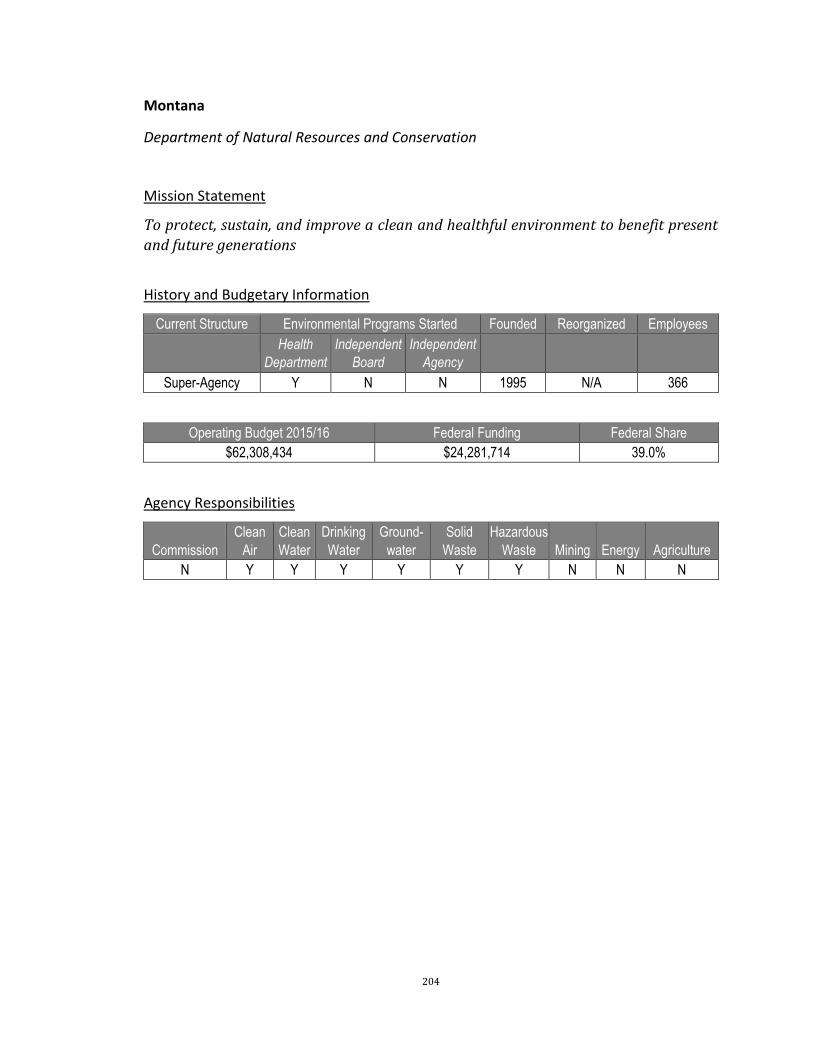
204
Montana
Department of Natural Resources and Conservation
Mission Statement
To protect, sustain, and improve a clean and healthful environment to benefit present
and future generations
History and Budgetary Information
Current Structure Environmental Programs Started Founded Reorganized Employees
Health
Department
Independent
Board
Independent
Agency
Super-Agency Y N N 1995 N/A 366
Operating Budget 2015/16 Federal Funding Federal Share
$62,308,434 $24,281,714 39.0%
Agency Responsibilities
Commission
Clean
Air
Clean
Water
Drinking
Water
Ground-
water
Solid
Waste
Hazardous
Waste Mining Energy Agriculture
N Y Y Y Y Y Y N N N

205
Missouri
Governor
Department of Agriculture
Department of Health &
Senior Services
Department of ConservationDepartment of Natural Resources
Environmental Quality
Geological Survey State Parks
Forestry
Private Land Services
Resource Science & Wildlife
Fisheries Protection
Department of Social Services
Air Conservation CommissionClean Water Commission
Water Pollution Board (1958-1972)Clean Water Commission (1972)
Air Conservation Commission (1965)
Missouri
Department of Natural Resources (1974)
Department of Public Health & Welfare (1945)
Department of Health & Senior Services (2001)
Geological Survey (1853)
State Park Fund (1917)
Soil & Water Districts Commission (1943)
Air Conservation Commission (1965)
Historic Preservation Office (1968)
Missouri Land Reclamation Commission (1971)
Clean Water Commission (1972)
State Environmental Improvement & Energy Resources Authority (1972)
Five other agencies/boards/commissions
Department of Social Services (1974)
Department of Social Services (2001)
Board of Health (1883)

206
Nebraska
Department of Environmental Quality
Mission Statement
To protect Nebraska's air, land, and water resources
History and Budgetary Information
Current Structure Environmental Programs Started Founded Reorganized Employees
Health
Department
Independent
Board
Independent
Agency
Mini-EPA Y N N 1971 N/A N/A
Operating Budget 2015/16 Federal Funding Federal Share
$74,612,962 $18,205,000 24.4%
Agency Responsibilities
Commission
Clean
Air
Clean
Water
Drinking
Water
Ground-
water
Solid
Waste
Hazardous
Waste Mining Energy Agriculture
Y Y Y Y Y Y Y N N N

207
Nebraska
Department of Environmental Quality
Governor
Secretary of Health
Services & Human Services
Public Service
Commission
Department of
Agriculture
Department of Natural Resources
Board of Geologists
Game & Parks
Commission
Power Review Board
Oil & Gas Conservation Commission
Air Quality
Waste Management
Water Quality
Environmental Control Council (1971)
Water Pollution Control Council (1957)
Nebraska
Department of Environmental Control (1971)
Department of Health (1933)
Department of Health (1971)
Board of Health (1891)
Department of Health (1918)
Environmental Control Council (1971)
Department of Environmental Quality (1992)
Board of Charities & Corrections (1900)
Department of Public Welfare (1919 - 1931)
Bureau of Pardon & Paroles
Racing Commission
Board of Commissioners of State
Institutions (1912)
Board of Control (1920)
Department of Public Institutions (1961)
Department of Public Welfare (1962)
Department of Social Services (1983)
Department of Aging (1982)
Commission on Aging (1971)
Department of Corrections (1973)
Department of Health (1971)
Health & Human Services System (1997)
Racing Commission

208
Nevada
Department of Conservation and Natural Resources
Mission Statement
To preserve and enhance the environment of the state to protect public health, sustain
healthy ecosystems and contribute to a vibrant economy
History and Budgetary Information
Current Structure Environmental Programs Started Founded Reorganized Employees
Health
Department
Independent
Board
Independent
Agency
Super-Agency Y N N 1977 N/A 643
Operating Budget 2015/16 Federal Funding Federal Share
$110,206,047 $19,837,088 18.0%
Agency Responsibilities
Commission
Clean
Air
Clean
Water
Drinking
Water
Ground-
water
Solid
Waste
Hazardous
Waste Mining Energy Agriculture
Y Y Y Y Y Y Y Y N N
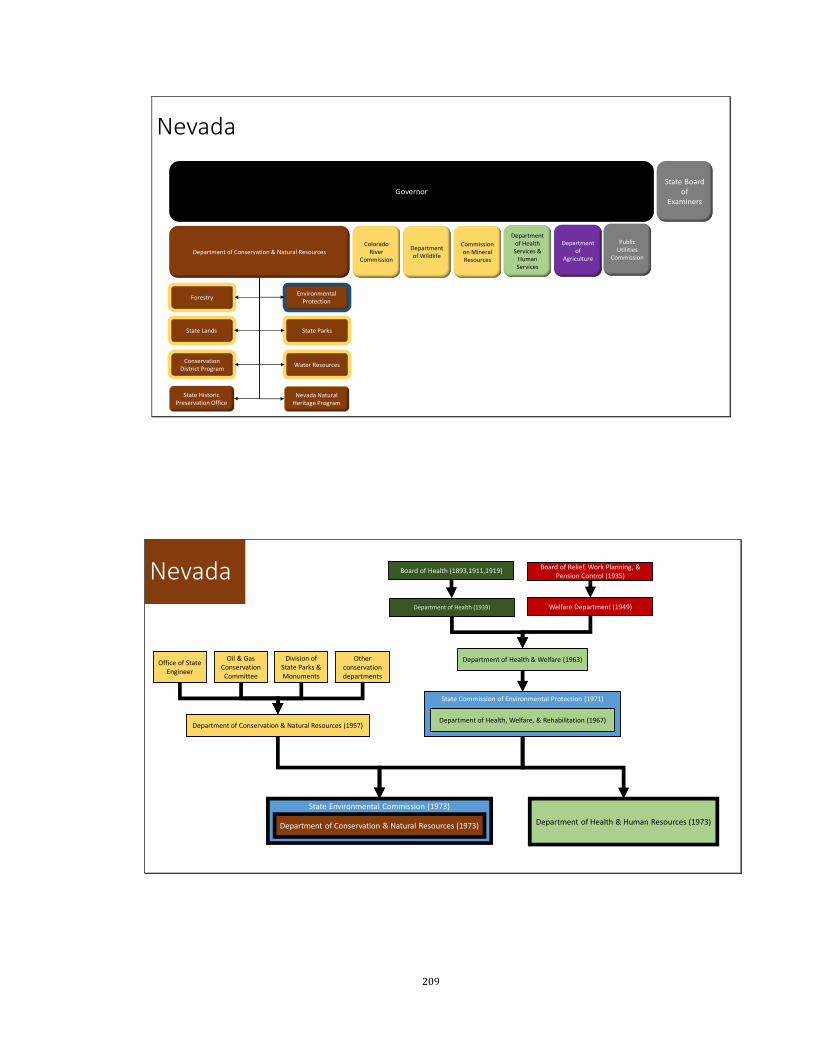
209
Nevada
Governor
Department of Health Services &
Human Services
State Board of
Examiners
Department of
AgricultureDepartment of Conservation & Natural Resources
Department of Wildlife
Colorado River
Commission
Commission on Mineral Resources
Public Utilities
Commission
Environmental Protection
Forestry
State ParksState Lands
Water ResourcesConservation
District Program
Nevada Natural Heritage Program
State Historic Preservation Office
State Commission of Environmental Protection (1971)
Nevada
State Environmental Commission (1973)
Department of Health, Welfare, & Rehabilitation (1967)
Department of Conservation & Natural Resources (1973)
Welfare Department (1949)
Department of Health & Welfare (1963)
Department of Health & Human Resources (1973)
Board of Health (1893,1911,1919)
Department of Health (1939)
Board of Relief, Work Planning, & Pension Control (1935)
Department of Conservation & Natural Resources (1957)
Office of State Engineer
Division of State Parks & Monuments
Oil & Gas Conservation Committee
Other conservation departments

210
New Hampshire
Department of Environmental Services
Mission Statement
To help sustain a high quality of life for all citizens by protecting and restoring the
environment and public health in New Hampshire
History and Budgetary Information
Current Structure Environmental Programs Started Founded Reorganized Employees
Health
Department
Independent
Board
Independent
Agency
Mini-EPA N Y N 1986 N/A 881
Operating Budget 2015/16 Federal Funding Federal Share
$284,051,893 $79,224,612 27.9%
Agency Responsibilities
Commission
Clean
Air
Clean
Water
Drinking
Water
Ground-
water
Solid
Waste
Hazardous
Waste Mining Energy Agriculture
N Y Y Y Y Y Y Y N N

211
New Hampshire
Department of Environmental Services
Governor
Department of Agriculture, Markets, &
Food
Department of Health & Human Services
Department of Resources & Economic Development
Department of Fish & Game
Air Resources Waste Management Water
Parks & Recreation
Travel & Tourism
Development
Economic Development
Forests & Lands
Water Supply & Pollution Control Commission (1965)
Air Pollution Control Commission (1967)
New Hampshire
Water Supply & Pollution Control Commission (1965)
Office of Waste Management (1981)
Department of Environmental Services (1987)
Air Resources Commission (1979)
Solid Waste Management Board
Water Pollution Commission (1955)
Department of Health & Human Services (1984)
Solid Waste Management Council (1986)
Department of Agriculture
Department of Agriculture
Department of Charities & Corrections (1895)
Board of Public Welfare (1929)
Board of Health (1881)
Department of Health (1944)
Department of Health & Welfare (1962)
Department of Health & Human Services (1987)
Department of Agriculture,
Markets. & Food
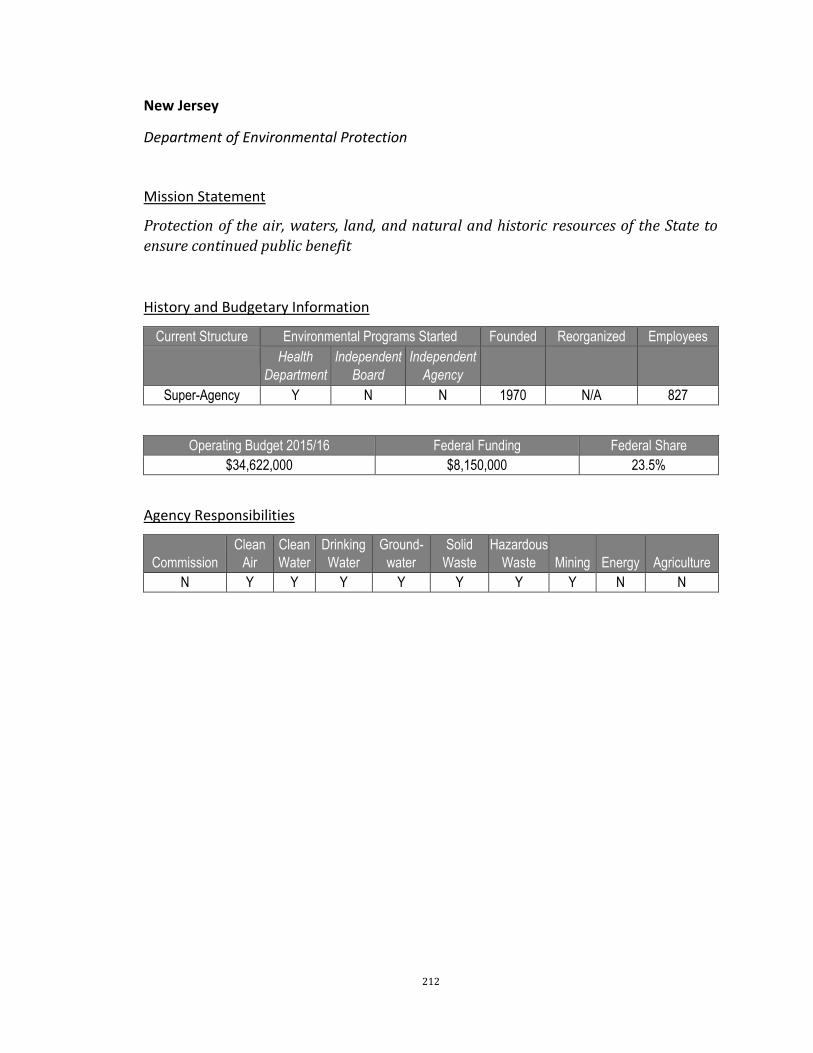
212
New Jersey
Department of Environmental Protection
Mission Statement
Protection of the air, waters, land, and natural and historic resources of the State to
ensure continued public benefit
History and Budgetary Information
Current Structure Environmental Programs Started Founded Reorganized Employees
Health
Department
Independent
Board
Independent
Agency
Super-Agency Y N N 1970 N/A 827
Operating Budget 2015/16 Federal Funding Federal Share
$34,622,000 $8,150,000 23.5%
Agency Responsibilities
Commission
Clean
Air
Clean
Water
Drinking
Water
Ground-
water
Solid
Waste
Hazardous
Waste Mining Energy Agriculture
N Y Y Y Y Y Y Y N N

213
New Jersey
Department of Environmental Protection
Governor
Department of Agriculture
Department of Health
Sustainability & Green Energy
Natural & Historic Resources
Land Use Management
Water Resources Management
Environmental Management
Site Remediation Programs
Compliance & Enforcement
Department of Human Services
Air Pollution Control Commission (1954)
New Jersey
Department of Environmental Protection (1970)
Department of Health (1915)
Department of Health (1970)
Department of Conservation & Economic
Development (1948)
Department of Economic
Development (1945)
Department of Conservation & Development (1915)
Department of Conservation (1945)
Department of Shell Fisheries (1915)
Department of Environmental Protection & Energy (1991 – 1994)
State Beach Erosion Commission (1949)
Fish and Game Council (1945)
Department of Environmental Protection (1995)
Board of Health (1877)
Department of Health & Senior Services (1996)
Department of Human Services (2012) Department of Health (2012)
Department of Human Services
(1977)
Department of Institutions &
Agencies (1919)
Department of Children &
Families (2006)
Department of Human Services
(2006)
Department of Corrections
(1977)

214
New Mexico
Department of Environment
Mission Statement
To protect and restore the environment and to foster a healthy and prosperous New
Mexico for present and future generations.
History and Budgetary Information
Current Structure Environmental Programs Started Founded Reorganized Employees
Health
Department
Independent
Board
Independent
Agency
Mini-EPA Y N N 1991 N/A N/A
Operating Budget 2015/16 Federal Funding Federal Share
$127,578,000 N/A N/A
Agency Responsibilities
Commission
Clean
Air
Clean
Water
Drinking
Water
Ground-
water
Solid
Waste
Hazardous
Waste Mining Energy Agriculture
Y Y Y Y Y Y Y N N N

215
New Mexico
Department of Environment
Governor
Department of Agriculture
Department of Health
Public Regulatory
Commission
Department of Energy, Minerals, & Natural Resources
Commissioner of Public
Lands
Resource Protection
Environmental Health
Environmental Protection
Energy Conservation & Management
State Forestry
Mines & MineralsOil Conservation
State Parks
Department of Human Services
Water Quality Control Commission (1978)Environmental Improvement Board (1978)
Council on Environmental Quality (1971-1973)
New Mexico
Department of Environment (1991)
Department of Health (1991)
Department of Health (1919)
Department of Welfare (1921)Department of Health (1935)
Health and Social Services Department (1967)
Health and Environment Department (1977)
Environmental improvement Agency (1970)Water Quality Control Commission (1967)
Department of Welfare (1921)
Department of Hospitals & Institutions
Health and Social Services Department (1967)
Department of Human Services (1977)
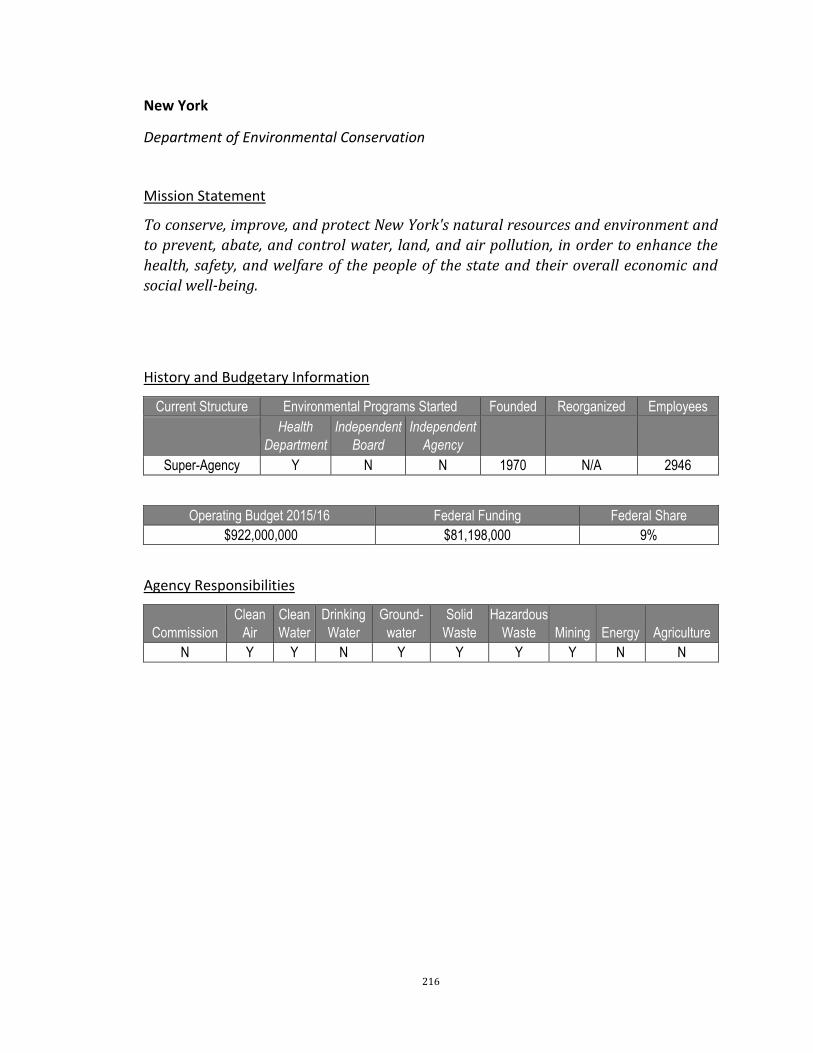
216
New York
Department of Environmental Conservation
Mission Statement
To conserve, improve, and protect New York's natural resources and environment and
to prevent, abate, and control water, land, and air pollution, in order to enhance the
health, safety, and welfare of the people of the state and their overall economic and
social well-being.
History and Budgetary Information
Current Structure Environmental Programs Started Founded Reorganized Employees
Health
Department
Independent
Board
Independent
Agency
Super-Agency Y N N 1970 N/A 2946
Operating Budget 2015/16 Federal Funding Federal Share
$922,000,000 $81,198,000 9%
Agency Responsibilities
Commission
Clean
Air
Clean
Water
Drinking
Water
Ground-
water
Solid
Waste
Hazardous
Waste Mining Energy Agriculture
N Y Y N Y Y Y Y N N

217
New York
Department of Environmental Conservation
Governor
Department of Agriculture &
Markets
Department of Health
Department of Public Service
Water Resources
Natural Resources
Air Resources, Climate Change, & Energy
Public Protection & Regional Affairs
Office of Remediation & Materials Management
NYC Resiliency & Sustainability
Department of Family
Assistance
Department of Labor
Parks, Recreation, &
Historic Preservation
Air Pollution Control Board (1957)Water Pollution Control Board (1950)
New York
Department of Environmental Protection (1970)
Forest Preserve of New York State (1885)
Fisheries, Game, and Forest Commission
(1895)
Department of Conservation (1911)
Parks, Recreation, and Historic Preservation (1970)
Water Resources Commission (1960)
Natural Beauty Commission (1966)
Water Storage Commission (1902-1903)
Water Supply Commission (1905)
River Improvement Commission
Water Power Commission (1921)
Water Control Commission (1922)
1926
Department of ConservationDepartment of Agriculture & Markets (1926)
Department of Health (1901)
Department of Agriculture and Markets (1970)
Department of Health (1970)
Board of Health (1880)
Department of Agriculture
Department of Food & Markets
Department of Weights & Measures
Department of Farm & Markets (1917)

218
North Carolina
Department of Environmental and Natural Resources
Mission Statement
To protect North Carolina's environment and natural resources.
History and Budgetary Information
Current Structure Environmental Programs Started Founded Reorganized Employees
Health
Department
Independent
Board
Independent
Agency
Super-Agency N Y N 1967 1971 1226
Operating Budget 2015/16 Federal Funding Federal Share
$102,196,685 N/A N/A
Agency Responsibilities
Commission
Clean
Air
Clean
Water
Drinking
Water
Ground-
water
Solid
Waste
Hazardous
Waste Mining Energy Agriculture
Y Y Y Y Y Y Y Y Y N
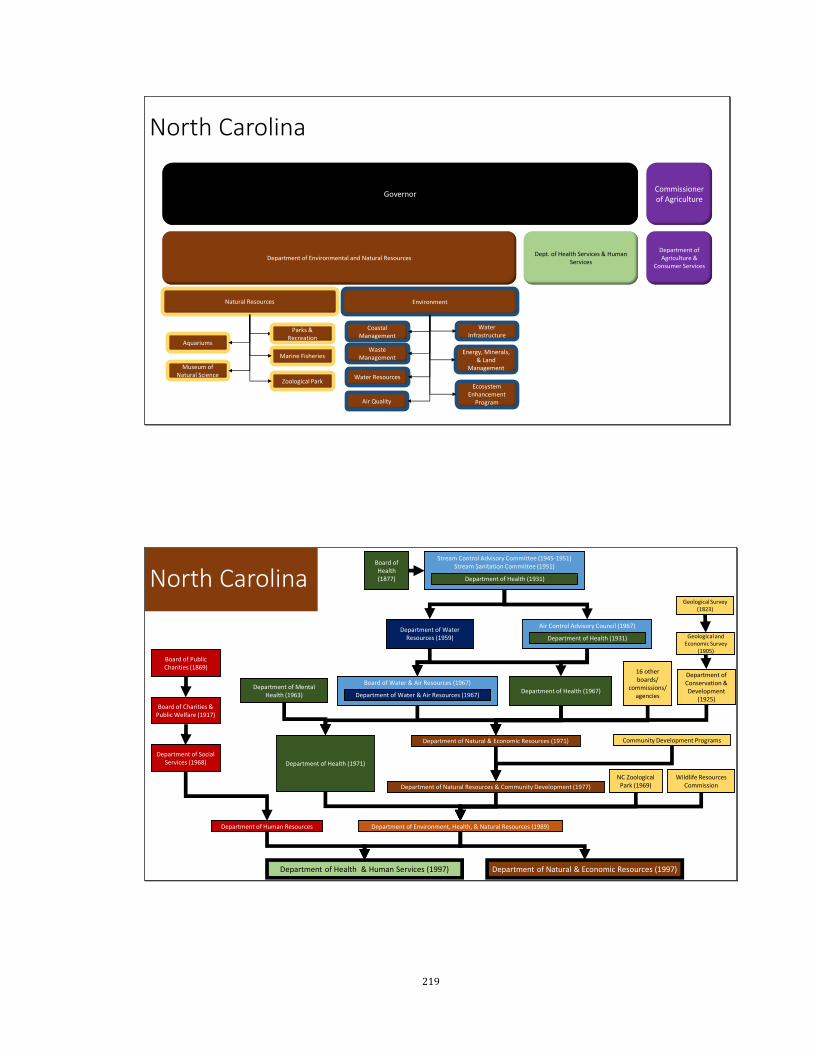
219
North Carolina
Department of Environmental and Natural Resources
Governor
Dept. of Health Services & Human Services
Commissioner of Agriculture
Department of Agriculture &
Consumer Services
Natural Resources Environment
Marine Fisheries
Zoological Park
Museum of Natural Science
Aquariums
Parks & Recreation
Coastal Management
Water Infrastructure
Ecosystem Enhancement
ProgramAir Quality
Energy, Minerals, & Land
Management
Water Resources
Waste Management
North Carolina
Department of Health (1967)
Board of Health (1877)
Department of Health & Human Services (1997)
Department of Human Resources
Department of Social Services (1968)
Board of Charities & Public Welfare (1917)
Board of Public Charities (1869)
Geological Survey (1823)
Geological and Economic Survey
(1905)
Department of Conservation & Development
(1925)
16 other boards/
commissions/ agencies
Community Development Programs
Wildlife Resources Commission
NC Zoological Park (1969)
Department of Environment, Health, & Natural Resources (1989)
Department of Natural & Economic Resources (1997)
Department of Health (1971)
Department of Mental Health (1963)
Department of Natural & Economic Resources (1971)
Department of Natural Resources & Community Development (1977)
Board of Water & Air Resources (1967)
Air Control Advisory Council (1967)
Department of Health (1931)
Department of Water Resources (1959)
Department of Water & Air Resources (1967)
Stream Control Advisory Committee (1945-1951)Stream Sanitation Committee (1951)
Department of Health (1931)

220
North Dakota
Department of Health
Mission Statement
To protect and enhance the health and safety of all North Dakotans and the
environment in which we live.
History and Budgetary Information
Current Structure Environmental Programs Started Founded Reorganized Employees
Health
Department
Independent
Board
Independent
Agency
Health N/A N/A N N/A N/A 354
Operating Budget 2015/16 Federal Funding Federal Share
$180,827,743 $116,763,623 64.6%
Agency Responsibilities
Commission
Clean
Air
Clean
Water
Drinking
Water
Ground-
water
Solid
Waste
Hazardous
Waste Mining Energy Agriculture
N Y Y N Y Y Y N N N
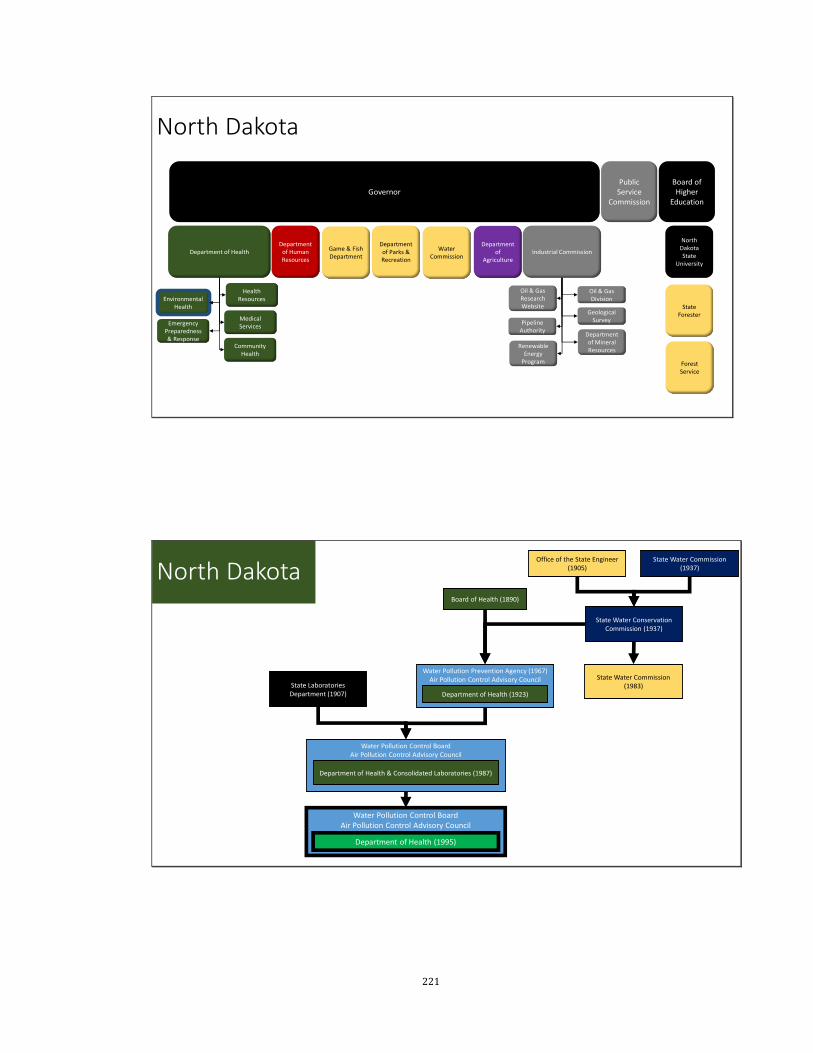
221
North Dakota
Governor
Department of Health
Public Service
Commission
Department of
Agriculture
Department of Parks & Recreation
Water Commission
Game & Fish Department
Industrial Commission
Board of Higher
Education
North Dakota State
University
State Forester
Forest Service
Emergency Preparedness & Response
Community Health
Medical Services
Environmental Health
Health Resources
Oil & Gas Research Website
Pipeline Authority
Renewable Energy
Program
Department of Mineral Resources
Geological Survey
Oil & Gas Division
Department of Human Resources
Water Pollution Control BoardAir Pollution Control Advisory Council
Water Pollution Prevention Agency (1967)Air Pollution Control Advisory Council
Water Pollution Control BoardAir Pollution Control Advisory Council
North Dakota
Department of Health (1923)
Board of Health (1890)
Department of Health & Consolidated Laboratories (1987)
State Laboratories Department (1907)
Department of Health (1995)
State Water Commission (1937)
State Water Conservation Commission (1937)
Office of the State Engineer (1905)
State Water Commission (1983)
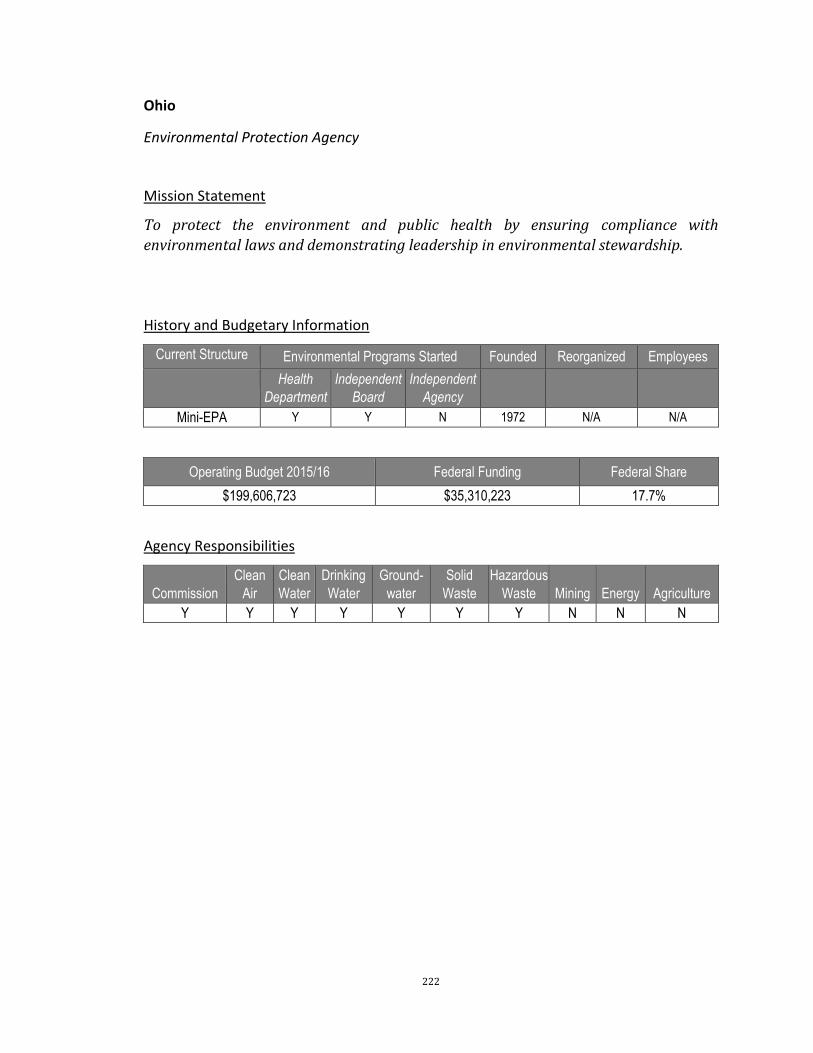
222
Ohio
Environmental Protection Agency
Mission Statement
To protect the environment and public health by ensuring compliance with
environmental laws and demonstrating leadership in environmental stewardship.
History and Budgetary Information
Current Structure Environmental Programs Started Founded Reorganized Employees
Health
Department
Independent
Board
Independent
Agency
Mini-EPA Y Y N 1972 N/A N/A
Operating Budget 2015/16 Federal Funding Federal Share
$199,606,723 $35,310,223 17.7%
Agency Responsibilities
Commission
Clean
Air
Clean
Water
Drinking
Water
Ground-
water
Solid
Waste
Hazardous
Waste Mining Energy Agriculture
Y Y Y Y Y Y Y N N N

223
Ohio
Environmental Protection Agency
Governor
Department of Health
Department of
Agriculture
Public Utilities
Commission
Air Pollution Control
Environmental & Financial Assistance
Drinking & Groundwater
Environmental Response & Revitalization
Environmental Services
Materials & Waste Management
Surface Water
Department of Natural Resources
State Parks
Watercraft
Wildlife
Natural Areas & Preserves
ForestrySoil & Water
Resources
Recycling & Litter
Prevention
Mineral Resource
Management
Geology
Department of Jobs &
Family Services
Water Pollution Control Board (1951)Air Pollution Control Board 1967)
Ohio
Environmental Protection Agency (1972)
Department of Health (1917)
Department of Health (1972)
Board of Health (1886)

224
Oklahoma
Secretary of Energy and Environment
Mission Statement
To enhance the quality of life in Oklahoma and protect the health of its citizens by
protecting, preserving, and restoring the water, land, and air of the state, thus fostering
a clean, attractive, healthy, prosperous and sustainable environment.
History and Budgetary Information
Current Structure Environmental Programs Started Founded Reorganized Employees
Health
Department
Independent
Board
Independent
Agency
Mini-EPA Y Y N 1993 N/A N/A
Operating Budget 2015/16 Federal Funding Federal Share
$81,624,000 $28,579,000 35.1%
Agency Responsibilities
Commission
Clean
Air
Clean
Water
Drinking
Water
Ground-
water
Solid
Waste
Hazardous
Waste Mining Energy Agriculture
Y Y Y Y Y Y Y N N N

225
Oklahoma
Department of Environmental Quality
Governor
Department of Health
Department of
Agriculture, Food, & Forestry
Air Quality
Land Protection
Water Quality
Water Resources Board
Secretary of Energy & Environment
Water Quality
Programs
Planning & Management
Financial Assistance
Department of Wildlife
Conservation
Energy Resources
Board
Oklahoma Mining
Commission
State Parks
Department of Tourism and Recreation
Travel Promotion
Department of Human Services
Water Resources Board (1955)
Water Resources Board (1955)Environmental Quality Board (1993)
Air Pollution Council (1963)
Oklahoma
Department of Environmental Quality (1993)
Department of Health (1907)
Department of Health (1993)
Secretary of Energy & Environment (1999)
Water Quality Coordinating Committee (1965)
Wildlife Conservation Commission
Corporation Commission
Department of Health
Department of Agriculture
Department of Industrial Development
Pollution Control Coordinating Board
Department of Pollution Control (1968)
Board of Health (1907)
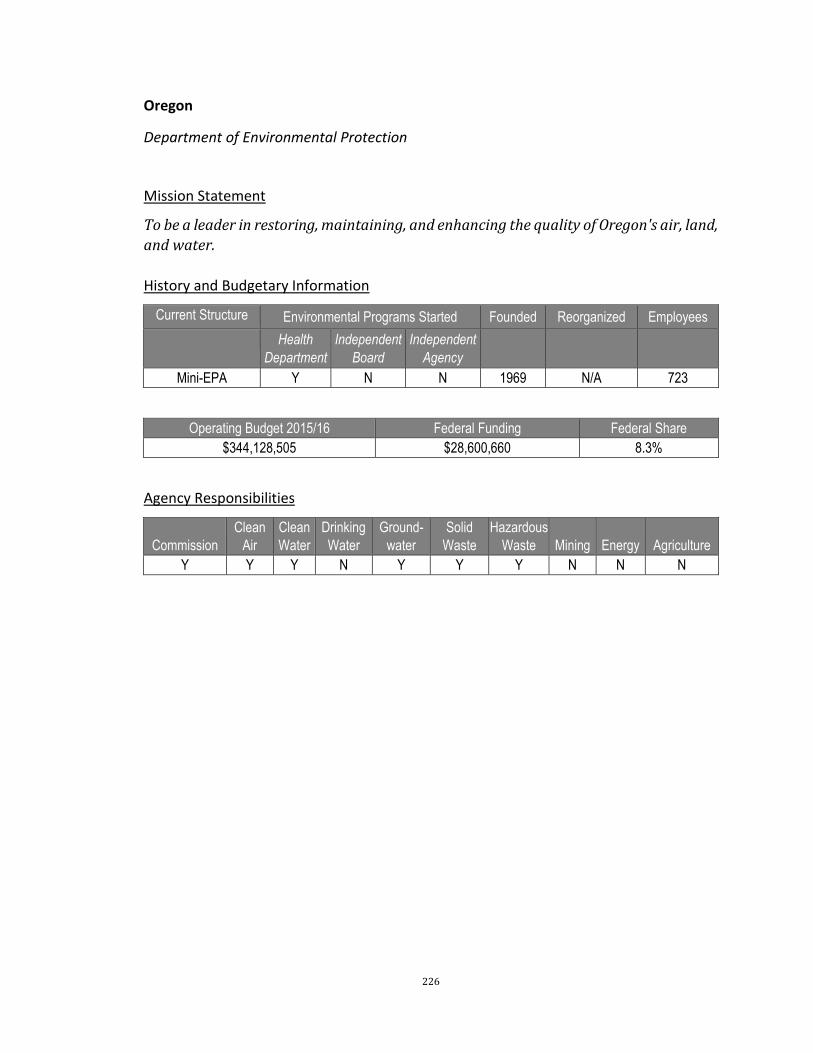
226
Oregon
Department of Environmental Protection
Mission Statement
To be a leader in restoring, maintaining, and enhancing the quality of Oregon's air, land,
and water.
History and Budgetary Information
Current Structure Environmental Programs Started Founded Reorganized Employees
Health
Department
Independent
Board
Independent
Agency
Mini-EPA Y N N 1969 N/A 723
Operating Budget 2015/16 Federal Funding Federal Share
$344,128,505 $28,600,660 8.3%
Agency Responsibilities
Commission
Clean
Air
Clean
Water
Drinking
Water
Ground-
water
Solid
Waste
Hazardous
Waste Mining Energy Agriculture
Y Y Y N Y Y Y N N N
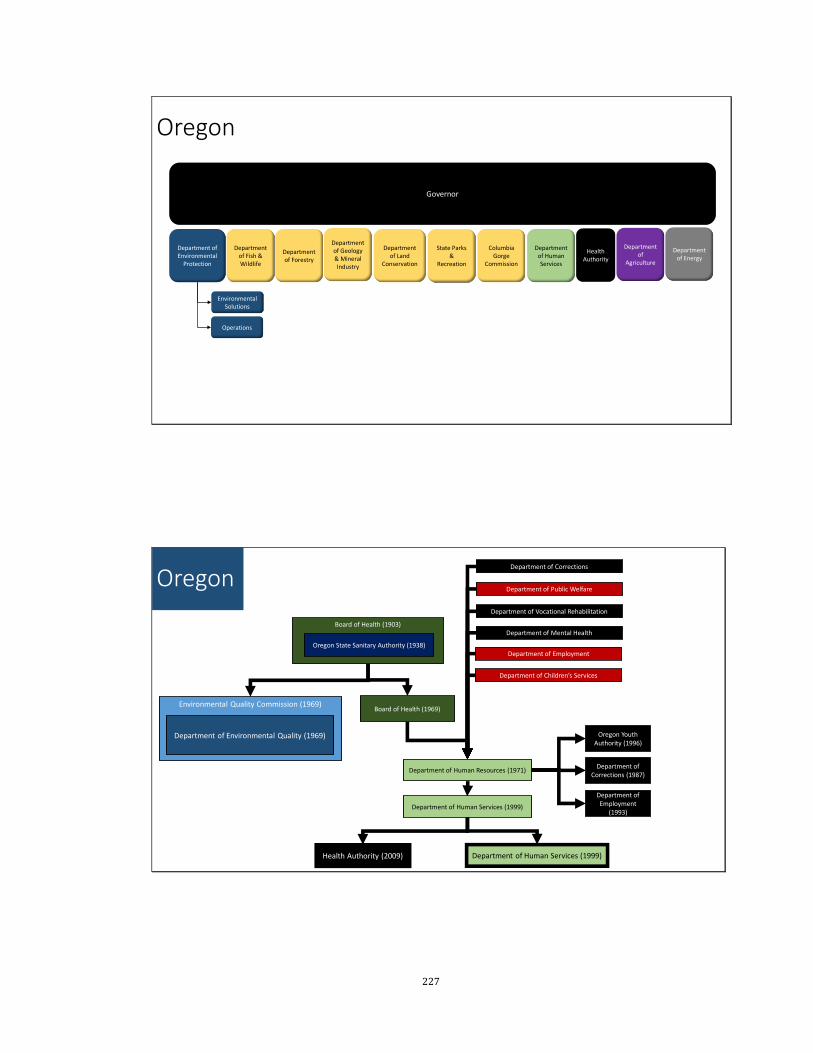
227
Oregon
Department of Environmental
Protection
Governor
Health Authority
Department of
Agriculture
Department of Energy
Department of Fish & Wildlife
Department of Forestry
Department of Geology & Mineral Industry
Department of Land
Conservation
Columbia Gorge
Commission
Operations
Environmental Solutions
State Parks &
Recreation
Department of Human Services
Board of Health (1903)
Oregon State Sanitary Authority (1938)
Environmental Quality Commission (1969)
Oregon
Department of Environmental Quality (1969)
Board of Health (1969)
Department of Human Resources (1971)
Department of Public Welfare
Department of Children’s Services
Department of Mental Health
Department of Corrections
Department of Employment
Department of Vocational Rehabilitation
Department of Human Services (1999)
Health Authority (2009) Department of Human Services (1999)
Oregon Youth Authority (1996)
Department of Corrections (1987)
Department of Employment
(1993)
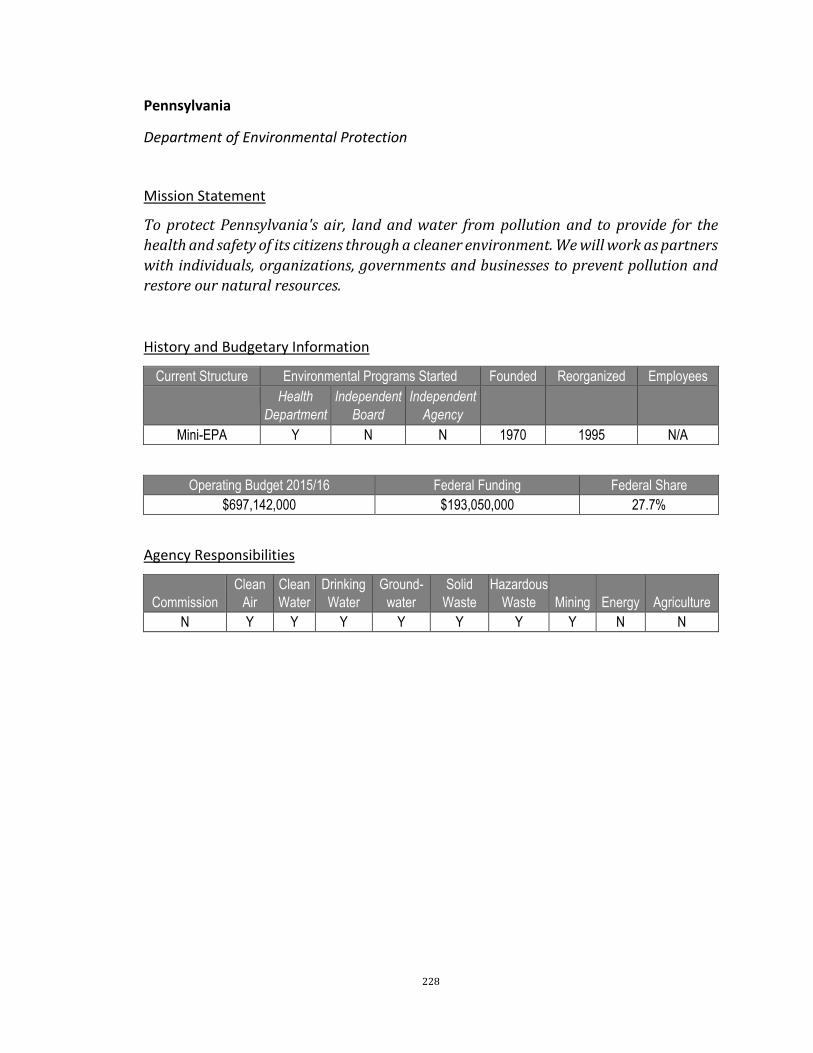
228
Pennsylvania
Department of Environmental Protection
Mission Statement
To protect Pennsylvania's air, land and water from pollution and to provide for the
health and safety of its citizens through a cleaner environment. We will work as partners
with individuals, organizations, governments and businesses to prevent pollution and
restore our natural resources.
History and Budgetary Information
Current Structure Environmental Programs Started Founded Reorganized Employees
Health
Department
Independent
Board
Independent
Agency
Mini-EPA Y N N 1970 1995 N/A
Operating Budget 2015/16 Federal Funding Federal Share
$697,142,000 $193,050,000 27.7%
Agency Responsibilities
Commission
Clean
Air
Clean
Water
Drinking
Water
Ground-
water
Solid
Waste
Hazardous
Waste Mining Energy Agriculture
N Y Y Y Y Y Y Y N N
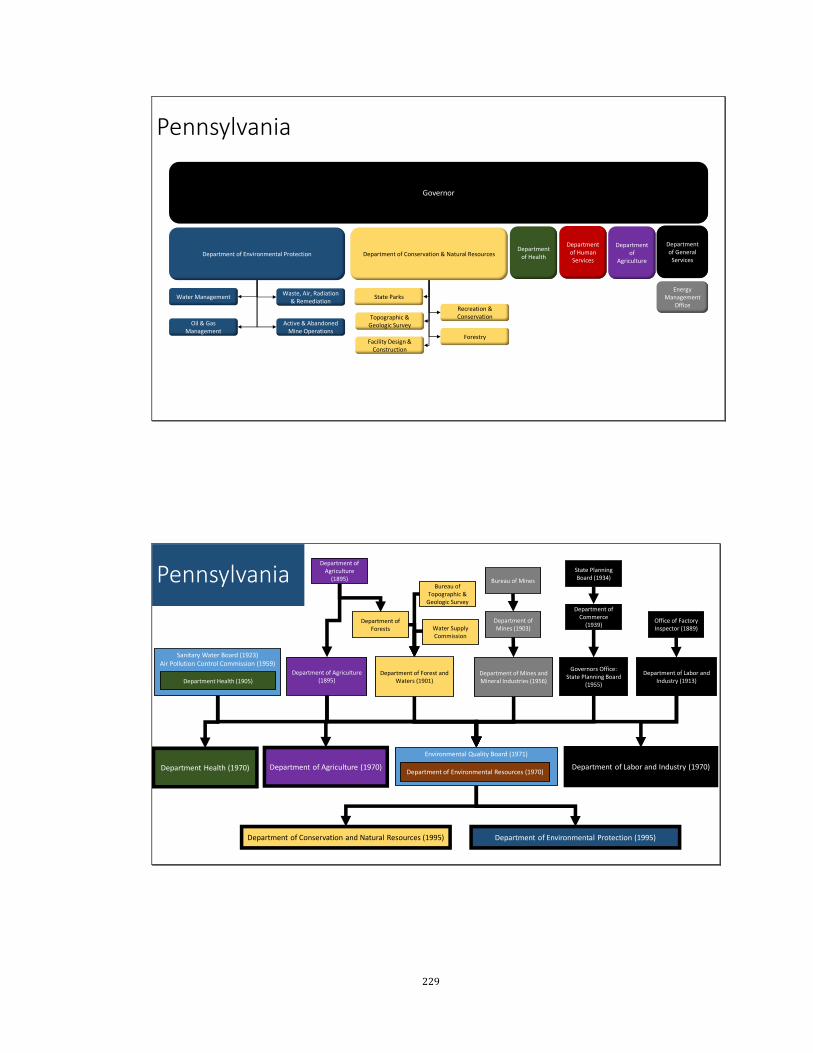
229
Pennsylvania
Department of Environmental Protection
Governor
Department of Health
Department of
AgricultureDepartment of Conservation & Natural Resources
Waste, Air, Radiation & Remediation
Water Management
Active & Abandoned Mine Operations
Oil & Gas Management
State Parks
Topographic & Geologic Survey
Facility Design & Construction
Forestry
Recreation & Conservation
Department of General
Services
Energy Management
Office
Department of Human Services
Environmental Quality Board (1971)
Sanitary Water Board (1923)Air Pollution Control Commission (1959)
Pennsylvania
Department of Agriculture (1895)Department Health (1905)
Department of Environmental Protection (1995)
Department of Environmental Resources (1970)
Department of Conservation and Natural Resources (1995)
Department of Forest and Waters (1901)
Department of Mines and Mineral Industries (1956)
Department of Labor and Industry (1913)
Governors Office: State Planning Board
(1955)
Department of Agriculture (1970)
Department of Forests Water Supply
Commission
Bureau of Topographic &
Geologic Survey
Department of Agriculture
(1895)
Department of Mines (1903)
Bureau of Mines
Office of Factory Inspector (1889)
Department of Labor and Industry (1970)Department Health (1970)
State Planning Board (1934)
Department of Commerce
(1939)
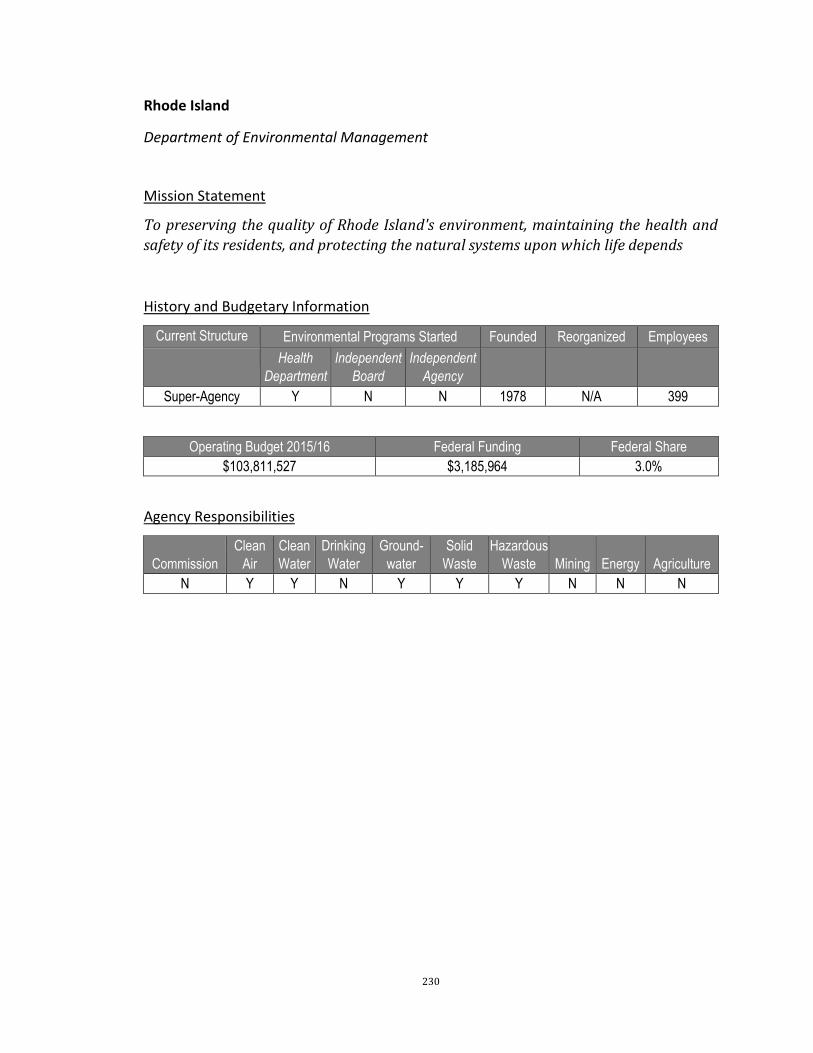
230
Rhode Island
Department of Environmental Management
Mission Statement
To preserving the quality of Rhode Island's environment, maintaining the health and
safety of its residents, and protecting the natural systems upon which life depends
History and Budgetary Information
Current Structure Environmental Programs Started Founded Reorganized Employees
Health
Department
Independent
Board
Independent
Agency
Super-Agency Y N N 1978 N/A 399
Operating Budget 2015/16 Federal Funding Federal Share
$103,811,527 $3,185,964 3.0%
Agency Responsibilities
Commission
Clean
Air
Clean
Water
Drinking
Water
Ground-
water
Solid
Waste
Hazardous
Waste Mining Energy Agriculture
N Y Y N Y Y Y N N N
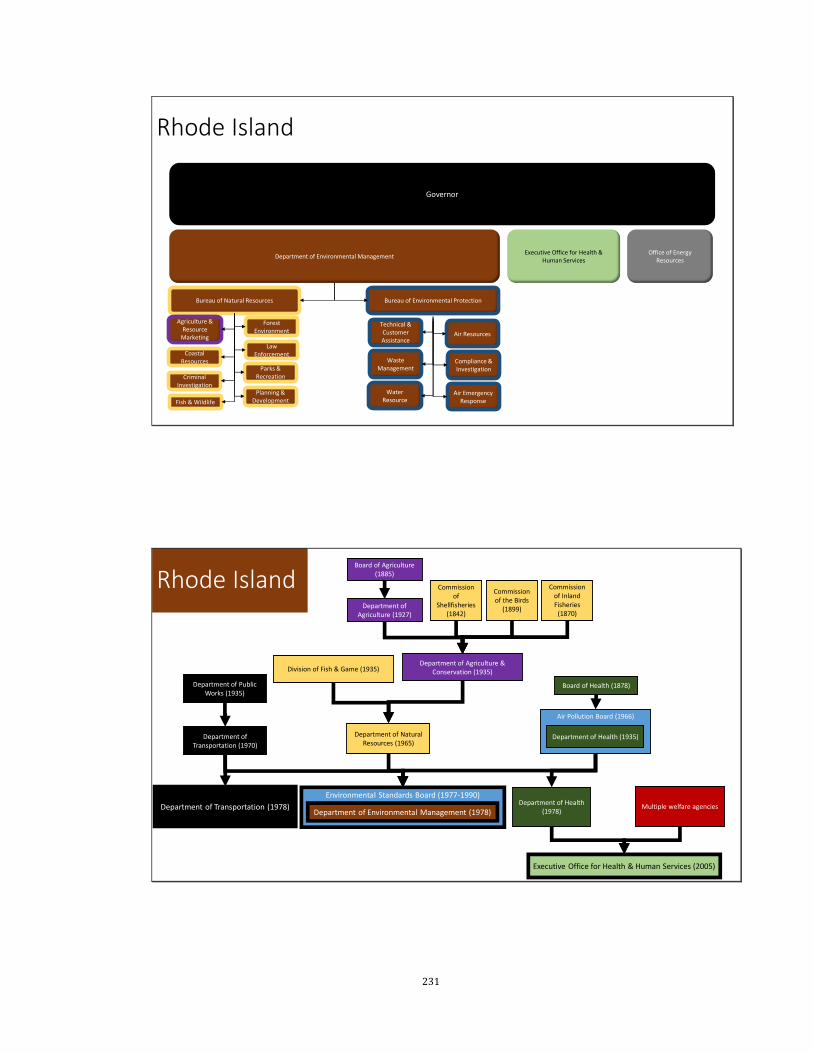
231
Rhode Island
Department of Environmental Management
Governor
Executive Office for Health & Human Services
Bureau of Environmental ProtectionBureau of Natural Resources
Air Resources
Agriculture & Resource
Marketing
Coastal Resources
Criminal Investigation
Fish & Wildlife
Forest Environment
Law Enforcement
Parks & Recreation
Planning & Development
Compliance & Investigation
Air Emergency Response
Technical & Customer Assistance
Waste Management
Water Resource
Office of Energy Resources
Air Pollution Board (1966)
Environmental Standards Board (1977-1990)
Rhode Island
Department of Environmental Management (1978)
Department of Health (1935)
Division of Fish & Game (1935)
Department of Natural Resources (1965)
Department of Agriculture & Conservation (1935)
Department of Transportation (1970)
Department of Transportation (1978)
Board of Health (1878)
Commission of
Shellfisheries (1842)
Commission of Inland Fisheries
(1870)
Commission of the Birds
(1899)Department of Agriculture (1927)
Board of Agriculture (1885)
Department of Health (1978)
Department of Public Works (1935)
Executive Office for Health & Human Services (2005)
Multiple welfare agencies

232
South Carolina
Department of Health and Environmental Control
Mission Statement
To promote and protect the public and the environment.
History and Budgetary Information
Current Structure Environmental Programs Started Founded Reorganized Employees
Health
Department
Independent
Board
Independent
Agency
Health Y Y N 1970 1973 3400
Operating Budget 2015/16 Federal Funding Federal Share
$593,900,859 N/A N/A
Agency Responsibilities
Commission
Clean
Air
Clean
Water
Drinking
Water
Ground-
water
Solid
Waste
Hazardous
Waste Mining Energy Agriculture
Y Y Y Y N Y Y N N N

233
South Carolina
Governor
Board of Health & Environmental Control
Department of
AgricultureNatural Resources Board
Department of Natural ResourcesDepartment of Health & Environmental
Control
Ocean and Coastal Resource Management
Public Health
Environmental Affairs
Air Quality
Environmental Health Services
Land and Waste Management
Water
Health Regulation
Client Services
Preventative Services
Office of Public Health Preparedness
Conservation Education &
Communication
Land, Water, & Conservation
Law Enforcement
Marine
Wildlife & Freshwater Fisheries
Parks, Recreation, & Tourism
Budget and Control Board
Energy Office
Government Affairs
Public Service
Commission
Department of Health &
Human Services
Department of Social Services
Pollution Control Authority (1965)
Board of Health & Environmental Control (1973)
South Carolina
Pollution Control Authority (1970)
Board of Health (1970)
Department of Health & Environmental Control (1973)
Board of Health
Water Pollution Control Authority (1950)
Board of Health (1879)
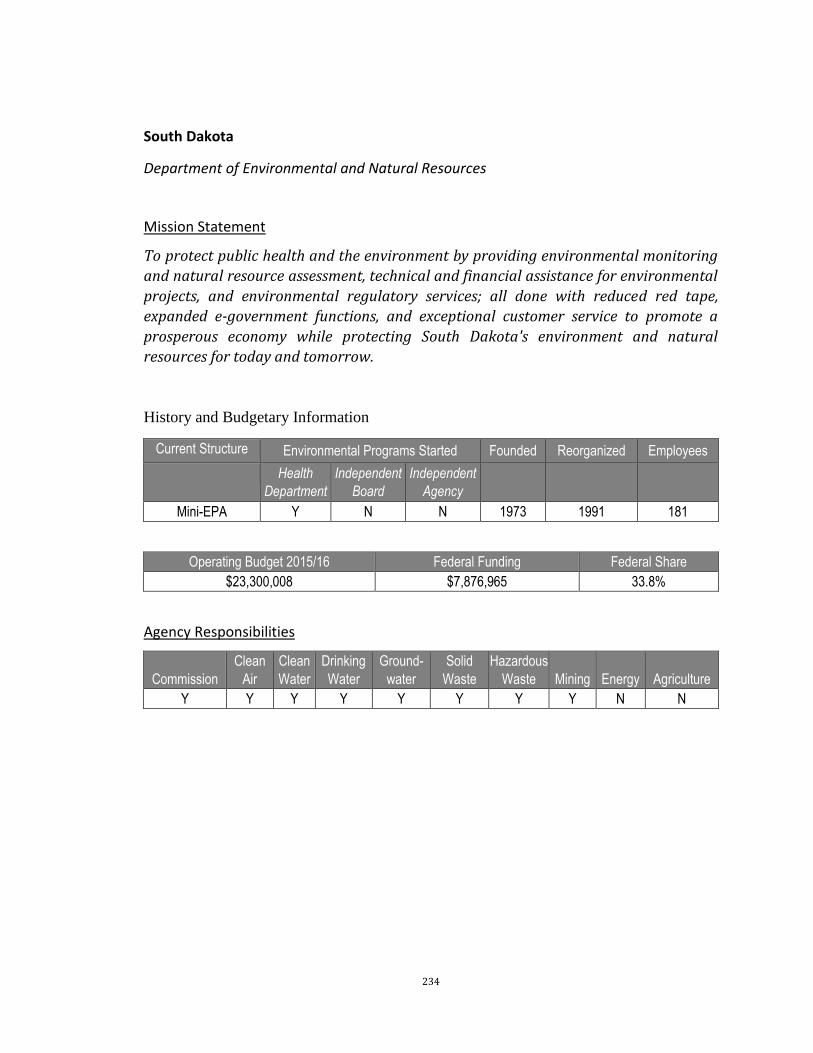
234
South Dakota
Department of Environmental and Natural Resources
Mission Statement
To protect public health and the environment by providing environmental monitoring
and natural resource assessment, technical and financial assistance for environmental
projects, and environmental regulatory services; all done with reduced red tape,
expanded e-government functions, and exceptional customer service to promote a
prosperous economy while protecting South Dakota's environment and natural
resources for today and tomorrow.
History and Budgetary Information
Current Structure Environmental Programs Started Founded Reorganized Employees
Health
Department
Independent
Board
Independent
Agency
Mini-EPA Y N N 1973 1991 181
Operating Budget 2015/16 Federal Funding Federal Share
$23,300,008 $7,876,965 33.8%
Agency Responsibilities
Commission
Clean
Air
Clean
Water
Drinking
Water
Ground-
water
Solid
Waste
Hazardous
Waste Mining Energy Agriculture
Y Y Y Y Y Y Y Y N N

235
South Dakota
Governor
Department of Environment & Natural ResourcesDepartment
of Agriculture
Department of Game,
Fish, & Parks
Drinking Water
Air Quality
Groundwater Quality
Surface Water Quality
Water RightsGeological Survey
Water & Waste Funding
Feedlot Permit
Minerals & Mining
Waste Management
Public Service
Commission
Financial & Technical AssistanceEnvironmental Services
Petroleum Release
Compensation Fund
Watershed Protection
Department of Social Services
Department of Health
Water Management Board (1955)Board of Water & Natural Resources (1973)
Board of Minerals & Environment (1981)
Water Management Board (1955)
South Dakota
Department of Health (1946)
Department of Natural Resource Development
Department of Environmental Protection (1973)
Water Management Board (1955)Board of Water & Natural Resources (1973)
Board of Minerals & Environment (1981)
Department of Water and Natural Resources (1979)
Water Management Board (1955)Board of Water & Natural Resources (1973)
Board of Minerals & Environment (1981)
Department of Environment & Natural Resources (1991)
Board of Health (1891)
Department of Health (1973)
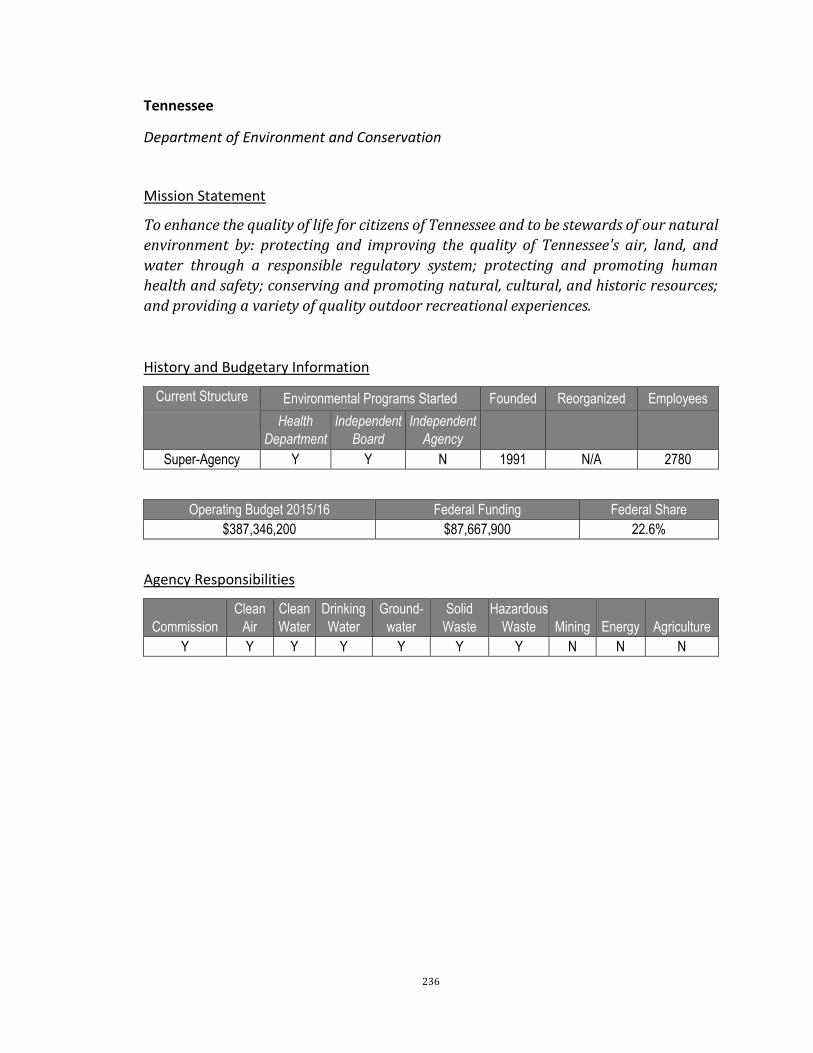
236
Tennessee
Department of Environment and Conservation
Mission Statement
To enhance the quality of life for citizens of Tennessee and to be stewards of our natural
environment by: protecting and improving the quality of Tennessee's air, land, and
water through a responsible regulatory system; protecting and promoting human
health and safety; conserving and promoting natural, cultural, and historic resources;
and providing a variety of quality outdoor recreational experiences.
History and Budgetary Information
Current Structure Environmental Programs Started Founded Reorganized Employees
Health
Department
Independent
Board
Independent
Agency
Super-Agency Y Y N 1991 N/A 2780
Operating Budget 2015/16 Federal Funding Federal Share
$387,346,200 $87,667,900 22.6%
Agency Responsibilities
Commission
Clean
Air
Clean
Water
Drinking
Water
Ground-
water
Solid
Waste
Hazardous
Waste Mining Energy Agriculture
Y Y Y Y Y Y Y N N N

237
Tennessee
Department of Environmental and Conservation
Governor
Department of Health
Department of
Agriculture
Air Pollution Control
Geology
Radiological Health
Solid Waste Management
Remediation
Wildlife Resources Agency
Fish & Wildlife Commission
Wildlife & Forestry
Management
Fish Management
Boating & Law Enforcement
Environmental Services
Engineering & Real Estate
Bureau of Environment Bureau of Parks & Conservation
Underground Storage Tanks
West TN River Basin
Water Resources
Archeology
Facilities Management
Interpretive Programs & Education
Marketing & Product
Development
Recreation Education Services
Natural AreasState Parks Operations
Office of Energy Programs
Department of Human Services
Air Pollution Control Board (1967)Underground Petroleum Storage Tank Board (1963)
Board of Water Quality, Oil, & Gas (1971)
Air Pollution Control Board (1967)Underground Petroleum Storage Tank Board (1963)
Board of Water Quality, Oil, & Gas (1971)
Air Pollution Control Board (1967)Underground Petroleum Storage Tank Board (1963)
Board of Water Quality, Oil, & Gas (1971)
Tennessee
Department of Environment and Conservation (1991)
Department of Health and Environment (1983)
Department of Public Health (1923)
Department of Conservation (1937)
Department of Health (1991)

238
Texas
Commission on Environmental Quality
Mission Statement
To protect our state's public health and natural resources, consistent with sustainable
economic development. Our goal is clean air, clean water, and safe management of
waste
History and Budgetary Information
Current Structure Environmental Programs Started Founded Reorganized Employees
Health
Department
Independent
Board
Independent
Agency
Mini-EPA N Y N 1993 N/A 2780
Operating Budget 2015/16 Federal Funding Federal Share
$477,748,034 $43,100,000 9.0%
Agency Responsibilities
Commission
Clean
Air
Clean
Water
Drinking
Water
Ground-
water
Solid
Waste
Hazardous
Waste Mining Energy Agriculture
Y Y Y Y Y Y Y Y Y N

239
Texas
Commission on Environmental Conservation
Governor
Department of
Agriculture
Parks & Wildlife
Compliance & Enforcement
Legal Services Air
Waste
Water
Administrative Services
Department of
Agriculture
Public Utilities
Commission
Health & Human Services Commission
Texas Air Control Board (1966)
Texas Air Control Board (1966)
Texas Air Control Board (1966)
Department of Health (1977)
TexasTexas Board of
Water Engineers (1913)
Texas Water Commission (1985)
Texas Natural Resource Conservation Commission (1993)
Texas Commission on Environmental Quality (2002)
Texas Water Rights Commission (1965)
Texas Water Commission
(1962)
Texas Water Development Board
(1957)
Texas Department of Water Resources (1977)
Texas Water Development Board (1985)
Texas Water Pollution Control Advisory Board
(1953)
Texas Water Pollution Control
Board (1961)
Texas Water Quality Board (1967)
Air Control Board (1973)
Department of Health (1973)
Department of Health (1909)
Quarantine Department (1879)
Department of Health & Vital Statistics (1903)
Department of Health Resources (1975)
Health & Human Services Commission (2003)
11 other health and welfare
agencies

240
Utah
Department of Environmental Quality
Mission Statement
To safeguard human health and quality of life by protecting and enhancing the
environment.
History and Budgetary Information
Current Structure Environmental Programs Started Founded Reorganized Employees
Health
Department
Independent
Board
Independent
Agency
Mini-EPA Y N N 1991 N/A N/A
Operating Budget 2015/16 Federal Funding Federal Share
$60,484,000 $17,929,400 29.6%
Agency Responsibilities
Commission
Clean
Air
Clean
Water
Drinking
Water
Ground-
water
Solid
Waste
Hazardous
Waste Mining Energy Agriculture
N Y Y Y N Y Y N N N

241
Utah
Department of Environmental Quality
Governor
Department of Health
Department of
Agriculture & Food
Department of Natural ResourcesPublic Service
Commission
Air Quality
Drinking Water
Environmental Response & Remediation
Solid & Hazardous Waste
Radiation Control
Water Quality
Forestry, Fire, & State Lands
Oil, Gas, & Mining
Parks & Recreation
Utah Geological Survey
Water Resources
Water Rights
Wildlife Resources
Department of Human Services
Water Pollution Control Committee (1967Air Conservation Council (1967)
Solid and Hazardous Waste Committee (1979)
Air Quality Board (1991)Drinking Water Board (1981)
Radiation Control Board Solid and Hazardous Waste Control Board (1991)
Water Quality Board (2002)
Water Pollution Control Committee (1967)Air Conservation Council (1967)
Utah
Department of Environmental Quality (1991)
Department of Health & Welfare (1967)
Department of Social Services (1969)
Department of Human Services (1990)
Department of Public Welfare
Other Boards & Agencies
Department of Health (1990)
Water Pollution Control Board (1953)
Department of Public Health
Board of Health (1898)

242
Vermont
Agency of Natural Resources
Mission Statement
To draw from and build upon Vermonters' shared ethic of responsibility for our natural
environment, an ethic that encompasses a sense of place, community and quality of life,
and understanding that we are an integral part of the environment and that we must
all be responsible stewards for this and future generations.
History and Budgetary Information
Current Structure Environmental Programs Started Founded Reorganized Employees
Health
Department
Independent
Board
Independent
Agency
Super-Agency Y (air) N Y (water) 1969 1988, 2013 291
Operating Budget 2015/16 Federal Funding Federal Share
$48,978,277 $10,846,407 22.1%
Agency Responsibilities
Commission
Clean
Air
Clean
Water
Drinking
Water
Ground-
water
Solid
Waste
Hazardous
Waste Mining Energy Agriculture
Y Y Y Y Y Y Y N N N
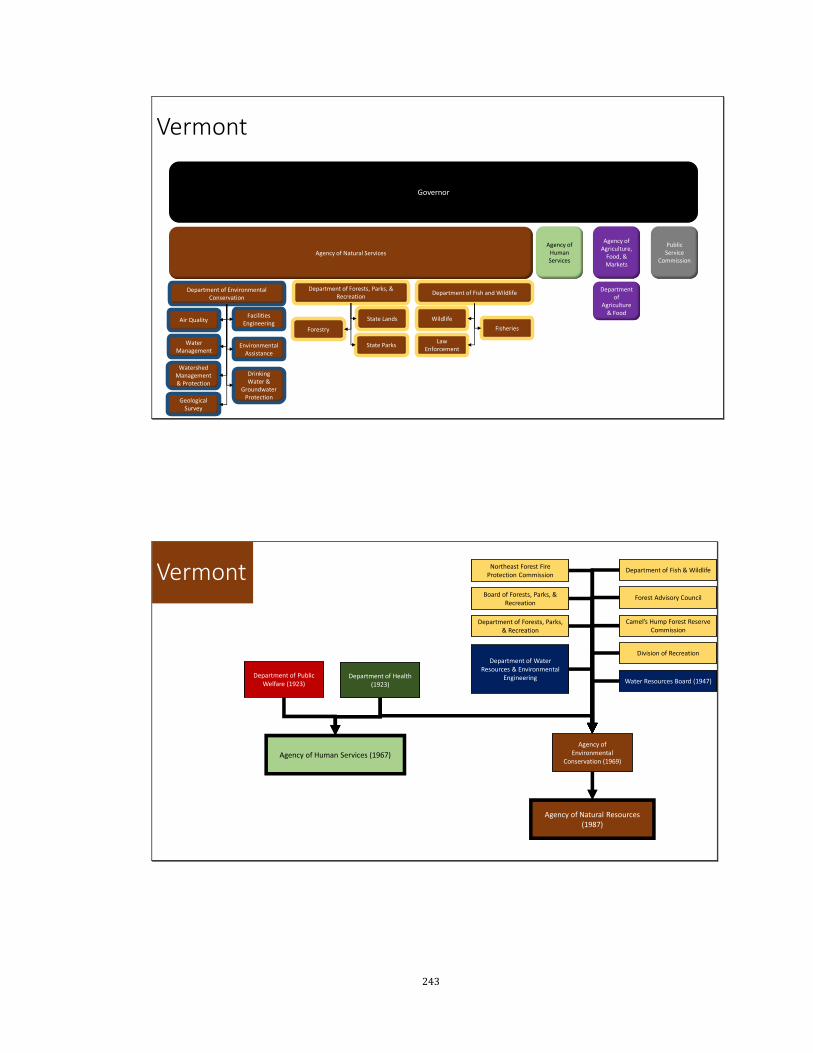
243
Vermont
Agency of Natural Services
Governor
Agency of Human Services
Department of
Agriculture & Food
Public Service
Commission
Air Quality
Department of Environmental Conservation
Department of Forests, Parks, & Recreation
Department of Fish and Wildlife
Water Management
Facilities Engineering
Watershed Management & Protection
Drinking Water &
Groundwater Protection
Environmental Assistance
Geological Survey
Forestry
Law Enforcement
Wildlife
Fisheries
State Parks
State Lands
Agency of Agriculture,
Food, & Markets
Department of Water Resources & Environmental
Engineering
Vermont
Agency of Natural Resources (1987)
Department of Health (1923)
Agency of Human Services (1967)
Agency of Environmental
Conservation (1969)
Department of Fish & Wildlife
Department of Forests, Parks, & Recreation
Board of Forests, Parks, & Recreation
Division of Recreation
Camel’s Hump Forest Reserve Commission
Northeast Forest Fire Protection Commission
Forest Advisory Council
Water Resources Board (1947)Department of Public
Welfare (1923)

244
Virginia
Secretary of Natural Resources
Mission Statement
To protect and improve the environment for the well-being of all Virginians.
History and Budgetary Information
Current Structure Environmental Programs Started Founded Reorganized Employees
Health
Department
Independent
Board
Independent
Agency
Mini-EPA N Y N 1993 N/A 413
Operating Budget 2015/16 Federal Funding Federal Share
$68,288,217 N/A N/A
Agency Responsibilities
Commission
Clean
Air
Clean
Water
Drinking
Water
Ground-
water
Solid
Waste
Hazardous
Waste Mining Energy Agriculture
Y Y Y N Y Y N N N N

245
Virginia
Secretary of Natural Resources
Governor
Secretary of Health and Human Resources
Secretary of Agriculture & Forestry
Department of Environmental
Quality
Secretary of Commerce & Trade
Virginia Resources Authority
Dept. of Mines,
Minerals, & Energy
Department of Health
Department of Conservation
and Recreation
Department of Fish & Game
Marine Resources
Commission
Museum of Natural History
Air
Water
Land Protection & Revitalization
Department of Social Services
Virginia
Secretary of Economic Development (1986)
Secretary of Natural Resources (1986)
Water Pollution Control Board
Department of Waste
Management
Department of Air Pollution
Control
Secretary of Commerce and Resources (1972)
Secretary of Agriculture and Forestry (2004)
Secretary of Commerce and
Trade (2004)
Secretary of Commerce and Trade (1993)
Department of Environmental Quality
(1993)
State Water Pollution Control Board (1946)
Multiple Boards/agencies
Marine Resources
Commission
Air Pollution Control Board (1966)

246
Washington
Department of Ecology
Mission Statement
To protect, preserve and enhance Washington's environment for current and future
generations.
History and Budgetary Information
Current Structure Environmental Programs Started Founded Reorganized Employees
Health
Department
Independent
Board
Independent
Agency
Mini-EPA Y (solid
waste)
Y (air and
water) N 1970 N/A 1676
Operating Budget 2015/16 Federal Funding Federal Share
$503,137,000 $104,167,000 20.7%
Agency Responsibilities
Commission
Clean
Air
Clean
Water
Drinking
Water
Ground-
water
Solid
Waste
Hazardous
Waste Mining Energy Agriculture
N Y Y N Y Y Y N N N
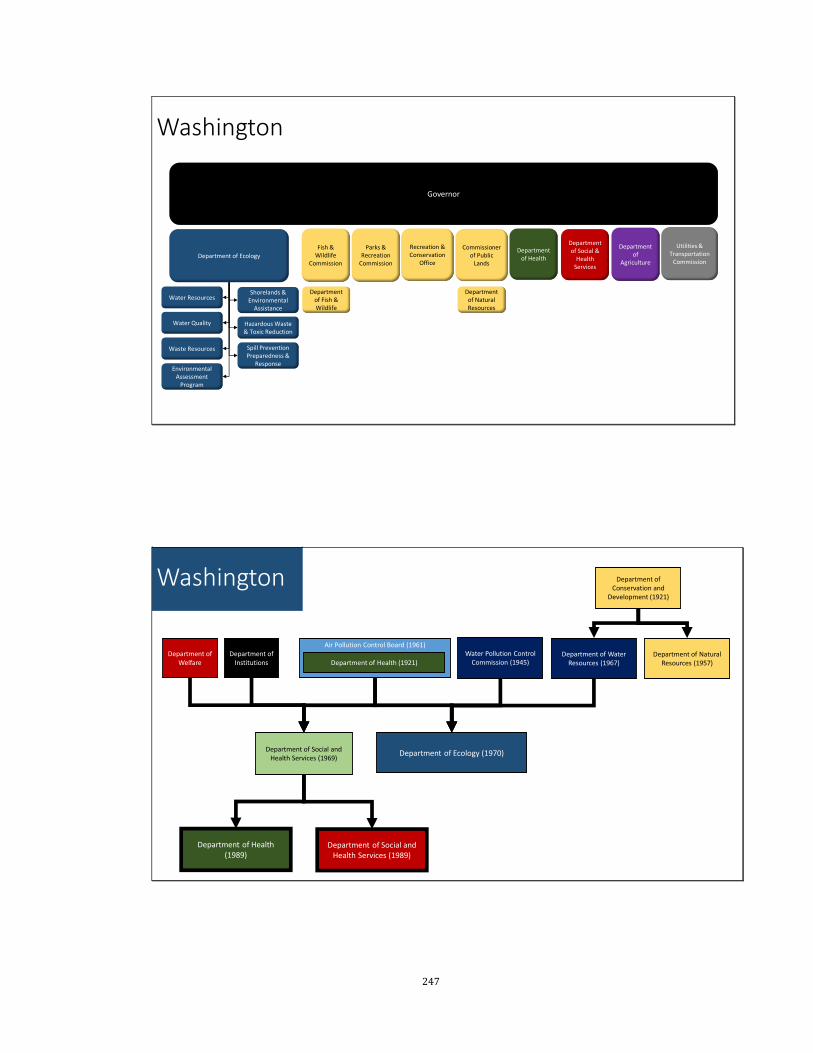
247
Washington
Department of Ecology
Governor
Department of Health
Department of
Agriculture
Recreation & Conservation
Office
Utilities & Transportation
Commission
Parks & Recreation
Commission
Department of Fish & Wildlife
Fish & Wildlife
Commission
Water Resources
Water Quality
Shorelands & Environmental
Assistance
Waste Resources
Hazardous Waste & Toxic Reduction
Environmental Assessment
Program
Spill Prevention Preparedness &
Response
Department of Natural Resources
Commissioner of Public
Lands
Department of Social &
Health Services
Air Pollution Control Board (1961)
Washington
Department of Ecology (1970)
Water Pollution Control Commission (1945)
Department of Water Resources (1967)
Department of Conservation and
Development (1921)
Department of Natural Resources (1957)
Department of Social and Health Services (1969)
Department of Health (1989)
Department of Social and Health Services (1989)
Department of Health (1921)Department of
InstitutionsDepartment of
Welfare

248
West Virginia
Department of Environmental Protection
Mission Statement
To protect the environment while leaving room for a sustainable industry base.
History and Budgetary Information
Current Structure Environmental Programs Started Founded Reorganized Employees
Health
Department
Independent
Board
Independent
Agency
Mini-EPA N Y N 1991 2001 927
Operating Budget 2015/16 Federal Funding Federal Share
$496,001,937 $141,360,552 28.5%
Agency Responsibilities
Commission
Clean
Air
Clean
Water
Drinking
Water
Ground-
water
Solid
Waste
Hazardous
Waste Mining Energy Agriculture
N Y Y N Y Y Y Y N N
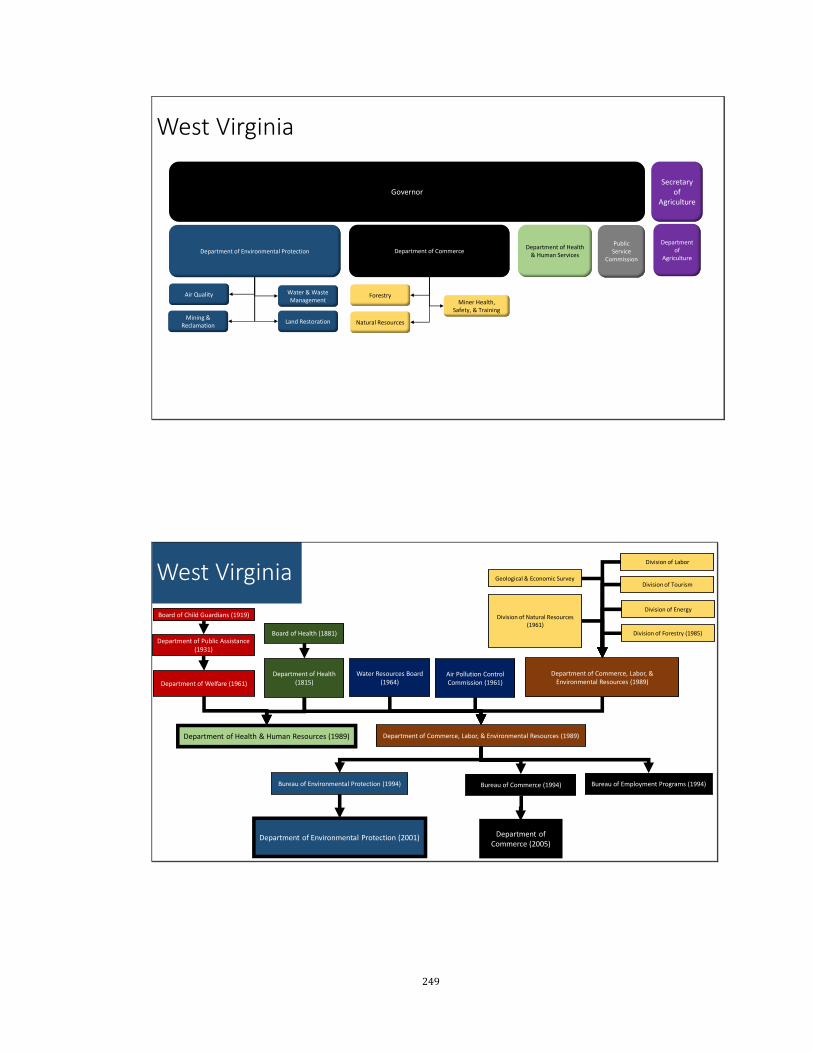
249
West Virginia
Department of Environmental Protection
Governor
Department of Health & Human Services
Department of
Agriculture
Public Service
Commission
Natural Resources
ForestryMiner Health,
Safety, & Training
Secretary of
Agriculture
Department of Commerce
Air Quality
Land RestorationMining &
Reclamation
Water & Waste Management
West Virginia
Division of Natural Resources (1961)
Department of Environmental Protection (2001)
Department of Commerce, Labor, & Environmental Resources (1989)
Division of Forestry (1985)
Bureau of Environmental Protection (1994) Bureau of Commerce (1994) Bureau of Employment Programs (1994)
Department of Commerce (2005)
Division of Labor
Division of Tourism
Division of Energy
Geological & Economic Survey
Water Resources Board (1964)
Department of Health (1815)
Air Pollution Control Commission (1961)
Department of Commerce, Labor, & Environmental Resources (1989)Department of Health & Human Resources (1989)
Board of Health (1881)Department of Public Assistance
(1931)
Board of Child Guardians (1919)
Department of Welfare (1961)

250
Wisconsin
Department of Natural Resources
Mission Statement
To protect and enhance our natural resources: our air, land and water; our wildlife,
fish and forests and the ecosystems that sustain all life. To provide a healthy,
sustainable environment and a full range of outdoor opportunities. To ensure the
right of all people to use and enjoy these resources in their work and leisure. To work
with people to understand each other's views and to carry out the public will. And in
this partnership consider the future and generations to follow.
History and Budgetary Information
Current Structure Environmental Programs Started Founded Reorganized Employees
Health
Department
Independent
Board
Independent
Agency
Super-Agency Y (WATER) Y N 1966 N/A 2642
Operating Budget 2015/16 Federal Funding Federal Share
$574,854,600 $82,536,100 14.4%
Agency Responsibilities
Commission
Clean
Air
Clean
Water
Drinking
Water
Ground-
water
Solid
Waste
Hazardous
Waste Mining Energy Agriculture
Y Y Y Y Y Y Y Y N N

251
Wisconsin
Governor
Department of Health Services
Department of Agriculture &
Consumer Protection
Department of Natural ResourcesPublic Service Commission
Air & Waste
Land Forestry
Water
Department of Children &
Families
Air Pollution Advisory Council (1967)
Wisconsin
Department of Natural Resources (1967)
Department of Resources
Development (1966)
Conservation Department (1927)
Interagency Committee on Water Pollution
(1927)Department of Health
Public Service Commission (1931)Hydropower Section
Forestry Commission
(1891)
Department of State Forestry (1903)
State Forestry
Board (1905)
Conservation Commission (1915)
Interstate Park
Commission (1899)
Fish and Game
Warden (1891)
Fisheries Commission
(1874) State Board of Health (1876)
Department of Public Welfare
(1939)
Department of Health & Social Services (1967)
Department of Health & Family Services (1996)
Department of Health (2007)Department of Children & Families (2007)

252
Wyoming
Department of Environmental Quality
Mission Statement
To protect, conserve, and enhance the quality of Wyoming's environment for the benefit
of current and future generations.
History and Budgetary Information
Current Structure Environmental Programs Started Founded Reorganized Employees
Health
Department
Independent
Board
Independent
Agency
Mini-EPA Y N N 1973 N/A 264
Operating Budget 2015/16 Federal Funding Federal Share
$232,733,815 $151,500,197 65.0%
Agency Responsibilities
Commission
Clean
Air
Clean
Water
Drinking
Water
Ground-
water
Solid
Waste
Hazardous
Waste Mining Energy Agriculture
N Y Y Y Y Y Y N N N

253
Wyoming
Department of Environmental Quality
Governor
Department of Health
Department of Agriculture
Department of State Parks & Cultural
Resources
Game & Fish Department
Abandoned Mine Land
Air Quality
Water Quality
Solid & Hazardous Waste
Land Quality
Industrial Siting
Department of Family Services
Environmental Quality Council (1973)
Wyoming
Department of Environmental Quality (1973)
Department of Health (1991)
Board of Health (1901)
Department of Health & Social Services (1969)
Department of Health & Social Services (1973)
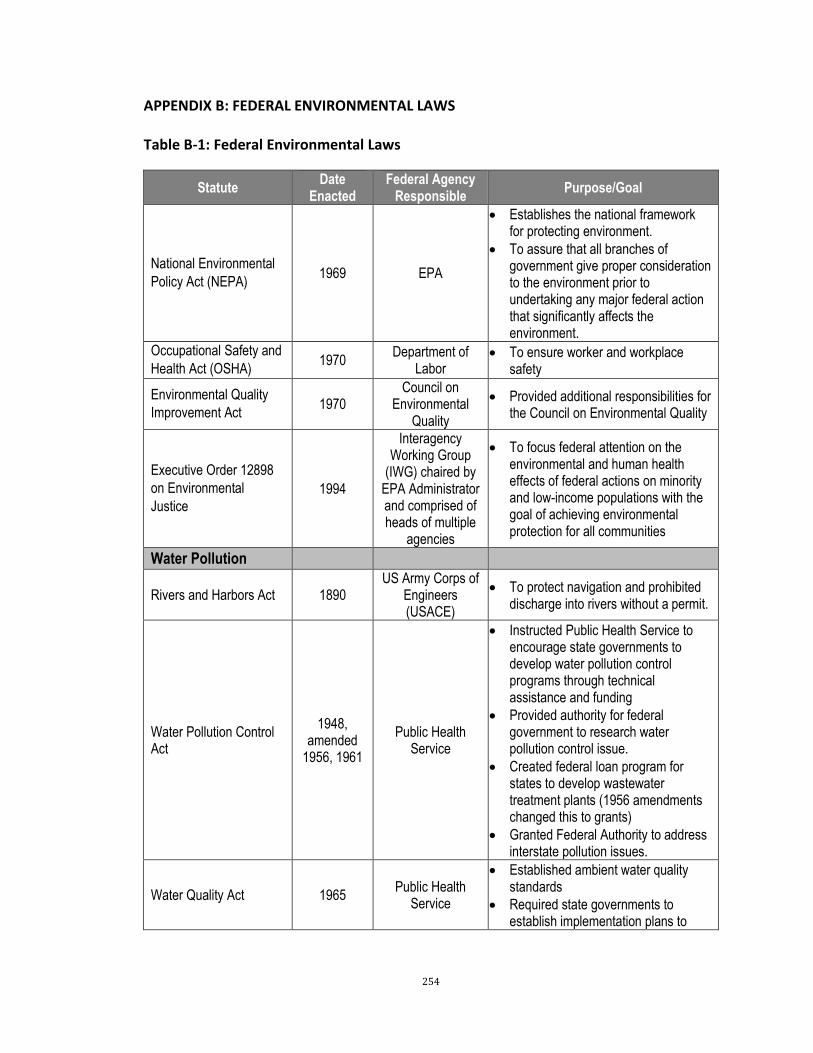
254
APPENDIX B: FEDERAL ENVIRONMENTAL LAWS
Table B-1: Federal Environmental Laws
Statute Date
Enacted Federal Agency
Responsible Purpose/Goal
National Environmental
Policy Act (NEPA) 1969 EPA
Establishes the national framework for protecting environment.
To assure that all branches of government give proper consideration to the environment prior to undertaking any major federal action that significantly affects the environment.
Occupational Safety and
Health Act (OSHA) 1970
Department of Labor
To ensure worker and workplace safety
Environmental Quality
Improvement Act 1970
Council on Environmental
Quality
Provided additional responsibilities for the Council on Environmental Quality
Executive Order 12898
on Environmental
Justice
1994
Interagency Working Group
(IWG) chaired by EPA Administrator and comprised of heads of multiple
agencies
To focus federal attention on the environmental and human health effects of federal actions on minority and low-income populations with the goal of achieving environmental protection for all communities
Water Pollution
Rivers and Harbors Act 1890 US Army Corps of
Engineers (USACE)
To protect navigation and prohibited discharge into rivers without a permit.
Water Pollution Control Act
1948, amended
1956, 1961
Public Health Service
Instructed Public Health Service to encourage state governments to develop water pollution control programs through technical assistance and funding
Provided authority for federal government to research water pollution control issue.
Created federal loan program for states to develop wastewater treatment plants (1956 amendments changed this to grants)
Granted Federal Authority to address interstate pollution issues.
Water Quality Act 1965 Public Health
Service
Established ambient water quality standards
Required state governments to establish implementation plans to

255
Statute Date
Enacted Federal Agency
Responsible Purpose/Goal
achieve ambient water quality standards
Clean Water Act (CWA) 1972
(amend 1990)
EPA Restore and maintain the chemical,
physical, and biological integrity of the nation’s waters.
Coastal Zone Management Act (CZMA)
1972 (amend
1975, 1976, 1978)
EPA/NOAA To control nonpoint pollution sources
that affect coastal water quality.
Marine Protection, Research, and Sanctuaries Act (MPRSA or Ocean Dumping Act)
1972 EPA
Prohibits the transportation of material from the US for the purpose of ocean dumping
Prohibits the transportation of material from anywhere for the purpose of ocean dumping by US agencies or US flagged vessels
Prohibits dumping of material transported from outside the US into US territorial sea.
Safe Drinking Water Act 1974 EPA Protect human health from
contaminants in drinking water
Shoreline Protection Act (SPA)
1988 EPA/US Coast
Guard
Prohibits the transportation of municipal or commercial waste within coastal waters by a vessel without a permit and number.
Beaches Environmental Assessment and Coastal Health (BEACH) Act
2000 EPA
To reduce the risk of disease to users of the Nation's coastal recreation waters.
Authorizes EPA to award grants to states and local governments to support microbiological testing and monitoring of coastal
To support programs to notify the public of potential exposure to disease-causing microorganisms in waters.
Air Pollution
Air Pollution Control Act 1955,
amended 1961,1962
Public Health Service
Acknowledged the existence of air pollution
Directed Secretary of Health, Education, and Welfare to conduct research and provide technical assistance to state and local government.
Stated clearly that air pollution was responsibility of state and local governments

256
Statute Date
Enacted Federal Agency
Responsible Purpose/Goal
Clean Air Act 1963,
amended 1965
Public Health Service
First time term ‘clean air’ was used in Federal air legislation
Granted money to state and local governments to conduct research and develop local control programs.
Granted Federal authority to address interstate pollution issues.
Air Quality Act Amendment
1967 Public Health
Service
Required the Secretary of Health, Education, and Welfare to divide the country into Air Quality Control Regions.
Established emission standards for stationary source
Clean Air Act (CAA) 1970,
amended 1977,1990
EPA
Regulates stationary and mobile air sources.
Establishes National Ambient Air Quality Standards (NAAQS).
Hazardous Waste
Federal Insecticide, Fungicide, and Rodenticide Act (FIFRA)
1947 Department of
Agriculture Established procedures for registering
pesticides and labelling provisions.
Lead-Based Paint Poisoning Prevention Act
1971, amended 1977,1978
HUD
Provides grants to carry out comprehensive testing programs to detect the presence of and eliminate lead-based paint from surfaces of residential structures accessible to children.
Federal Environmental Pesticide Control Act (FEPCA)
1972, amended
1972, 1975, 1978
EPA Regulate sale, distribution, and
application of pesticides
Resource Conservation and Recovery Act (RCRA)
1976 EPA Source reduction, high-technology
treatment, and secure, long-term disposal of hazardous waste.
Toxic Substances Control Act
1976 (amend
EPA
EPA requires reporting, record-keeping and testing requirements, and restrictions relating to chemical substances and/or mixtures. Certain substances are generally excluded from TSCA, including, among others, food, drugs, cosmetics and pesticides.
Comprehensive Environmental Response, Compensation, and Liability Act (CERCLA or Superfund)
1980 EPA Provides a Federal "Superfund" to
clean up uncontrolled or abandoned hazardous waste sites as well as accidents, spills, and other

257
Statute Date
Enacted Federal Agency
Responsible Purpose/Goal
emergency releases of pollutants and contaminants into the environment
Residential Lead-Based Paint Hazard Reduction Act
1992 EPA/HUD
To develop a national strategy to build the infrastructure necessary to eliminate lead-based paint hazards in all housing
Food Quality Protection Act
1996 EPA/USDA Amended FIFRA and FFDCA to
increase stringency of pesticide regulations
Mercury-Containing and Rechargeable Battery Management Act
1996 EPA
To phase out the use of mercury in batteries
To provide for the efficient and cost-effective collection, disposal, and/or recycling of materials within these batteries.
Small Business Liability Relief and Brownfields Revitalization Act
2002 EPA Provides funding to assess and clean up brownfields
The Frank R. Lautenberg Chemical Safety for the 21st Century Act
2016 EPA
Amends TSCA to provide a mandatory requirement for EPA to evaluate existing chemicals with clear and enforceable deadlines
Provides new risk-based safety standard
Increases public transparency for chemical information
Creates a consistent source of funding to enforce law
Solid Waste
Solid Waste Disposal Act
1965 Public Health
Service
Required environmentally sound methods for disposal of household, municipal, commercial, and industrial waste
Provided financial assistance to states to research and develop solid waste management plans
Pollution Prevention Act (PPA)
1990 EPA
Focused industry, government, and public attention on reducing the amount of pollution through cost-effective changes in production, operation, and raw material use.
Noise
Noise Control Act 1972
(amend 1978)
EPA To promote an environment for all
Americans free from noise that jeopardizes their health and welfare
Energy

258
Statute Date
Enacted Federal Agency
Responsible Purpose/Goal
Atomic Energy Act 1947 NRC, DOE, EPA (originally AEC)
Established the Atomic Energy Commission (AEC)
To promote the "utilization of atomic energy for peaceful purposes to the maximum extent consistent with the common defense and security and with the health and safety of the public
Surface Mining Control and Reclamation Act (SMCRA)
1977 OSM To regulate surface mining activities
and the reclamation of coal-mined lands.
Nuclear Waste Policy Act (NWPA)
1982 DOE/NRC/EPA Supports the use of deep geologic
repositories for the safe storage and/or disposal of radioactive waste.
Oil Pollution Act (OPA) 1990 EPA Streamlined EPA’s ability to prevent
and respond to catastrophic oil spills
Energy Policy Act 2005 EPA
Addresses energy production in the US including energy efficiency, renewable energy, oil and gas, coal, etc.
Energy Independence and Security Act (EISA)
2007 EPA
Addresses energy production in the US including energy efficiency, renewable energy, oil and gas, coal, etc.

259
APPENDIX C: STATE PRIMACY INFORMATION
State primacy information for programs delegated to states under the Clean Air Act, the Clean Water Act, the Resource Conservation and Recovery Act, the State Drinking Water Act, the Toxic Substances Control Act, the Emergency Planning and Community Right to Know Act, the Federal Insecticide, Fungicide, and Rodenticide Act, and the Oil Pollution Control Act. The data in this appendix is from a report produced by the Environmental Council of States (ECOS) Source of Data: Longsworth, Sarah Grace, Brendan Johns, and Carolyn Hanson) (2016). State Delegation of Environmental Acts. Retrieved from: http://www.ecos.org/documents/state-delegations/.
Key to Abbreviations in Delegation Tables
Codes
I Interim Status -- state is operating the program pending final EPA authorizations.
IN In the process of being delegated/authorized or SIP approved.
ND Not subject to delegation, but states may have approved program.
P Partial Delegation/Authorization/Approval -- some parts of the programs have been approved but not the entire program.
S State program -- program operated by the state, for which EPA approval is not applicable.
A Approved state program or State Implementation Plan -- state's plan for meeting the applicable national standards.
Y Delegated or Authorized -- the state runs the program under EPA oversight.
N Not Delegated/Authorized/Approved
N/A Not Applicable
Qualifications
1 The state has the authority to enforce some or all of these regulations; some approved through the SIP process, while others were delegated.
2 EPA still maintains responsibility for audit resolution.
3 Only the enforcement portion can be delegated.
4 Program close-out.
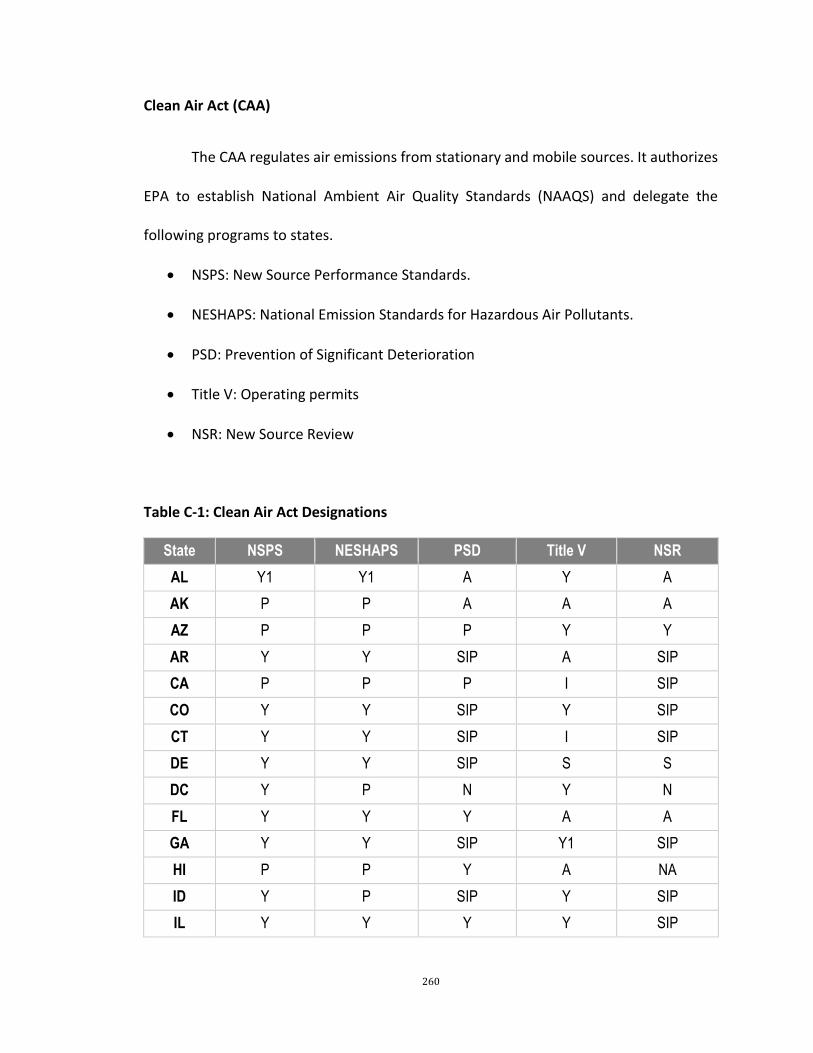
260
Clean Air Act (CAA)
The CAA regulates air emissions from stationary and mobile sources. It authorizes
EPA to establish National Ambient Air Quality Standards (NAAQS) and delegate the
following programs to states.
NSPS: New Source Performance Standards.
NESHAPS: National Emission Standards for Hazardous Air Pollutants.
PSD: Prevention of Significant Deterioration
Title V: Operating permits
NSR: New Source Review
Table C-1: Clean Air Act Designations
State NSPS NESHAPS PSD Title V NSR
AL Y1 Y1 A Y A
AK P P A A A
AZ P P P Y Y
AR Y Y SIP A SIP
CA P P P I SIP
CO Y Y SIP Y SIP
CT Y Y SIP I SIP
DE Y Y SIP S S
DC Y P N Y N
FL Y Y Y A A
GA Y Y SIP Y1 SIP
HI P P Y A NA
ID Y P SIP Y SIP
IL Y Y Y Y SIP
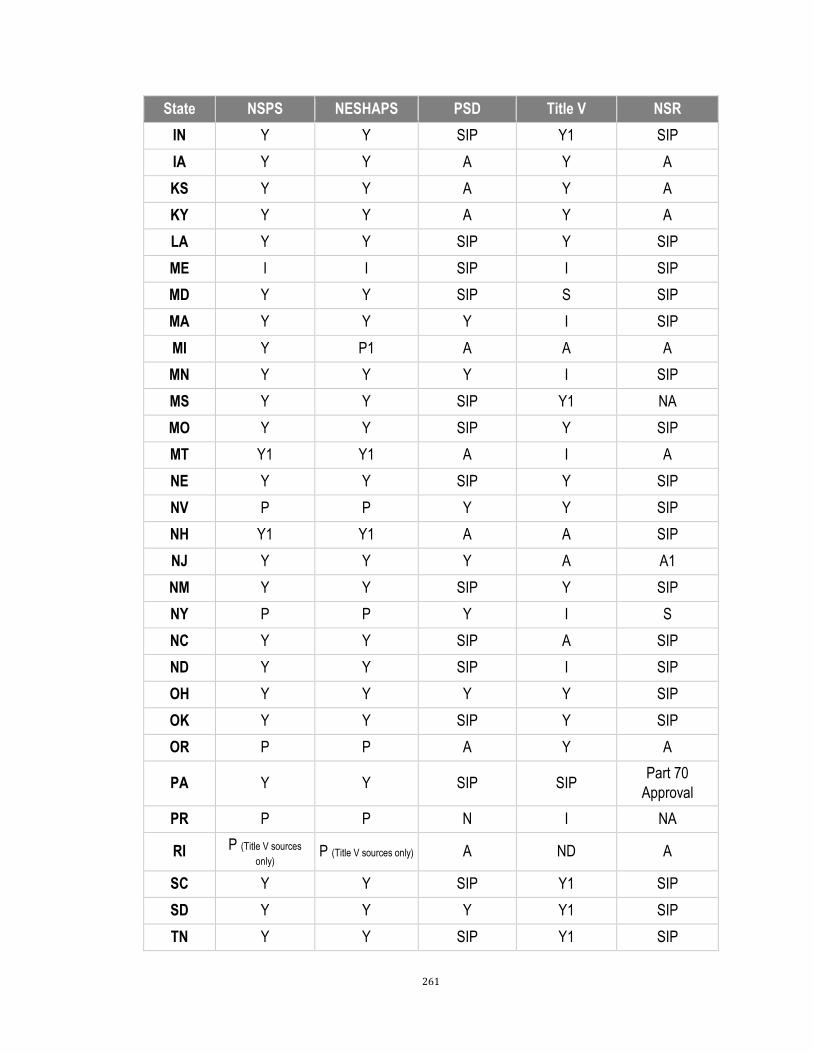
261
State NSPS NESHAPS PSD Title V NSR
IN Y Y SIP Y1 SIP
IA Y Y A Y A
KS Y Y A Y A
KY Y Y A Y A
LA Y Y SIP Y SIP
ME I I SIP I SIP
MD Y Y SIP S SIP
MA Y Y Y I SIP
MI Y P1 A A A
MN Y Y Y I SIP
MS Y Y SIP Y1 NA
MO Y Y SIP Y SIP
MT Y1 Y1 A I A
NE Y Y SIP Y SIP
NV P P Y Y SIP
NH Y1 Y1 A A SIP
NJ Y Y Y A A1
NM Y Y SIP Y SIP
NY P P Y I S
NC Y Y SIP A SIP
ND Y Y SIP I SIP
OH Y Y Y Y SIP
OK Y Y SIP Y SIP
OR P P A Y A
PA Y Y SIP SIP Part 70
Approval
PR P P N I NA
RI P (Title V sources
only) P (Title V sources only) A ND A
SC Y Y SIP Y1 SIP
SD Y Y Y Y1 SIP
TN Y Y SIP Y1 SIP
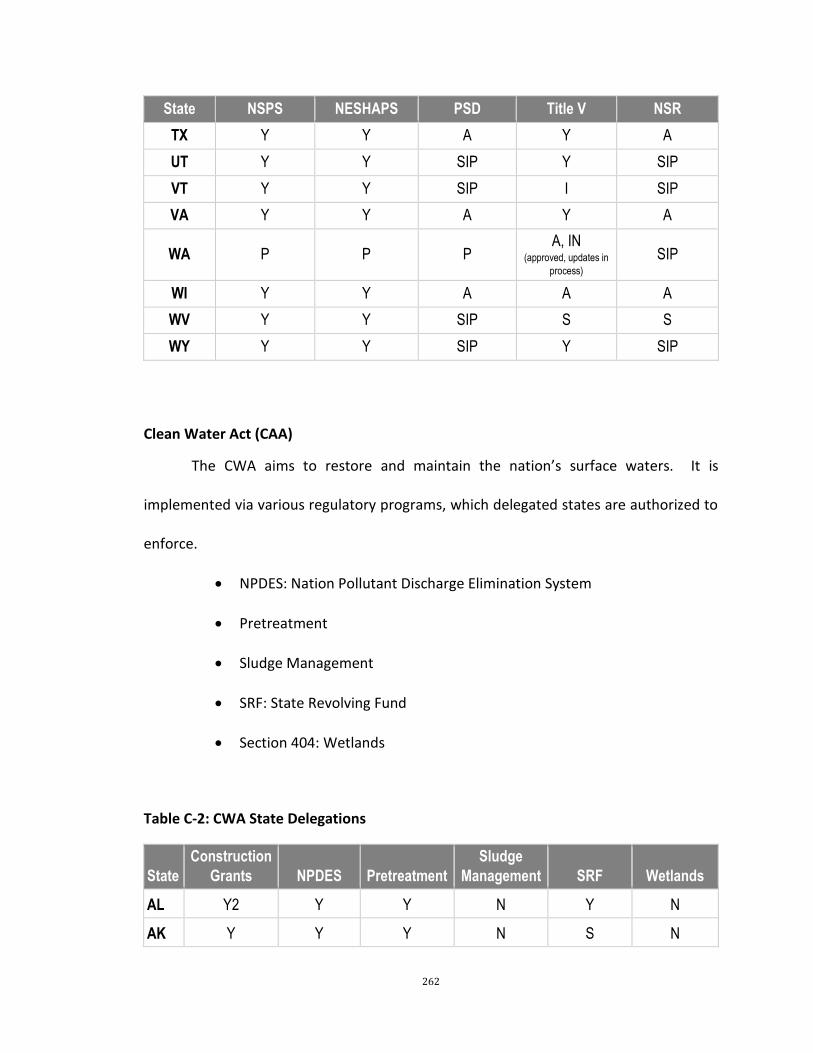
262
State NSPS NESHAPS PSD Title V NSR
TX Y Y A Y A
UT Y Y SIP Y SIP
VT Y Y SIP I SIP
VA Y Y A Y A
WA P P P A, IN
(approved, updates in
process) SIP
WI Y Y A A A
WV Y Y SIP S S
WY Y Y SIP Y SIP
Clean Water Act (CAA)
The CWA aims to restore and maintain the nation’s surface waters. It is
implemented via various regulatory programs, which delegated states are authorized to
enforce.
NPDES: Nation Pollutant Discharge Elimination System
Pretreatment
Sludge Management
SRF: State Revolving Fund
Section 404: Wetlands
Table C-2: CWA State Delegations
State
Construction
Grants NPDES Pretreatment
Sludge
Management SRF Wetlands
AL Y2 Y Y N Y N
AK Y Y Y N S N

263
State
Construction
Grants NPDES Pretreatment
Sludge
Management SRF Wetlands
AZ Y Y Y Y
(Water
Infrastructure
Finance Authority) N
AR N Y Y N N N
CA S Y Y N S N
CO Y P IN IN Y ND
CT Y Y Y N Y N
DE Y Y N N S N
DC N N N N N N
FL Y P Y N Y N
GA Y Y Y IN Y N
HI S Y Y IN S N
ID Y N N N S N
IL Y Y Y S S N
IN N/A Y N S S N
IA S Y Y N2 Y N
KS Y Y N N Y N
KY Y Y Y N Y N
LA Y2 Y Y N S N
ME Y N N N Y N
MD NA Y Y N S N
MA Y N N N Y N
MI Y Y Y S (also federally
delegated) S Y
MN Y Y Y S S N
MS N9 Y Y N Y N
MO Y Y Y N Y N
MT Y2 Y N N Y ND
NE Y Y Y N Y N
NV S Y N N S N

264
State
Construction
Grants NPDES Pretreatment
Sludge
Management SRF Wetlands
NH Y2 N N N Y N
NJ Y Y Y N ND Y
NM Y2 ND ND ND S N
NY Y Y N N S N
NC Y A Y N Y N
ND Y Y N N Y ND
OH Y Y Y N S N
OK Y2 Y Y Y S N
OR Y Y Y IN Y ND
PA Y Y N Y S N
PR N Y N N N N
RI Y Y Y N Y N
SC N Y Y N Y N
SD Y Y Y N3 Y ND
TN Y Y Y N Y N
TX Y2 Y Y Y S N
UT Y2 Y Y Y Y ND
VT Y Y Y N Y N
VA Y Y Y S Y S
WA Y P Y Y S N
WI Y Y Y Y S N
WV Y Y Y N S N
WY Y2 Y N N Y ND
Resource Conservation and Recovery (RCRA)
RCRA aims to assist in the development of management plans and facilities for
solid waste, hazardous waste, and underground storage tanks that hold petroleum
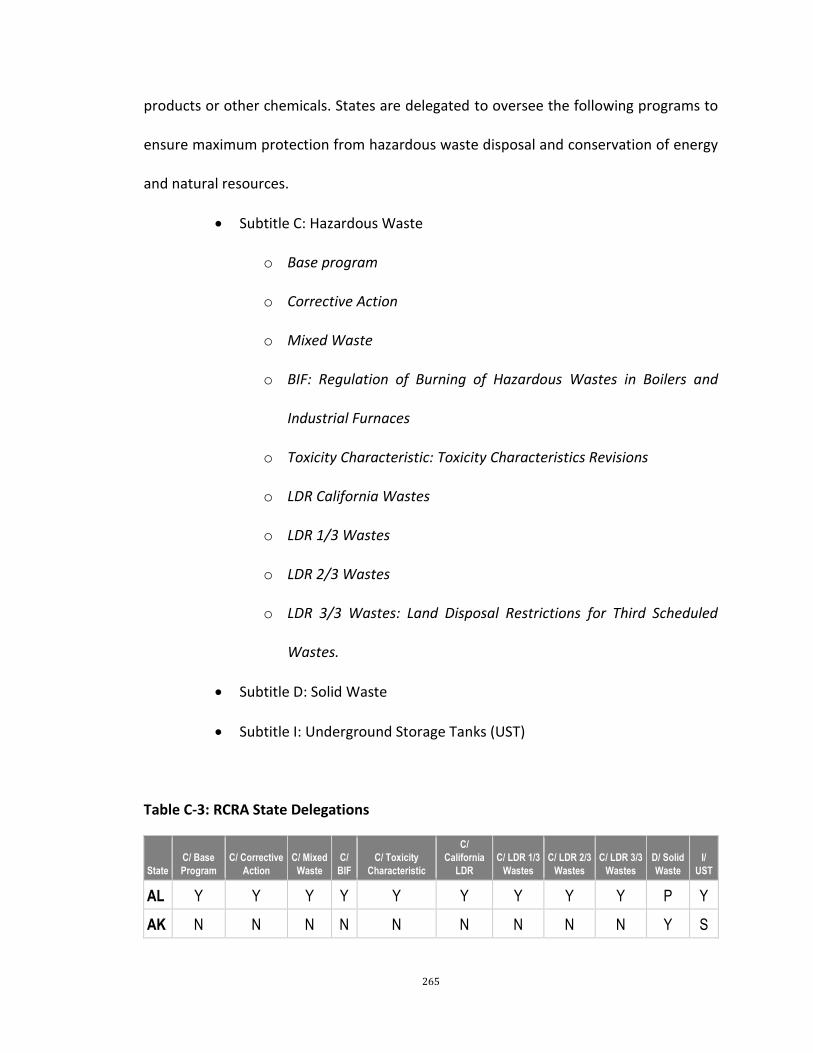
265
products or other chemicals. States are delegated to oversee the following programs to
ensure maximum protection from hazardous waste disposal and conservation of energy
and natural resources.
Subtitle C: Hazardous Waste
o Base program
o Corrective Action
o Mixed Waste
o BIF: Regulation of Burning of Hazardous Wastes in Boilers and
Industrial Furnaces
o Toxicity Characteristic: Toxicity Characteristics Revisions
o LDR California Wastes
o LDR 1/3 Wastes
o LDR 2/3 Wastes
o LDR 3/3 Wastes: Land Disposal Restrictions for Third Scheduled
Wastes.
Subtitle D: Solid Waste
Subtitle I: Underground Storage Tanks (UST)
Table C-3: RCRA State Delegations
State
C/ Base
Program
C/ Corrective
Action
C/ Mixed
Waste
C/
BIF
C/ Toxicity
Characteristic
C/
California
LDR
C/ LDR 1/3
Wastes
C/ LDR 2/3
Wastes
C/ LDR 3/3
Wastes
D/ Solid
Waste
I/
UST
AL Y Y Y Y Y Y Y Y Y P Y
AK N N N N N N N N N Y S

266
State
C/ Base
Program
C/ Corrective
Action
C/ Mixed
Waste
C/
BIF
C/ Toxicity
Characteristic
C/
California
LDR
C/ LDR 1/3
Wastes
C/ LDR 2/3
Wastes
C/ LDR 3/3
Wastes
D/ Solid
Waste
I/
UST
AZ Y Y Y Y Y Y Y Y Y Y Y
AR Y Y Y Y Y Y Y N N Y Y
CA Y Y Y IN Y Y Y Y IN ND N
CO Y Y Y N Y Y Y Y Y Y N
CT Y N Y N N Y Y Y N Y Y
DE Y N Y N Y Y Y N N Y Y
DC Y N N N N N N N N NA Y
FL Y Y Y Y Y Y Y Y Y ND N
GA Y Y Y Y Y ND Y Y Y Y Y
HI Y N N N Y Y Y Y Y ND Y
ID Y Y Y Y Y Y Y Y Y S Y
IL Y Y Y Y Y Y Y Y Y Y N
IN Y Y Y Y Y Y Y Y Y Y Y
IA N N N N N N N N N Y Y
KS Y Y Y Y Y Y Y Y Y Y Y
KY Y Y Y N Y N N N N ND Y
LA Y Y Y Y Y Y I I I Y Y
ME Y Y Y N N Y Y Y N N Y
MD Y N N N Y N N N N P Y
MA Y N N N N N N N N Y Y
MI Y Y Y IN Y Y Y Y Y Y N
MN Y Y Y N Y Y Y N Y Y Y
MS Y N Y N Y Y Y N Y ND Y
MO Y Y Y N Y Y Y Y Y Y Y
MT Y Y N Y Y Y Y Y Y P Y
NE Y N Y Y Y Y Y N N Y Y
NV Y Y Y Y Y Y Y Y Y ND S/Y
NH Y Y P N Y N N N N Y Y

267
State
C/ Base
Program
C/ Corrective
Action
C/ Mixed
Waste
C/
BIF
C/ Toxicity
Characteristic
C/
California
LDR
C/ LDR 1/3
Wastes
C/ LDR 2/3
Wastes
C/ LDR 3/3
Wastes
D/ Solid
Waste
I/
UST
NJ Y1 A Y1 Y1 Y1 Y1 Y1 Y1 Y1 S Y
NM Y Y Y Y Y Y Y N N Y Y
NY Y Y Y Y Y Y Y Y Y Y N
NC Y Y Y Y Y Y Y A Y ND A
ND Y Y Y N Y Y Y Y IN Y Y
OH Y Y Y Y Y Y Y Y Y Y N
OK Y Y Y Y Y Y Y Y Y Y Y
OR Y Y Y Y Y Y Y Y Y S A
PA Y N N N N Y N N Y Y Y
PR N N N N N N N N N IN N
RI Y N N N N N N N N N Y
SC Y Y Y N Y Y Y Y Y Y Y
SD Y Y Y Y N Y Y Y Y Y Y
TN Y N Y Y Y Y Y N Y ND N
TX Y Y Y Y Y Y Y Y Y Y Y
UT Y Y Y Y Y Y Y Y Y Y Y
VT Y Y Y N Y N N N N Y Y
VA Y Y Y Y Y Y Y Y Y A Y
WA Y Y Y N Y Y Y Y Y
WI Y Y Y Y Y Y Y Y Y Y Y
WV Y N N N N Y N N N N Y
WY Y Y Y Y Y Y Y Y Y Y IN

268
Safe Drinking Water Act (SDWA)
SDWA regulates public drinking water supply. Many states are delegated to play
an important role in enforcing the following programs which protect drinking water and
its sources.
PWSS: Public Water System Supervision
Wellhead Protection Program
Sec. 1422 Underground Injection Control (UIC)
Sec. 1425 UIC
Table C-4: SDWA State Delegations
State PWSS
Wellhead
Protection UIC/ 1422 UIC/ 1425
AL Y A Y Y
AK Y ND N P
AZ Y Y N N
AR Y ND Y Y
CA Y ND N Y
CO Y SIP N Y
CT Y SIP Y Y
DE Y Y Y Y
DC N N N N
FL Y A Y N
GA Y SIP Y Y
HI Y A N N
ID Y S Y N
IL Y Y Y S3

269
State PWSS
Wellhead
Protection UIC/ 1422 UIC/ 1425
IN Y Y N A3
IA Y A N N
KS Y A Y Y
KY Y Y N N
LA Y ND Y Y
ME Y SIP Y Y
MD Y Y Y Y
MA Y SIP Y N
MI Y Y N N
MN Y Y N NA
MS Y SIP Y Y
MO Y Y Y Y
MT Y Y N Y
NE Y Y Y Y
NV Y ND Y Y
NH Y A Y Y
NJ Y A Y Y
NM Y ND Y Y
NY Y Y N ND
NC Y SIP Y Y
ND Y SIP Y Y
OH Y Y Y Y
OK Y ND Y Y
(but not to DEQ)
OR Y A Y Y
PA Y
A or Y (EPA approved PA DEP's
Wellhead Protection
Program in 1999)
N N
PR Y N N ND
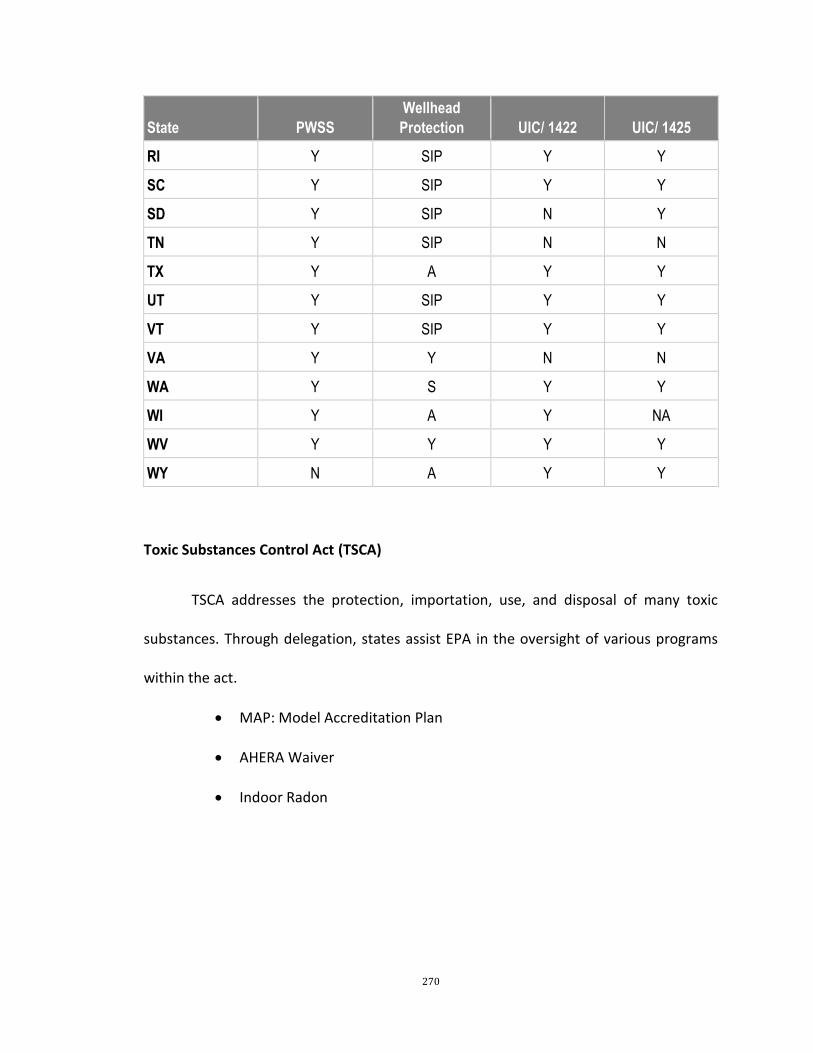
270
State PWSS
Wellhead
Protection UIC/ 1422 UIC/ 1425
RI Y SIP Y Y
SC Y SIP Y Y
SD Y SIP N Y
TN Y SIP N N
TX Y A Y Y
UT Y SIP Y Y
VT Y SIP Y Y
VA Y Y N N
WA Y S Y Y
WI Y A Y NA
WV Y Y Y Y
WY N A Y Y
Toxic Substances Control Act (TSCA)
TSCA addresses the protection, importation, use, and disposal of many toxic
substances. Through delegation, states assist EPA in the oversight of various programs
within the act.
MAP: Model Accreditation Plan
AHERA Waiver
Indoor Radon

271
Table C-5: TSCA State Delegations
State MAP AHERA Waiver Indoor Radon
AL Y N ND
AK N N N
AZ N N N
AR ND ND ND
CA N N ND
CO Y Y ND
CT Y Y Y
DE ND ND ND
DC ND ND ND
FL P N ND
GA N N ND
HI IN IN ND
ID N N N
IL Y N ND
IN Y N ND
IA N ND S
KS N ND S
KY Y Y ND
LA N Y NA
ME Y Y Y
MD Y Y ND
MA Y IN Y
MI P N ND
MN P N ND
MS Y N ND
MO Y ND S
MT Y N ND

272
State MAP AHERA Waiver Indoor Radon
NE Y ND S
NV N N ND
NH Y Y N
NJ N/A N/A Y
NM N N ND
NY N N N
NC Y N ND
ND Y N ND
OH S N ND
OK N N ND
OR S P N
PA ND ND ND
PR N N N
RI Y Y Y
SC Y N ND
SD Y N ND
TN N N ND
TX Y Y ND
UT Y Y ND
VT Y N Y
VA ND ND ND
WA S P N
WI Y N ND
WV ND ND ND
Y N N ND

273
Emergency Planning and Community Right to Know (EPCRA)
EPCRA is designed to help communities plan for emergencies involving hazardous
substances. Delegated states are authorized to implement the following programs:
Sec 313: Toxic Chemical Release Form
Sec 304
Sec 312
Table C-6: EPCRA State Delegations
State SEC 313 SEC 304, 312
AL ND ND
AK ND ND
AZ N N
AR N ND
CA ND ND
CO ND ND
CT ND ND
DE ND ND
DC ND ND
FL ND ND
GA ND ND
HI ND ND
ID ND ND
IL S S
IN N S
IA ND ND
KS N N
KY ND ND

274
State SEC 313 SEC 304, 312
LA N ND
ME ND ND
MD ND ND
MA ND ND
MI N N
MN S S
MS ND ND
MO ND ND
MT ND3 ND
NE ND ND
NV ND ND
NH ND3 ND
NJ S S
NM N ND
NY N N
NC ND ND
ND ND ND
OH S S
OK ND ND
OR ND ND
PA ND ND
PR N N
RI ND ND
SC ND ND
SD ND ND
TN ND ND
TX ND ND
UT ND ND
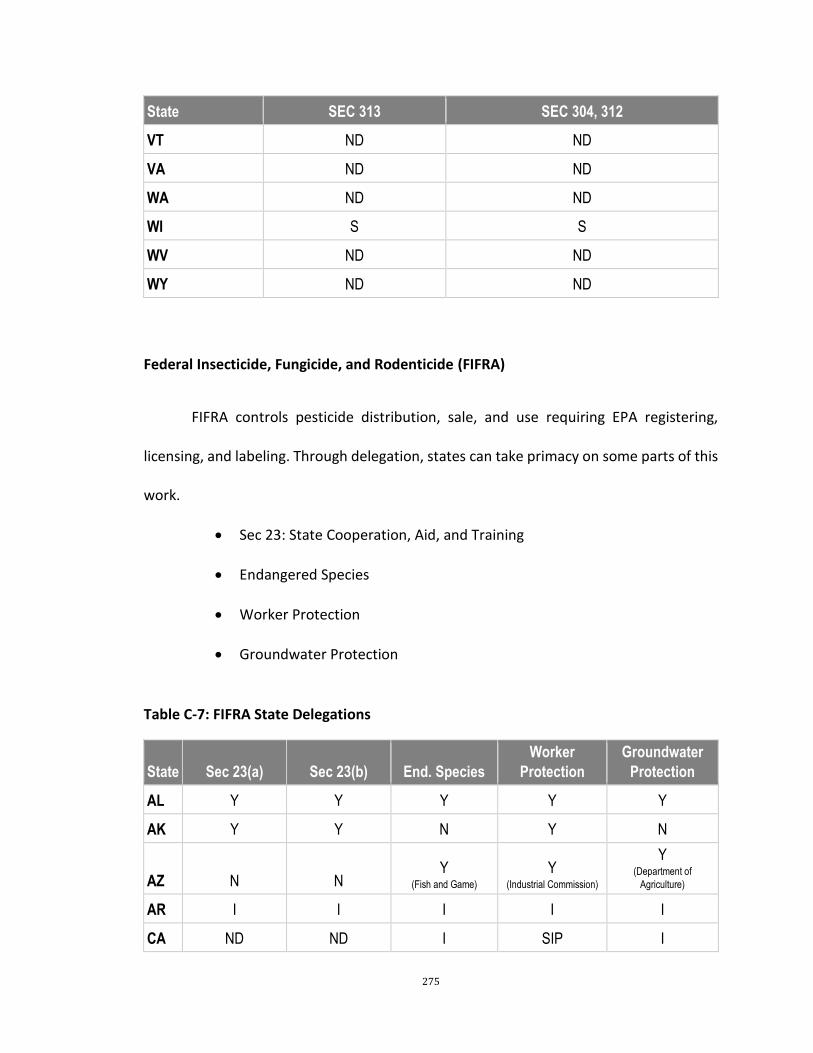
275
State SEC 313 SEC 304, 312
VT ND ND
VA ND ND
WA ND ND
WI S S
WV ND ND
WY ND ND
Federal Insecticide, Fungicide, and Rodenticide (FIFRA)
FIFRA controls pesticide distribution, sale, and use requiring EPA registering,
licensing, and labeling. Through delegation, states can take primacy on some parts of this
work.
Sec 23: State Cooperation, Aid, and Training
Endangered Species
Worker Protection
Groundwater Protection
Table C-7: FIFRA State Delegations
State Sec 23(a) Sec 23(b) End. Species
Worker
Protection
Groundwater
Protection
AL Y Y Y Y Y
AK Y Y N Y N
AZ N N Y
(Fish and Game)
Y (Industrial Commission)
Y (Department of
Agriculture)
AR I I I I I
CA ND ND I SIP I

276
State Sec 23(a) Sec 23(b) End. Species
Worker
Protection
Groundwater
Protection
CO P8 P8 ND P8 ND
CT Y Y N Y IN
DE Y Y Y Y Y
DC Y Y Y Y Y
FL Y Y Y Y Y
GA Y Y Y Y Y
HI ND ND ND A I
ID Y Y ND Y N
IL Y Y ND SIP S
IN Y Y ND Y S
IA Y Y Y Y I
KS Y Y Y Y I
KY Y Y Y Y Y
LA Y Y Y Y Y
ME Y Y N Y Y
MD Y Y Y Y Y
MA Y Y N Y IN
MI Y Y ND SIP S
MN Y Y ND SIP S
MS Y Y Y Y Y
MO Y Y Y Y I
MT Y Y P Y Y
NE Y Y Y Y Y
NV ND ND I SIP I
NH Y Y Y Y Y
NJ Y1 Y1 N/A 4 Y1 Y1
NM Y Y Y Y Y
NY Y Y Y Y Y

277
State Sec 23(a) Sec 23(b) End. Species
Worker
Protection
Groundwater
Protection
NC Y Y Y Y Y
ND Y Y ND Y ND
OH Y Y ND SIP S
OK Y Y Y Y Y
OR Y Y Y P Y
PA Y Y Y Y Y
PR Y Y Y Y Y
RI Y Y N Y IN
SC Y Y Y Y Y
SD Y Y ND Y ND
TN Y Y Y Y Y
TX Y Y Y Y Y
UT Y Y ND Y ND
VT Y Y S Y Y
VA Y Y Y Y Y
WA Y Y ND Y N
WI Y Y ND A S
WV Y Y Y Y Y
WY S Y ND S ND
Oil Pollution Act (OPA)
OPA aims to provide standards and resources for the nation to adequately prevent
and respond to future spills. The statute focuses on oil spills into navigable waters, and
highlights the prevention of spills and liability for spill clean-up and damages to natural
resources. States can acquire delegation of this work.

278
Table C-8: OPA State Delegations
State OPA State OPA
AL ND MO ND
AK ND MT ND
AZ N NE ND
AR ND NV ND
CA ND NH ND
CO ND NJ N/A
CT ND NM ND
DE ND NY N
DC ND NC ND
FL ND ND ND
GA ND OH ND
HI ND OK ND
ID ND OR ND
IL ND PA ND
IN ND PR N
IA ND RI ND
KS ND SC ND
KY ND SD ND
LA ND TN ND
ME ND TX ND
MD ND UT ND
MA ND VT ND
MI ND VA ND
MN ND WA ND/S
MS ND WI ND
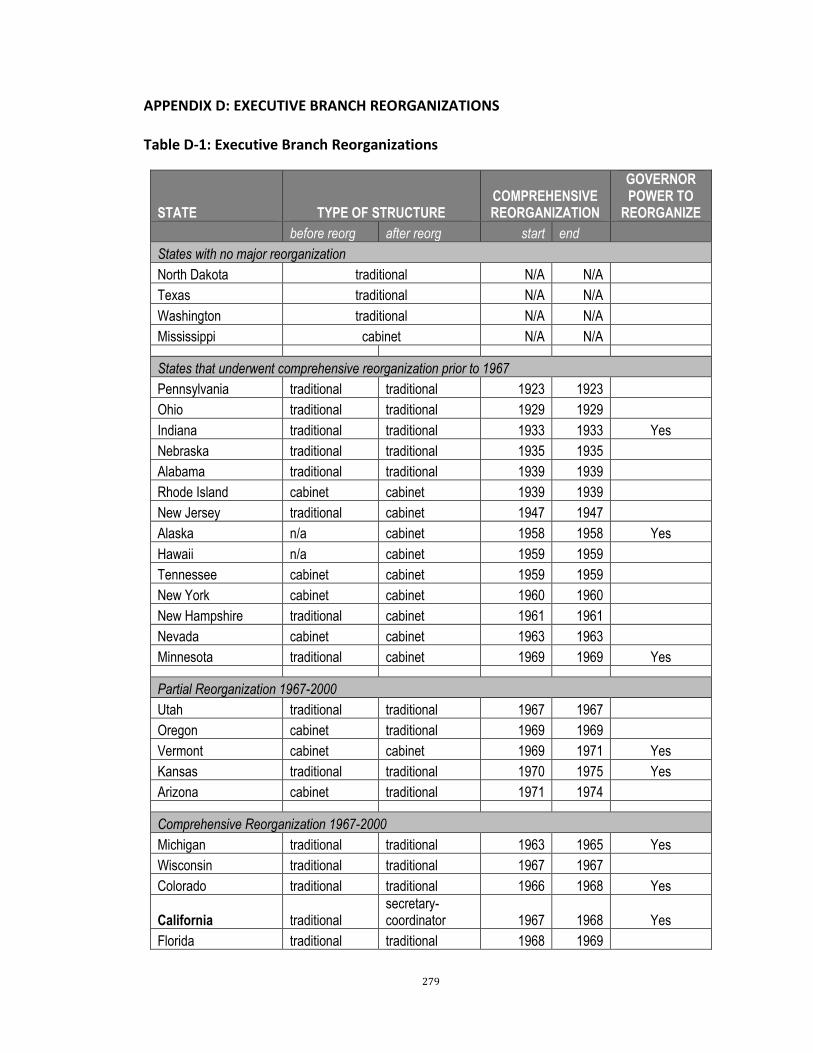
279
APPENDIX D: EXECUTIVE BRANCH REORGANIZATIONS
Table D-1: Executive Branch Reorganizations
STATE TYPE OF STRUCTURE COMPREHENSIVE REORGANIZATION
GOVERNOR POWER TO
REORGANIZE
before reorg after reorg start end
States with no major reorganization
North Dakota traditional N/A N/A
Texas traditional N/A N/A
Washington traditional N/A N/A
Mississippi cabinet N/A N/A
States that underwent comprehensive reorganization prior to 1967
Pennsylvania traditional traditional 1923 1923
Ohio traditional traditional 1929 1929
Indiana traditional traditional 1933 1933 Yes
Nebraska traditional traditional 1935 1935
Alabama traditional traditional 1939 1939
Rhode Island cabinet cabinet 1939 1939
New Jersey traditional cabinet 1947 1947
Alaska n/a cabinet 1958 1958 Yes
Hawaii n/a cabinet 1959 1959
Tennessee cabinet cabinet 1959 1959
New York cabinet cabinet 1960 1960
New Hampshire traditional cabinet 1961 1961
Nevada cabinet cabinet 1963 1963
Minnesota traditional cabinet 1969 1969 Yes
Partial Reorganization 1967-2000
Utah traditional traditional 1967 1967
Oregon cabinet traditional 1969 1969
Vermont cabinet cabinet 1969 1971 Yes
Kansas traditional traditional 1970 1975 Yes
Arizona cabinet traditional 1971 1974
Comprehensive Reorganization 1967-2000
Michigan traditional traditional 1963 1965 Yes
Wisconsin traditional traditional 1967 1967
Colorado traditional traditional 1966 1968 Yes
California traditional secretary-coordinator 1967 1968 Yes
Florida traditional traditional 1968 1969
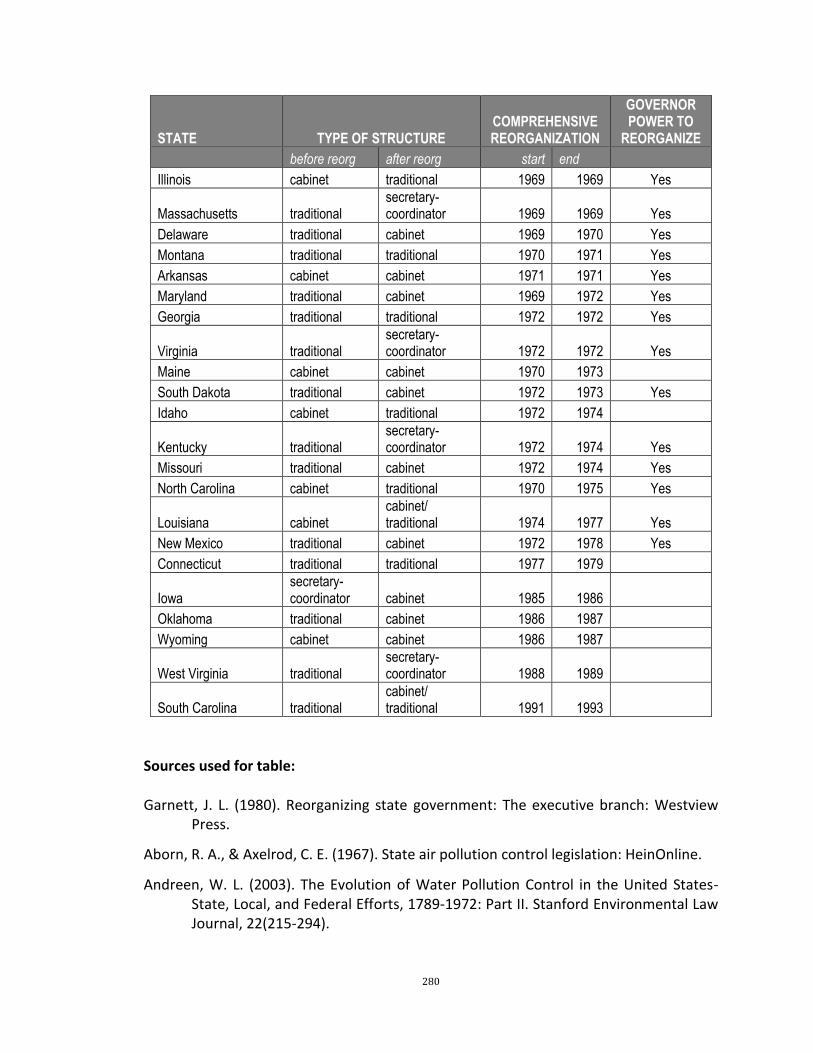
280
STATE TYPE OF STRUCTURE COMPREHENSIVE REORGANIZATION
GOVERNOR POWER TO
REORGANIZE
before reorg after reorg start end
Illinois cabinet traditional 1969 1969 Yes
Massachusetts traditional secretary-coordinator 1969 1969 Yes
Delaware traditional cabinet 1969 1970 Yes
Montana traditional traditional 1970 1971 Yes
Arkansas cabinet cabinet 1971 1971 Yes
Maryland traditional cabinet 1969 1972 Yes
Georgia traditional traditional 1972 1972 Yes
Virginia traditional secretary-coordinator 1972 1972 Yes
Maine cabinet cabinet 1970 1973
South Dakota traditional cabinet 1972 1973 Yes
Idaho cabinet traditional 1972 1974
Kentucky traditional secretary-coordinator 1972 1974 Yes
Missouri traditional cabinet 1972 1974 Yes
North Carolina cabinet traditional 1970 1975 Yes
Louisiana cabinet cabinet/ traditional 1974 1977 Yes
New Mexico traditional cabinet 1972 1978 Yes
Connecticut traditional traditional 1977 1979
Iowa secretary-coordinator cabinet 1985 1986
Oklahoma traditional cabinet 1986 1987
Wyoming cabinet cabinet 1986 1987
West Virginia traditional secretary-coordinator 1988 1989
South Carolina traditional cabinet/ traditional 1991 1993
Sources used for table:
Garnett, J. L. (1980). Reorganizing state government: The executive branch: Westview Press.
Aborn, R. A., & Axelrod, C. E. (1967). State air pollution control legislation: HeinOnline.
Andreen, W. L. (2003). The Evolution of Water Pollution Control in the United States-State, Local, and Federal Efforts, 1789-1972: Part II. Stanford Environmental Law Journal, 22(215-294).
281
Baity, H. G. (1939). Aspects of Governmental Policy on Stream Pollution Abatement*. American Journal of Public Health and the Nations Health, 29(12), 1297-1307.
Bell, G. A. (1972). States make progress with reorganization plans. National Civic Review, 61(3), 115-127.
Book of the States (1959). State Adminsitrative Organization, 1958-1959, 115-121.
Book of the States (1961). State Adminsitrative Organization, 1960-1961, 135-139.
Book of the States (1963). State Adminsitrative Organization, 1962-1963, 137-141.
Book of the States (1965). State Adminsitrative Organization, 1964-1965, 127-130.
Book of the States (1967). State Adminsitrative Organization, 1966-1967, 123-128.
Book of the States (1969). State Adminsitrative Organization, 1958-1969, 135-138.
Book of the States (1971). State Adminsitrative Organization, 1970-1971, 141-146.
Book of the States (1973). State Adminsitrative Organization, 1972-1973, 137-159.
Book of the States (1975). State Adminsitrative Organization, 1974-1975, 105-115.
Book of the States (1977). State Adminsitrative Organization, 1976-1977, 105-106.
Book of the States (1979). State Adminsitrative Organization, 1978-1979, 167-168.
Book of the States (1981). State Adminsitrative Organization, 1980-1981, 141-149.
Book of the States (1983). State Adminsitrative Organization, 1982-1983, 44-46.
Book of the States (1985). State Adminsitrative Organization, 1984-1985, 45-47.
Book of the States (1987). State Adminsitrative Organization, 1986-1987, 47-50.
Book of the States (1989). State Adminsitrative Organization, 1988-1989, 75-82
Conant, J. K. (1992). Executive branch reorganization in the states: 1965–1991. Book of the States, 93, 64-73.
Conant, J. K. (1992). Executive Branch Reorganization: Can It Be an Antidote for Fiscal Stress in the States? State & Local Government Review, 3-11.
Currie, D. P. (1981). State Pollution Statutes. The University of Chicago Law Review, 48(1), 27-81.
Ehrlich, J. (1973). State Executive Branch Reorganizations. University of Virginia News Letter, 51(7), 25-28.
Garnett, J. L. (1980). The State of the Art in State Executive Branch Reorganization. International Journal of Public Administration, 2(1), 51-79.

282
Haskins, R. L. (1969). Towards better administration of water quality control. Or. L. Rev., 49, 373.
Hatchard, R. E. (1962). Administration of State Air Pollution Control Programs, A Survey. Journal of the Air Pollution Control Association, 12(6), 282-284.
Hines, N. W. (1966). Nor Any Drop to Drink: Public Regulation of Water Quality Part I: State Pollution Control Programs. Iowa L. Rev., 52, 186.
Stein, M. (1962). Problems and Programs in Water Pollution. Nat. Resources J., 2, 388.
Stern, A. C., & Professor, E. (1982). History of air pollution legislation in the United States. Journal of the Air Pollution Control Association, 32(1), 44-61.
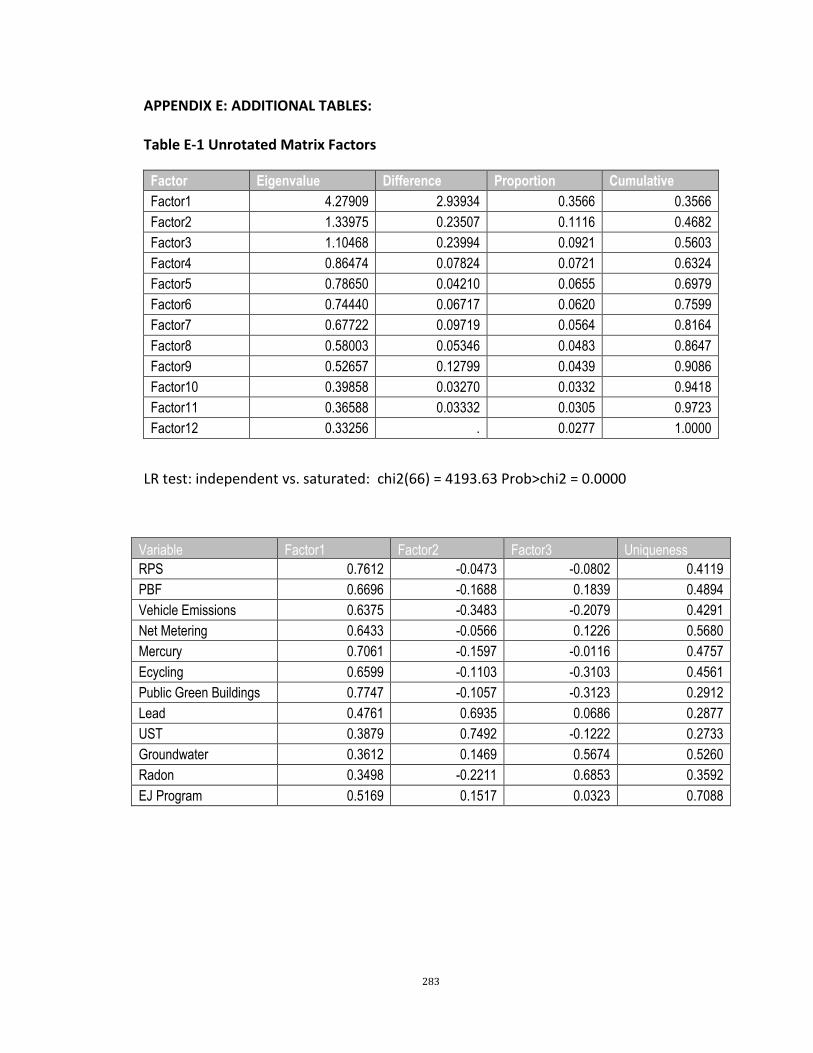
283
APPENDIX E: ADDITIONAL TABLES:
Table E-1 Unrotated Matrix Factors
Factor Eigenvalue Difference Proportion Cumulative
Factor1 4.27909 2.93934 0.3566 0.3566
Factor2 1.33975 0.23507 0.1116 0.4682
Factor3 1.10468 0.23994 0.0921 0.5603
Factor4 0.86474 0.07824 0.0721 0.6324
Factor5 0.78650 0.04210 0.0655 0.6979
Factor6 0.74440 0.06717 0.0620 0.7599
Factor7 0.67722 0.09719 0.0564 0.8164
Factor8 0.58003 0.05346 0.0483 0.8647
Factor9 0.52657 0.12799 0.0439 0.9086
Factor10 0.39858 0.03270 0.0332 0.9418
Factor11 0.36588 0.03332 0.0305 0.9723
Factor12 0.33256 . 0.0277 1.0000
LR test: independent vs. saturated: chi2(66) = 4193.63 Prob>chi2 = 0.0000
Variable Factor1 Factor2 Factor3 Uniqueness
RPS 0.7612 -0.0473 -0.0802 0.4119
PBF 0.6696 -0.1688 0.1839 0.4894
Vehicle Emissions 0.6375 -0.3483 -0.2079 0.4291
Net Metering 0.6433 -0.0566 0.1226 0.5680
Mercury 0.7061 -0.1597 -0.0116 0.4757
Ecycling 0.6599 -0.1103 -0.3103 0.4561
Public Green Buildings 0.7747 -0.1057 -0.3123 0.2912
Lead 0.4761 0.6935 0.0686 0.2877
UST 0.3879 0.7492 -0.1222 0.2733
Groundwater 0.3612 0.1469 0.5674 0.5260
Radon 0.3498 -0.2211 0.6853 0.3592
EJ Program 0.5169 0.1517 0.0323 0.7088

284
APPENDIX F: SOURCES USED TO DEVELOP STATE STRUCTURE INFORMATION
General
Beyle, Thad L. (1975). Integration and Coordination of State Environmental Programs. The Council of State Governments: Lexington, Kentucky.
Davies III, J. C., & Davies III, J. C. (1970). The politics of pollution. Retrieved from
Davies, J. C., & Davies, B. S. (1975). The politics of pollution: Pegasus.
Grady, D. O. (1986). STATE AND LOCAL-GOVERNMENT ADMINISTRATION-RABIN, J, DODD, D: UNIV TEXAS PRESS BOX 7819, AUSTIN, TX 78713-7819.
Haskell, E. H., & Price, V. S. (1973). STATE ENVIRONMENTAL MANAGEMENT, CASE STUDIES OF NINE STATES. PRAEGER, NEW YORK, N. Y. 1973. 283 P. PRICE:$ 5. 95.
Jessup, D. H. (1988). Guide to State Environmental Programs (First ed.). Washington D.C.: BNA Book.
Jessup, D. H. (1990). Guide to State Environmental Programs (Second ed.). Washington D.C.: BNA Book.
Jessup, D. H. (1994). Guide to State Environmental Programs (Third ed.). Washington D.C.: BNA Book.
Rabe, B. G. (1986). Fragmentation and integration in state environmental management. The Conservation Foundation, Washington DC. 1986. 174.
Ringquist, E. J. (1993). Environmental protection at the state level: Politics and progress in controlling pollution: ME Sharpe.
Slavin, S. (1985). An Introduction to Human Services Management (Vol. I). New York, NY: The Haworth Press.
Teaford, J. C. (2002). The rise of the states: Evolution of American state government (Vol. 120): JHU Press.
Alabama
Alabama DEM (2012) Alabama’s Water Quality Assessment and Listing Methodology.
Alabama DEM Admin. Code r 335-13-x-.xx
Alabama DEM Admin. Code r 335-14-x-.xx
Alabama DEM Admin. Code r 335-3-x-.xx
Alabama DEM Admin. Code r. 335-2-x-.xx
285
Alabama DEM. (2001). Alabama Department of Environmental Management: Functional Analysis and Records Disposition Authority. Retrieved from http://www.archives.alabama.gov/officials/rdas/adem.pdf.
Alabama DEM. (2002). Politics and Public Policy in Arizona (Z. A. Smith Ed. Third ed.). Westport, CT: Praeger Publishers.
Alabama DEM. (2012) Integrated Water Quality Monitoring and Assessment Report: Water Quality in Alabama 2010-2012.
Alabama DEM. (2012). 2012 Annual Report. Montgomery, Alabama.
Alabama DEM. (2016). Alabama Department of Environmental Management. Retrieved from http://adem.alabama.gov/default.cnt
Alabama DEM. Alabama Department of Environmental Management Website. http://www.adem.state.al.us/. 2016.
Ala. Admin Code § 41-23-5.
Alabama Department of Agriculture and Industries (2015). Department of Agriculture and Industries: Functional Analysis and Records Disposition Authority. Retrieved from http://www.archives.alabama.gov/officials/rdas/Ag_industries_RDA_2015_04_22_FINAL.pdf.
Alabama Department of Archives and History (1982). Official and Statistical Register
Alabama Department of Archives and History. Retrieved from http://www.archives.alabama.gov/reorganization/, 2016.
Alabama Department of Commerce (2011). Alabama Department of Commerce: Functional Analysis and Records Disposition Authority. Retrieved from http://www.archives.alabama.gov/officials/rdas/commerce.pdf.
Alabama Department of Conservation and Natural Resources, (2002). Alabama Department of Conservation and Natural Resources: Functional Analysis and Records Disposition Authority. Retrieved from http://www.archives.alabama.gov/officials/rdas/conserva.pdf.
Alabama Department of Public Health (2014) Alabama Department of Public Health Organizational Chart.
Alabama State Records Commission (2000). Alabama Surface Mining Commission: Functional Analysis and Records Disposition Authority.
Alabama State Records Commission (2001). Geological Survey of Alabama: Functional Analysis and Records Disposition Authority.
Alabama State Records Commission (2003). Alabama Medicaid Agency: Functional Analysis and Records Disposition Authority.
286
Alabama State Records Commission (2005). Alabama Department of Economic and Community Affairs: Functional Analysis and Records Disposition Authority.
Alabama State Records Commission (2007). Soil and Water Conservation Districts, Alabama Soil and Water Conservation Committee, Alabama Agricultural and Conservation Development Commission: Functional Analysis and Records Disposition Authority.
Alabama State Records Commission (2011). Alabama Department of Mental Health: Functional Analysis and Records Disposition Authority.
Alabama State Records Commission (2013). Alabama Department of Public Health: Functional Analysis and Records Disposition Authority.
Alabama State Records Commission (2013). Public Service Commission: Functional Analysis and Records Disposition Authority.
Alabama State Records Commission. (2001). State Oil and Gas Board: Functional Analysis and Records Disposition Authority.
Alabama Surface Mining Commission (2000). Alabama Surface Mining Commission: Functional Analysis & Records Disposition Authority. Retrieved from http://www.archives.alabama.gov/officials/rdas/SURFMINO.pdf.
League of Women Voters of Alabama Education Fund (1999). Facts and Issues: Environmental Management in Alabama. Retrieved from http://www.lwval.org/FIEnvironMgmnt.html#about%20publication
Arizona
Arizona Secretary of State. Arizona State Library, Archives, and Public Records. State Agency
Administrative Histories.” Arizona State Library, Archives, and Public Records website, https://statelibraryofarizona.wordpress.com/state-agency-administrative-histories. Accessed 2016.
Arizona Department of Health Services (2102). Arizona Health Services Through the Century.
Arizona DEQ (2012). 25 Years Protecting Arizona’s Environment: 1987-2012.
Arizona DEQ (2016). Arizona Department of Environmental Quality website. Retrieved from azdeq.gov.
Arizona House Governmental Relations Committee (1971). Governmental Reorganization: Report to the Arizona Legislature.
287
Arizona Office of the Auditor General (1999). Arizona Air Pollution Control Hearing Board. Report No 99-2
Arizona Office of the Auditor General (2013). Department of Environmental Quality – Sunset Factors. Report No 13-10.
Arizona Secretary of State (2014). Administrative Histories.
Arizona Senate Bill 1284 Forty-forth Legislature, 2000.
Smith, Z. A. (2002). Politics and public policy in Arizona: Greenwood Publishing Group.
Alaska
Alaska DEC (1972). Air Quality Control Plan, Volume 1.
Alaska DEC (2005). Groundwater in Alaska.
Alaska DEC (2016). Alaska Department of Environmental Conservation website. Retrieved from https://dec.alaska.gov/
Alaska DEC. Alaska Water Quality Standards and Some History.
Alaska Department of Administration. State of Alaska Organizational Chart. Retrieved from http://doa.alaska.gov/dop/fileadmin/Employee_Orientation/pdf/SOAOrganizationChart.pdf
Alaska Department of Fish and Wildlife (2016). Alaska Department of Fish and Wildlife website. Retrieved from http://www.adfg.alaska.gov/
Alaska Department of Health and Social Services (1993). A History of Health and Social Services in Alaska.
Alaska Oil and Gas Conservation Commission (2008). AOGCC: 50 Years of Services to Alaska.
USEPA (1976). 1976 Environmental Quality Profile for Alaska Technical Supplement. EPA Report EPA-910/9-76-026A.
Arkansas
Arkansas Commissioner of State Lands (2016). Arkansas Commissioner of State Lands website retrieved from http://history.cosl.org/
Arkansas Department of Health (2016). Arkansas Department of Health website. Retrieved from http://www.healthy.arkansas.gov/Pages/default.aspx
Arkansas Department of Human Services. Employee Handbook. Pub-146 (R.09/07).

288
Arkansas DEQ (2013). Arkansas Department of Environmental Quality: Who We Are and What We Do.
Arkansas DEQ (2014). Arkansas Department of Environmental Quality Organizational Chart.
Arkansas DEQ (2016). Arkansas Department of Environmental Quality website. Retrieved from https://www.adeq.state.ar.us/
Arkansas Fish and Game Commission (2016). Arkansas Fish and Game Commission website. Retrieved form https://www.adeq.state.ar.us/home/about/history.aspx
Arkansas Forestry Commission (2016). Arkansas Forestry Commission website retrieved from http://forestry.arkansas.gov/aboutAFC/Pages/default.aspx
Arkansas Geological Survey (2016). Arkansas Geological Survey website. Retrieved form http://www.geology.ar.gov/home/index.htm
Arkansas Natural Resources Commission (2014). Arkansas Natural Resources Commission Organizational Chart.
Arkansas Natural Resources Commission (2016). Arkansas Natural Resources Commission website retrieved from http://anrc.ark.org/about-us/our-history-purpose
Arkansas Pollution Control and Ecology Commission. Accessed https://www.adeq.state.ar.us/commission/ 2016.
Central Arkansas Library System (2015). Arkansas Department of Parks and Tourism. Retrieved from http://www.encyclopediaofarkansas.net/encyclopedia/entry-detail.aspx?entryID=5712
California
California Department of Technology (2016.) California State Organizational Chart. Retrieved from http://www.cold.ca.gov/
California EPA (2016). California EPA Website. Retrieved from http://www.calepa.ca.gov/.
California Fish and Game Commission (2016). California Fish and Game Commission website. Retrieved from http://www.fgc.ca.gov/
California Water Boards (2013). State Water Resources Control Board and the Regional Water Quality Control Boards: Working Together to Protect California’s Water Resources.
Simmons, Charlene Wear (2004). To Faithfully Execute the Law: California’s Executive Branch Agencies 1959-2003. Sacramento, CA.
289
Colorado
5 Colo Code Regs §1001-1
Colorado Air Quality Control Commission (2012). Colorado Air Quality Control Commission Strategic Plan.
Colorado DPHE (2005). History of Public Health in Colorado.
Colorado DPHE (2013). Colorado Air Quality Control Commission: Report to the Public 2012-2103. Denver, CO.
Colorado DPHE (2014). Annual Report to the Colorado Legislature and Water Quality Control Commission.
Colorado DPHE (2016). Colorado Department of Public Health and Environment website. Retrieved from https://www.colorado.gov/cdphe
Colorado Governor’s Office (2013). Colorado Boards and Commissions: Terms Expiring by December 21, 2013.
Colorado Legislative Council (1967). Report to the Colorado General Assembly: Reorganizing the Executive Branch of Colorado’s State Government. Research Publication No. 131.
Colorado Office of Legislative Legal Services (2008). Legislative Drafting Manual – 2008 Edition.
MacDonnell, Lawrence J (1989). Water Quality and Water Rights in Colorado. Completion Report No. 151.
Silverstein, Mike (2011). Colorado Air Quality Challenges and Accomplishment Over the Years. Presentation to the Colorado Environmental Health Association’s Annual Education Conference.
Solid and Hazardous Waste Commission (2014). Solid and Hazardous Waste Commission Annual Report 2013-2014. Denver, CO.
Connecticut
Connecticut Department of Energy and Environmental Protection (2016). CT DEEP Website. Retrieved from http://www.ct.gov/deep/site/default.asp, 2016.
Connecticut State Library (2016). State Agency Profiles. Retrieved from http://ctstatelibrary.org/access-services/state-agencies/stateagenciesindexhome/
290
Connecticut State Library (2016). State Archives Finding Aids. Retrieved from http://ctstatelibrary.org/state-archives-finding-aids/.
Delaware
Del. Code Chapter 152 (1957).
Del. Code Chapter 188 (1963-1964).
Del. Code Chapter 259 (1937).
Del. Code Chapter 287 (1937).
Del. Code Chapter 324 (1947).
Del. Code Chapter 442 (1965-1966).
Delaware Department of Natural Resources and Environmental Control (DNREC) (2016). DNREC Website. Retrieved from www.dnrec.delware.gov
Delaware Public Archives (2016). Agency Histories. Retrieved from http://archives.delaware.gov/collections/aghist/, 2016.
Webb, Dawn L. and Terry L. Higgins. Preserving Delaware’s Natural History…The First Century. Retrieved from DNREC website http://www.dnrec.delaware.gov/fw/sitecollectiondocuments/fw%20gallery/fwhistory.pdf, 2016.
Florida
Bigler, W. J. (1989). Florida's Public Health Centennial. Florida Journal of Public Health, 1(3), 7-19.
Fla Stat §27 Chapter 381 (1969)
Florida Department of Environmental Protection (2016). Florida Department of Environmental Protection website. Retrieved from http://www.dep.state.fl.us/mainpage/about/about_dep.htm
Florida Department of State, Division of Library and Information Services (2016). State Archives of Florida Online Catalog. Retrieved from http://dlis.dos.state.fl.us/barm/rediscovery/default.asp
Florida Senate Committee on Environmental Preservation and Conservation (2011). Environmental Regulation Commission Interim Report 2012-120.

291
Kirilloff, William (2012). The Florida Environmental Approach: Water Management. The National Law Review. http://www.natlawreview.com/article/florida-environmental-approach-water-management
Plager, Sheldon J.; Maloney, Frank E.; and Baldwin, Fletcher N. Jr., "Water Pollution -- Attempts to Decontaminate Florida Law" (1967). Faculty Publications. Paper 1137. http://www.repository.law.indiana.edu/facpub/1137
Georgia
Georgia Department of Archives and History (1963-64). Georgia’s Official Register 1963-1964. Atlanta, Georgia.
Georgia Department of Archives and History (1963-64). Georgia’s Official Register 1965-1966. Atlanta, Georgia.
Georgia Department of Archives and History (1963-64). Georgia’s Official Register 1967-1968. Atlanta, Georgia.
Georgia Department of Archives and History (1971). Preliminary Descriptive Inventory: Department of Public Health. Retrieved from http://georgiaarchives.org/what_do_we_have/online_indexes/paper_pdi/RG026/026-02-027.pdf
Georgia Department of Natural Resources (2016). Georgia Department of Natural Resources website. Retrieved from http://epd.georgia.gov/
Georgia Forestry Commission (2016). History of the Georgia Forestry Commission. Retreived from http://www.gatrees.org/about-us/history/index.cfm
Georgia Historical Society (2016). Finding Aids for Archival Collections. Retrieved from http://ghs.galileo.usg.edu/ghs/search
Kundell, James E., and Margaret E. Myszewski. "Environmental Policy." New Georgia Encyclopedia. 09 September 2014. Web. 15 November 2016.
Sweeney, Timothy (2011). FY 2012 Budget Funds New Department of Public Health: Highlights of the Enacted FY 2012 Budget for the Department of Public Health. Georgia Budget and Policy Institute.
Hawaii
Claveria, S. K., & Kaito, G. M. (1985). The Feasibility of Environmental Reorganization for Hawaii. (No. 1, 1985). Honolulu, Hawaii.
Hawaii Department of Health (2012). Annual Report for Fiscal Year 2012.

292
Hawaii Department of Health (2016). Hawaii Department of Health website. Retrieved from http://health.hawaii.gov
Hawaii Legislative Reference Bureau (1959). Hawaii State Government Organization Selected Memoranda Volume 1. Honolulu, Hawaii
Hawaii Legislative Reference Bureau (2016). Department of Health. Retrieved from http://lrbhawaii.org/gd/doh.pdf.
Hawaii State Archives (2004). Inventory of Records of the Department of Health. Retrieved from http://ags.hawaii.gov/wp-content/uploads/2013/02/DOHFA2007updated.pdf
Idaho
Coffman, M. (2011). Idaho's DEQ Implements Policies Primarily Dictated by Federal EPA, lawsuits. Idaho Reporter.com. Retrieved from http://idahoreporter.com/16159/idahos-deq-implements-policies-primarily-dictated-by-federal-epa-lawsuits/
Idaho Department of Environmental Quality. Idaho Department of Environmental Quality website. Retrieved from https://www.deq.idaho.gov/
Idaho Department of Health and Welfare (1984). Idaho Environmental Quality Profile 1984. Boise, Idaho.
Idaho Department of Health and Welfare (2016). Idaho Department of Health and Welfare website. Retrieved from http://healthandwelfare.idaho.gov/.
Idaho Governor’s Office of Energy Resources. Idaho Governor’s Office of Energy Resources website. Retrieved from https://energy.idaho.gov/
USEPA (1972). Idaho Environmental Status and Program Evaluation – 1972. Seattle, Washington.
USEPA (1978). Air Pollution Regulations in State Implementation Plans: Idaho. (EPA-450/3-78-062).
Illinois
Currie, David P. (1975). Enforcement Under the Illinois Pollution Law. 70 Northwestern University Law Review 389 (1975).
Illinois Department of Natural Resources (2016). Illinois Department of Natural Resources website. Retrieved from https://www.dnr.illinois.gov/Pages/default.aspx

293
Illinois Environmental Protection Agency (2016). Illinois Environmental Protection Agency website. Retrieved from http://www.epa.illinois.gov/index
Illinois Natural History Survey (1995). Government Reorganization. Retrieved from http://wwx.inhs.illinois.edu/resources/inhsreports/sep-oct95/gov/
Illinois Secretary of State (2013-2014). Illinois Blue Book 2013-2014. Retrieved from http://www.cyberdriveillinois.com/publications/illinois_bluebook/home.html
Indiana
Indiana Department of Environmental Management. IDEM 101: An Introduction to the Indiana Department of Environmental Management (IDEM), its offices, and its role in protecting Hoosiers and our environment. Retrieved from www.in.gov/idem/files/about_idem_101.ppt
Indiana Department of Environmental Management. Indiana Department of Environmental Management website. Retrieved from http://www.in.gov/idem/
Indiana Historical Bureau (1998). Progress in Public Health. Indiana Historian.
Indiana State Department of Health (1999). Regulatory Aspects of On-site Sewage Disposal.
Juergensmeyer, Julian J. (1968). Air Pollution Control in Indiana in 1968: A Comment. 2 Val. U. L. Rev. 296.
Lori Kyle Endris and Wayne E. Penrod (1996). Judicial Independence in Administrative Adjudication: Indiana's Environmental Solution, 16 J. National Association of Administrative Law Judiciary.
Iowa
Bierring, Walter L. 80 Years: History (1880-1960) Iowa State Department of Health.
Environmental Protection—Water Pollution Control Reform in Iowa: The Department of Environmental Quality Act of 1972 (1974), 8 Urban Law Annual 241/
Iowa Department of Natural Resources. Iowa Department of Natural Resources website. Retrieved from www.iowadnr.gov
O’Connell, Jeffrey (1962). Iowa’s New Water Statute – The Constitutionality of Regulating Existing Uses of Water. 47 Iowa Law Review (3)
State of Historical Society of Iowa (2016). State Archives Collections. Retrieved from http://www.iowahistory.org/archives/holdings/state-archives/water-air-waste-management.html

294
State of Iowa (1978). Final Report of the Joint Subcommittee on Obsolete Boards and Commissions of the Senate and House Committees on State Government. December 1977.
State of Iowa. Iowa Official Register 1929-30. Des Moines, Iowa.
State of Iowa. Iowa Official Register 1937-38. Des Moines, Iowa.
State of Iowa. Iowa Official Register 1965-66. Des Moines, Iowa.
State of Iowa. Iowa Official Register 1969-70. Des Moines, Iowa.
State of Iowa. Iowa Official Register 1971-72. Des Moines, Iowa.
State of Iowa. Iowa Official Register 1973-74. Des Moines, Iowa.
State of Iowa. Iowa Official Register 1975-76. Des Moines, Iowa.
State of Iowa. Iowa Official Register 1975-76. Des Moines, Iowa.
State of Iowa. Iowa Official Register 1977-78. Des Moines, Iowa.
State of Iowa. Iowa Official Register 1979-80. Des Moines, Iowa.
State of Iowa. Iowa Official Register 1985-86. Des Moines, Iowa.
State of Iowa. Iowa Official Register 1987-88. Des Moines, Iowa.
State of Iowa. Iowa Official Register 1989-90. Des Moines, Iowa.
State of Iowa. Iowa Official Register 1995-96. Des Moines, Iowa.
Kansas
Kansas Corporation Commission. Kansas Corporation Commission website retrieved from http://www.kcc.state.ks.us/
Kansas Department of Health and Environment (2016). Kansas Department of Health and Environment website. Retrieved from http://www.kdheks.gov/
Shepherd, M. D., West, G. C., Hargrove, W. L., Schoemaker, T. S., & St. Peter, R. F. (1999). The Organization of Public Health and Environmental Functions in Kansas. Topeka, Kansas.
Shields, Mike (2011). The Undoing of the Kansas Health: A Five-Year Experiment Soon to End. Kansas Health Institute News Services. Retrieved from http://www.khi.org/news/article/undoing-kansas-health-policy-authority/
Kentucky

295
Kentucky Cabinet for Health and Family Services (2016). Kentucky Cabinet for Health and Family Services website. Retrieved from http://chfs.ky.gov/os/ocar/dah/history.htm
Legislative Research Commission (2002). The Executive Branch of Kentucky State Government. Informational Bulletin No. 171.
McConnell, M., Grayson, T., Clinger, J. C., & Hail, M. W. (2013). Kentucky Government, Politics, and Public Policy: University Press of Kentucky.
Social Networks and Archival Context (2016). Kentucky Air Pollution Commission. Retrieved from http://socialarchive.iath.virginia.edu/ark:/99166/w60w45mf
Louisiana
Board of Health (1906-1907). Biennial Report of the Louisiana State Board of Health to the General Assembly of Louisiana 1906-1907.
Lake Charles American Press (1967). “State Health Services”.
Louisiana Department of Environmental Quality. Louisiana Department of Environmental Quality website. Retrieved from http://www.deq.louisiana.gov/portal/
Louisiana Department of Social Services, Office of Community Services (2002). Child and Family Services Review: Louisiana Statewide Assessment. Baton Rouge, Louisiana.
Louisiana House of Representatives, House Legislative Services (2011). State and Local Government in Louisiana: An Overview.
Louisiana Wild Life and Fisheries Commission (1964-1965). Louisiana Wild Life and Fisheries Commission. New Orleans, Louisiana. Retrieved from https://archive.org/details/louisianawildlif11depa
McCowan Jr., Charles S (1992). “The Evolution of Environmental Law in Louisiana.” 52 Louisiana Law Review (4).
Purnell, Allan (1976). “Reorganization Bill is Passed.” The Monroe News Star.
The Monroe News Start (1972). “Speaker Tells of Dangers of Pollution.”
Maine
Blomquist, Robert F. (1999). What is Past is Prologue: Senator Edmund S. Muskie’s Environmental Policymaking Roots as Governor of Maine, 1955-58. 51 Maine Law Review 88.
Department of Health and Human Services (2013). Programs, Services, and Funding, April 2013. Augusta, Maine.
296
Maine An Encyclopedia (2016). Executive Branch. Retrieved from http://maineanencyclopedia.com/executive-branch/
Maine Department of Environmental Protection (2016). Maine Department of Environmental Protection website. Retrieved from www.maine.gov/dep
Maine Department of Health and Human Services (2007). A Brief History of Statewide Public Health Infrastructure in Maine. Retrieved from http://www.maine.gov/dhhs/mecdc/public-health-systems/scc/phwg/index.shtml
Maine State Planning Office (1971). State of Maine Government Reorganization: A Summary of New Departments and Agencies Approved by the 105th Legislature. State Planning Office, Paper 74.
McFarlane, Wallace Scot (2012). “Defining a Nuisance: Pollution, Science, and Environmental Politics on Maine’s Androscoggin River.” Environmental History 17.
MRS. 10 § 317 (1971)
MRS. 3 § 34 (1980)
MRS. Chapter 475 (1967)
Palmer, K. T. (1992). Maine politics and government: U of Nebraska Press.
Waite, G. Graham (1971). Ransoming the Maine Environment. 23 Maine Law Review 103.
Maryland
Maryland Environmental Service (2016). Maryland Environmental Service website. Retrieved from http://www.menv.com/
Maryland State Archives (2016). Maryland Manual On-Line: A Guide to Maryland and its Government. Retrieved from http://msa.maryland.gov/msa/mdmanual/html/mmtoc.html
The Committee on Executive Reorganization (1969). Executive Reorganization: A Comprehensive Plan for Maryland. Report of the Governor’s Executive Reorganization Committee. Baltimore, Maryland.
Massachusetts
Boston, 1953, Acts and Resolves Passed By the General Court of Massachusetts in The Year 1953. Chapter 631.
Boston, 1954, Acts and Resolves Passed By the General Court of Massachusetts in The Year 1954. Chapter 672.
297
Boston, 1956, Acts and Resolves Passed By the General Court of Massachusetts in The Year 1956. Chapter 620.
Boston, 1975, Acts and Resolves Passed By the General Court of Massachusetts in The Year 1975. Chapter 706.
Department of Conservation and Recreation (2009). The Massachusetts Water Resources Commission Commissioner Handbook.
Deval, G. P. (2007). Governor Patrick Files Legislation to Reorganize Cabinet [Press release]
Executive Office of Energy and Environmental Affairs (2016). Executive Office of Energy and Environmental Affairs website. Retrieved from http://www.mass.gov/eea/
Massachusetts Executive Office for Health and Human Services. Executive Office for Health and Human Service website. Retrieved from http://www.mass.gov/eohhs/gov/departments/dmh/about-the-department-of-mental-health.html
Social Networks and Archive Content. Massachusetts Office of Economic Affairs. Retrieved from: http://socialarchive.iath.virginia.edu/ark:/99166/w6w140g1
State Library of Massachusetts, Special Collections Department. Ms. Coll. 25 Governor’s Advisory Committee on Modernization of the Executive Branch Records, 1968-1973: Guide.
The Commonwealth of Massachusetts (1964). Report Submitted by the Legislative Research Council Relative to Combining State Departments of Public Welfare, Public Health, and Mental Health, Boston, Massachusetts.
The Commonwealth of Massachusetts (1987-1988). A Manual for the Use of the General Court for 1995-1996. Boston, Massachusetts.
The Commonwealth of Massachusetts (1993-1994). A Manual for the Use of the General Court for 1993-1994. Boston, Massachusetts.
The Commonwealth of Massachusetts (1995-1996). A Manual for the Use of the General Court for 1995-1996. Boston, Massachusetts.
The Commonwealth of Massachusetts (1999-2000). A Manual for the Use of the General Court for 1999-2000. Boston, Massachusetts.
The Commonwealth of Massachusetts (2007-2008). A Manual for the Use of the General Court for 2007-2008. Boston, Massachusetts.
The Commonwealth of Massachusetts (2009-2010). A Manual for the Use of the General Court for 2009-2010. Boston, Massachusetts.

298
Michigan
Michigan Department of Environmental Quality. Michigan Department of Environmental Quality website. Retrieved from http://www.michigan.gov/deq/
Michigan Environmental Council (2014). Michigan Environmental Timeline. Retrieved from http://environmentalcouncil.org/
Michigan Department of Natural Resources (2016). Michigan Department of Natural Resources website. Retrieved from http://www.michigan.gov/dnr/
Michigan Next Energy Authority. Michigan Next Energy Authority website. Retrieved from https://www.nextenergy.org/
Frost, Jack (2013). Jack Frost’s Essay, Part I. Water Words, published by Water Resources Division, Michigan Department of Environmental Quality. Retrieved from http://www.michigan.gov/documents/deq/wrd-waterwords-20131212_442369_7.pdf
Frost, Jack (2013). Jack Frost’s Essay, Part II. Water Words, published by Water Resources Division, Michigan Department of Environmental Quality. Retrieved from http://www.michigan.gov/documents/deq/wrd-waterwords-20131219_442997_7.pdf
Michigan Legislative Service Bureau (2011). Michigan Manual 2011-2012. Lansing, Michigan. Retrieved from http://www.legislature.mi.gov/(S(votmw133rqp5eax2uswaptrk))/mileg.aspx?page=MichiganManual
Michigan Department of Human Services (2011). A Brief History of Human Services in Michigan. DHS Pub-159 (1-11). Retrieved from http://www.michigan.gov/documents/dhs/DHS-Pub-0159_345278_7.pdf
Michigan Executive Organizational Act of 1967 (Act 380), Mich. Comp Laws § 1-16.101 (1965) Retrieved from http://www.legislature.mi.gov/(S(pku4njjwacgf44eo4be32fbi))/mileg.aspx?page=GetObject&objectname=mcl-act-380-of-1965
Michigan Executive Organizational Act of 1967 (Act 380), Mich. Comp Laws § 18-16.525 (1965) Retrieved from http://www.legislature.mi.gov/(S(pku4njjwacgf44eo4be32fbi))/mileg.aspx?page=GetObject&objectname=mcl-act-380-of-1965
Michigan Executive Organizational Act of 1967 (Act 380), Mich. Comp Laws § 17-16.500 (1965) Retrieved from http://www.legislature.mi.gov/(S(pku4njjwacgf44eo4be32fbi))/mileg.aspx?page=GetObject&objectname=mcl-act-380-of-1965

299
Michigan Public Health Code of 1978 (Act 368), Mich. Comp Laws § 333-1101 (1978). Retrieved from http://www.legislature.mi.gov/(S(lv4kybmy2kzx4e0ujeqmc1xq))/mileg.aspx?page=GetObject&objectname=mcl-Act-368-of-1978
Michigan Exec. Order No 1973-2 (September 1, 1973). Retrieved from https://www.legislature.mi.gov/(S(r0zfy32fjfof1eps2enj5f12))/documents/mcl/pdf/mcl-E-R-O-No-1973-2.pdf
Michigan Exec. Order No 1996-2 (September 17, 2003). Retrieved from https://www.legislature.mi.gov/(S(oorusw45mlow4w45q2wn1byv))/documents/mcl/pdf/mcl-E-R-O-No-1996-2.pdf
Michigan Exec. Order No 2011-1 (March 13, 2011). Retrieved from https://www.michigan.gov/documents/snyder/EO-01-2011_342039_7.pdf
Minnesota
Minnesota Historical Society. Minnesota Historical Society website. Retrieved from sites.mnhs.org/library/
Minnesota History Center, Gale Family Library (2016). State Institutions: Administrative Agencies. Retrieved from http://libguides.mnhs.org/institutions/aa
Minnesota House of Representatives, Research Department (2002). Minnesota Solid Waste History: Major Milestones. Retrieved from http://www.house.leg.state.mn.us/hrd/pubs/solwaste.pdf
Minnesota Legislative Reference (2016). Minnesota Agencies. Retrieved from http://www.leg.state.mn.us/lrl/agencies/agencies_detail.aspx?AgencyID=1338
Minnesota Pollution Control Agency (2016). Minnesota Pollution Control Agency website. Retrieved from https://www.pca.state.mn.us/
Minnesota Secretary of State (2014). Minnesota Legislative Manual 2013-2014. Retrieved from http://www.sos.state.mn.us/about-minnesota/get-a-blue-book/2013-2014-legislative-manual-bluebook/
Mississippi
Joint Legislative Committee on Performance Evaluation and Expenditure Review (PEER) (2000). A Review of the Mississippi State Department of Health. Retrieved from http://www.peer.state.ms.us/reports/rpt408.pdf
Krane, D., & Shaffer, S. D. (1992). Mississippi government and politics: Modernizers versus traditionalists: U of Nebraska Press.

300
Kynerd, T. E. (1978). Administrative reorganization of Mississippi Government: a study in politics: University Press of Mississippi.
Mississippi Department of Environmental Quality (2016). Mississippi Department of Environmental Quality website. Retrieved from www.deq.state.ms.us
Mississippi Department of Health (2016). Mississippi Department of Health website. Retrieved from http://msdh.ms.gov/msdhsite/_static/19,0,378.html
Mississippi Department of Human Services (2013). Mississippi Department of Human Services 2013 Annual Report. Retrieved from http://www.mdhs.state.ms.us/publications/agency-annual-reports/
Mississippi Department of Marine Resources (2016). Mississippi Department of Marine Resources website. Retrieved from www.dmr.state.ms.us
Mississippi Department of Wildlife, Fisheries, and Parks (2016). Mississippi Department Wildlife, Fisheries, and Parks website. Retrieved from https://www.mdwfp.com/
Mississippi Department of Wildlife, Fisheries, and Parks. Our Vision: Conservation Mississippi Department of Wildlife, Fisheries, and Parks Strategic Plan. Retrieved from https://www.mdwfp.com/media/98147/conservationstrategicplan.pdf?iframe
Missouri
Missouri Department of Health and Senior Services (2016). Missouri Department of Health and Senior Services website. Retrieved from http://health.mo.gov/about/
Missouri Department of Natural Resources (2016). Missouri Department of Natural Resources website. Retrieved from http://dnr.mo.gov/
Missouri Secretary of State (1973-1974). Official Manual State of Missouri 1973-1974.
Missouri Secretary of State (2014). Official Manual State of Missouri 2013-2014.
State Board of Charities and Corrections of Missouri (1914). Ninth Biennial Report 1913-1914. Columbia, Missouri.
Swindler, William F.(1958), "Missouri Constitutions: History, Theory and Practice (continued)". William and Mary Law School Faculty Publications. Paper 1617.
Montana
Barton H. Thompson Jr. (2003). Constitutionalizing the Environment: The History and Future of Montana's Environmental Provisions, 64 Mont. L.Rev.
301
Horwich, John L. (1993). Water Quality Nondegradation in Montana: Is Any Deterioration Too Much? 14 Public Land and Resources Law Review 145.
Mark A. Clark (1971). Water—A Problem in Montana, 32 Mont. L. Rev. 1,
Montana Department of Environmental Quality (2016). Montana Department of Environmental Quality website. Retrieved from www.deq.mt.gov.
Montana Historical Society (2016). Montana History Compass website. Retrieved from http://mthistory.pbworks.com/w/page/103836583/Subject%20Guides%3A%20Government%20Records
Nebraska
Department of Health and Human Services (2011). Nebraska Department of Health and Human Services History. Retrieved from www.dhhs.ne.gov
Governor’s Policy Research Office (2002). Nebraska State Government Executive Branch Organization. Lincoln, Nebraska.
Miewald, R. D. (1984). Nebraska Government & Politics: U of Nebraska Press.
Nebraska Department of Environmental Quality (2013). Annual Report to the Legislature. Lincoln, Nebraska.
Nebraska Department of Environmental Quality (2016). Nebraska Department of Environmental Quality website. Retrieved from www.deq.state.ne.us.
Nebraska Legislature (2015). 2014-15 Nebraska Blue Book. Lincoln, Nebraska.
Nebraska Soil and Water Conservation Commission (1970). State Water Plan Publication Number 101E Framework Study Appendix E: Survey of Nebraska Water Law.
Nebraska State Historical Society (2016). Finding Aids for State Records. Retrieved from http://www.nebraskahistory.org/lib-arch/research/public/state_finding_aids/index.htm
Olson, E. A. (1971), "EC71-795 Waste Management for Feedlots". Historical Materials from University of Nebraska-Lincoln Extension. Paper 4088.
Nevada
Balitzer, Alfred. The Nevada State Environmental Commission 1973-1990. Publication of the Rose Institute of State and Local Government, Claremont McKenna College, Claremont, California.
Nevada Department of Conservation and Natural Resources (2010). Strategic Plan 2011-13.

302
Nevada Department of Conservation and Natural Resources (2016). Nevada Department of Conservation and Natural Resources website. Retrieved from www.dcnr.nv.gov
Nevada Department of Health and Human Services (2016). Nevada Department of Health and Human Services website. Retrieved from www.dhhs.nv.go
Nevada State Library and Archives (2016). Nevada Executive Branch Agency Records. Retrieved from http://nsla.nv.gov/Exec_Branch/
New Hampshire
Hodge, James, G. and Lawrence O. Gostin (1999). New Hampshire Public Health Law. Georgetown University Law Center, Washington D.C.
New Hampshire Department of Environmental Services (2016). New Hampshire Department of Environmental Services website. Retrieved from www.des.nh.gov/
Patterson, Jennifer (2004). The Environmental Protection Bureau, Past and Present. New Hampshire Bar Journal, Spring 2004. Retrieved from https://www.nhbar.org/publications/archives/display-journal-issue.asp?id=24
New Jersey
Goldshore, Lewis (1976). “A Flood of Environmental Legislation: An Analysis of the New Jersey Experience, 1970-1975, 1 Seton Hall Legislative Journal 2.
Goldshore, Lewis P. and John J Tozzi (1971). “The State’s Role in the Development of Local Air Pollution Control Programs.” Journal of Air Pollution Control Association, 21:3 115-117.
Hanks, Eva Morreale (1968). “The Law of Water in New Jersey.” 22 Rutgers Law Review 621.
Lioy, Paul J. and Panos G. Georgopoulos (2011). “New Jersey: A Case Study of the Reduction in Urban and Suburban Air Pollution from the 1950s to 2010.” 119 Environmental Health Perspectives 10.
Moran, Gerard, R. (1955). The Air Pollution Control Act and its Administration. 9 Rutgers Law Review 4.
New Jersey Clean Air Council (1969). Report of the Clean Air Council on the Status of Air Pollution Control in New Jersey, with Recommendations for Future Actions.
New Jersey Department of Environmental Protection (2016). New Jersey Department of Environmental Protection website. Retrieved from www.nj.gov/dep

303
New Jersey State Archives (2016). Catalog. Retrieved from http://www.nj.gov/state/archives
New Mexico
Cline, Dorothy (1978). Reorganization of the Executive Branch of State Government New Mexico 1975-1978. Albuquerque, NM: Institute for Applied Research, University of New Mexico.
Gordon, Larry (1999). “Environmental Health and Protection: A Primer” Retrieved from https://aaosi.wildapricot.org/Resources/Documents/primer.pdf
Gordon, Larry (2009). “The Making of Modern New Mexico: The Role of Governor King.” Retrieved from http://www.ccdeh.com/resources/documents/larry-gordon-articles-1/58-the-making-of-modern-new-mexico-the-role-of-governor-king-1/file
Gordon, Larry (2010). Environmental Health and Protection Adventures. Unpublished book. Retrieved from http://www.larryjgordon.com/Environmental_Health_and_Protection_Adventures.htm
Gordon, Larry J. (1993). “History of Environmental Health and Protection in Albuquerque and New Mexico: An Overview.” Retrieved from https://aaosi.wildapricot.org/Resources/Documents/History_of_EH_P_in_Albuq.pdf
Greenfield, M. (1962). A history of public health in New Mexico: University of New Mexico Press.
Hain, P. L., & Garcia, F. C. (1994). New Mexico Government: UNM Press.
Lavash, D. (2006). A Journey Through New Mexico History (Hardcover): Sunstone Press.
Legislative Council Service (2002). Inventory of Statutory Executive Boards and Commissions.
New Mexico Energy, Minerals, and Natural Resources Department (2016). New Mexico Energy, Minerals, and Natural Resources website. Retrieved from http://www.emnrd.state.nm.us
New Mexico Environment Department (2016). New Mexico Environment Department website. Retrieved from https://www.env.nm.gov
New Mexico Government Restructuring Task Force (2010). Final Report 2010. Santa Fe, New Mexico.
New Mexico Government Restructuring Task Force (2010). Government Structure – 1977 and Now. Retrieved from
304
https://www.nmlegis.gov/handouts/GRTF%20042110%20Item%200%20government%20structure%201977.pdf
New York
Infausto, Felix and Byron T. Hipple Jr. (1946). Reorganization of Public Welfare Systems in New York State. 6 Public Administration Review 4.
Marlow, Sidney and Benjamin Feiner (1967). Experience with the New York State Air Pollution Control Rules – Industrial Sources. 28 American Industrial Hygiene Association Journal 2.
Martin, R. C. (1960). Water for New York: A Study in State Administration of Water Resources (Vol. 26): Syracuse University Press.
New York Department of Environmental Conservation (2016). New York Department of Environmental Conservation website. Retrieved from www.dec.ny.gov/
New York Department of Health (2016). New York Department of Health website. Retrieved from www.health.ny.gov
Pecorella, R. F., & Stonecash, J. M. (2006). Governing New York State: SUNY Press.
Zimmerman, J. F. (2008). The Government and Politics of New York State: SUNY Press.
North Carolina
An Act to Create a Board of Water and Air Resources and to Define its Duties and Powers Relating to Water and Air Pollution Control and Water Resource Management, North Carolina General Assembly Bill 356 (1967), Chapter 892.
An Act to Reorganize State Government, North Carolina General Assembly Bill 863 (1971), Chapter 864.
Government Records Branch of North Carolina (2016). Agency Histories. Retrieved from http://www.stateschedules.ncdcr.gov/
Mazzocchi, Jay (2006). Public Health. Retrieved from http://ncpedia.org/public-health
North Carolina Department of Environment and Natural Resources (2014). North Carolina Department of Environmental and Natural Resources website. Retrieved from http://www.ncdenr.gov (no longer active)
North Carolina Department of Environmental Quality (2016). North Carolina Department of Environmental Quality website. http://deq.nc.gov/
The North Carolina Board of Public Welfare (1968). Biennial Report 1966-1968. Raleigh, North Carolina.

305
The North Carolina Department of Social Services (1970). Biennial Report 1978-1970. Raleigh, North Carolina.
North Dakota
North Dakota Department of Health (2016). North Dakota Department of Health website. Retrieved from http://www.ndhealth.gov/
North Dakota Secretary of State (1954). North Dakota Blue Book 1954. Retrieved from http://history.nd.gov/bluebook/
North Dakota Secretary of State (1954). North Dakota Blue Book 1954. Retrieved from http://history.nd.gov/bluebook/
North Dakota Secretary of State (1961). North Dakota Blue Book 1961. Retrieved from http://history.nd.gov/bluebook/
North Dakota Secretary of State (1961). North Dakota Blue Book 1961. Retrieved from http://history.nd.gov/bluebook/
North Dakota Secretary of State (1973). North Dakota Blue Book 1973. Retrieved from http://history.nd.gov/bluebook/
North Dakota Secretary of State (2015). North Dakota Blue Book 2013-2015. Retrieved from http://history.nd.gov/bluebook/
Ohio
Adams, Eric R., Dan Dudley, Ralph McGinnis, Lisa Morris, Heather Raymond, Nancy Rice (2002). The History of the Ohio Environmental Protection Agency: 1970-2001.
Ohio Department of Health (2016). Ohio Department of Health website. Retrieved from https://www.odh.ohio.gov
Ohio Department of Natural Resources (2016). Ohio Department of Natural Resources website. Retrieved from http://ohiodnr.gov
Ohio Environmental Protection Agency (2016). Ohio Environmental Protection Agency website. Retrieved from www.epa.state.oh.us
Toledo Blade. Ohio Air Pollution Control Measure Given Support by House Committee. July 8, 1967.
Oklahoma
Carter, Glen D (2006). “Oregon Voices: Pioneering Water Pollution Control in Oregon.” 107 Oregon Historical Quarterly 2.
Gostin, Lawrence O. and James G. Hodge Jr. (2002). Oregon Public Health Law – Review and Recommendations. Georgetown University Law Center, Washington DC

306
Oklahoma Department of Environmental Quality (2016). Oklahoma Department of Environmental Quality website. Retrieved from www.deq.state.ok.us
Oklahoma Department of Health (2016). Oklahoma Department of Health website. Retrieved from www.health.state.ok.us
Oklahoma Department of Libraries. ABC Oklahoma Agencies, Boards, and Commissions: Elected Officers, Cabinet, Legislature, High Courts, and Institutions As of September 1, 2014. Oklahoma City, OK.
Oklahoma Historical Society. http://digital.library.okstate.edu/encyclopedia/entries/A/AI002.html
Oklahoma Water Resources Board (2016). Water Law and Management in Oklahoma. Retrieved from https://www.owrb.ok.gov/supply/ocwp/pdf_ocwp/WaterPlanUpdate/joint_committee/WATER%20LAW_MANAGEMENT%20IN%20OKLAHOMA.pdf
Oregon
Oregon Department of Environmental Quality (2016). Oregon Department of Environmental Quality website. Retrieved from www.deq.state.or.us
Oregon Health Authority (2016). Oregon Health Authority website. Retrieved from http://www.oregon.gov/OHA/pages/index.aspx
Oregon Secretary of State (2009). Department of Environmental Quality Department Administrative Overview. Salem, Oregon
Oregon Secretary of State (2009). Department of Human Services, Addictions, and Mental Health Division Oregon State Hospital Administrative Overview. Salem, Oregon
Oregon Secretary of State (2009). Oregon Employment Department Administrative Overview. Salem, Oregon
Oregon Secretary of State (2013). Oregon Parks and Recreation Department Administrative Overview. Salem, Oregon
Oregon Secretary of State (2014). Oregon Health Authority, Public Health Division Administrative Overview. Salem, Oregon
USEPA (1976). Environmental Quality Profile 1976 Technical Supplement: Oregon.
Pennsylvania
An Act Creating the Department of Environmental Resources, General Assembly of Pennsylvania P.L. 834, No. 275 (1970).
307
Pennsylvania Department of Environmental Protection (2016). Pennsylvania Department of Environmental Protection website. Retrieved from www.dep.pa.gov.
Pennsylvania Department of General Services (2016). The Pennsylvania Manual Volume 122.
Pennsylvania Department of Health (2016). Pennsylvania Department of Health website. Retrieved from www.health.pa.gov
Pennsylvania Historical and Museum Commission (2016). Guide to African American Resources at the Pennsylvania State Archives. Retrieved from http://www.phmc.state.pa.us/bah/aaGuide/AA-RG-23.html
Tarr, Joel A (1999). “The Environmental History of Pennsylvania.” 66 Pennsylvania History 4.
Rhode Island
Rhode Island Department of Environmental Management (2016). Rhode Island Department of Environmental Management website. Retrieved from www.dem.ri.gov
Rhode Island Department of Health (2016). Rhode Island Department of Health website. Retrieved from www.health.ri.gov.
Rhode Island Secretary of State (2016). Browse by Record Group. Retrieved from http://sos.ri.gov/archon/index.php?p=collections/classifications
South Carolina
General Assembly of South Carolina (2016). 2016 South Carolina Legislative Manual. Retrieved from http://www.scstatehouse.gov/man16/manual16.php
South Carolina Department of Health and Environmental Control (2016). South Carolina Department of Health and Environmental Control website. Retrieved from www.scdhec.gov
South Dakota
South Dakota Department of Environment and Natural Resources (2016). South Dakota Department of Environmental and Natural Resources website. Retrieved from https://denr.sd.gov/
South Dakota Department of Health (2016). South Dakota Department of Health website. Retrieved from https://doh.sd.gov/

308
South Dakota Secretary of State (1949). Blue Book Legislative Manual 1949. Pierre, South Dakota.
South Dakota Secretary of State (2015). Blue Book Legislative Manual 2015. Pierre, South Dakota.
South Dakota Secretary of State (2015). Blue Book Legislative Manual 2015. Pierre, South Dakota.
South Dakota State Archives (2013). Guide to the Records of the South Dakota Department of Commerce (DCM). Pierre, South Dakota.
South Dakota State Archives (2014). Guide to the Records of the Board of Charities and Corrections (BCC). Pierre, South Dakota.
South Dakota State Archives (2014). Guide to the Records of the South Dakota Department of Public Welfare (DPW). Pierre, South Dakota.
South Dakota State Archives (2014). Guide to the Records of the South Dakota Department of Human Services (DHS). Pierre, South Dakota.
USEPA (1978). Air Pollution Regulations in State Implementation Plans: South Dakota. EPA-450/3-78-091.
Tennessee
Fisher, Bruce (1973). “Water Pollution – The Tennessee Response: Conclusions and Generalizations.” 11 American Business Law Journal.
Tennessee Department of Corrections (2013). Tennessee Department of Corrections Timeline. Retrieved from https://www.tn.gov/assets/entities/correction/attachments/HistoricalTimeline.pdf
Tennessee Department of Environment and Conservation (2016). Tennessee Department of Environment and Conservation website. Retrieved from www.tn.gov/environment
Tennessee Department of Health (2016). Tennessee Department of Health website. Retrieved from www.tn.gov/health
Tennessee Department of Human Services (2012). Tennessee Department of Human Services Timeline. Retrieved from http://www.tennessee.gov/assets/entities/humanservices/attachments/DHS_Historical_Timeline.pdf
Tennessee Secretary of State (2014). 2013-2014 Tennessee Blue Book. Nashville, Tennessee. Retrieved from http://sos.tn.gov/content/tennessee-blue-book

309
Tennessee State Library and Archives (2001). Tennessee Department of Correction Records 1902-1992 and Addition 1981-1993 Record Group 277.
Tennessee State Library and Archives (2004). Department of Environment and Conservation Solid Waste Disposal Control Board Records 1979-2000 Record Group 308.
Texas
Bengston, Shawn, Randy Blankinship, and Craig Bonds (2003). Texas Parks and Wildlife Department History 1963-2003.
Jasinski, Laurie E (2010). Handbook of Texas Online. Retrieved from http://www.tshaonline.org/handbook/online/articles/mdt30
Texas Commission on Environmental Quality (2016). Texas Commission on Environmental Quality website. Retrieved from https://www.tceq.texas.gov
Texas Department of State Health Services (2016). Texas Department of State Health Services website. Retrieved from www.dshs.texas.gov
Texas State Library Archives Commission (2004). Texas Department of Health: An Inventory of Board of Health Meeting Files at the Texas State Archives 1946-2004. Retrieved from http://www.lib.utexas.edu/taro/tslac/20043/tsl-20043.html
Utah
“Survey of Utah Legislation – 1967 (1967). Utah Law Review 441.
Commission on the Organization of the Executive Branch of the Government (1966). Report of the Commission on the Organization of the Executive Branch of the Government Thirty-Sixth Legislature, State of Utah. Salt Lake City, Utah.
Raisch, Jerry W. (1973). “Utah Environmental Problems and Legislative Response: II.” Utah Law Review 1.
Utah Department of Administrative Services (2016). Agency Histories. Retrieved from http://archives.utah.gov/research/agencyhistories/1116.html
Utah Department of Environmental Quality (2016). Utah Department of Environmental Quality website. Retrieved from www.deq.utah.gov/
Utah Department of Health (2016). Utah Department of Health website. Retrieved from www.health.utah.gov/
310
Webb, Kimber C. (1967). "Description and Evaluation of Institutions Involved in Water Allocation and Distribution in Utah". All Graduate Theses and Dissertations. Paper 3038.
Vermont
Vermont Agency of Natural Resources (2016). Vermont Agency of Natural Resources website. Retrieved from www.anr.vermont.gov
Vermont Department of Environmental Conservation (2016). Vermont Department of Environmental Conservation website. Retrieved from www.dec.vermont.gov
Vermont Department of Health (1986). “A History of Public Health in Vermont”, 100 Years of Public Health In Vermont 1886-1986.
Vermont Department of Health (2016). Vermont Department of Health website. Retrieved form www.healthtvermont.gov
Vermont Historical Society (1989). Vermont History: The Proceedings of the Vermont Historical Society. Vol 57, No 4.
Virginia
Cooper, Weldon (1970). “State Reorganization: The Virginia Experience” 46 The University of Virginia Newsletter 7
Joint Legislative Audit and Review Commission of the Virginia General Assembly (1998). The Secretarial System in Virginia State Government. House Document No. 41.
Library of Virginia (2016). Guides to Manuscripts and Archival Collections in Virginia. Retrieved from http://ead.lib.virginia.edu/vivaxtf/search
Morris, T. R. a. L. J. S. (1990). Virginia Government and Politics (Third Revised Edition ed.). Virginia: Virginia Chamber of Commerce and Center for Public Services, University of Virginia.
Virginia Department of Environmental Quality (2003). Celebrating 20 Years DEQ.
Virginia Department of Environmental Quality (2016). Virginia Department of Environmental Quality website. Retrieved from www.deq.virginia.gov
Virginia Department of Health (2016). Virginia Department of Health website. Retrieved from www.vdh.virginia.gov
Virginia Department of Social Services (2014). Commonwealth of Virginia Department of Social Services Local Board Member Handbook.

311
Virginia Environmental Agencies: Those Reviewing Environmental Impact Statements (1976), 1 Wm. & Mary Envtl. L. & Pol'y Rev. 5.
Virginia Secretary of Health and Human Resources (2016). Virginia Secretary of Health and Human Resources website. Retrieved from https://hhr.virginia.gov
Virginia Secretary of Natural Resources (2016). Virginia Secretary of Natural Resources website. Retrieved from https://naturalresources.virginia.gov
Washington
USEPA (1976). Environmental Quality Profile 1976 Technical Supplement: Washington. EPA-910/9-76-026D
USEPA (1978). Washington Environmental Quality Profile 1978. EPA 910/9-78-049A
Washington State Department of Ecology (2016). Washington State Department of Ecology website. Retrieved from www.ecy.wa.gov
Washington State Department of Health (2016). Washington State Department of Health website. Retrieved from www.doh.wa.gov
West Virginia
Brisbin, R. A. (2008). West Virginia politics and government: U of Nebraska Press.
Holmes, D. E. (Ed.) (2004). West Virginia Blue Book. Charleston, West Virginia: Chapman Printing.
West Virginia Clerk of the Senate (2012). West Virginia Blue Book 2012. Retrieved from http://www.legis.state.wv.us/legisdocs/2012/bluebook/bluebook2012.pdf
West Virginia Department of Environmental Protection (2016). West Virginia Department of Environmental Protection website. Retrieved from www.dep.wv.gov
West Virginia Department of Health and Human Resources (2016). West Virginia Department of Health and Human Resources website. Retrieved from www.dhhr.wv.gov
Wisconsin
Wisconsin Department of Natural Resources (2016). Wisconsin Department of Natural Resources website. Retrieved from www.dnr.gov
Wisconsin Department of Health Services (2016) Wisconsin Department of Health Services website. Retrieved from https://www.dhs.wisconsin.gov

312
Kockelman, William J. (1969). Wisconsin’s Water Resources Act of 1965. 1969 Urban Law Journal 14.
Wisconsin Legislative Reference Bureau (2016). State of Wisconsin 2015-2016 Blue Book. Madison, Wisconsin. Retrieved from http://docs.legis.wisconsin.gov/misc/lrb/blue_book/2015_2016/150_romans.pdf
Carmichael, Donald M (1967). Forty Years of Water Pollution Control in Wisconsin: A Case Study. 1967 Wisconsin Law Review 350.
Wyoming
Wyoming Department of Environmental Quality (2016). Wyoming Department of Environmental Quality website. Retrieved from www.deq.state.wy.us
Wyoming Department of Health (2016). Wyoming Department of Health website. Retrieved from https://health.wyo.gov
Wyoming Game and Fish Department (2016). Wyoming Game and Fish Department website. Retrieved from https://wgfd.wyo.gov
Wyoming State Archives (2008). Wyoming Blue Book 2008. Cheyenne, Wyoming.

313
REFERENCES
Aborn, R. A., & Axelrod, C. E. (1967). State air pollution control legislation: HeinOnline.
Adler, J. (2004). Fable of Federal Environmental Regulation: Reconsidering the Federal Role in Environmental Protection, The. Case W. Res. L. Rev., 55, 93.
Adler, J. (2005). Jurisdictional mismatch in environmental federalism. NYU Envtl. LJ, 14, 130.
Anderson, T., & Hill, P. (1997). Environmental federalism: Rowman & Littlefield Inc.
Andreen, W. L. (2003). The Evolution of Water Pollution Control in the United States-State, Local, and Federal Efforts, 1789-1972: Part II. Stanford Environmental Law Journal, 22(215-294).
Andrews, C. J. (1998). Public policy and the geography of US environmentalism. Social Science Quarterly, 55-73.
Bacot, A., & Dawes, R. (1996). Responses to federal devolution: Measuring state environmental efforts. State & Local Government Review, 28(2), 124-135.
Bacot, A. H., & Dawes, R. A. (1997). State expenditures and policy outcomes in environmental program management. Policy Studies Journal, 25(3), 355-370.
Balla, S. J. (2001). Interstate professional associations and the diffusion of policy innovations. American Politics Research, 29(3), 221.
Barrilleaux, C., Feiock, R., & Crew Jr, R. E. (1992). Measuring and comparing American states' administrative characteristics. State & Local Government Review, 12-18.
Bell, G. (1974). State Administrative Activities, 1972-1973. Retrieved from Lexington, KY:
Berkman, M., & Reenock, C. (2004). Incremental Consolidation and Comprehensive Reorganization of American State Executive Branches. Journal of Political Science, 48(4), 796-812.
Berry, F. S., & Berry, W. D. (1990). State lottery adoptions as policy innovations: An event history analysis. The American Political Science Review, 395-415.
Berry, F. S., & Berry, W. D. (1991). Specifying a model of state policy innovation. The American Political Science Review, 571-579.
Berry, W. D., Ringquist, E. J., Fording, R. C., & Hanson, R. L. (1998). Measuring citizen and government ideology in the American states, 1960-93. American Journal of Political Science, 42(1), 327-348.
Beyle, T. L. (1975). Integration and Coordination of State Environmental Programs. Lexington, KY: Council of State Governments.

314
Birkland, T. A. (1997). After Disaster: Agenda Setting, Public Policy, and Focusing Events. Washington DC: Georgetown University Press.
Blomquist, W. (1991). Exploring State Differences in Groundwater Policy Adoptions, 1980-1989. Publius: The Journal of Federalism, 21(2), 101-115.
Bosso, C. J. (2003). Rethinking the concept of membership in nature advocacy organizations. Policy Studies Journal, 31(3), 397-411.
Bowman, A. O. M., & Kearney, R. (1986). The Resurgence of The States. Englewood Cliffs, New Jersey: Prentice-Hall.
Bromley-Trujillo, R. (2012). States Take the Lead: The Determinants of State Environmental Policy Activity. Paper presented at the State Politics and Policy Conference, Houston.
Brown, R. S., & Marshall, K. (1996). Ecosystem management in state governments. Ecological Applications, 721-723.
Burke, T. A., Shalauta, N., M., Tran, N. L., & Stern, B. S. (1997). The Environmental Web: A National Profile of the State Infrastructure for Environmental Health and Protection. Journal of Health Management and Practices, 3(3), 1-12.
Butler, H., & Macey, J. (1996). Using federalism to improve environmental policy: Aei Pr.
Claveria, S. K., & Kaito, G. M. (1985). The Feasibility of Environmental Reorganization for Hawaii. (No. 1, 1985). Honolulu, Hawaii.
Conant, J. K. (1992). Executive Branch Reorganization in the States, 1965-1991. In C. o. S. Governments (Ed.), Book of the States 1992-1993. Lexington, KY.
Crotty, P. M. (1987). The new federalism game: Primacy implementation of environmental policy. Publius: The Journal of Federalism, 17(2), 53-67.
Daley, D. M., & Garand, J. C. (2005). Horizontal diffusion, vertical diffusion, and internal pressure in state environmental policymaking, 1989-1998. American Politics Research, 33(5), 615-644.
Davies III, J. C. (1970). The Politics of Pollution: Western Publishing Company.
Davis, F. L., & Wurth, A. H. (2003). Voting preferences and the environment in the American electorate: The discussion extended. Society &Natural Resources, 16(8), 729-740.
Dawson, R. E., & Robinson, J. A. (1963). Inter-party competition, economic variables, and welfare policies in the American states. The Journal of Politics, 25(02), 265-289.
Dilger, R. J., & Beth, R. S. (2014). Unfunded Mandates Reform Act: History, Impact, and Issues. Washington DC.

315
DiMaggio, P. J., & Powell, W. W. (1983). The iron cage revisited: Institutional isomorphism and collective rationality in organizational fields. American sociological review, 147-160.
Durant, R., Fiorino, D., & O'leary, R. (2004). Environmental governance reconsidered: challenges, choices, and opportunities: The MIT Press.
Dye, T. R. (1979). Politics versus economics: the development of the literature on policy determination. Policy Studies Journal, 7(4), 652-662.
Eisner, M. A. (2007). Governing the environment: the transformation of environmental regulation: Lynne Rienner Publishers.
Elazar, D. J. (1984). American Federalism: A View from the States (Third ed.). New York: Harper & Row, Publishers.
Epstein, D., & O'Halloran, S. (1999). Delegating powers: A transaction cost politics approach to policy making under separate powers: Cambridge University Press.
Esty, D., & Geradin, D. (2001). Regulatory competition and economic integration: Comparative perspectives: Oxford University Press, USA.
Fiorino, D. (2006). The new environmental regulation: The MIT Press.
Garga, J. J. (Ed.) (2000). Handbook of State Government Administration (Vol. 75). New York, NY: Marcel Dekker, Inc.
Gargan, J. J. (1999). Handbook of state government administration: CRC Press.
Garnett, J. L. (1980). Reorganizing state government: The executive branch: Westview Press Boulder, CO.
Garnett, J. L., & Levine, C. H. (1980). State Executive Branch Reorganization Patterns and Perspectives. Administration & Society, 12(3), 227-276.
Goklany, I. (1998). The environmental transition to air quality. REGULATION-WASHINGTON-, 21, 36-46.
Gordon, L. (1998). Guest Commentary. Public Health and the Environment: Floundering Partners. Journal of Environmental Health, 61(1), 32-33, 57.
Gray, V. (1973). Innovation in the states: A diffusion study. The American Political Science Review, 67(4), 1174-1185.
Guber, D. L. (2001). Voting preferences and the environment in the American electorate. Society & Natural Resources, 14(6), 455-469.
Gulick, L. (1937). Papers on the Science of Administration. New York: Institute of Public Administration, Columbia University.

316
Hammond, T. H. (1986). Agenda control, organizational structure, and bureaucratic politics. American Journal of Political Science, 30(2), 379-420.
Hannan, M. T., & Freeman, J. (1986). Where do organizational forms come from? Paper presented at the Sociological forum.
Haskell, E. H., & Price, V. B. (1973). State Environmental Management: Case Studies of Nine States. New York, NY: Praeger Publishers.
Haskins, R. L. (1969). Towards better administration of water quality control. Or. L. Rev., 49, 373.
Hatchard, R. E. (1962). Administration of State Air Pollution Control Programs, A Survey. Journal of the Air Pollution Control Association, 12(6), 282-284.
Hawkins Jr., R. B. (1980). Extension Project: Capacity Building for Small Units of Rural Government (final draft). Prepared for U.S. Department of Agriculture, Extension Service, p.2, As cited in Honadle 1981.
Hays, S. P., Esler, M., & Hays, C. E. (1996). Environmental commitment among the states: Integrating alternative approaches to state environmental policy. Publius: The Journal of Federalism, 26(2), 41-58.
Hines, N. W. (1966). Nor Any Drop to Drink: Public Regulation of Water Quality Part I: State Pollution Control Programs. Iowa L. Rev., 52, 186.
Honadle, B. W. (1981). A Capacity-Building Framework: A Search for Concept and Purpose. Public Administration Review, 41(5), 575-580.
Hoornbeek, J. A. (2011). Water Pollution Control Policies and the American States: Runaway Bureaucracies or Congressional Control? New York: State University of New Yor Press.
Huber, J. D., Shipan, C. R., & Pfahler, M. (2001). Legislatures and statutory control of bureaucracy. American Journal of Political Science, 330-345.
Hunter, S., & Waterman, R. W. (1996). Enforcing the Law: The Case of the Clean Water Acts. New York: M.E. Sharpe, Inc.
Jenks, S. S., & Wright, D. S. (1993). An agency-level approach to change in the administrative functions of American state governments. State & Local Government Review, 78-86.
Jennings, E. T. (1979). Competition, constituencies, and welfare policies in American states. The American Political Science Review, 414-429.
Jennings, E. T., & Woods, N. D. (2007). Two Paths in Performance: The Direct and Indirect Effects of Management Capacity. Paper presented at the 9th National Public Management Research Conference.
317
Jessup, D. H. (1988). Guide to State Environmental Programs. Washington DC: Bureau of National Affairs, Inc.
Jessup, D. H. (1990). Guide to State Environmental Programs (Second ed.). Washington DC: Bureau of National Affairs, Inc.
Jessup, D. H. (1994). Guide to State Environmental Programs (Third ed.). Washington DC: Bureau of National Affairs, Inc.
Jones, C. (1974). Federal-State-Local Sharing in Air Pollution Control. Publius: The Journal of Federalism, 4(1), 69-85.
Kingdon, J. (1995). Agendas, Alternatives, and Public Parties. New York: Longman.
Klyza, C., & Sousa, D. (2008). American environmental policy, 1990-2006: Beyond gridlock.
Knott, J. H., & Payne, A. A. (2004). The impact of state governance structures on management and performance of public organizations: A study of higher education institutions. Journal of Policy Analysis and Management, 23(1), 13-30.
Koncelik, J. (2010). Ohio EPA + ODNR? Retrieved from http://www.ohioenvironmentallawblog.com/2010/11/articles/federal-and-state-developments/ohio-epa-odnr/
Konisky, D. M., Milyo, J., & Richardson, L. E. (2008). Environmental Policy Attitudes: Issues, Geographical Scale, and Political Trust*. Social Science Quarterly, 89(5), 1066-1085.
Konisky, D. M., & Woods, N. D. (2012). Measuring State Environmental Policy. Review of Policy Research, 29(4), 544-569.
Kotchian, S. (1997). Perspectives on the Place of Environmental Health and Protection in Public Health and Public Health Agencies. American Review of Public Health, 18, 245-259.
Kraft, M. (2007). Environmental policy and politics: Pearson/Longman.
Krause, G. A., & Woods, N. D. (2014). Policy Delegation, Comparative Institutional Capacity, and Administrative Politics in the American States. In D. P. Haider-Markel (Ed.), Oxford Handbook of State and Local Government (pp. 363-398). Oxford, UK: Oxford University Press.
Lawrence, P. R., & Lorsch, J. W. (1967). Managing differentiation and integration. Organization and environment.
Lester, J. (1980). Partisanship and Environmental Policy: The Mediating Influence of State Organizational Structures. Environment and Behavoir, 12(1), 101-131.
318
Lester, J. (1986). New federalism and environmental policy. Publius: The Journal of Federalism, 16(1), 149.
Lester, J. (1995). Environmental politics and policy: Theories and evidence: Duke Univ Pr.
Lester, J. P., Franke, J. L., Bowman, A. O. M., & Kramer, K. W. (1983). Hazardous wastes, politics, and public policy: A comparative state analysis. The Western political quarterly, 257-285.
Lombard, E., & Lester, J. (1990). Comparative Analysis of State Environmental Policy. Natural Resources Journal NRJOAB, 30(2).
Lowry, W. R. (1992). The Dimensions of Federalism: State Governments and Pollution Control Policies. Durham, NC: Duke University Press.
McCubbins, M. D., Noll, R. G., & Weingast, B. R. (1989). Structure and process, politics and policy: Administrative arrangements and the political control of agencies. Virginia Law Review, 431-482.
Meier, K. J. (1980). The impact of regulatory organization structure: IRCs or DRAs? Southern Review of Public Administration, 3(4), 427-443.
Melosi, M. V. (2000). The Sanitary City: Environmental Services in Urban America from Colonial Times to the Present. Pittsburgh: University of Pittsburgh Press.
Mintrom, M. (1997). Policy entrepreneurs and the diffusion of innovation. American Journal of Political Science, 41(3), 738-770.
Mitchell, J. (1997). Representation in Government Boards and Commissions. Public Administration Review, 57(2), 160-167.
Moe, T. M. (1984). The New Economics of Organization. American Journal of Political Science, 28(4), 739-777.
Moe, T. M. (1990a). Political institutions: The neglected side of the story. JL Econ & Org., 6, 213.
Moe, T. M. (1990b). The politics of structural choice: Toward a theory of public bureaucracy. Organization theory: From Chester Barnard to the present and beyond, 116-153.
Mosher, F. C. (1967). Governmental reorganizations: Cases and commentary: Indianapolis: Published for the Inter-university Case Program, Incorporated, by Bobbs-Merrill.
Nicholson-Crotty, J., & Meier, K. J. (2003). Politics, structure, and public policy: The case of higher education. Educational Policy, 17(1), 80-97.
O'Leary, R., & Bingham, L. B. (2009). The collaborative public manager: New ideas for the twenty-first century: Georgetown University Press.

319
O’Toole Jr, L. J., & Meier, K. J. (2003). Bureaucracy and uncertainty Uncertainty in American politics (pp. 98-117).
Oates, W. (2004). Environmental policy and fiscal federalism: selected essays of Wallace E. Oates: Edward Elgar.
Percival, R. (1995). Environmental Federalism: Historical Roots and Contemporary Models. Md. L. Rev., 54, 1141.
Peters, B. G., & Pierre, J. (2003). Handbook of public administration: Sage.
Potoski, M. (2001). Clean Air Federalism: Do States Race to the Bottom? Public Administration Review, 61(3), 335-342.
Rabe, B. (1986). Fragmentation and Integration in State Environmental Management. Washington DC: The Conservation Foundation.
Reenock, C., & Poggione, S. (2004). Agency design as an ongoing tool of bureaucratic influence. Legislative Studies Quarterly, 29(3), 383-406.
Regens, J. L., & Reams, M. A. (1988). State strategies for regulating groundwater quality. Social Science Quarterly, 53-69.
Ringquist. (1993). Environmental protection at the state level: Politics and progress in controlling pollution: ME Sharpe.
Ringquist. (1994). Policy Influence and Policy Responsiveness in State Pollution Control. Policy Studies Journal, 22(1).
Ringquist, E. (1993). Environmental protection at the state level: Politics and progress in controlling pollution: ME Sharpe.
Salisbury, R. (1968). The Analysis of Public Policy: A Search for Theories and Roles. In A. Ranney (Ed.), Political Science and Public Policy. Chicago Markham.
Sapat, A. (2004). Devolution and innovation: the adoption of state environmental policy innovations by administrative agencies. Public Administration Review, 64(2), 141-151.
Scheberle, D. (2004). Federalism and environmental policy: Trust and the politics of implementation: Georgetown Univ Pr.
Scorsone, E. A., & Plerhoples, C. (2010). Fiscal Stress and Cutback Management Amongst State and Local Governments What Have We Learned and What Remains to Be Learned? State and Local Government Review, 42(2), 176-187.
Scott, W. R., & Davis, G. F. (2007). Organizations and organizing. Rational, natural and open systems perspectives. New Jersey.
Seidman, H. (1970). Politics, position, and power.
320
Shepherd, M. D., West, G. C., Hargrove, W. L., Schoemaker, T. S., & St. Peter, R. F. (1999). The Organization of Public Health and Environmental Functions in Kansas. Topeka, Kansas.
Shipan, C. R., & Volden, C. (2008). The mechanisms of policy diffusion. American Journal of Political Science, 52(4), 840-857.
Sinclair, A. H., & Whitford, A. B. (2012). Separation and Integration in Public Health: Evidence from Organizational Structure in the States. Journal of Public Administration Research and Theory, 23, 55-66.
Stein, M. (1962). Problems and Programs in Water Pollution. Nat. Resources J., 2, 388.
Stern, A. C., & Professor, E. (1982). History of air pollution legislation in the United States. Journal of the Air Pollution Control Association, 32(1), 44-61.
Stewart, R. (1976). Pyramids of Sacrifice--Problems of Federalism in Mandating State Implementations of National Environmental Policy. Yale Lj, 86, 1196.
Taylor, F. W. (1911). The principles of scientific management: Harper.
True, J. L., Jones, B. D., & Baumgartner, F. R. (2007). Punctuated-Equilibrium Theory: Explaining Stability and Change in Public Policymaking. In P. A. Sabatier (Ed.), Theories of the Policy Process. Colorado: Westview.
USEPA. About EPA. Retrieved from www2.epa.ov/aboutepa
USEPA. (1983). Alternative Models of EPA - State Relationships: A Literature Survey. Washington DC.
Vig, N., & Kraft, M. (2003). Environmental policy: New directions for the twenty-first century: Cq Pr.
Volden, C. (2002). Delegating power to bureaucracies: evidence from the states. Journal of Law, Economics, and Organization, 18(1), 187-220.
Volden, C. (2006). States as policy laboratories: Emulating success in the children's health insurance program. American Journal of Political Science, 50(2), 294-312.
Volden, C., Ting, M. M., & Carpenter, D. P. (2008). A formal model of learning and policy diffusion. American Political Science Review, 102(3), 319-332.
Volkwein, J. F., & Tandberg, D. A. (2008). Measuring up: Examining the connections among state structural characteristics, regulatory practices, and performance. Research in Higher Education, 49(2), 180-197.
Walker, J. L. (1969). The diffusion of innovations among the American states. The American Political Science Review, 63(3), 880-899.
Wang, X., Dennis, L., & Tu, Y. S. J. (2007). Measuring financial condition: A study of US states. Public Budgeting & Finance, 27(2), 1-21.

321
Waterman, R. W., & Meier, K. J. (1998). Principal-agent models: an expansion? Journal of Public Administration Research and Theory, 8(2), 173-202.
Weber, M. (1922). The theory of social and economic organization: Simon and Schuster.
Wikle, T. A. (1995). Geographical patterns of membership in US environmental organizations. The Professional Geographer, 47(1), 41-48.
Williamson, O. E. (1981). The economics of organization: the transaction cost approach. American journal of sociology, 548-577.
Williamson, O. E. (1999). Public and private bureaucracies: a transaction cost economics perspectives. Journal of Law, Economics, and Organization, 15(1), 306-342.
Wood, B. D., & Bohte, J. (2004). Political transaction costs and the politics of administrative design. Journal of Politics, 66(1), 176-202.
Wood, B. D., & Waterman, R. W. (1993). The dynamics of political-bureaucratic adaptation. American Journal of Political Science, 497-528.
Zimmerman, J. F. (1991). Federal preemption under reagan's new federalism. Publius: The Journal of Federalism, 21(1), 7-28.
322
VITA
Emily E. Bedwell
Education
Indiana University, Master of Public Affairs, School of Public and Environmental Affairs, Environmental Policy and Natural Resources Management Concentration, 2001
Hanover College, Bachelor of Arts in English, 1997
Publications and Reports
Bedwell, Emily, and Joshua Cowen, Peter Jones, and Eugenia Toma “Do Public Managers Promote Employee Development in Hard-to-Staff Locales? Evidence from School Principals in Appalachia.” Public Management Performance and Management Review, June 2014.
Taylor, Cody, and Emily Bedwell, Amy Guy, David Traeger, and Kirk Dunbar. “Low Carbon
Solid Waste Systems.” MSW Management, September/October 2007
Research and Teaching Interests
Research Interests include: environmental policy, natural resource policy, energy policy, U.S.
state policy, k-12 education policy, and organizational theory
Teaching Interests include: environmental policy, natural resource policy, energy policy, U.S.
state policy, k-12 education policy, organizational theory, and quantitative and qualitative
research methods
Research and Professional Experience
Graduate Research Assistant to Dr. Eugenia Toma, Martin School of Public Policy and
Administration, University of Kentucky (2008-2011)
Consultant, HDR Engineering, New York, New York (2002-2012)
Researcher, City of Indianapolis Mayor’s Office and Department of Public Works, Indianapolis, IN
(2001-2002)
Teaching Experience
Instructor, Political Science Research Methods, University of Kentucky (Spring 2012)
Instructor, Political Science Research Methods, University of Kentucky (Spring 2011)

323
Conference Papers and Presentations
“Applying a Positive Theory of Organizations: A Closer Examination of State Environmental Agencies”. American Society for Public Administration, Chicago, IL, 2015.
“Applying a Positive Theory of Organizations: A Closer Examination of State Environmental Agencies”. Midwest Political Science Association, Chicago, IL, 2015.
“State Innovation in Renewable Energy.” Southeast Conference for Public Administration, Wilmington, NC, 2010.
“Public Participation in Environmental Issues in China.” Southeast Conference for Public Administration, Louisville, KY, 2009
Low Carbon Solid Waste Panel Discussion, Moderator, WASTECON, Reno, NV, 2007.
“Waste-to-Energy and Landfill Gas Recovery: Renewable Energy Sources” (with Cliff Koenig, Greg Gesell, Carlo Lebron, and Ed Liebsch), Energy Utility and Environment Conference, Tucson, Arizona, 2008.
“Solid Waste Carbon Planning Tool”, (with Kirk Dunbar and Dave Traeger), North American Waste-to-Energy Conference, Philadelphia, PA, 2008.
“Low-Carbon Solid Waste Systems”, North American Waste-to-Energy Conference,
Miami, Florida May 2007
Academic Awards and Honors
Pi Alpha Alpha – Public Affairs Honorary Society, 2000
Top Related