


Languages
Pages
Legal

PROJECT FINAL: Integrated microseismic and 3D seismic interpretations
Team Members – Tom Wilson (PI), West Virginia University, Department of Geology and
Geography.
Project period extended from 5/1/2013 through 5/31/2016
Objective – The integrated microseismic and 3D seismic studies were funded in two phases.
Phase 1 (5/1/2013 – 5/31/2015) study included the following objectives: 1) develop a 3D
seismic interpretation of an actively producing Marcellus shale reservoir in southwestern
Pennsylvania; 2) integrate frac-induced microseismic data observed along laterals in the
field into the subsurface 3D seismic interpretation; 3) determine stratigraphic distribution of
microseismic events within the 3D seismic framework; 4) evaluate influence of seismic-scale
fault networks on microseismic distribution; and 5) incorporate available geophysical logs
and subsurface data into the geophysical characterization and subsurface interpretation.
Phase 2 extension (5/31/2015 through 5/31/2015) included the additional objectives: 1)
development of lithostatic pressure curves and estimates of Sv from 3 wells with density
logs in the local area; 2) estimation of Shmin from individual wells based on instantaneous
shut-in pressures (ISIP) stage-by-stage; 3) evaluation of local variability in ISIPs between
individual wells and between groups of wells on hanging wall and footwall locations; 4)
estimation of Shmax assuming strike-slip neotectonic stress and (coefficient of internal
friction); 5) independent estimation of Shmin for normal fault offsets.
Summary with Key Results
Some of the main outgrowths of the research conducted under this project include:
o Characterization of prominent out-of-zone microseismicity through rupture of
critically stressed fractures which were continually re-ruptured during hydraulic
fracture treatment of wells in the area. These events appeared initially at distances
from about 3300ft to 5000ft from the hydraulic fracture stimulation point. Although
these events extended from about 800ft to 2000ft above the base of the reservoir they
remain more than 6000ft beneath the surface.
o Demonstration that energy density provides a better estimate of stimulated reservoir
volume since it is directly related to fracture surface area ruptured in response to
hydraulic fracture stimulation. Radiated microseismic energy density associated with
hydraulic fracture treatment correlates better to cumulative production than does the
simple stimulated reservoir volume
Appendix I: EFD East Regional Center I.6 Microseismic and 3D Seismic Interpretation (Task 5.4.5)

o Identification of a new class of microseismic events referred to as proximal cross-well
events. This class of events consists of an event or events produced during stimulation
of one well that occur close to events produced during the stimulation of adjacent
laterals. Although areas with a greater number of cross-well events are associated
with greater production, the observations are interpreted to suggest that areas of
clustered cross-well events are associated primarily with re-stimulation or repeated
rupture of the same fracture or fault rather than to additional stimulation.
o Workflow development to reveal subtle seismic discontinuities. These discontinuities
are interpreted to be associated with fracture zones and small faults. They have trends
similar to observed microseismic event cluster trends and are interpreted to
accommodate and enhance hydraulic fracture treatment.
o Estimation of the orientation of SHmax using the orientations of microseismic event
clusters and Mohr-Coulomb failure criteria. The orientation of SHmax is estimated as
that orientation that minimizes the number of cluster trends that fall below the failure
envelope.
o Information gathered from operators in the region that report low stress anisotropy
(SHmax-Shmin) on the order of 400psi. This small difference in the horizontal stresses
leads to more diffuse clusters of microseismic events. The reported stress anisotropy
also implies that shear failure in response to hydraulic fracture stimulation will occur
in the form of normal offset. Normal offset is expected when Sv> SHmax>Shmin.
o Development of discrete fracture network (DFN) representations of the stimulated
reservoir volume. These DFNs are developed using fracture sets inferred from the
microseismic response and Mohr circle analysis. An energy weighted event density
grid is used to distribute fracture intensity in the stimulated reservoir volume. The
intensities of the individual sets are scaled in proportion to their relative occurrence.
The properties of the DFN are upscale into the grid and used to estimate relative
porosity and permeability distribution with in the stimulated region.
Key outgrowths of the research effort are also reflected in numerous publications that
include:
1) Wilson, T., Hart, A., Sullivan, P., 2014, Proximal cross-well microseismicity as a
possible indicator of drainage efficiency and critically stressed strata: SEG Technical
Program Expanded Abstracts 2014, 2738-2742.
2) Wilson, T., Hart, A., Sullivan, P., 2014, Characterization of Marcellus shale fracture
systems for fracture model development using 3D seismic and microseismic data:
SEG Technical Program Expanded Abstracts, 2683-2687.
3) Wilson, T., Hart, A., and Sullivan, P., 2014, Frac creates out-of-zone rupture: Special Report, American Oil and Gas Reporter, August issue, p. 149-152.
4) Wilson, T., A. Hart, P. Sullivan, D. Patchen, 2014, Integrated microseismic and 3D seismic interpretation: Martz Summer Conference, Colorado School of Law. (See

http://www.colorado.edu/law/sites/default/files/WVU.Integrated%20Microseismic%20and%203D%20Seisimic%20Interpretation.pdf).
5) Wilson, T., Hart, A., and Sullivan, P., 2015, Study measures Marcellus frac results: Special Report New Products/Technology, American Oil and Gas Reporter, July issue, 58, 7, 79-85.
6) Hart, Ariel K., 2015, 3D seismic attribute-assisted analysis of microseismic events in
the Marcellus Shale: Master’s Thesis, West Virginia University, 147p
7) Wilson, T., Hart, A., Sullivan, P., 2016, Interrelationships of Marcellus Shale Gas
Production to Frac-Induced Microseismicity, Interpreted Minor Faults and Fractures
Zones, and Stimulated Reservoir Volume, Greene County, Pennsylvania:
Interpretation, v. 4, No. 1, T15-T30.
8) Wilson, T., P. Sullivan, 2016, submitted, Microseismic energy density and event trend
constraints on model DFN development for hydraulically fractured reservoirs:
Marcellus shale, southwestern Pennsylvania, U. S. A.: submitted for presentation in
the 2016 SEG meeting, 5p.
9) Zhu, Y., T. Wilson, P. Sullivan, 2016, submitted, Variations of microseismic b-values
and their relationship to 3D seismic structure in the Marcellus Shale: Southwestern
Pennsylvania: submitted for presentation in the 2016 SEG meeting, 5p.
AAPG online abstracts through Search and Discovery
10) Wilson, T., Hart, A., Sullivan, P., 2014, 3D Seismic Workflows Developed to
Evaluate Out-of-Zone and Stealth-Zone Microseismic Behaviors: Marcellus Shale,
Central Appalachians, USA: AAPG Annual Convention and Exhibition, April 8,
Houston, TX, see
http://www.searchanddiscovery.com/abstracts/html/2014/90189ace/1828336.html
11) Hart, A., Wilson, T., and Sullivan, P., 2014, 3D Seismic Attribute-Assisted Analysis
of Microseismic Events Within the Marcellus Shale: AAPG Annual Convention and
Exhibition, April 8, Houston, TX, see
http://www.searchanddiscovery.com/abstracts/html/2014/90182se/abstracts/hart.htm
*The following report provides an overview of some on some key issues associated with the
model representation of the discrete fracture network created in response to hydraulic
fracture stimulation and is not intended to be comprehensive. Research results are
summarized in the numerous publications and presentations made as part of this project.

Developing a model discrete fracture network of the stimulated reservoir volume
produced in response to hydraulic fracture treatment
Abstract
Results from research conducted under this contract include:
1) Development of novel 3D seismic processing workflows to extract subtle
discontinuities in the 3D seismic reflection response that are interpreted to arise from
zones of increased fracture intensity in the Marcellus shale gas reservoir.
2) Development of methods to use microseismicity induced during hydraulic fracture
treatments to estimate the orientation of SHmax.
3) Development of methods that use radiated microseismic energy to characterize the
stimulated reservoir volume.
4) Development of methods that provide a more reliable prediction of cumulative gas
recovery using microseismic energy density.
5) Development of methods that use microseismic cluster trends to estimate fracture
trends opened in response to hydraulic fracture stimulation.
6) Development of an approach to modeling the stimulated reservoir fracture network that
uses energy density to distribute fracture intensity.
7) Validation of these approaches through general relationships between fracture porosity
and permeability distributions to well production.
Overall, the work conducted under this contract provides approaches for improved
reservoir characterization, outline methods used to better define the state of stress in the
Marcellus, highlight the use of energy density as a better measure of stimulated reservoir
volume, reveal insights into the heterogeneity of fracture systems generated in response to
hydraulic fracture treatment and their relationship to cumulative well production. The
results and value of this work have been recognized in the form of several publications (see
pages 2 and 3) and most recently in the form of an invitation by the journal
INTERPRETATION to develop a special section on Appalachian Shale Gas Field Exploration
and Development: Lessons Learned.
Purpose and structure of the final report
This report focuses on the outgrowths of project research that led to development of a model
discrete fracture network (DFN) of the Marcellus Shale reservoir in the project study area. The
primary focus will be on the development of a model DFN representation of the stimulated
reservoir volume. Data used to constrain fracture set and intensity distribution include 3D
Seismic and microseismic data. Following a presentation of background, we discuss the
development of fracture intensity attributes used to distribute fracture intensity through the
DFN on a set by set basis. This incorporates analysis of microseismic cluster trends and their
relationship to the trend of 3D seismic discontinuities that are interpreted to be associated with
small faults and fracture zones. The relative occurrence of microseismic event trends is used
to scale the intensities of dominant fracture sets inferred from the microseismic and 3D seismic
analysis. The orientation of SHmax in the region is estimated by minimizing the number of
microseismic events that fall below the Mohr Coulomb failure envelope. Two varieties of

DFNs are developed and include 1) the reservoir fracture network activated by hydraulic
fracture stimulation and 2) the reservoir fracture network associated with the reservoir prior to
stimulation. Fracture intensities in the stimulated reservoir DFN are controlled using radiated
microseismic energy density. Fracture intensity, pre-stimulation is estimated using extracted
seismic discontinuities. Estimated porosity and permeability associated with the reservoir
fracture network are determined in a relative sense through upscaling of the model DFN into a
geo-cellular grid. Porosity and permeability provide a visual reference to the heterogeneity in
the stimulated reservoir volume. Distribution in the gridded model is examined and related to
stimulated reservoir volume (SRV). The correlation of energy weighted SRV to production is
reviewed.
Many of the ideas presented in this report were initially developed in some of the papers
published as part of this research effort. This report brings together some of those ideas and
outgrowths coming near the end of the research period. Publications and presentations resulting
from this effort are listed above as Key Outgrowths.
Background
Regional Structural Context -The study area is located in the Central Appalachian foreland of
North America in southwestern Pennsylvania. Deformation in the Central Appalachian tends
to be dominated by the Permo-Pennsylvanian Alleghenian orogeny (Figure 1). However,

earlier tectonic events influence the development of Central Appalachian structure,
particularly in the more distal foreland areas. Extension during the early Cambrian
deformed the Precambrian foreland basement. The extensional basement complex is
known as the Rome trough or Eastern Interior aulacogen (Harris, 1978) that formed during
the opening of the early Paleozoic Iapetus Ocean (Shumaker, 1986; Thomas, 1993).
Subsidence and sedimentation across the area continued through the Paleozoic at varying
rates. Faults in the trough served as zones of weakness along which slight reverse
movements occurred during Paleozoic shelf-loading (Wilson, 2000). Shelf-loading occurred
during three Paleozoic orogenic events, including the Middle-Late Ordovician Taconic
orogeny, Devonian Acadian orogeny and Permo-Pennsylvanian Alleghenian orogeny.
Continued movement across these structures through time influenced current reservoir
conditions in sequentially deposited depositional systems overlying these early structures
(Beardsley and
Late stage reactivation of these earlier structures can create secondary fracture porosity
along trends that cross those of later orogenic events.
Fracture trends reported in the study area include coal cleat trends of approximately N22E
(butt cleat) and N70W (face cleat) just east of the site (Steidel, 1977). The coal cleats are
assumed to have formed prior to Appalachian folding in response to stresses in the early

stages of the Appalachian orogeny (Nickelsen and Hough, 1967). The orientation of the butt
cleat, for example, parallels local folds in the area, which strike approximately N25E.
Outcrop fractures measured to the west have dominant trends of N74W and N26E along
Figure 1: Study are is located in Greene Co., southwestern Pennsylvania. Cable, 1983).
with a less prominent N71E trend (Wilson et al., 2012). Engelder et al. (2009) referred to an
ENE joint set observed in core and outcrop as the J1 set and noted that, in the Marcellus
Formation, the J1 set formed early in response to abnormal fluid pressure during thermal
maturation of organic matter. Joint orientations measured in Eastern gas shale wells to the
west in Ohio are dominated by the east-northeast oriented J1 joint set.

Indirect observations of the reservoir discrete fracture network
As part of this study we had no direct measurements of the fracture network in the
reservoir and bounding strata. Image logs were not available in the field or surrounding
areas. Thus we had to establish a model using indirect evidence for the nature of the pre-
existing local fracture network and the fracture system developed in response to hydraulic
fracture stimulation of the reservoir. Some preliminary developments were reported in
Wilson et al. (2014) and Wilson and Sullivan (2016, submitted). Some of those ideas and
their extension are presented below.
Seismic Discontinuity and microseismic event trends
Post-stack processing of 3D seismic data from this area is described and summarized in
Wilson et al. (2016). They developed a post-stack processing workflow to enhance subtle
seismic discontinuities interpreted to be associated with subtle faults and fracture zones.
Their analysis revealed a bimodal distribution of seismic discontinuities with average trends
of approximately N51E and N45W (Figure 2A). Larger, ~250 foot offset seismic scale faults
cutting through the area have roughly N25E trend: a trend that coincides with the trend of
local surface anticlines. On average in the area, northeast-southwest trending
discontinuities occur with greater frequency than the northwest-southeast trending
discontinuities.
Hydraulic fracture stimulation of the wells in the study area generally produced clusters of
microseismic events dominated by a northeast trending set (Figure 2B). The dominant trend of
microseismic event clusters shares the trend of the seismic discontinuities (Figure 2A). Clusters
of microseismic events with northwest-southeast trend although less pronounced are also
observed. Overall, microseismic events produced during hydraulic fracturing of the wells in
this area do not form tight elongate clusters; in total event clusters become less eccentric and
more diffuse. Their diffuse appearance suggests that the difference between SHmax and Shmin is
relatively small. Local stress perturbations may allow limited failure to occur along northwest-
southeast trending natural fractures and small faults.
The regional average SHmax orientation in this part of the central Appalachian foreland is
~N67oE based on data from the World Stress Map (Heidbach et al. 2008), Wilson et al. (2016)
considered measurements closest to the area along with the interpreted microseismic event
trends and suggested that local SHmax may be approximately equal to N81oE in the vicinity of
the study area.

Figure 2: A) Seismic discontinuity trends and B) microseismic event trends.
We use Mohr-Coulomb failure criterion to classify interpreted microseismic event trends into
two groups: one group consisting of event trends more likely to have failed and the second
group, of event trends less likely to have failed. The rose diagram of interpreted microseismic
event trends (Figure 2B) illustrates these two modes and their relative abundance. In the
absence of nearby estimates of SHmax we assume that the observed microseismic event trends
are produced by shear rupture along pre-existing small faults and fracture zones and then ask
which direction of SHmax will produce failure along these trends. Mohr-Coulomb failure criteria
is used to answer this question (See Wilson and Sullivan, 2016, submitted).
The Mohr circle (Figure 3) illustrates the location of interpreted microseismic event trends
relative to the failure envelope. The vertical stress (Sv) is assumed to be the maximum

compressive principle stress and was computed at the approximate completion depth in the
Marcellus using the integrated density log. Shmin was estimated using the instantaneous shut-
in pressures. We use a coefficient of friction () =0.6. The pore pressure is based on the pore
pressure gradient reported for the Whipkey well in Greene Co. to the northeast of the area. The
small faults and fractures along which rupture occurs are assumed to be critically stressed and
have nearly zero cohesive strength (zero intercept in Figure 4).
An iterative analysis suggests that the orientation of SHmax that minimizes the number of
interpreted events falling below the failure envelope is N84oE. The analysis also revealed that
a coefficient of friction of 0.75 would not facilitate failure, while as low as 0.25 would be
required for failure to occur along all event trends. The of 0.6 results in failure for the
majority of event trends. Events falling below the failure envelope may occur in response to
local stress perturbations associated with the hydraulic treatment, may simply be
misinterpreted or, a mixture of both. equal to 0.6 is often assumed (Byerlee, 1978).
We next ask the question whether the seismic discontinuities extracted from the 3D seismic
data could accommodate failure in response to hydraulic fracture stimulation in an area where
SHmax is oriented approximately N84oE. To answer this question, interpreted seismic
discontinuity trends (Figure 2A) were also evaluated in the context of the Mohr-Coulomb

failure criterion; however, in this case the trend of SHmax is fixed at N84oE based on the analysis
of microseismic event trends.
Figure 3: A) Mohr circle shows locations of interpreted microseismic event trends for an
orientation of SHmax equal to N84oE: the orientation that minimizes the number of events
falling below the failure envelope. The larger red dots represent locations of events with
northeast trend; the black dots represent events with northwest trend. B) Interpreted
microseismic event trends shown in Figure 2 are further subdivided into events likely to fail
(red) and unlikely to fail (black) based on the Mohr Coulomb failure criterion.

Figure 4: A) Mohr circle shows locations of interpreted discontinuity trends relative to the
failure envelope for an orientation of SHmax equal to N84oE. The larger red dots represent
locations of events with northeast trend; the smaller black dots represent events with northwest
trend. B) Interpreted microseismic event trends shown in Figure 2 are further subdivided into
events likely to fail (red) and unlikely to fail (black) based on the Mohr Coulomb failure
criterion.
The results of the analysis reveal that the majority of the seismic discontinuities have
orientations that will accommodate failure observed in the microseismic event trends (Figure
4). The analysis also indicates that the post-stack processing workflow used to extract seismic
discontinuities yields trends that are consistent with those inferred from microseismic events
produced during hydraulic fracture stimulation. Thus, in the absence of any direct evidence
about the nature of the fracture network in the reservoir, the discontinuities extracted using this

workflow serve as a reliable proxy for the reservoir fracture system likely to be encountered
during development and stimulation.
Developing the model discrete fracture network
Reservoir fracture sets
The foregoing analysis provides the basis for defining the dominant reservoir fracture sets that
interact with the hydraulic fracture treatment of wells in the study area. We see that the network
is likely composed of two sets: one, the dominant set with N51oE trend, and the second, the
less common, N65oW set.
Relative fracture intensity
One approach for estimating fracture intensity in stimulated regions would be to create a
geocellular model of the subsurface and count the number of events observed within individual
grid cells. The gridded stimulated volume consists of the volume of occupied cells weighted
by the number of events in each cell (Figure 5A). A model of the hydraulic fracture network
produced during stimulation can use this simple event-density grid to control variations of
fracture intensity in the stimulated region.
As an alternative, radiated microseismic energy provides a direct measure of fracture surface
area (e.g. Kanamori and Anderson, 1975, and Hanks and Bakun, 2008). Radiated energy within
each grid cell provides a direct measure of treatment-induced rupture area in each cell (Figure
5B) and of induced fracture intensity. Generating the energy-based stimulated volume requires

replacement of individual events with a number of events corresponding to a multiple of the
minimum energy event. The variability of density within individual cells (Figure 5B) reflects
the variation in magnitude and radiated energy of enclosed events. The energy-weighted grid
was developed in this study to control the variations of fracture intensity in the model DFN.
Magnitudes of events observed in the treatment of all three wells were converted into their
energy equivalent using the relationship log 1.5 4.8E M (e.g., Kanamori, 1982) where
1.563096*10 ME in Joules. Since radiated energy is proportional to rupture area (e.g.
Kanamori and Anderson, 1975), the energy contained within a grid cell provides a measure of
fracture rupture area and fracture intensity (fracture area per unit volume) within those cells.
The energy weighted grid cells (Figure 5B) are used in the fracture model development
workflow to control the intensity. The energy-weighted grid is scaled to provide intensities for
the two fracture sets interpreted from the event trend analysis. Model fractures with northwest
trend are assigned intensities equal to 20% of intensities used to control the distribution of the
northeast trending set.

Figure 5: Well 3. A) Event density within grid cells. Cells containing only one event are
colored light blue. Cells with 5 events are colored red. B) Energy density grid colored by
number of common magnitude events with number increasing from purple to red.
The resulting discrete fracture network (Figure 6) consists of the two fracture sets inferred from
the microseismic event trends and Mohr-Coulomb failure criterion. Fractures are distributed
through the area using the energy weighted event density driver (Figure 7).
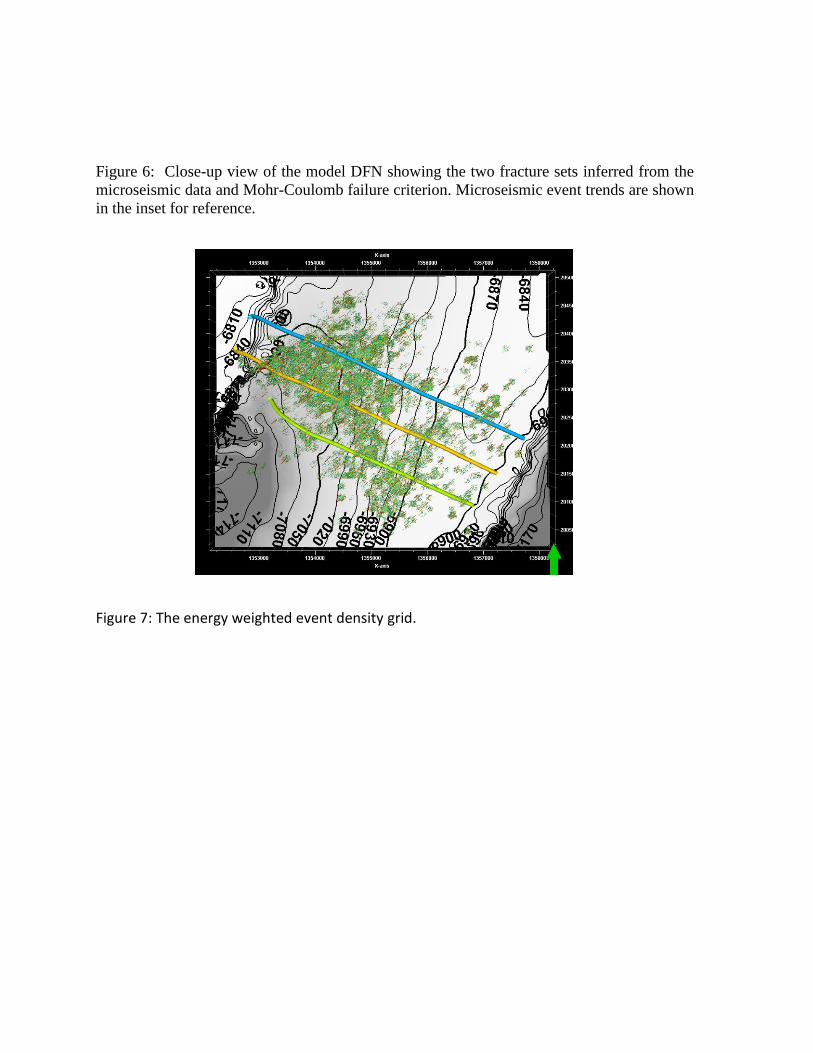
Figure 6: Close-up view of the model DFN showing the two fracture sets inferred from the
microseismic data and Mohr-Coulomb failure criterion. Microseismic event trends are shown
in the inset for reference.
Figure 7: The energy weighted event density grid.

The energy weighted grid is used to distribute fractures throughout the stimulated region
(Figure 8).
Figure 8: Stimulated fracture distribution for all three laterals using an energy weighted
density grid to control fracture density.
The properties of the fracture network, including fracture porosity and permeability, are up-
scaled or distributed into the grid block subdivisions. These porosity and permeability grids
can be dissected to reveal possible variations in the properties of the stimulated reservoir.

As might be expected from the energy density grid, considerable variation in reservoir
properties can be expected. This heterogeneity occurs both laterally and vertically through
the reservoir. The permeability map within the reservoir (Figure 9). Reveals high
permeability regions in the heel half of laterals 1 and 2. (Figure 9).
Figure 9: Relative variations in fracture permeability within the reservoir.
The results of production analysis presented by Wilson et al. (2016) indicated high
correlation between production and in-zone radiated microseismic energy (Figure 10). The
number 1 well has the largest 2-year cumulative production and in cross section view

Figure 10: Two-year cumulative production versus total radiated microseismic energy for 5
wells in the study area including the three wells discussed in this current report.
(Figure 11) generally intersects higher permeability zones within the reservoir.

Figure 11: Relative variations in fracture permeability viewed along a north-south slice
through the permeability grid.
Conclusions
3D seismic processing workflows developed in this study reveal the presence of subtle
discontinuities in the 3D seismic reflection response that are interpreted to arise from zones of
increased fracture intensity in the lower Marcellus Shale in the southwestern PA study area.
Extracted discontinuities form two distinct modes: one with ~N51E trend and a second with
~N45W trend. The trends of reservoir discontinuities do not coincide with the ~N25E trend of
local Alleghenian folds and faults. Microseismicity induced during hydraulic fracture
treatments of wells in the area also forms two distinct trends: a dominant N51E set and a much
less pronounced N56W trend. These observations suggest that the reservoir drainage
architecture will be dominated primarily by northeast-southwest oriented fractures in the
reservoir fracture network.
The distribution of microseismic event trends is used to estimate the orientation of SHmax.
Mohr-Coulomb failure criteria was applied to the microseismic event trends. The orientation
that minimized the number of interpreted trends unlikely to fail (to fall below the failure
envelope) is N84E. Excluding interpreted events that were unlikely to represent actual failure,
the orientations of two main fracture sets were inferred to be the dominant N51E set and a
minor N65W set. The same orientation of SHmax was then used to evaluate the interpreted

seismic discontinuities. That analysis reveal that the majority of interpreted seismic
discontinuities could accommodate failure observed along microseismic event trends. The
average trends of discontinuities most likely to fail N54E and N67W.
Development of a model discrete fracture network incorporated the two fracture sets inferred
from the microseismic. The radiated microseismic energy was averaged into grid cells. This
energy-density grid was then used to control the intensity of fractures in the grid. Following
development of the model DFN, the properties of the model consisting of fracture porosity and
the tensor components of fracture permeability were up-scaled into the model grid. The results
revealed a reservoir with complex porosity and permeability structure. The distribution of
fracture permeability from well to well in this study is consistent with cumulative production
from these wells in that more productive wells intersect larger high permeability volumes along
the length of the lateral.
Overall, the work conducted under this contract provides approaches for improved
reservoir characterization. The results of this work outline methods used to better define
the state of stress in the Marcellus, highlight the use of energy density as a better measure
of stimulated reservoir volume, reveal insights into the heterogeneity of fracture systems
generated in response to hydraulic fracture treatment and their relationship to cumulative
well production.

Acknowledgements
This research is undertaken through the Houston Advanced Research Center’s
Environmentally Friendly Drilling Program funded through the Research Partnership to
Secure Energy for America (RPSEA). A special thanks to Douglas Patchen of the
Environmentally Friendly Drilling Technology East Center for his support of this undertaking.
Schlumberger Petrel and IHS Kingdom Suite software were used to undertake much of the
analysis. Appreciation is extended to the Energy Corporation of America for providing 3D
seismic, microseismic and well data evaluated in this research effort.
REFERENCES
Beardsley, R. W., and M. S. Cable, 1983, Overview of the evolution of the Appalachian basin:
Northeastern Geology, 5, 3/4, 137–145.
Byerlee, J., 1978, Friction of rocks: Pure and Applied Geophysics, 116, 4, 615-626.
Engelder, T, G. Lash, R. Uzcategui, 2009, Joint sets that enhance production from Middle
and Upper Devonian gas shales of the Appalachian Basin: American Association of
Petroleum Geologists Bulletin, 93, 7, 857-889.
Harris, L. D., 1978, The eastern interior aulacogen and its relation to Devonian shale gas
production: Second Eastern Gas Shales Symposium, U.S. Department of Energy,
Morgantown Energy Technology Center, DOE/METC/SP-78/6, 2, 55–72.
Nickelsen, R. P., and V. N. D. Hough, 1967, Jointing in the Appalachian Plateau of
Pennsylvania: Geological Society of America Bulletin, 78, 609–629.
Shumaker, R. C., 1986, Structural development of Paleozoic continental basins of eastern
North America, in M. J. Aldrich, Jr., and A. W. Laughlin, eds., Proceedings of the 6th

International Conference on Basement Tectonics: Salt Lake City, Basement Tectonics
Association, 82–95.
Steidl, P.F., 1977. Geology and methane content of the Upper Freeport coalbed in Fayette
County, PA. Bureau of Mines Report of Investigations 8226r. 21 pp.
Thomas, W. A., 1993, Low-angle detachment geometry of the late Precambrian–Cambrian
Appalachian-Ouachita rifted margin of southeastern North America: Geology, 21, 921–924.
Wilson, T. H., 2000, Seismic evaluation of differential subsidence, compaction and loading in an
interior basin: Bulletin of the American Association of Petroleum Geologists, 84, 3, 376-398.
Additional references to papers resulting from this contract are noted on pages 2 and 3.
Top Related