


Languages
Pages
Legal


DRAFT Final Report
Environmental Flows Assessment Upper Trishuli-1 Hydropower Project
Appendix D: Final Report
Cumulative Impact Assessment Upper Trishuli-1 Hydropower Project, Nepal
Prepared for


APPENDIX D Cumulative Impact Assessment - Upper Trishuli-1 Hydropower Project
Appendix D: Cumulative Impact Assessment
Prepared for: Nepal Water and Energy Development Company & International Finance Corporation
Supplemental ESIA-
Upper Trishuli-1 Hydropower Project, Nepal
December 2014
Cover Photo:
Trishuli River downstream from the proposed powerhouse site, facing
upstream. October, 2013. [Photo: P. de la Cueva]
© 2014 ESSA Technologies Ltd.
No part of this report may be reproduced, stored in a retrieval
system, or transmitted, in any form or by any means, electronic,
mechanical, photocopying, recording, or otherwise, without prior
written permission from ESSA Technologies Ltd.
ESSA Technologies Ltd. Suite 300 – 411 Roosevelt Ave
Ottawa, ON, Canada K2A 3X9
www.essa.com

APPENDIX D Cumulative Impact Assessment - Upper Trishuli-1 Hydropower Project
ii | P a g e
Table of Contents
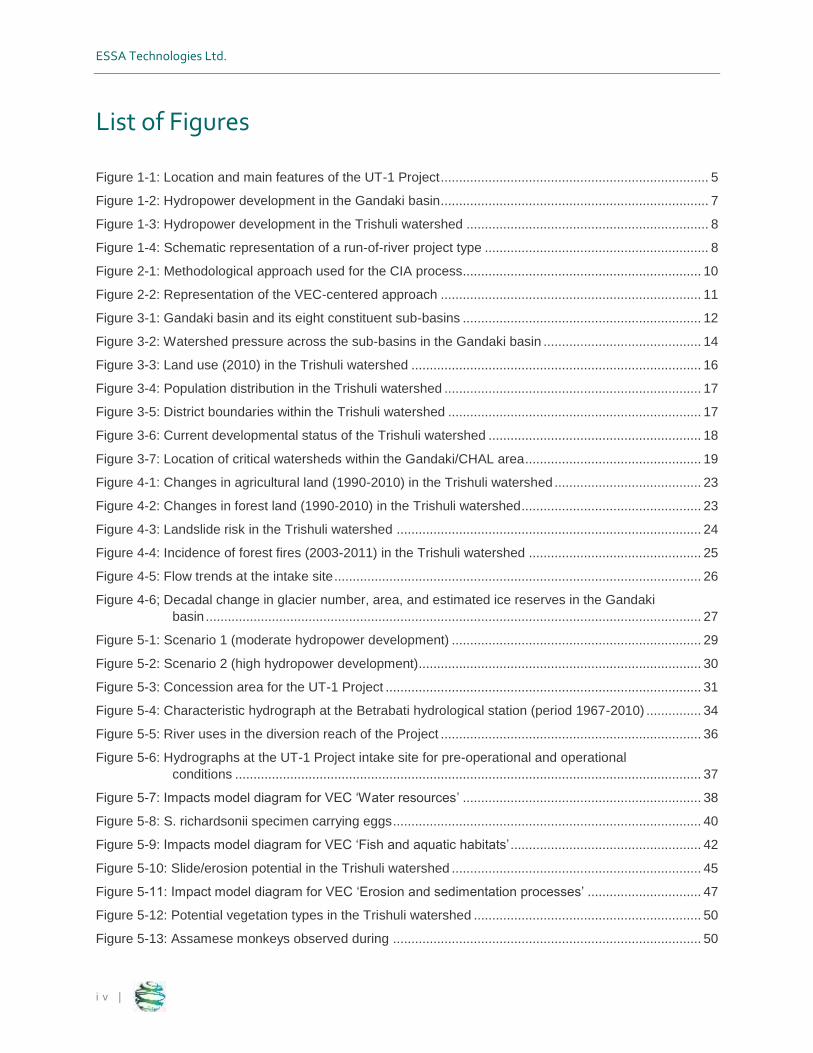
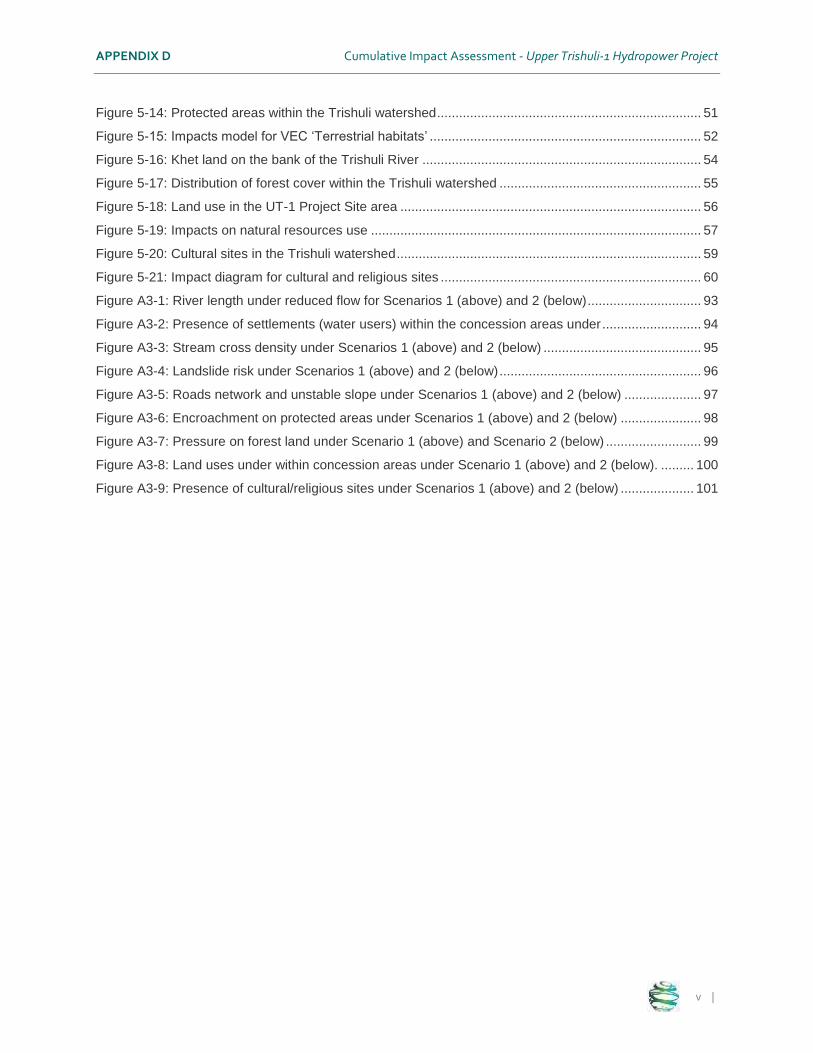
List of Figures ............................................................................................................................................ iv
List of Tables .............................................................................................................................................. vi
Executive Summary .................................................................................................................................... 1
1 Overview ................................................................................................................................................ 3
1.1 Context for Cumulative Impact Assessment in the Upper Trishuli-1 Hydropower Project ........... 3
1.2 The Upper Trishuli-1 Hydropower Project .................................................................................... 4
1.3 Hydropower development in the Trishuli watershed ..................................................................... 6
2 Objectives and methodological approach ......................................................................................... 9
2.1 Objectives ..................................................................................................................................... 9
2.2 Methodology ................................................................................................................................. 9
3 Trishuli Watershed General Context ................................................................................................ 12
3.1 Regional context ......................................................................................................................... 12
3.2 Environmental conditions ............................................................................................................ 13
3.3 Socio-economic conditions ......................................................................................................... 15
3.4 Developmental status .................................................................................................................. 18
3.5 Regulation and institutional context ............................................................................................ 19
4 Scope for Cumulative Impact Assessment ...................................................................................... 20
4.1 Scoping Phase I: Identification of VECs and spatial and temporal boundaries ......................... 20
4.2 Scoping Phase II: Other activities and environmental and social stressors ............................... 22
5 Assessment on Cumulative Impacts on Selected VECs ................................................................ 29
5.1 Development Scenarios .............................................................................................................. 29
5.2 Structure of the Assessment ....................................................................................................... 31
5.3 Water resources (quantity, quality and water users) .................................................................. 33
5.4 Fish and aquatic habitats ............................................................................................................ 40
5.5 Erosion and sedimentation processes ........................................................................................ 44
5.6 Terrestrial habitats ...................................................................................................................... 49
5.7 Use of natural resources ............................................................................................................. 54
5.8 Cultural and religious sites .......................................................................................................... 58
6 Cumulative Impact Management and Monitoring Framework ....................................................... 62
6.1 Management framework ............................................................................................................. 62
6.2 EIA mitigation and monitoring measures relevant for selected VECs ........................................ 63
6.3 Proposed actions for the mitigation and monitoring of cumulative impacts ................................ 65
References ................................................................................................................................................. 68
Annex 1: Inventory of Hydropower Projects in the Trishuli watershed .............................................. 71
Annex 2: Stakeholders consultations-Focus Discussion Groups ....................................................... 77
Objectives of the stakeholders consultations .................................................................................... 77
Criteria for the selection of local stakeholders .................................................................................. 78
Development of the FDGs ................................................................................................................. 79
Outcomes of the FDGs ..................................................................................................................... 79

APPENDIX D Cumulative Impact Assessment - Upper Trishuli-1 Hydropower Project
i i i |
List of participants in the FGDs ......................................................................................................... 88
Annex 3: Spatial indicators of cumulative impacts ............................................................................... 93
Pressure Indicators for the VEC ‘Water Resources’ ......................................................................... 93
Pressure Indicators for the VEC ‘Fish and Aquatic Habitats’ ............................................................ 95
Pressure indicators for the VEC ‘Erosion and Sedimentation Processes’ ........................................ 96
Pressure indicators for the VEC ‘Terrestrial Habitats’ ....................................................................... 98
Pressure indicators for the VEC ‘Use of Natural Resources’ .......................................................... 100
Pressure indicators for the VEC ‘Cultural and Religious Sites’ ....................................................... 101
ESSA Technologies Ltd.
i v |
List of Figures
Figure 1-1: Location and main features of the UT-1 Project ......................................................................... 5
Figure 1-2: Hydropower development in the Gandaki basin ......................................................................... 7
Figure 1-3: Hydropower development in the Trishuli watershed .................................................................. 8
Figure 1-4: Schematic representation of a run-of-river project type ............................................................. 8
Figure 2-1: Methodological approach used for the CIA process................................................................. 10
Figure 2-2: Representation of the VEC-centered approach ....................................................................... 11
Figure 3-1: Gandaki basin and its eight constituent sub-basins ................................................................. 12
Figure 3-2: Watershed pressure across the sub-basins in the Gandaki basin ........................................... 14
Figure 3-3: Land use (2010) in the Trishuli watershed ............................................................................... 16
Figure 3-4: Population distribution in the Trishuli watershed ...................................................................... 17
Figure 3-5: District boundaries within the Trishuli watershed ..................................................................... 17
Figure 3-6: Current developmental status of the Trishuli watershed .......................................................... 18
Figure 3-7: Location of critical watersheds within the Gandaki/CHAL area ................................................ 19
Figure 4-1: Changes in agricultural land (1990-2010) in the Trishuli watershed ........................................ 23
Figure 4-2: Changes in forest land (1990-2010) in the Trishuli watershed ................................................. 23
Figure 4-3: Landslide risk in the Trishuli watershed ................................................................................... 24
Figure 4-4: Incidence of forest fires (2003-2011) in the Trishuli watershed ............................................... 25
Figure 4-5: Flow trends at the intake site .................................................................................................... 26
Figure 4-6; Decadal change in glacier number, area, and estimated ice reserves in the Gandaki
basin ....................................................................................................................................... 27
Figure 5-1: Scenario 1 (moderate hydropower development) .................................................................... 29
Figure 5-2: Scenario 2 (high hydropower development) ............................................................................. 30
Figure 5-3: Concession area for the UT-1 Project ...................................................................................... 31
Figure 5-4: Characteristic hydrograph at the Betrabati hydrological station (period 1967-2010) ............... 34
Figure 5-5: River uses in the diversion reach of the Project ....................................................................... 36
Figure 5-6: Hydrographs at the UT-1 Project intake site for pre-operational and operational
conditions ............................................................................................................................... 37
Figure 5-7: Impacts model diagram for VEC ‘Water resources’ ................................................................. 38
Figure 5-8: S. richardsonii specimen carrying eggs .................................................................................... 40
Figure 5-9: Impacts model diagram for VEC ‘Fish and aquatic habitats’ .................................................... 42
Figure 5-10: Slide/erosion potential in the Trishuli watershed .................................................................... 45
Figure 5-11: Impact model diagram for VEC ‘Erosion and sedimentation processes’ ............................... 47
Figure 5-12: Potential vegetation types in the Trishuli watershed .............................................................. 50
Figure 5-13: Assamese monkeys observed during .................................................................................... 50
APPENDIX D Cumulative Impact Assessment - Upper Trishuli-1 Hydropower Project
v |
Figure 5-14: Protected areas within the Trishuli watershed ........................................................................ 51
Figure 5-15: Impacts model for VEC ‘Terrestrial habitats’ .......................................................................... 52
Figure 5-16: Khet land on the bank of the Trishuli River ............................................................................ 54
Figure 5-17: Distribution of forest cover within the Trishuli watershed ....................................................... 55
Figure 5-18: Land use in the UT-1 Project Site area .................................................................................. 56
Figure 5-19: Impacts on natural resources use .......................................................................................... 57
Figure 5-20: Cultural sites in the Trishuli watershed ................................................................................... 59
Figure 5-21: Impact diagram for cultural and religious sites ....................................................................... 60
Figure A3-1: River length under reduced flow for Scenarios 1 (above) and 2 (below) ............................... 93
Figure A3-2: Presence of settlements (water users) within the concession areas under ........................... 94
Figure A3-3: Stream cross density under Scenarios 1 (above) and 2 (below) ........................................... 95
Figure A3-4: Landslide risk under Scenarios 1 (above) and 2 (below) ....................................................... 96
Figure A3-5: Roads network and unstable slope under Scenarios 1 (above) and 2 (below) ..................... 97
Figure A3-6: Encroachment on protected areas under Scenarios 1 (above) and 2 (below) ...................... 98
Figure A3-7: Pressure on forest land under Scenario 1 (above) and Scenario 2 (below) .......................... 99
Figure A3-8: Land uses under within concession areas under Scenario 1 (above) and 2 (below). ......... 100
Figure A3-9: Presence of cultural/religious sites under Scenarios 1 (above) and 2 (below) .................... 101

ESSA Technologies Ltd.
v i |
List of Tables Table 1-1: Salient features of UT-1 Hydropower Project .............................................................................. 5
Table 3-1: Pressure/risk indicators used for the regional assessment of the Gandaki sub-basins ............ 13
Table 3-2: Regional assessment of watershed health within the Gandaki system..................................... 14
Table 4-1: List of selected VECs ................................................................................................................. 21
Table 5-1: Proposed indicators for the assessment of cumulative impacts on selected VECs .................. 32
Table 5-2: Indicators for cumulative impacts on the VEC ‘Water Resources’ ............................................ 39
Table 5-3: Significance of impacts on VEC ‘Water Resources’ .................................................................. 39
Table 5-4: Migratory fish species in the Trishuli watershed ........................................................................ 41
Table 5-5: Cumulative impacts on the VEC ‘Fish and Aquatic Habitats’ .................................................... 43
Table 5-6: Significance of impacts on the VEC ‘Fish and Aquatic Habitats’ ............................................... 44
Table 5-7: Cumulative impacts on the VEC ‘Erosion and Sedimentation Processes’ ................................ 48
Table 5-8: Significance of impacts on the VEC ‘Erosion and Sedimentation Processes’ .......................... 48
Table 5-9: Cumulative impacts on the VEC ‘Terrestrial Habitats’ ............................................................... 53
Table 5-10: Significance of impacts on the VEC ‘Terrestrial Habitats’ ....................................................... 53
Table 5-11: Cumulative impacts on the VEC ‘Use of Natural Resources’ .................................................. 58
Table 5-12: Significance of impacts on the VEC ‘Use of Natural Resources’ ............................................ 58
Table 5-13: Cumulative impacts on the VEC ‘Cultural and Religious Sites’ ............................................... 60
Table 5-14: Significance of impacts on VEC ‘Cultural and religious sites’ ................................................. 61
Table 6-1: EIA mitigation and monitoring measures relevant for the selected VECs ................................. 64
Table 6-2: Management and monitoring actions for cumulative impacts mitigation ................................... 66

APPENDIX D Cumulative Impacts Assessment- Upper Trishuli-1 Hydropower Project
1 |
Executive Summary
The Upper Trishuli-1 Project is a run-of-river type 216-MW hydropower facility located in
Rasuwa District in central Nepal. Once in operation, this hydropower project will be the
largest hydropower facility in the Trishuli watershed.
As per IFC Performance Standard 1 (PS1): Assessment and Management of Environmental
and Social Risks and Impacts, clients are expected to ensure that their own assessment
determines the degree to which the project under review is contributing to cumulative
impacts, in association with other projects and activities. Since the Project will be located in
the Trishuli Watershed where other infrastructure projects are currently being built and
planned, most notably multiple hydropower facilities, an evaluation of potential cumulative
impacts was required. This analysis of cumulative impacts was not included in the original
ESIA (Jade Consult 2011).
ESSA Technologies Ltd. (ESSA) has conducted the following Cumulative Impact
Assessment (CIA) to bring the environmental and social management of the Upper Trishuli-
1 Hydropower Project (UT-1 Project) in compliance with international standards (e.g. IFC
Performance Standards).
The assessment of cumulative impacts presented in this report has followed a 6-step
methodological approach that follows the same logic framework usually applied for an ESIA
and it is based on international best practice; mainly the Good Practice Handbook on
Cumulative Impact Assessment and Management for the Private Sector in Emerging
Markets (IFC 2013). This methodology is based on a Valued Environmental and Social
Components (VEC)-centered approach in which the focus of the analysis is the VEC that
are impacted by multiple projects and developments and subject to the influence of various
natural and social pressures/stressors.
The key VECs selected for this assessment, and identified with the input from local
stakeholders, include the following: water resources (quantity, quality and availability), fish
and fish habitats, terrestrial ecosystems, erosion and sedimentation processes, use of
natural resources by local communities and cultural and religious sites
To assess the cumulative impacts on each VEC, potential impacts have been first identified
using an impact hypothesis approach by which the cause-effect chains leading from project
action and stressor towards the VECs are conceptualized using impact hypothesis
diagrams. Based on the interactions identified in these diagrams, impact indicators for each
VEC and potential impact have been identified.
Given the lack of information on some of the VECs, the indicators used for this assessment
are spatial indicators of pressures and risks affecting the VECs rather than on the
evaluation of specific impacts (i.e. ecological processes underlying the cumulative impacts

ESSA Technologies Ltd.
2 |
under study). As simple surrogates for complex ecological processes watershed habitat
indicators are unlikely to accurately represent direct cause-and-effect relationships but act
as estimates for the pressures or risks acting on the VECs.
Although clearly a fast-growing sector in the Trishuli basin, there is a certain degree of
uncertainty as to the number of hydro projects that will be finally implemented in the
watershed. For this reason, two hydropower development scenarios have been considered
for the assessment of impacts: (i) a moderate development in which all operative and under
construction projects are finalized and functioning within the watershed; and (ii) a high
intensity development scenario in which all the projects currently under planning are added
to the hydropower pipeline in the Trishuli watershed.
The identified cumulative impacts have been assessed in terms of its significance taking
into consideration the Project’s contribution to such impacts under the two scenarios, and
the current state and expected evolution of the VECs’ status based on the available
baseline information. The most significant cumulative impacts include: reduced water
availability (locally along the stretched or the river under reduced-flow); fragmentation
(especially by the barrier effect of the weirs/dams) and degradation of aquatic habitats, and
the increased risk of landslides.
Based on the results of the cumulative impacts analysis, a number of mitigation and
monitoring measures are proposed to help minimize potential cumulative impacts on the
selected VECs. These measures follow the mitigation hierarchy recommended by IFC and
build on existing environmental and social activities and action items proposed in the
approved 2011 EIA (Jade Consult 2011). These measures should be developed and
implemented within the framework of a Cumulative Impacts Management Plan, to be
implemented throughout the life of the Project.
APPENDIX D Cumulative Impacts Assessment- Upper Trishuli-1 Hydropower Project
3 |
1 Overview
1.1 Context for Cumulative Impact Assessment in the Upper Trishuli-1 Hydropower Project
Cumulative impacts can be defined as the change to the environment caused by the
incremental and/or combined effects of an action/project in combination with other present,
past, and reasonably foreseen future actions (Hegmann et al. 1999). These changes may
result in significant impacts that would not be expected in the case of stand-alone projects.
For practical reasons, the identification and management of cumulative impacts are limited
to those effects generally recognized as important on the basis of scientific concerns and/or
concerns of affected communities.
Although the Environmental and Social Impact Assessment (ESIA) process is essential to
assessing and managing the environmental and social impacts of individual projects, it is
recognized that it often may be insufficient for identifying and managing incremental impacts
on areas or resources used or directly affected by a given development. This is especially
true in situations where multiple projects occur, or are planned, in the same geographic
area. This is the case for the Trishuli watershed, where multiple hydropower projects are
under different stages of development and a growing trend in this sector is expected in the
near future (see Section 1.3 for a description of hydropower development status in the
Trishuli watershed).
Under the current system of environmental assessment in Nepal, environmental and social
impacts of government or private-sponsored projects are evaluated on an individual basis
based on the 1997 Environment Protection Rules (EPR) applicable sectorial guidelines and
policies (Bhatt and Khanal 2009).
The government-approved Environmental Impact Assessment (EIA) for Upper-Trishuli
Hydropower Project (Jade Consult 2011) did not address cumulative impacts as part of its
assessment. However, a number of ESIA studies (CEPAD 2011) for other hydropower
projects in the Trishuli basin have considered the cumulative implications of these projects
to a certain extent. The commonly identified cumulative impacts included the following:
Changes in land use;
Reduction of water flow along certain river stretches;
Increase in sediment loads to the watershed and alteration of the sediment
dynamics;
Loss of agricultural land;
Impacts on livelihoods dependent on altered ecosystem services;
Aquatic impacts, in particular fish;
Interference with migratory routes and/or terrestrial wildlife movement; and

ESSA Technologies Ltd.
4 |
Loss of aesthetic and/or recreational values.
In light of the current hydropower development trends in the Trsihuli watershed, there is a
need for assessments that employ available information to examine the potential cumulative
effects of existing and proposed hydropower facilities on broader scales (i.e. river basin)
than is currently being realized.
It should also be noted that the participation of the International Financial Corporation (IFC)
in the Upper Trishuli-1 Project requires compliance with international environmental and
social standards as well as alignment with best practices in the assessment of potential
impacts. In this respect, IFC’s Performance Standard 1 (Assessment and Management of
Environmental and Social Risks and Impacts) stipulates that private sector proponents are
expected to determine the degree to which their project is contributing to cumulative
impacts, in association with other projects and activities. The extent and the level of the
cumulative impacts assessment should be commensurate with the incremental contribution,
source, extent, and severity of the cumulative impacts anticipated.
It is in this context of bringing the UT-1 Project in conformance with international standards
(including IFC PS 1) ESSA has conducted the present assessment of cumulative impacts
and risks, according to international best practice, particularly IFC’s 2013 Good Practice
Handbook on Cumulative Impact Assessment and Management: Guidance for the Private
Sector in Emerging Markets, and commensurate to the significance of the anticipated
impacts and the expected contribution of the Project’s to these incremental impacts in the
Trishuli watershed.
1.2 The Upper Trishuli-1 Hydropower Project
The UT-1 Project is a 216-MW run-of-river hydropower facility located in Rasuwa District in
central Nepal (Figure 1-1), approximately 70 km north from Kathmandu. The Project’s
concession area extends into three Village Development Committees (VDCs): Haku,
Dhunche and Ramche.
All the Project’s associated infrastructure - including the intake structure, the headrace
tunnel, the 19-km access road, and the underground power station - are located in the
northwest bank of the Trishuli River. Langtang National Park extends along the southeast
bank. At this stage, the Project has started construction and earthworks are being carried
out in the powerhouse area. It is expected that the Project will be completed in five years. It
should be noted that, at the time of this assessment, the transmission line, subject to a
separate EIA which has not been released yet, has not been considered in this assessment.

APPENDIX D Cumulative Impacts Assessment- Upper Trishuli-1 Hydropower Project
5 |
Figure 1-1: Location and main features of the UT-1 Project
The diversion structure for this project is a 77 m wide dam. The hydropower facility is
designed to work at a constant water level of 1255 m. This involves a storage capacity in
the reservoir to compensate for low flows, although it is expected that the operation mode
will be run-of-river most of the time (no peaking operations).
Table 1-1: Salient features of UT-1 Hydropower Project
Source: Jade Consult 2011
Project component Description
Installed capacity 216 MW
Net head 333.41m
Average annual energy 1440 GWH
Head race tunnel length About 9.82 km, 6.5 m Circular shape
Design discharge Q50 = 74 m³/s
Maximum diversion flow 74 m³/s
Type of powerhouse Underground
Turbine 3 Francis turbines of 72 MW capacity
Access road 19.3 km road from Mailung Dhovan
(powerhouse site) to the intake site
Transmission line Initial Environmental Examination (IEE) recently
completed. Not included in the CIA

ESSA Technologies Ltd.
6 |
The diversion reach between the intake site and the tailrace extends for 10.7 km. The
catchment area of the Trishuli watershed at the UT-1’s intake site is 4350 km2, and 71 % of
this surface is located in the Tibet Autonomous Region in Chinese territory.
The 2011 EIA study (Jade Consult 2011), approved by the Government of Nepal, did not
address the cumulative impacts associated to the construction and operation of the Upper
Trishuli-1 Project but identified the following main impacts at the project level:
Alteration of the hydrological regime along the 10.7 km diversion reach with potential loss of aquatic habitat for the species of snow trout (Schizothorax richardsonii) present in the area
Acquisition and land conversion (as of June 2014, the total area required for the project is 99.89 ha, including 76.7 ha of community forests and 19.5 ha of agricultural land).
Loss of vegetation
Disruption to local wildlife especially during the construction activities
Increased pressure on local natural resources (i.e. fuel-wood consumption, hunting, habitat degradation) due to the influx of migrant workers to the area
Increased economic activity and employment opportunities in the Project’s area of influence.
1.3 Hydropower development in the Trishuli watershed
Nepal has a significant potential for hydropower development given the perennial nature of
Nepali rivers and the steep gradient of the country's topography. Currently, the installed
capacity generated by the 38 operative hydropower facilities in Nepal is 700.379 MW.
Hydropower contributes with 90 % to the power system and the rest of the balance is met
by multi-fuel plants. Only about 40% of Nepal's population has access to electricity.
The hydropower sector in Nepal opened formally to private sector developers in the late
1990’s, with the enactment of new Hydropower Development Policy 1992, and has since
then rapidly developed. The government body in charge of issuing hydropower licenses is
the Department of Electricity Development, dependent of the Ministry of Energy of Nepal. It
is estimated that the total theoretical hydroelectricity potential of the country is 83,000 MW;
42,000 MW out of this potential capacity would be economically feasible (ADB and ICIMOD,
2006). Therefore, it is expected that the hydropower market in Nepal will grow significantly
in the coming years to address both the growing domestic and regional demand. There are
nine major basins in Nepal (i.e. Seti, Karnali, Bheri, Rapti, Kali, Trishuli, Narayani, and Kosi)
where most of the hydropower potential is concentrated.

APPENDIX D Cumulative Impacts Assessment- Upper Trishuli-1 Hydropower Project
7 |
As of November 2013, and according to the licenses registry of the Department of Electricity
Development1 (DOED), there were 20 operative hydropower projects in the Gandaki system
(Figure 1-2), 33 projects under construction, and a total of 53 projects in a planning phase
(with survey licenses). Most of the projects under planning (41) correspond to small
hydropower plants with a generation capacity of less than 25 MW.
Figure 1-2: Hydropower development in the Gandaki basin
The Trishuli (Figure 1-3) is the sub-basin of the Gandaki River with the highest intensity in
hydropower development. There are currently (DOED November 2013) 5 hydropower
projects in operation, 9 under construction, including the UT-1 Project, and another 19 have
a survey license. The salient features of these projects, all of them run-of-river type with
generation capacities ranging between 1 and 216 MW, are included in Annex 1.
Once finished, the UT-1 Project will be the facility with the highest generation capacity (216
MW) in the watershed. It should be noted that, out the total power generation capacity
licensed in the Trishuli River (839 MW for 14 projects), only 38.1 MW (0.05%) have been
developed; with the rest of the projects at different stages of development and assessment.
1 http://www.doed.gov.np/issued_licenses.php

ESSA Technologies Ltd.
8 |
From the total issued license for power generation in the Trishuli tributaries (245 MW for 25
projects), a capacity of 23.65 MW (0.09%) has been developed.
Figure 1-3: Hydropower development in the Trishuli watershed
Most of the power plants in Nepal are run-
of-river type with energy available in
excess of domestic demand during the
monsoon season and deficit during the dry
season. Under this type of hydropower
generation (see Figure 1-4 for a schematic
representation), a portion of the river’s
flow is diverted off-channel and
transported downhill to a powerhouse,
where the water turns turbines, generating
electricity, before being restored to the
natural stream flow. As a result of this
process, a portion of the river channel
between the intake structure and the outlet
from the powerhouse experiences
reduced flow levels. Figure 1-4: Schematic representation of a run-of-river project type
(Source: Nepal Energy Forum, 2013)
APPENDIX D Cumulative Impact Assessment- Upper Trishuli-1 Hydropower Project
9 |
2 Objectives and methodological approach
2.1 Objectives
The overall goal of the CIA study is to identify environmental and social impacts and risks
associated with the UT-1 Project that, when placed in the context of existing, planned, and
reasonable predictable developments in the future, may generate cumulative impacts that
could jeopardize the overall long-term environmental, social and economic sustainability of
the Project and the watershed.
Since the issues and dynamics in the Trishuli basin are complex and there is significant
level of environmental degradation involving many stakeholders, we anticipate that the
solution for cumulative impacts in the watershed is beyond the control of any individual
project sponsor. In this context, this CIA aims at helping NWEDC with:
1. Engaging with local stakeholders to identify key Valued Environmental and Social
Components (VECs) potentially affected by cumulative impacts;
2. Assessing cumulative impacts and risks on selected VECs, and determining
their significance and the Project’s contribution to these impacts;
3. Identifying environmental and social management actions, both within
NWEDC’s leverage and requiring coordination with third parties, to mitigate and
monitor the cumulative impacts.
2.2 Methodology
2.2.1 Approach
The assessment of cumulative impacts presented in this report has followed a 6-step
methodological approach (Figure 5) that follows the same logic framework usually applied
for an ESIA and it is based on international best practice; mainly the Good Practice
Handbook on Cumulative Impact Assessment and Management for the Private Sector in
Emerging Markets (IFC 2013). It should be noted that the steps in this approach do not
necessarily proceed in sequence and some iteration was applied throughout the process as
information was generated and some steps were revisited based on the outcomes of
successive steps.
The first two steps (Section 4 of this report) of this approach correspond to the scoping of
the CIA analysis. The goal of the scoping exercise is to identify the key Valued
Environmental and Social Components (VECs) on which the assessment of effects will
focus, the temporal and spatial boundaries for the assessment, and the various activities

ESSA Technologies Ltd.
1 0 |
and natural stressors acting on the watershed that may also contribute to cumulative
impacts on the VECs.
For each of the selected VECs (Section 5), the cumulative impacts affecting the component
were identified, assessed and evaluated in terms of their significance. The assessment of
cumulative impacts has analyzed two potential hydropower development scenarios. Based
on these results, and considering the mitigation and monitoring measures proposed in the
approved EIA (Jade Consult 2011), management and monitoring measures were proposed
(Section 6) for the mitigation and management of the expected cumulative impacts.
Figure 2-1: Methodological approach used for the CIA process
This methodology is based on a VEC-centered approach (Figure 2-2) in which the focus of
the analysis is the Valued Environmental and Social Components that are impacted by
multiple projects and developments and subject to the influence of various natural and
social pressures/stressors (i.e. climate change, increasing water demand, etc.). The goal of
the analysis is to identify the cumulative impacts affecting the key VECs and assess how
their future status could be affected by these pressures.

APPENDIX D Cumulative Impact Assessment- Upper Trishuli-1 Hydropower Project
1 1 |
Figure 2-2: Representation of the VEC-centered approach (Source: Adapted from IFC 2013)
2.2.2 Sources of information and limitations of the study
The study is mainly based on the analysis of secondary data and information collected
through literature review and contacts with relevant stakeholders. Primary data from the
complementary environmental and social baseline surveys recently conducted by Nepal
Environmental & Scientific Services (NESS) have also been incorporated in the
assessment. In addition, consultations were held at the district and community level with
local stakeholders (Annex 2) to help define the scope of the CIA and select the key VECs.
The report also integrates outputs from the other tasks under these IESC services,
especially the GIS Mapping and Spatial Analysis and the Environmental Flows Assessment
tasks. The assessment of cumulative impacts is limited by the available information and
reflects the existing gaps on the baseline data. The following are the main limitations of the
present CIA:
Transmission lines of the hydropower projects have not been included in the
analysis because information on the existing and/or planned transmission
infrastructure in the Trishuli watershed was not available at the time of the
assessment. Since there are no major electricity consumers in the direct area of
influence, potential developers of hydropower in the Trishuli basin will need to build
transmission lines to evacuate power. At this stage, the final design option and EIA
for the UT-1 transmission arrangement has not been finalized.
Given the limited information, the assessment of impacts, which has been done
based on a set of spatial indicators (Section 5), is based on pressures and risks
affecting the VECs rather than on the evaluation of specific impacts (i.e. ecological
processes underlying the cumulative impacts under study).

ESSA Technologies Ltd.
1 2 |
3 Trishuli Watershed General Context
3.1 Regional context
The Trishuli watershed is one of the eight sub-basins of the Gandaki River basin, which
covers an area 32,000 km² in central Nepal (Figure 3-1). The Trishuli watershed occupies
13% of the total Gandaki area and it is the tributary located more to the East, within the
physiographic Highland and Midland zones, characterized by average altitudes of 2000 m
and high valley landscapes.
The Trishuli River originates in the Tibet Autonomous Region of the People’s Republic of
China, where it is known as Bhote Koshi. The catchment area of Bhote Koshi in Tibet is
about 3,170 km2 for a river length of 120 km. The approximate 106 km of Trishuli River
within Nepal show a high gradient in the initial 40 km with. Rapids predominate all along the
longitudinal profile but there are no impassable falls.
Figure 3-1: Gandaki basin and its eight constituent sub-basins

APPENDIX D Cumulative Impact Assessment- Upper Trishuli-1 Hydropower Project
1 3 |
From a conservational and planning perspective, the Gandaki system constitutes what is
known as the Chitwan-Annapurna Landscape (CHAL); a region that the Government of
Nepal is envisioning as a north-south linkage vital to provide a safe passage of river and
forest corridors for wildlife, migratory birds and aquatic animals (WWF-Nepal 2013).
3.2 Environmental conditions
As previously indicated, the Trishuli basin has already been altered by anthropogenic
activities, with five hydropower projects currently in operation, and existing cumulative
impacts are evident not only in terms of aquatic habitat fragmentation but also in terms of
overall degradation of the catchment area (e.g., deforestation, erosion, multiple access
roads, and transmission lines).
As part of the GIS Mapping and Spatial Analysis task (Appendix C in Supplemental ESIA,
ESSA 2014) conducted for this project, we have developed a set of watershed pressure
indicators (Table 3-1) for the sub-basins in the Gandaki system. These indicators
characterize the level of pressure from different development factors (e.g. roads, population
density, hydropower development, etc.) on each sub-basin. These indicators were ranked
giving the lowest score to the sub-basins with the highest level of pressure and an overall
score of cumulative pressure was estimated. The Trishuli watershed came as second, after
the Madi basin, for the highest level of stress/pressure for the selected indicators. Table 3-2
and Figure 3.2 show the results of this regional assessment on watershed pressures.
Table 3-1: Pressure/risk indicators used for the regional assessment of the Gandaki sub-basins
Factor of watershed pressure/risk
Pressure/risk Indicator Metric
Surface erosion
Road density: Total length of roads divided by the total watershed area.
km/km2
Road density in proximity of streams: Length of roads within 100 m of a stream, divided by total area of the watershed.
km/km2
Stream crossing density: Number of road-stream crossings in the watershed by the total area of the watershed.
no./km2
Road density on unstable slopes: Length of roads on slopes > 45% divided by the total watershed area.
km/km2
Mass wasting Landslide potential: Total surface of terrain with slopes >45% divided by the total watershed area.
km2/km
2
Impacts from human populations
Population density: Population counts of VDCs with more than 100 inhabitants (based on national census) divided by the total watershed area.
Persons/km2

ESSA Technologies Ltd.
1 4 |
Factor of watershed pressure/risk
Pressure/risk Indicator Metric
Hydropower development
High hydropower development scenario: Percentage of hydropower concession areas (including operating, under construction and survey licenses) over the total watershed area.
%
Table 3-2: Regional assessment of watershed health within the Gandaki system
Figure 3-2: Watershed pressure across the sub-basins in the Gandaki basin

APPENDIX D Cumulative Impact Assessment- Upper Trishuli-1 Hydropower Project
1 5 |
The Trishuli watershed has the highest level of hydropower development of all the sub-
basins in the Gandaki system. Road density, with its associated impacts on erosion and
aquatic habitats, is also a significant pressure in the Trishuli in comparison with the other
sub-basins.
From a conservational perspective, and within the broader CHAL (Chitwan-Annapurna
Landscape) area, the Trishuli River is considered a naturally occurring corridor that provides
critical linkages north-south in the landscape. Common biodiversity conservation issues
affecting the CHAL region include: deforestation, overexploitation of community forests,
illegal harvest of non-timber forest products, hydropower development affecting freshwater
ecosystems connectivity, poaching, and forest fires and landslides as commonly occurring
natural hazards.
3.3 Socio-economic conditions
86% of the total population of Nepal lives in rural areas. Since 1981, national and rural
population growth rates have been rapid, putting tremendous pressure on natural resources
such as agricultural land and forests (ADB and ICIMOD, 2006).
According to the 2001 census, 66% of the active population is engaged in the primary
sector, including agriculture, forestry, and fisheries (ADB and ICIMOD, 2006). In the Trishuli
watershed, the main economic activities are forestry and small scale agriculture in the upper
part of the watershed, and agriculture in the lower part. Figure 3-3 shows the contrast in
land uses between the upper and the lower part of the watershed. The upper part is
characterized by steep, difficult access and the predominance of forest cover.
Subsistence production is the typical form of agriculture in the region, with one-fourth (24%)
of the surveyed rural population produced food sufficient for whole year, and one-third
produced enough food only for six months (WWF-Nepal 2013). Forests in the watershed
are managed either by the government or by Community Forest Users Groups (CFUG). In
the Rasuwa District, there are 76 CFUG involving over 5,000 households (Jade Consult
2011).

ESSA Technologies Ltd.
1 6 |
Figure 3-3: Land use (2010) in the Trishuli watershed
Local communities also depend on local resources for their energy supply, with firewood
being the most common (used for 80% of the population) fuel. In general, health, water and
sanitation and energy status is poor in the region, as it is in most of rural Nepal. Less than
40% of households overall have electricity. The Hill region has electricity connections in
nearly 43% of households; whereas nearly 80% of Mountain households do not have
electricity (ADB and ICIMOD, 2006).
The population of Nepal includes diverse ethnic groups (Janjatis) and castes, languages,
religions, and cultural traditions. In the upper part of the watershed, the predominant ethnic
group is Tamang, and the Rasuwa District is popularly known as “Land of Tamangs”.
Population is more concentrated in the lower part of the watershed (Figure 9), while the
upper part is more sparsely populated. Out-migration rates are high in the region due to the
lack of employment opportunities. Within the Project’s direct area of influence, Haku VDC
has the highest number of labor migrants (Jade Consult 2011).

APPENDIX D Cumulative Impact Assessment- Upper Trishuli-1 Hydropower Project
1 7 |
Figure 3-4: Population distribution in the Trishuli watershed
Figure 3-5: District boundaries within the Trishuli watershed

ESSA Technologies Ltd.
1 8 |
3.4 Developmental status
The main development activity that is experiencing a rapid growth in the recent years, in the
Trishuli and in other watershed in Nepal, is hydropower. By January 2008 the Nepal
government had issued survey licenses (for hydropower projects with capacity above 1
MW) for 4,520 MW of electricity generation throughout the country (Jade Consult 2011). As
previously mentioned, and according to the scenarios considered in this assessment, future
hydropower scenarios in the Trishuli basin could vary from 14 to 33 operating projects.
Currently, there are five hydropower facilities operating in the watershed. The oldest facility,
Trishuli Hydropower Project with a capacity of 24 MW, is located in the middle part of the
watershed, in the proximity of Betrabati, and has been operative since 1967. The most
recent project, Tadi Khola, started operations in 2013. Figure 3-6 shows the operational
hydropower projects and the road network in the Trishuli basin.
Figure 3-6: Current developmental status of the Trishuli watershed
Roads in the Trishuli are concentrated in the middle part of the watershed, where the
population density is higher and the topography is more favorable. The development of
hydropower projects in the upper part is driving the extension of the road network into this
region. As in all Hill and Mountain districts in Nepal, construction of roads in this part of the

APPENDIX D Cumulative Impact Assessment- Upper Trishuli-1 Hydropower Project
1 9 |
watershed requires huge investment in both construction and maintenance. Common
adverse environmental impacts associated to road expansion in mountainous areas include:
landslides, slope instability, soil erosion, and roadside runoff.
A total of 111 km of roads have been developed in the district, connecting 11 VDCs out of
19 VDCs of the district. The road density is about 6.61km per 100km2. Out of the total
nearly 66 km (from the Rasuwa - Nuwakot Boarder to Rasuwagadhi) is paved, while the
rest are gravel roads.
3.5 Regulation and institutional context
The Government of Nepal made environmental impact assessments (EIAs) compulsory
since 1993 under the EIA National Guidelines for all hydroelectric projects above 5 MW.
Sectorial policies such as the Water Resources Development Policy (2002) and the
Hydropower Development Policy (2002) have also established some general guidelines in
relation to environmental management. Under the Hydropower Development Policy (2002),
hydropower facilities are required to release a minimum environmental flow equal to 10% of
the minimum of the mean monthly flow, or a higher amount as determined in the EIA.
The primary responsibility for watershed management in Nepal lies with the Department of
Soil Conservation and Watershed Management (DSCWM) within Ministry of Forest and Soil
Conservation. To our knowledge, no watershed management plan has been formulated for
the whole Trishuli basin, although priority micro-watersheds have been identified in the
watershed and some local actions have taken place (Figure 3-7).
Figure 3-7: Location of critical watersheds within the Gandaki/CHAL area (Source: WWF-Nepal 2013)
ESSA Technologies Ltd.
2 0 |
4 Scope for Cumulative Impact Assessment
4.1 Scoping Phase I: Identification of VECs and spatial and temporal boundaries
4.1.1 Valued Environmental and Social Components (VECs)
Since it is unrealistic to address every environmental or social aspect that could be
potentially subjected to cumulative impacts, it is good practice to focus the assessment and
management strategies over environmental and social attributes that are considered to be
important in assessing risk: the Valued Environmental and Social Components (VECs).
These VECs, which may be physical features (e.g. habitats, wildlife populations), natural
processes or ecosystem services, social conditions (e.g. health, economics) or cultural
aspects (e.g. temples); tend to be at the end of ecological pathways and are therefore
considered the ultimate recipient of cumulative impacts. The importance of these VECs may
be determined on the basis of cultural values or scientific concern (Hegmann et al., 1999)
Good practice recommends that VECs should be identified by both social and ecological
scoping (IFC 2013); with social scoping implying participatory, meaningful, and transparent
consultation with affected communities and/or stakeholders and ecological knowledge
based on expert knowledge. Taking these aspects into consideration, the identification of
VECs for the current assessment was based on the following key inputs:
Consultations with local stakeholders and communities: NESS conducted a
series of Focus Discussion Groups (FDG) with key stakeholders, including
vulnerable and river/water uses groups, in January 2014 (please see Annex 2 for
more details). The main goal of these consultations was to inform stakeholders
about the CIA process and facilitate their identification of key VECs.
Knowledge about the Project works and activities and the environment likely
to be affected, as captured in the original 2011 EIA (Jade Consult 2011) and
informed by the baseline information compiled as part of the documentation for the
CIA process and the complementary social and environmental baselines conducted
by NESS as part of this IESC assignment.
VECs identified in other CIA exercises in Nepal, particularly the Rapid Cumulative
Impacts Assessment (RCIA) conducted for the Kabeli-A Hydropower Project (World
Bank 2013). This RCIA assessment identified the following key VECs: surface water
(quantity and quality); landslide/erosion and sedimentation; resident and migratory
fish population; spiritual and religious components; and landscape.
Common understanding in the literature about environmental and social
impacts of hydropower projects and affected VECs: There exists in the

APPENDIX D Cumulative Impact Assessment- Upper Trishuli-1 Hydropower Project
2 1 |
international literature (IEA 2000, WB 2012) a body of knowledge on the most
common documented environmental and social effects of hydropower facilities,
located across a range of geographic settings, and the most likely VECs by these
impacts.
Based on all the above sources of information, the VECs selected for the CIA analysis were
the following:
Table 4-1: List of selected VECs
VEC Comments
Water resources
Water quantity
Water quality
Water users
The major impacts associated with the UT-1 Project, and generally with hydropower development, will be on hydrological variables and other users of the water resource.
Local communities expressed concern over scarcity of drinking water and the potential impacts of the environmental flow regime.
Impacts in flow-reduced stretch of the river (irrigation water use, water mills) are a common concern for communities
Fish and aquatic habitats The main impact on biodiversity will be on aquatic habitats.
Fish and people whose livelihoods (or part of them) depend on fishing were consistently identified through consultations with local stakeholders
Erosion/landslide and
sedimentation processes
Landslides are known to be problem in the region and have been identified by locals as a major concern.
Terrestrial habitats The Project is located next to Langtang National Park. Forests host most of the remaining natural habitats.
Issues related to impacts on wildlife and their habitats (e.g. fragmentation) were identified during stakeholder consultations.
Natural resources use Locals have expressed concern over land use changes and their related impacts (reduction of agricultural land, less productivity, general non-availability of land, etc.).
Harvesting/illegal harvesting of trees, degradation of forest, loss of forest products including NTFP (non-timber forest products) are other major concerns for local communities.
Cultural and religious sites The access and use to these sites is extremely valuable for local communities.
Cross-cultural Sensitivities – tentions and conflicts related to culture and traditions

ESSA Technologies Ltd.
2 2 |
4.1.2 Geographical and temporal boundaries
It has been suggested by many authors that the most effective way to approach cumulative impacts affecting fish and other aquatic values is to consider them at the “watershed” level, where the fundamental connection among all components of the landscape is the network of streams and associated water bodies that define the basin (Reid et al 1996; Williams et al. 1997; NRC 1999; Sedell et al. 1990, Newbold 2002; Smith et al. 2005; as cited in Potyondy and Geier 2011). The Trishuli basin is a transboundary watershed with a significant part of its river (120 km) in Chinese territory. However, considering the potential limitations in access to information and the difficulties of working with institutional, regulatory and environmental frameworks of two different countries, we proposed to set the spatial boundaries at the Nepalese part of the watershed. Temporal boundaries could be fixed taking into account the hydropower planning and project cycle characteristics in Nepal. Given the high volatility of current hydropower market in Nepal; a temporal limit of ten (10) years is considered adequate to frame the two hydropower development scenarios considered, and therefore the timeframe for the development of pressures. The temporal extent of the impacts is expected to be higher; from perpetuity for permanent impacts to the order of 100 – 150 years.
4.2 Scoping Phase II: Other activities and environmental and social stressors
The purpose of this step is to identify the totality of stresses that determine the condition of
VECs selected for this CIA. These stressors may include past developments whose impacts
persist, existing developments, predictable future developments, as well as any other
relevant natural or social stressor.
4.2.1 Other activities
The impacts of agriculture, forestry, and tourism are likely to affect the VECs in the watershed. However, the main activity that needs to be considered is hydropower development, which is rapidly growing in the basin. Agriculture is the main activity in terms of land use, followed by forestry. As part of the GIS
Mapping and Spatial Analysis task, we have analyzed the changes in forest and agricultural
land for the period 1990-2010. Forest cover has experienced a net decrease of 1.6%
throughout this period. Agricultural land increased by 3.1% in the same period. These slight
changes are in line with the observed land use change dynamics in the CHAL region, where
forest area has remained largely the same for the period 1990-2010 and agricultural land
has slightly increased. In the lower areas (Siwaliks) substantial loss of forest area has
occurred to infrastructure development, resettlement, urban expansion, and agriculture
expansions (WWF-Nepal 2013). Unplanned and unregulated construction of rural roads by
village development committees (VDCs) and district development committees (DDCs) is a
major direct cause of deforestation and forest degradation in the mid-hill districts.

APPENDIX D Cumulative Impact Assessment- Upper Trishuli-1 Hydropower Project
2 3 |
Figure 4-1: Changes in agricultural land (1990-2010) in the Trishuli watershed
Figure 4-2: Changes in forest land (1990-2010) in the Trishuli watershed

ESSA Technologies Ltd.
2 4 |
4.2.2 Environmental stressors
Natural environmental processes have significant impacts on a variety of environmental and
social components. Nepal is highly vulnerable to droughts, floods, earthquakes, landslides,
forest fires, storms and hailstorms, avalanches, glacial lake outburst floods, and the effects
of global warming (ADB and ICIMOD, 2006). The following sections discuss the information
available on the main natural hazards that could affect the state of VECs in the Trishuli
watershed.
Landslides
Landslides are the most important factor in land degradation in Nepal. Landslides occur
almost every year, particularly in the sloping areas of high mountains and low hills during
the monsoon season. Based on slope (> 45°) and land cover, areas with high landslide
potential were spatially identified in the Trishuli watershed (see Figure 4-3). The upper part
of the basin is especially affected by this problem.
Figure 4-3: Landslide risk in the Trishuli watershed
Both natural (e.g. high relief or steep slopes, unstable geology, and concentrated rainfall)
and human factors (deforestation, improper land use and construction, and agricultural
activities on hill slopes) can induce landslides. The consequences of landslides include

APPENDIX D Cumulative Impact Assessment- Upper Trishuli-1 Hydropower Project
2 5 |
topsoil erosion; damaged and destroyed roads, trails, and bridges; loss of land, lives, and
property; and siltation in low-lying areas resulting in unproductive land. About 1.8 million ha
(13%) of the land in the Mountains is estimated to be severely degraded by landslides (ADB
and ICIMOD, 2006).
Forest fires
Forest fires are common in Nepal during the spring season, particularly during the period
from March to May, coinciding with the end of the dry period. A recent record (2003-2011)
of forest fires shows a high concentration of these events in the upper part of the Trishuli
watershed, in proximity to the UT-1 Project (Figure 4-4). It is suspected that most of these
fire events have an anthropogenic origin, probably linked to inadequate agricultural/forestry
practices, negligence, and extension of development into forest areas.
Figure 4-4: Incidence of forest fires (2003-2011) in the Trishuli watershed
Beside the loss of habitat and forest biodiversity, forest fires can also cause soil erosion and
induce floods and landslides due to the destruction of the natural vegetation.

ESSA Technologies Ltd.
2 6 |
Climate change
The International Center for Integrated Mountain Development (ICIMOD 2007) has reported
that warming in Nepal has increased progressively within a range of 0.2-0.6 °C per decade
between 1951 and 2001, particularly during autumn and winter. These findings are in tune
with local people’s perceptions as recorded during the community level consultations. In
terms of changes to precipitation, similar analysis of long-term data for the same period did
not show a clear trend of change in average annual precipitation.
Evaluating the impacts in water resources is challenging because water availability, quality
and stream flow are sensitive to both changes in temperature and precipitation. Some
studies (Bajracharya et al. 2011) have looked at trends for flows in the Trishuli basin over
the last decades. Figure 4-5 shows the annual maximum, mean and minim flow at the
intake site, calculated using the 44-year daily flow series from Betrabati station and
correcting for the differences in catchment area.
Figure 4-5: Flow trends at the intake site
Overall, it seems that mean flow during the dry season is decreasing at a very slow rate,
whereas there is no clear trend for mean annual flows. An increasing trend for maximum
flows, with high variability, has also been observed. This reflects that the glacier contribution
at the dry season is becoming less over time while the rain contribution during the wet
season is not uniform.
In particular, greater unreliability of dry season flows poses potentially serious risks to water
supplies in the lean season. Hydroelectric plants are highly dependent on predictable runoff
APPENDIX D Cumulative Impact Assessment- Upper Trishuli-1 Hydropower Project
2 7 |
patterns. Therefore, increased climate variability, which can affect frequency and intensity of
flooding and droughts, could affect Nepal severely in hydroelectric production.
In terms of changes to glacier cover, the overall glacier area of Nepal has reduced by 20%
from 3.6% to 2.9% of total land of Nepal from 1970 to 2008 (Bajracharya et al., 2011). The
inventory of 2010 shows that the number of glaciers in Nepal has increased by about 17%
compared to 2001 inventory. This process of fragmentation was accompanied by a
reduction in the total glacier area of 15 km2 and of 4.7 km
3 in the volume of ice reserve.
Particularly in the Langtang sub-basin, during the period 1977 to 2009 the glacier area has
been reduced by 26% (Bajracharya et al. 2011).
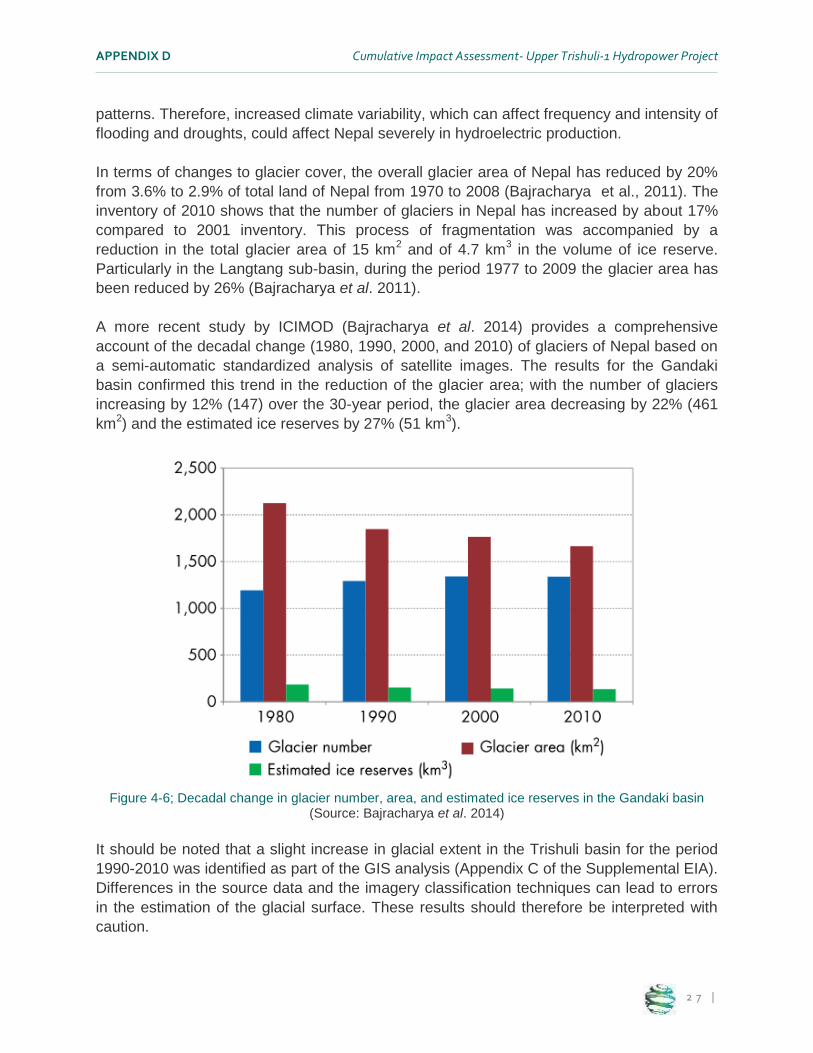
A more recent study by ICIMOD (Bajracharya et al. 2014) provides a comprehensive
account of the decadal change (1980, 1990, 2000, and 2010) of glaciers of Nepal based on
a semi-automatic standardized analysis of satellite images. The results for the Gandaki
basin confirmed this trend in the reduction of the glacier area; with the number of glaciers
increasing by 12% (147) over the 30-year period, the glacier area decreasing by 22% (461
km2) and the estimated ice reserves by 27% (51 km
3).
Figure 4-6; Decadal change in glacier number, area, and estimated ice reserves in the Gandaki basin
(Source: Bajracharya et al. 2014)
It should be noted that a slight increase in glacial extent in the Trishuli basin for the period
1990-2010 was identified as part of the GIS analysis (Appendix C of the Supplemental EIA).
Differences in the source data and the imagery classification techniques can lead to errors
in the estimation of the glacial surface. These results should therefore be interpreted with
caution.

ESSA Technologies Ltd.
2 8 |
At a smaller scale, a detailed case study in the Langtang Valley, within the Trishuli
watershed, shows clear evidence of a progressive reduction of the glacier area
(Bajracharya et al. 2014). The total glacier area decreased from 191 to 142 km2 (26%) in
Langtang valley. During this period, the average annual mean temperature increased by
0.12°C/year at the Langtang station. The temperature rise is considered to be the primary
factor responsible for glacier retreat.
It is increasingly being observed that biological systems are being disrupted, migrations are
starting earlier and species' geographic ranges are shifting towards the higher altitudes.
However, in general, there is a need for a comprehensive study to fully assess the impacts
and severity of climate change impacts on different ecosystems, key species, hydrological
systems and people in different physiographic zones of Nepal (Sharma 2013).
Glacial lake outburst floods (GLOFs)
As a consequence of climate change, glacier thinning and retreat in the Himalayas has
resulted in the formation of new glacial lakes and the enlargement of existing ones due to
the accumulation of meltwater behind loosely consolidated end moraine deposits (ICIMOD
2011). These lakes are inherently unstable and can lead to sudden discharges known as a
glacial lake outburst flood (GLOF).
Glacial recession can be associated with the formation and expansion of glacial lakes below
the retreating terminus, with the associated risk of a glacial lake outburst flood (GLOF);
continued recession may lead to an increase in the number of glacial lakes and in the
frequency of GLOF events (Bajracharya et al. 2014).
A GLOF risk assessment recently conducted by ICIMOD (2011) reported two historic GLOF
events (August 1964 and June 1995) for the Trishuli watershed that originated in the Tibet
Autonomous Region of China. Large debris flows were experienced in Nepal as a
consequence of these events. On average, one GLOF event is recorded every three to ten
years in the Himalayan region. The study identified that the six glacial lakes in the
watershed (Nepali part of the basin) and none of them was classified under GLOF risk.
However, because of the proximity of these glacial lakes to the Project (e.g. the Langtang
glacier is located 37 km from the head works), and the processes of glacier retreat
discussed in the previous section that could lead to an increase in GLOF risk, this is an
important natural risk in the region that should be monitored, along with other occurring
natural risks and hazards (e.g. landslides).

APPENDIX D Cumulative Impact Assessment- Upper Trishuli-1 Hydropower Project
2 9 |
5 Assessment on Cumulative Impacts on Selected VECs
5.1 Development Scenarios
Hydropower development depends on a number of factors, including the local and regional
socio-economic conditions. Although clearly a fast-growing sector in the Trishuli basin, there
is a certain degree of uncertainty as to the number of projects that will be finally
implemented in the watershed. Considering this uncertain context, we opted for analyzing
the potential cumulative impacts in the Trishuli watershed under two potential hydropower
development scenarios:
5.1.1 Scenario 1: Moderate hydropower development
This scenario (Figure 5-1) assumes that all the projects with a construction license will
materialize and become operative. Under this scenario, a total of 14 projects would be
operating in the watershed. The total area under the concession areas of these projects
would be 226 km2.
Figure 5-1: Scenario 1 (moderate hydropower development)

ESSA Technologies Ltd.
3 0 |
5.1.2 Scenario 2: High hydropower development
This scenario (Figure 5-2) assumes that all the projects with a construction license, plus all
the projects currently under planning, will materialize and become operative. Under this
scenario, a total of 33 projects would be operating in the watershed. The total area under
the concession areas of these projects would be 506 km2. In terms of likelihood, this
scenario is considered less likely.
Figure 5-2: Scenario 2 (high hydropower development)
Considering that all hydropower projects in the Trishuli basin will follow a similar scheme
than the UT-1 Project (run-of-river type of generation with a flow-reduced river section
between the intake and the powerhouse site), we have adopted the hydropower concession
area (Figure 5-3) as a proxy for the area of influence for each project.
Although the particular footprint of the different facilities and activities associated to each
project (i.e. reservoirs, water channels or tunnels, weirs, access roads, etc.) is unknown, it
can be assumed that most of the activities will take place within the borders of the
concession area and it is within this rectangle (Figure 5-3) that most of the impacts will
concentrate.

APPENDIX D Cumulative Impact Assessment- Upper Trishuli-1 Hydropower Project
3 1 |
Figure 5-3: Concession area for the UT-1 Project (Source: Daelim Kyerong 2013)
5.2 Structure of the Assessment
For each selected VEC, we have first identified the main potential impacts through the use
of impact hypothesis approach; a simple diagrammatic representation of a cause-effect
relationship between two related states or actions that illustrates an impact model. ESSA
has been successfully applying the impact hypothesis approach for the analysis of fisheries
and water resources issues for more than 30 years of (Connors et al. 2014, Greig et al.
1992)
The impact pathways included in these models are based on our understanding of the usual
impacts of hydropower projects, the baseline information on the selected VECs, and the
feedback provided by consultations with the local stakeholders (Annex B).
Based on the anticipated impacts according to these impacts models we have identified a
number of pressure or risk indicators (Table 2) to assess the future VEC condition under
each scenario. The selected indicators can be defined as relatively simple quantifiable or
qualitative measures of the condition or dynamics of broader, more complex (and generally
difficult to assess) attributes of the ecosystem or watershed state. Indicators act as
surrogates for the underlying ecological processes that maintain watershed functionality and
condition (Potyondy and Geier 2011). As simple surrogates for complex ecological
processes watershed habitat indicators are unlikely to accurately represent direct cause-
and-effect relationships but act as estimates for the pressures or risks acting on the VECs.

ESSA Technologies Ltd.
3 2 |
Table 5-1: Proposed indicators for the assessment of cumulative impacts on selected VECs
VECs Pressure/risk indicator (metric)
En
vir
on
men
tal
Water quantity and quality
River under reduced flow (percentage of river length within concession areas)
Competition with other users (number and percentage of settlements within concession areas)
Fish and aquatic habitats
River under reduced flow (percentage of river length within concession areas)
Barriers for fish movement (number of weirs/barriers along the river network)
Stream cross density (number of stream crossings per km2 of
concession area)
Erosion and sedimentation
processes
Risk of landslide (percentage and area of high slide potential sites within concession areas)
Road density (km of road per km2 of concession areas)
Road density in proximity of streams (km of road within 100 m of stream per km
2 of concession areas)
Road density on unstable slopes (km of road on slope >45° per km
2 of concession areas)
Terrestrial habitats
Proximity to protected areas (percentage of protected areas within concession areas)
Pressure on forest land (percentage of forest land within the concession areas)
So
cio
-eco
no
mic
Use of natural resources
Pressure on forest use (percentage of forest land within the concession areas)
Pressure on agricultural land (percentage of agricultural land within the concession areas)
Cultural and religious sites
Pressure on water-consumptive cultural uses (number of cremation sites within the concession areas)
Interference with access and use of cultural sites (number of cultural sites per km
2 of concession area)
Within a pressure-state response (PSR) framework (Bertram and Stadler-Salt 2000,
Ironside 2003, Newton 2007), two types of habitat indicators (“pressure” and “state”) are
typically developed to inform two scales of decision making and management action:
regional and local scales. Pressure (aka stressor) indicators (e.g. road density, land cover
alteration, etc.) in this case are intended to provide information on the relative degree of
potential stress on VECs and act as a proxy for cumulative impacts.
APPENDIX D Cumulative Impact Assessment- Upper Trishuli-1 Hydropower Project
3 3 |
State indicators (generally more difficult and more expensive to obtain) describe habitat
condition at a much more localized scale and are intended for more focused monitoring in
areas where initial broad assessment of pressure indicators has identified a higher risk of
potential problems.
Based on the GIS information at the watershed level that was generated as part of the GIS
Mapping and Spatial Analysis task under Phase II, and the level of effort, we have selected
a set of spatial indicators of pressure or risk to evaluate the potential future condition of the
selected VECs under the two hydropower development scenarios. Appendix C includes the
maps of the spatial indicators used in this assessment.
Finally, for the evaluation of the significance of the cumulative impacts, we have taken into
consideration the magnitude at the watershed scale of the particular impact, the contribution
of UT-1 Project, and the foreseen mitigation measures that would act on the affected VEC
and counteract the effects of the cumulative impacts.
5.3 Water resources (quantity, quality and water users)
5.3.1 Baseline status
Water quantity
The Trishuli is a glacier-rainfall fed river typical of the mountainous region of Nepal. The
basin receives 80% of the annual rainfall (2000-2500 mm) during the monsoon period, from
June to September. During this time, erosion and sediment transport rates are at their
highest (Jade Consult 2011). Flow is derived from a mixture of seasonal monsoon
precipitation and melted water from the glaciers at higher elevations. Figure 5-4 shows the
characteristic mean year hydrograph at the Betrabati station (44-year series), located 20 km
downstream from the Project.
Besides Betrabati, there are other hydrological stations in some of the Trishuli tributaries:
Tadi Khola, Budhi Gandaki. All these stations are managed by the Department Of
Hydrology and Meteorology of the Ministry of Science, Technology & Environment2.
2 http://www.dhm.gov.np/hydrological-station

ESSA Technologies Ltd.
3 4 |
Figure 5-4: Characteristic hydrograph at the Betrabati hydrological station (period 1967-2010)
Water quality
In terms of water quality, the watersheds of the hills and mountain regions, under pre-
impoundment conditions, are in general well-oxygenated, unpolluted, and suitable for cold
fish (Gubhaju 2002), due to the sparse population and the lack of industries in the region.
There are no permanent water quality stations in the Trishuli watershed although occasional
sampling has occurred for the EIA studies of the hydropower projects. In general, the
observed parameters are within WHO guidelines. Turbidity and sediment concentration do
experience seasonal variation and increase significantly during the monsoon period.
A recent one-year aquatic survey conducted for this Supplemental ESIA (see Appendix B)
suggests that the water quality in the project area is overall good and anthropogenic
impacts have been limited so far. Events of reduced quality for physical (e.g. suspended
solids) and chemical/microbiological parameters (e.g. organic contamination) happen yearly
during the monsoon season due to the increased run-off.
Water uses
At the national level, it is estimated (WECS 2011) that Nepal has 225 billion m3 per annum
of surface water available and only about 7% of this water is in use. An increase in total
annual withdrawal was detected for the period 1995-2001 (ADB and ICIMOD, 2006).
Agriculture used about 96% of the total withdrawal in 2001, mostly for irrigation. Over the
last few decades, the population has grown at a rate of over 2% per annum. The area of
agricultural land has also increased (ADB and ICIMOD, 2006), demanding additional
irrigation water. Natural factors such as landslides and floods have also put pressure on
0
100
200
300
400
500
600
700
Jan. Feb. Mar. Apr. May Jun. Jul. Aug. Sep. Oct. Nov. Dec.
Mean monthly
flow (m3/s)

APPENDIX D Cumulative Impact Assessment- Upper Trishuli-1 Hydropower Project
3 5 |
water resources by damaging reservoirs and irrigation canals. The pressure on water
resources is more intense on large towns and cities due to rapid urbanization.
The total cultivated area is 20% of the area of the country as a whole; the Terai has the
largest proportion of cultivated area with 40% and Mountains the least with 5%. The Terai
also has the highest proportion of irrigated area (50%) relative to its cultivated area and
Mountains the lowest with 8%. More than 50% of the irrigated area is by seasonal canal.
At the district (Rasuwa) level, the surveys for the complementary social baseline (Appendix
A) found that nearly 88% of the households are supplied with tap/piped water at the
community level, while the rest of the households depend on springs and rivers nearby the
settlement. Even the water supplied with pipe at community level is not treated and had a
risk of water pollution in the dry as well as in the wet monsoon season.
As for the water and river use in the watershed, although we do not have figures of water
demand at this stage, it is expected that the main consumptive uses in the basin will be for
agriculture and domestic uses. Cultural and spiritual uses (e.g. cremation) have been
reported for the upper part of the watershed, as well as other small-scale industrial uses for
local mills (ghatta). Fishing is also practiced by communities in the upper part to
complement the diet. The extent of these fishing practices and the existence of commercial
(aquaculture) at the watershed scale are to be determined.
As part of the complementary environmental survey, NESS identified a number of river
users along the diversion reach of the Upper Trishuli-1, which has a total length of 11 km.
Although there are no engineered water supply intakes, local communities do use water
from the Trishuli river, especially during the dry season. There are two water mills (ghatta)
within the diversion reach and an area of irrigated agriculture.
In terms of river/water users in the Project area, NESS has recently (August 2013)
conducted a river users inventory as part of the complementary environmental and social
baseline, and identified a number of river and water uses along the 11 km diversion reach of
the Upper Trishuli-1. These uses are concentrated on the lower part of the diversion reach
(see Figure 5.5 for approximate locations) and include: (i) two traditional watermills (ghatta)
which are used throughout the year for grain grinding and are supplied with water from the
Trishuli by earthen canals; (ii) an area of irrigated agricultural land of approximately 0.2
hectares where rice is grown during the monsoon season; (iii) a stretch of the river used by
inhabitants of Gunchet settlement for domestic purposes (drinking, bathing, etc.) during the
dry season; and (iv) non-commercial fishing is practiced, particularly during the fish
migration periods of the monsoon season, by local fishermen in the lower part of the
diversion reach and around the powerhouse area.

ESSA Technologies Ltd.
3 6 |
Figure 5-5: River uses in the diversion reach of the Project
As for other river uses in the diversion reach, it should be noted that rafting is not practiced
in the area, due to the difficult access and rugged topography, and no cremation or other
ritual sites were identified during the survey for water users. Local communities in the
Project area are predominantly non-Hindu and the only known ritual use of the Trishuli
takes place in Betrawati, about 14 km downstream of the powerhouse.
Baseline surveys (NESS 2013) have also found that fishing is practiced for non-commercial,
livelihood-complementary purposes in a stretch of the river upstream of the tailrace. The
usual method for fishing is setting traps during the monsoon period when fish migration
takes place.
5.3.2 Cumulative Impact Assessment
The construction and operation of the hydropower projects foreseen for Scenarios 1
(moderate development) and 2 (high development) would create a highly regulated system
of cascading projects in the Trishuli River that will alter the natural flow regime, the
sediment dynamics, and, likely, water quality parameters. The different run-of-river projects
under the two scenarios will create several stretches of the river with reduced flow (the
minimum environmental flow required by Nepali regulations is 10% of mean minimum
monthly flow). The timing as well as the allocation of water flow will be modified.

APPENDIX D Cumulative Impact Assessment- Upper Trishuli-1 Hydropower Project
3 7 |
The creation of flow-reduced sections between the intake site and the powerhouse will
result in the local reduction of water availability, especially during the dry period. Figure 22
shows the mean hydrograph at the intake site for pre-operational and operational scenarios.
Under operations, a minimum flow of 10% of the mean monthly flow will release in the
diversion reach. The maximum diversion capacity of the facility is 76 m3/s; a value that is
highly exceeded during the monsoon flows.
Figure 5-6: Hydrographs at the UT-1 Project intake site for pre-operational and operational conditions
Upper reaches of the reservoir may not be affected very much as the original riverine
conditions are still retained in most Nepali reservoirs, because of their general reduced size,
as run-of-river type, compared to storage reservoirs. Downstream of the dam the flow rate
in the river will depend on the amount of the compensation flow. Water volume is
considerably reduced during the dry season. As a result the downstream may change to
pools alternating with dry stretches for about nine months from November to June.
Reduced flows in the dewatered sections will have impacts on water quality. The diversion
reach likely be warmer, dissolved oxygen reduced, and any pollutants, microbiological
contamination, as well as suspended solids may be present at higher concentrations. This
will be aggravated if water is extracted for human consumptive uses from any of the
dewatered segments, or if they are subjected to domestic wastewater discharges.
Changes in quantity and timing of flows could affect other water users, especially those
located along the diversion reach. It should also be noted, that changes in flow are also
subject to the effects of climate change. Figure 5-7 shows the proposed impact model
representing these effects.
.
0
100
200
300
400
500
600
Unimpaired flow
Operational flow
Mean monthly flow (m3/s)

ESSA Technologies Ltd.
3 8 |
Figure 5-7: Impacts model diagram for VEC ‘Water resources’
Based on the expected impacts and the available information for these VECs, we have
selected two indicators that can inform on the future pressure on water resources in the
Trishuli watershed under the two hydropower development scenarios (the results of these
indicators for both scenarios are shown in Table 6):
River under reduced-flow: This indicator estimates the length of channel to which
flows are reduced as the distance between locations of water withdrawal (from the
reservoir) and return to the natural river system (at the tailrace leaving the penstock).
Presence of settlements within concession areas: This indicator is a proxy for the
presence of other users within the concession areas. It does not measure actual
water consumption/withdrawal from the Trishuli River, but high settlement densities
(more population) would indicate higher level of pressure on water resources, both
from consumption or interference with non-consumptive uses (e.g. recreational,
cultural, etc.) and from potential impacts on water quality (i.e. more densely
populated areas will generate higher volumes of wastewater).
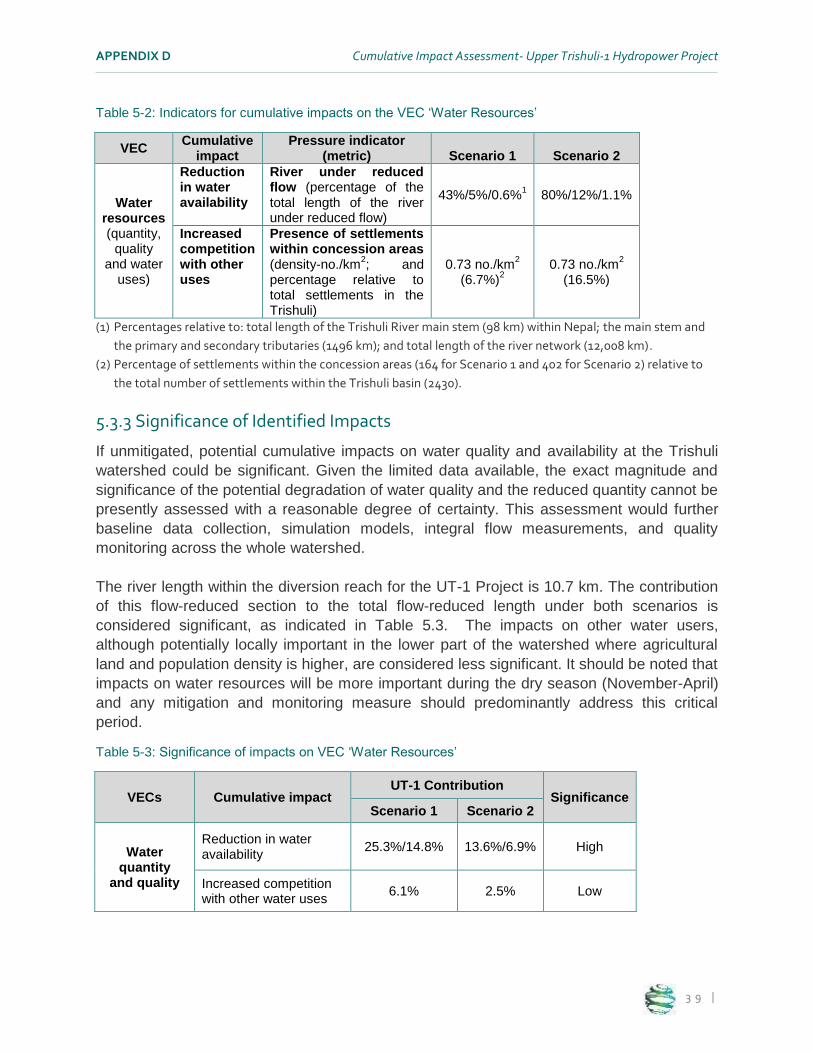
APPENDIX D Cumulative Impact Assessment- Upper Trishuli-1 Hydropower Project
3 9 |
Table 5-2: Indicators for cumulative impacts on the VEC ‘Water Resources’
VEC Cumulative
impact Pressure indicator
(metric) Scenario 1 Scenario 2
Water resources (quantity,
quality and water
uses)
Reduction in water availability
River under reduced flow (percentage of the total length of the river under reduced flow)
43%/5%/0.6%1
80%/12%/1.1%
Increased competition with other uses
Presence of settlements within concession areas (density-no./km
2; and
percentage relative to total settlements in the Trishuli)
0.73 no./km2
(6.7%)2
0.73 no./km2
(16.5%)
(1) Percentages relative to: total length of the Trishuli River main stem (98 km) within Nepal; the main stem and
the primary and secondary tributaries (1496 km); and total length of the river network (12,008 km).
(2) Percentage of settlements within the concession areas (164 for Scenario 1 and 402 for Scenario 2) relative to
the total number of settlements within the Trishuli basin (2430).
5.3.3 Significance of Identified Impacts
If unmitigated, potential cumulative impacts on water quality and availability at the Trishuli
watershed could be significant. Given the limited data available, the exact magnitude and
significance of the potential degradation of water quality and the reduced quantity cannot be
presently assessed with a reasonable degree of certainty. This assessment would further
baseline data collection, simulation models, integral flow measurements, and quality
monitoring across the whole watershed.
The river length within the diversion reach for the UT-1 Project is 10.7 km. The contribution
of this flow-reduced section to the total flow-reduced length under both scenarios is
considered significant, as indicated in Table 5.3. The impacts on other water users,
although potentially locally important in the lower part of the watershed where agricultural
land and population density is higher, are considered less significant. It should be noted that
impacts on water resources will be more important during the dry season (November-April)
and any mitigation and monitoring measure should predominantly address this critical
period.
Table 5-3: Significance of impacts on VEC ‘Water Resources’
VECs Cumulative impact UT-1 Contribution
Significance Scenario 1 Scenario 2
Water quantity
and quality
Reduction in water availability
25.3%/14.8% 13.6%/6.9% High
Increased competition with other water uses
6.1% 2.5% Low

ESSA Technologies Ltd.
4 0 |
5.4 Fish and aquatic habitats
5.4.1 Baseline status
Among the five larger basins of the Gandaki River, the Trishuli River basin has the highest
species diversity with historical surveys recording 47 species. At higher elevations a subset
of 19 species has been recorded within the Upper Trishuli basin (DOFD 2008), with species
presence declining with increasing elevation and at smaller sampling locations. For
example, only two species have been recorded as part of the UT-1 project (Jade Consult
2011, NESS 2013); of which one species (Schizothorax richardsonii) is listed by the IUCN
as Vulnerable.
It is believed that fish assemblages in the tributaries of the Gandaki would follow an
altitudinal distribution of fish assemblages along the river profile based on their ecological
preferences, as observed in the Bagmati River (Shresta 2002): Snow trout zone (1875 m -
3125 m), dominated by Schizothorax plagiostomus and S.spp; Stone carp zone (1250 m -
1875 m) dominated by Stone carp (Psilorhynchus pseudecheneis), stone roller (Garra
gotyla), loach (Noemacheilus spp) and sucker catfish (Glyptothorax spp); and Hill barbel
zone (625 m - 1250 m) dominated by mahseer (Tor tor, T. putitora) and kabre
(Neolissocheilus hexagonolepis).
The limnological and biological study
conducted by Directorate of Fisheries
Development (DOFD 2008) in 2006-2007
found that S. richardsonii is the dominant fish
species in the upper part of the Trishuli
watershed, in the Rasuwa and Nuwakot
districts. It contributed to 75% of the total catch
at the five sampling locations that were
surveyed for this study.
This study also found that S. richardsonii
breeds twice per year: in autumn
(September/October) and spring (March/April),
with the fall spawning suspected to be the
most important. This species prefers rapids, pools and riffle types of habitat. These findings
are in line the results of the monthly fish surveys that NESS is conducting as part of the
complementary environmental baseline.
Higher concern is often expressed for migratory species which may be particularly sensitive
to river barriers. As noted above, S. richardsonii has been recorded at the UT-1 site (with
egg-bearing females recently observed, NESS 2013) and is of special interest both because
Figure 5-8: S. richardsonii specimen carrying eggs (Source: NESS, September 2013)
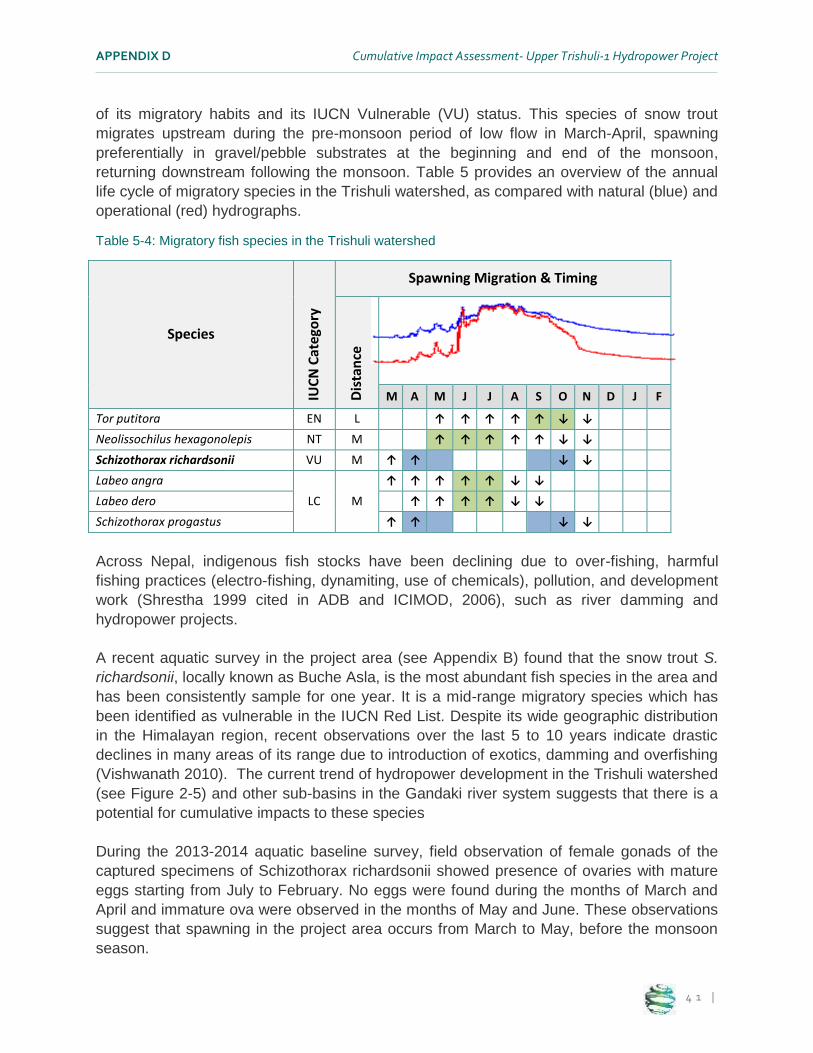
APPENDIX D Cumulative Impact Assessment- Upper Trishuli-1 Hydropower Project
4 1 |
of its migratory habits and its IUCN Vulnerable (VU) status. This species of snow trout
migrates upstream during the pre-monsoon period of low flow in March-April, spawning
preferentially in gravel/pebble substrates at the beginning and end of the monsoon,
returning downstream following the monsoon. Table 5 provides an overview of the annual
life cycle of migratory species in the Trishuli watershed, as compared with natural (blue) and
operational (red) hydrographs.
Table 5-4: Migratory fish species in the Trishuli watershed
Species
IUC
N C
ate
gory
Spawning Migration & Timing
Dis
tan
ce
M A M J J A S O N D J F
Tor putitora EN L ↑ ↑ ↑ ↑ ↑ ↓ ↓
Neolissochilus hexagonolepis NT M ↑ ↑ ↑ ↑ ↑ ↓ ↓
Schizothorax richardsonii VU M ↑ ↑ ↓ ↓
Labeo angra
LC M
↑ ↑ ↑ ↑ ↑ ↓ ↓
Labeo dero ↑ ↑ ↑ ↑ ↓ ↓
Schizothorax progastus ↑ ↑ ↓ ↓
Across Nepal, indigenous fish stocks have been declining due to over-fishing, harmful
fishing practices (electro-fishing, dynamiting, use of chemicals), pollution, and development
work (Shrestha 1999 cited in ADB and ICIMOD, 2006), such as river damming and
hydropower projects.
A recent aquatic survey in the project area (see Appendix B) found that the snow trout S.
richardsonii, locally known as Buche Asla, is the most abundant fish species in the area and
has been consistently sample for one year. It is a mid-range migratory species which has
been identified as vulnerable in the IUCN Red List. Despite its wide geographic distribution
in the Himalayan region, recent observations over the last 5 to 10 years indicate drastic
declines in many areas of its range due to introduction of exotics, damming and overfishing
(Vishwanath 2010). The current trend of hydropower development in the Trishuli watershed
(see Figure 2-5) and other sub-basins in the Gandaki river system suggests that there is a
potential for cumulative impacts to these species
During the 2013-2014 aquatic baseline survey, field observation of female gonads of the
captured specimens of Schizothorax richardsonii showed presence of ovaries with mature
eggs starting from July to February. No eggs were found during the months of March and
April and immature ova were observed in the months of May and June. These observations
suggest that spawning in the project area occurs from March to May, before the monsoon
season.

ESSA Technologies Ltd.
4 2 |
5.4.2 Cumulative Impact Assessment
As pointed out in a recent report by WWF-Nepal (2013), hydropower development is one of
the main threats to freshwater biodiversity in the CHAL region. The construction of multiple
hydropower facilities in the Trishuli watershed is likely to result in the fragmentation of
aquatic ecosystems through two processes (Anderson et al. 2008): (i) the presence of dams
acting as physical barriers to the longitudinal movement of water, matter and organisms;
and (ii) the creation of a series of flow-reduced river section between the intake sites and
the powerhouses. These flow-reduced section or diversion reaches are characterized by
slower water velocities, warmer water temperatures, and shallower habitats than the
adjacent upstream and downstream areas. Figure 5.9 represents the impact model for this
VEC.
Figure 5-9: Impacts model diagram for VEC ‘Fish and aquatic habitats’
This fragmentation will interfere with the upstream and downstream fish migration as well as
with lateral in-stream movements in-and-out of the riverbanks. In the case of the Trishuli
watershed, long distant migrants such as Tor sp., Bagarius, Pseudeutropius, Clupisoma
and Anguilla, and mid-distance migrants N. hexagonolepis and Labeo species would be the
most affected by hydropower development. It is expected that populations of snow trout (S.
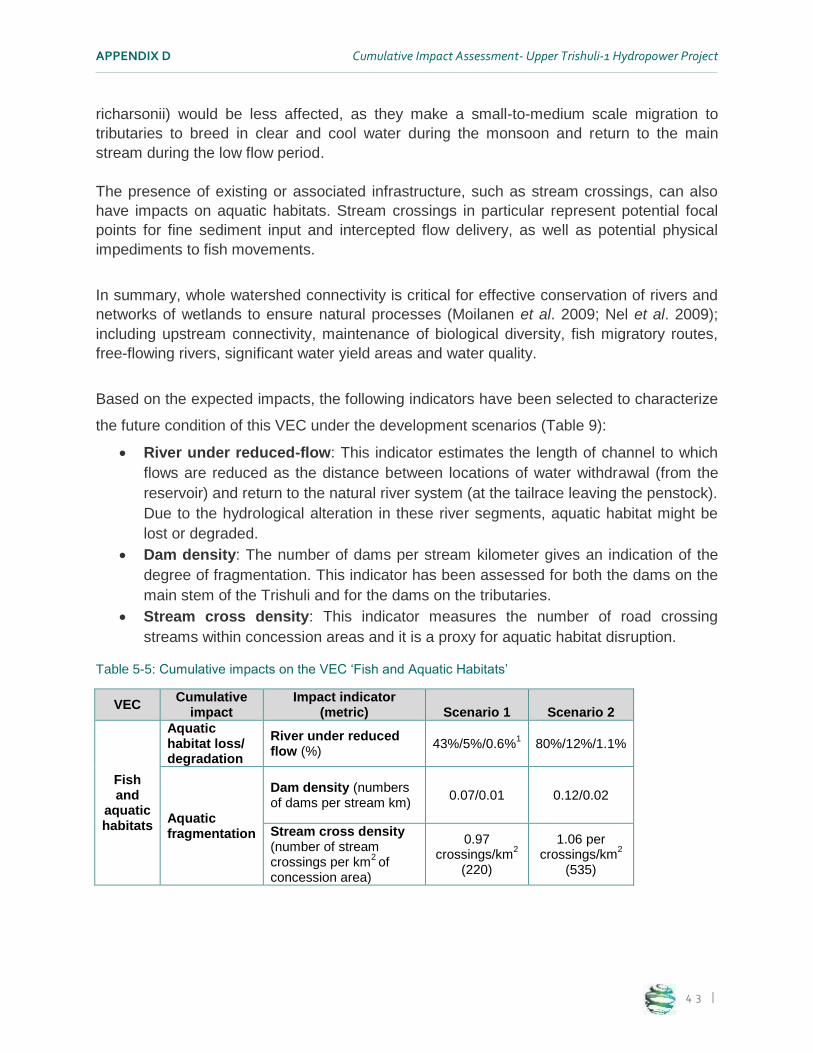
APPENDIX D Cumulative Impact Assessment- Upper Trishuli-1 Hydropower Project
4 3 |
richarsonii) would be less affected, as they make a small-to-medium scale migration to
tributaries to breed in clear and cool water during the monsoon and return to the main
stream during the low flow period.
The presence of existing or associated infrastructure, such as stream crossings, can also
have impacts on aquatic habitats. Stream crossings in particular represent potential focal
points for fine sediment input and intercepted flow delivery, as well as potential physical
impediments to fish movements.
In summary, whole watershed connectivity is critical for effective conservation of rivers and
networks of wetlands to ensure natural processes (Moilanen et al. 2009; Nel et al. 2009);
including upstream connectivity, maintenance of biological diversity, fish migratory routes,
free-flowing rivers, significant water yield areas and water quality.
Based on the expected impacts, the following indicators have been selected to characterize
the future condition of this VEC under the development scenarios (Table 9):
River under reduced-flow: This indicator estimates the length of channel to which
flows are reduced as the distance between locations of water withdrawal (from the
reservoir) and return to the natural river system (at the tailrace leaving the penstock).
Due to the hydrological alteration in these river segments, aquatic habitat might be
lost or degraded.
Dam density: The number of dams per stream kilometer gives an indication of the
degree of fragmentation. This indicator has been assessed for both the dams on the
main stem of the Trishuli and for the dams on the tributaries.
Stream cross density: This indicator measures the number of road crossing
streams within concession areas and it is a proxy for aquatic habitat disruption.
Table 5-5: Cumulative impacts on the VEC ‘Fish and Aquatic Habitats’
VEC Cumulative
impact Impact indicator
(metric) Scenario 1 Scenario 2
Fish and
aquatic habitats
Aquatic habitat loss/ degradation
River under reduced flow (%)
43%/5%/0.6%1
80%/12%/1.1%
Aquatic fragmentation
Dam density (numbers of dams per stream km)
0.07/0.01 0.12/0.02
Stream cross density (number of stream crossings per km
2 of
concession area)
0.97 crossings/km
2
(220)
1.06 per crossings/km
2
(535)

ESSA Technologies Ltd.
4 4 |
5.4.3 Significance of Identified Impacts
The disturbance of aquatic habitats under the two hydropower scenarios is expected to be
significant. A significant portion (43% for Scenario 1 and 80% for Scenario 2) of the Trishuli
River will be under reduced flow in both scenarios; and this is likely to cause significant
impacts on aquatic habitats for fish species in the Trishuli. The density of crossings within
the concession areas is already high (Fiera, 2012, used a value of 0.6 crossings/km2
to
represent a “high pressure” on aquatic biodiversity) and will increase as the construction of
associated facilities of the hydropower projects (e.g. access roads) progresses.
Table 5-6: Significance of impacts on the VEC ‘Fish and Aquatic Habitats’
VECs Cumulative impact UT-1 Contribution
Significance Scenario 1 Scenario 2
Fish and aquatic habitats
Aquatic habitat loss/degradation
25.3%/14.8% 13.6%/6.9% High
Aquatic habitat fragmentation
0.6 crossings/km2 High
In terms of potential mitigation of the barrier effect of dams and weirs, it should be noted
that most of the existing and proposed water development projects in Nepal do not have
fish ladders. There are only few examples of fish ladders (e.g., Koshi barrage, Chandra
Nahar in Trijuga, Andhi Khola and Gandak barrage) and very little is known about their
performance.
5.5 Erosion and sedimentation processes
5.5.1 Baseline status
Soil erosion is one of the most serious environmental issues in the steep and fragile hill
slopes of Nepal. The main reasons for soil erosion in the region include (Higaki et al. 2005):
expansion of agriculture and grazing into marginal steep lands, deforestation and
unsustainable forest management, and construction of infrastructure (e.g. rural roads). The
Department of Soil Conservation and Watershed Management (DSCWM) has conducted
some soil conservation activities in the watershed, including the testing of different soil
conservation practices on the slopes of the Tadi Khola, atributary to the Trishuli River
(Higaki et al. 2005). At that particular site at the Tadi Khola, erosion rates and rainfall were
measured through a period of four years (1994-1999) and it was observed that the highest
erosion rates occurred during the maximum rainfall events during the monsoon season.
Soil degradation and loss of productive land are serious environmental problems. With the
increasing population and growing need for food, agriculture is being expanded to sloping
lands and forests. The heavy monsoon rains make fragile mountain slopes vulnerable to

APPENDIX D Cumulative Impact Assessment- Upper Trishuli-1 Hydropower Project
4 5 |
loss and degradation of land and soil through landslides, erosion, and river cutting. As much
as 5% of all landslides in Nepal are associated with newly-constructed roads and trails
(ADB and ICIMOD, 2006). At the UT-1 project site, there are two active landslides.
As part of Phase I of the GIS Mapping and Spatial Analysis task (ESSA, November 2013),
we have identify sites with erosion/slide potential within the watershed (Figure 26) based on
the slope and land cover type. Thus, areas with a slope higher than 45° that intersect with
land cover classes susceptible to erosion (i.e. bare soil, agriculture, sand and cliff) were
identify as slide prone. The presence of these areas in proximity (within 1 km) to water
sources would indicate a high slide potential, whereas slide prone sites in drier areas were
classified as having a moderate slide potential. Figure 5-10 shows how, based on this
analysis, areas with slide/erosion potential concentrate on the upper part of the watersheds,
where slopes are steeper, or on the valley slopes in proximity to water courses. The total
area with slide potential (slope higher than 45°) in the Trishuli basin is 243 km2.
Figure 5-10: Slide/erosion potential in the Trishuli watershed
In terms of sedimentation, siltation was identified as one of the major problems for the
operating hydropower plant of Chilime (Bhatt and Khanal 2011), a 22-MW facility located
upstream from the proposed UT-1 Project.

ESSA Technologies Ltd.
4 6 |
5.5.2 Cumulative Impact Assessment
The construction of the hydropower projects and associated infrastructure (i.e. access roads
and transmission lines) implies earth works, clearing of vegetation in some areas and
activities along the banks of the river that can induce increased erosion, especially in
sensitive areas prone to landslides; a common situation in the upper part of the watershed.
In the run-of-river (RoR) projects the in-river sediment transport is not significantly affected
as these projects often flush sediments directly into the river downstream of the head-
works, as previous experience with other projects in Nepal shows.
Flow modification will have implications on river morphology and hydraulics/ sediment loads
and dispersion dynamics. Sand, gravel, and boulder deposition dynamics will likely change.
Debris flows are also likely to be modified. As stated above, Himalayan Rivers are
characterized by an ever changing dynamics in the riverbed and in the flood plain
morphology. This natural annual dynamics may be modified. Increased up-slope erosion
during the operation phase is likely to be significant because of the fragmentation of the
river’s natural morphology by the diversion structures and reduced sediment transport
capacity of the river for more than 6 months annually. In addition, daily flow fluctuations and
water pulses are also likely to modify the river geomorphology downstream from the
tailraces.
However, expected impacts on sediment dynamics and changes to channel-forming
processes are difficult to assess without a better understanding of the processes involved
and, possibly, a runoff-sedimentation modeling approach that would allow the simulation of
sediment transport along the Trishuli River taking into account the sediment inputs across
the watershed and the operating rules of the different hydropower facilities.

APPENDIX D Cumulative Impact Assessment- Upper Trishuli-1 Hydropower Project
4 7 |
Figure 5-11: Impact model diagram for VEC ‘Erosion and sedimentation processes’
Based on these impacts, we have selected the following indicators to assess the
pressure/risk on erosion and sedimentation processes (Table 5-7):
Risk of landslides: This indicator estimates the area of high slide potential sites
within concession areas. Construction on areas prone to landslides can trigger or
reactivate mass wasting movements.
Road densities: High road densities within a watershed indicate a greater risk to
magnified surface erosion and landslide risk, with associated increases in stream
turbidity and potential disruptions to aquatic functions. Roads situated in close
proximity to streams (<100m) can pose serious threats to stream channel stability.
Road construction and maintenance can be very disruptive to streams, with frequent
incidences of channel disturbance and point-source pollution.

ESSA Technologies Ltd.
4 8 |
Table 5-7: Cumulative impacts on the VEC ‘Erosion and Sedimentation Processes’
VEC Cumulative
impact Risk indicator (metric) Scenario 1 Scenario 2
Erosion and sedimentation
processes
Risk of landslides
Risk of landslides (% and area of high slide potential sites within concession areas)
6.7% (16.3 km
2)
11.13% (27.1 km
2)
Increased surface erosion
Road density (km of road per km
2 of concession
areas)
0.7 per km2
(151.8 km) 0.7 per km
2
(363.5 km)
Road density in proximity of streams (km of road within 100 m of stream per km
2 of
concession areas)
0.34 per km2
(77.6 km) 0.40 per km
2
(202.92 km)
Road density on unstable slopes (km of road on slope >45° per km
2 of concession areas)
0.007 per km
2 (7.6 km)
0.005 per km
2 (10.8
km)
5.5.3 Significance of identified impacts
Landslides are one of the main concerns expressed by stakeholder during consultations for
the Project, and it is likely that it will be a major risk in the upper part of the watershed. The
area with unstable slope within the UT-1 concession area is 5.78 km2. The risk of landslides
is therefore considered an impact of high significance. In terms of the other indicators used
in the analysis of this VEC; the total existing road length in UT-1 concession area is 8.3 km;
1.60 km out of this length is in proximity to streams and 0.3 km on unstable slopes. The
contribution of these figures, considered low, to the total road lengths within the concession
areas is shown in the table below:
Table 5-8: Significance of impacts on the VEC ‘Erosion and Sedimentation Processes’
VECs Cumulative impact UT-1 Contribution
Significance Scenario 1 Scenario 2
Erosion and sedimentation
processes
Risk of landslide 35% 21% High
Induced surface erosion
5%/2%/4%
2%/0.8%/3%
Low
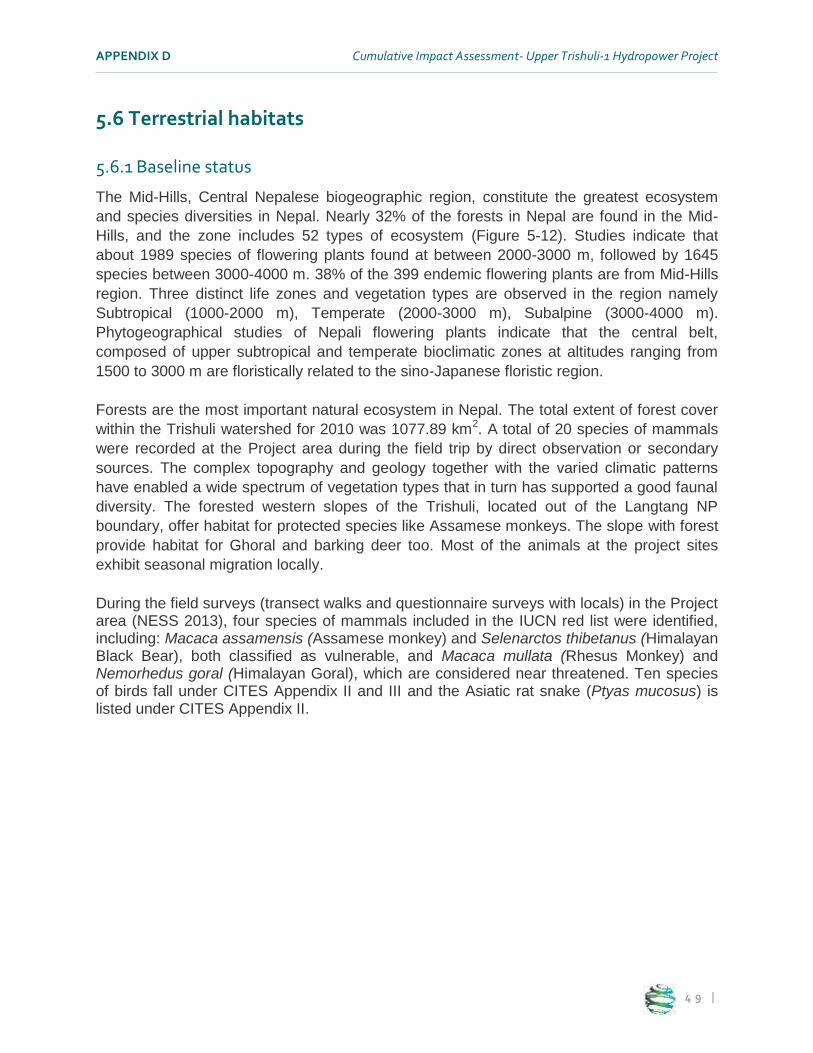
APPENDIX D Cumulative Impact Assessment- Upper Trishuli-1 Hydropower Project
4 9 |
5.6 Terrestrial habitats
5.6.1 Baseline status
The Mid-Hills, Central Nepalese biogeographic region, constitute the greatest ecosystem
and species diversities in Nepal. Nearly 32% of the forests in Nepal are found in the Mid-
Hills, and the zone includes 52 types of ecosystem (Figure 5-12). Studies indicate that
about 1989 species of flowering plants found at between 2000-3000 m, followed by 1645
species between 3000-4000 m. 38% of the 399 endemic flowering plants are from Mid-Hills
region. Three distinct life zones and vegetation types are observed in the region namely
Subtropical (1000-2000 m), Temperate (2000-3000 m), Subalpine (3000-4000 m).
Phytogeographical studies of Nepali flowering plants indicate that the central belt,
composed of upper subtropical and temperate bioclimatic zones at altitudes ranging from
1500 to 3000 m are floristically related to the sino-Japanese floristic region.
Forests are the most important natural ecosystem in Nepal. The total extent of forest cover
within the Trishuli watershed for 2010 was 1077.89 km2. A total of 20 species of mammals
were recorded at the Project area during the field trip by direct observation or secondary
sources. The complex topography and geology together with the varied climatic patterns
have enabled a wide spectrum of vegetation types that in turn has supported a good faunal
diversity. The forested western slopes of the Trishuli, located out of the Langtang NP
boundary, offer habitat for protected species like Assamese monkeys. The slope with forest
provide habitat for Ghoral and barking deer too. Most of the animals at the project sites
exhibit seasonal migration locally.
During the field surveys (transect walks and questionnaire surveys with locals) in the Project area (NESS 2013), four species of mammals included in the IUCN red list were identified, including: Macaca assamensis (Assamese monkey) and Selenarctos thibetanus (Himalayan Black Bear), both classified as vulnerable, and Macaca mullata (Rhesus Monkey) and Nemorhedus goral (Himalayan Goral), which are considered near threatened. Ten species of birds fall under CITES Appendix II and III and the Asiatic rat snake (Ptyas mucosus) is listed under CITES Appendix II.

ESSA Technologies Ltd.
5 0 |
Figure 5-12: Potential vegetation types in the Trishuli watershed
Figure 5-13: Assamese monkeys observed during
additional baseline studies (Source: NESS, September 2013)
Within the Trishuli watershed, the main biodiversity conservation feature is the Langtang
National Park, located in the northeast part of the basin. This is a large protected area that
includes much of the forest cover in the Rasuwa District. The length of the river affected by

APPENDIX D Cumulative Impact Assessment- Upper Trishuli-1 Hydropower Project
5 1 |
the UT-1 Project borders the Langtang Park. Although mostly undeveloped, the Langtang
National Park has been impacted by developments such as roads and transmission lines.
Currently under construction and future hydropower projects are located in proximity of this
park and could result in impacts in this protected area.
Figure 5-14: Protected areas within the Trishuli watershed
5.6.2 Cumulative impact assessment
The construction of the different hydropower projects will imply land conversion that could
potentially affect natural habitats, such as forests. Although the footprint of the run-of-river
projects is usually smaller than storage hydropower facilities, the multiple projects across
the watershed could add to forest fragmentation and induced deforestation due to improved
access to previously remote areas, as represented in Figure 5-15.

ESSA Technologies Ltd.
5 2 |
Figure 5-15: Impacts model for VEC ‘Terrestrial habitats’
Species and ecosystem impacts are caused by a range of direct (e.g. clearing forest for
roads or flooding by reservoirs) and indirect (e.g. the impact of itinerant workers in areas of
high biodiversity) impacts during project construction and operation (Carew-Reid et al.
2010). Construction of the 19-km access road on the western slope of the valley can result
in the loss of available habitat and fragmentation of the existing habitat patches. The noise
and machinery movement during the construction works will likely disturb fauna and
displace mobile species. The large spike in the number of workers can create problems of
illegal hunting and extraction of timber and NTFPs (non-timber forest products), such as
medicinal plants.
Another potential impact to take into consideration in relation to terrestrial habitats is the
presence of hydropower facilities in the proximity of protected areas. There may be some
impacts on animal and bird movements, temporarily during construction work due to human
and heavy equipment´s movement, noise, and vibration. Locals from the Mailun Dovan area
have reported that construction works for the Mailun Hydropower Project have disrupted
local fauna (monkeys and the deer Ghoral) and pushed them form their local habitats to the

APPENDIX D Cumulative Impact Assessment- Upper Trishuli-1 Hydropower Project
5 3 |
Langtang NP bufferzone (NESS 2013). The indicators used to evaluate the pressure on
terrestrial habitats are indicated in Table 5-9.
Table 5-9: Cumulative impacts on the VEC ‘Terrestrial Habitats’
VEC Cumulative
impact Pressure indicator
(metric) Scenario 1 Scenario 2
Terrestrial habitats
Encroachment on protected areas
Proximity to protected areas (km
2 of concession
areas within 100 m of protected/buffer zone areas; and %)
39.63 km2
(3.28%) 95.99 km
2
(7.93%)
Pressure on forest habitats
Presence of forest land within concession areas (Percentage of forest land within the concession areas)
6.8% (73.38 km
2)
13.7%
(147.87 km2)
5.6.3 Significance of identified impacts
In the case of the UT-1 Project, the forest cover (land cover of 2010) within the concession
area is 3023 ha (30.23 km2). This surface represents 41% of the total forest cover within
concession areas under Scenario 1 and 20% under Scenario 2. As for the proximity to
protected areas, 22.31 km2 of the UT-1 Project lie within the designated area for Langtang
National Park. These impacts are considered of medium significance.
Table 5-10: Significance of impacts on the VEC ‘Terrestrial Habitats’
VECs Cumulative impact
UT-1 Contribution
Significance Scenario 1
Scenario 2
Terrestrial habitats
Encroachment on protected areas
56% 23% Medium
Pressure on forest habitats
41%
20%
Medium

ESSA Technologies Ltd.
5 4 |
5.7 Use of natural resources
5.7.1 Baseline status
Being a rural environment, livelihoods in the Trishuli basin depend fundamentally on local
natural resources, mainly agriculture and forestry. In the Rasuwa District, 89% of the
households report agriculture integrated with animal husbandry as their primary occupation.
In the Project’s area of influence, most of the households own non-irrigated agricultural land
(usually located on the slopes of the valley), whereas irrigated land Khet is less available
and concentrated on the bottom of the valley, close to the river for water access. Major cash
crops produced in the VDCs in the Project area (Dhunche, Ramche, and Haku) include:
potato, cabbage, cauliflower, onion, garlic and carrot. The major crops produced were
maize, wheat, millet, buckwheat, barley and beans. Buffalo, cow, goat, sheep, yak, and
chicken as poultry.
The total forest coverage in the Rasuwa district is 42,616 hectares, about 28.20% area of
total district. Out of this, 23,539 hectares of forest is under the Langtang National park and
19,077 hector forests are headed by the district forest office. Out of the 19,077 hectors
forest 2747 hectares have been officially handed to the community. Altogether, 76
community forest user groups within the 18 VDCs of the district registered until 067/68.
Figure 5-16: Khet land on the bank of the Trishuli River (Source: ESSA, October 2013)

APPENDIX D Cumulative Impact Assessment- Upper Trishuli-1 Hydropower Project
5 5 |
Figure 5-17: Distribution of forest cover within the Trishuli watershed
The predominant management form for the forest in the area is under the community forest.
The forest is conserved and managed by the local communities. The local Forests Users
Groups (FUGs), with the support and direction of the Distric Forest Office, protect and
manages the forest as well as conducts local community development activities. The District
Forest Office develops the regional operational management plan.
Within the Project’s area of influence, almost all the households in Haku VDC benefit, and
derive part of their livelihoods, from the community forest (Jade Consult 2011). Forest
provide a number of services and products for local communities. Flora surveys have
identified a total of 110 regional plant species with ethnobotanical value, including: medicine
(72), fuel-firewood (37), food (35), timber (18), fodder (14) and other miscellaneous
purposes.

ESSA Technologies Ltd.
5 6 |
Figure 5-18: Land use in the UT-1 Project Site area
Some of the key issues that are common to all forests outside protected areas are: (i) forest
loss due mainly to encroachment for expansion of settlements and urban areas,
infrastructure development, and agriculture, (ii) invasion by alien plant species, (iii)
uncontrolled and repeated forest fires, and (iv) inadequate capacities of District Forest
Offices and user groups. Non timber forest product (NTFP) species (including high value
medicinal herbs) suffer from inefficient and unsustainable harvesting practices (WWF 2013).
Unplanned and unregulated construction of rural roads by village development committees
(VDCs) and district development committees (DDCs) is a major direct cause of
deforestation and forest degradation in the midhill districts.
Other natural resources uses
Nine fishermen are actively involved in fishing business the average income from the fish
was found to be Rs. 1562/month. However, income from fish depends on the season, for
instance October and November is good in terms of fish demand due to high influx of tourist
in Dhunche (Jade Consult 2011).
5.7.2 Cumulative impact assessment
As previously discussed, livelihoods in the Trishuli depend greatly on agriculture and forest
resources. The construction of the infrastructure associated to the hydropower projects

APPENDIX D Cumulative Impact Assessment- Upper Trishuli-1 Hydropower Project
5 7 |
could result in loss of agricultural or forest land and on the disruption of access and use of
these lands, especially during the construction phase of the hydropower facilities. The influx
of migrant workers and the creation of new roads could facilitate the access to increase the
pressure on forest resources.
In the case of irrigated land in proximity to the river, the creation of a water-reduced zone
along the diversion reach could potentially affect the quantity of water available for irrigation
during the dry period. This situation would be probably more likely in the lower parts of the
Trishuli watershed where agriculture activity is more important.
Figure 5-19: Impacts on natural resources use
Two indicators of pressure on forest and agricultural land have been selected to assess the
impacts on this VEC: the percentage of forest and agricultural cover within concession
areas under each scenario. The total area of agricultural land within the Trishuli watershed
(2010) is 1302.86 km2.

ESSA Technologies Ltd.
5 8 |
Table 5-11: Cumulative impacts on the VEC ‘Use of Natural Resources’
VEC Cumulative
impact Pressure indicator (metric)
Scenario 1 Scenario 2
Use of natural
resources
Pressure on forest uses
Presence of forest land within concession areas (Percentage of forest land within the concession areas)
7.6% (73.38 km
2)
15.4%
(147.87 km2)
Pressure on agricultural land
Presence of agricultural land within concession areas (Percentage of agricultural land within the concession areas)
5.3% (69.45 km
2)
12.4%
(162.18 km2)
5.7.3 Significance of identified impacts
Given that run-of-river projects do not usually result in big reservoirs covering large areas, a
significant conversion across the Trishuli watershed of forest and agricultural land to non-
productive uses is not expected. However, changes and pressures on natural resources
use could potentially be an issue at the local scale; for instance in hilly areas where land
suitable for agriculture is limited and farmer could be displaced from the flatter, more
productive areas on the valley bottom. The forest and agricultural land areas within the UT-
1 concession area are, respectively, 30.23 and 12.01 km2.
Table 5-12: Significance of impacts on the VEC ‘Use of Natural Resources’
VECs Cumulative impact UT-1 Contribution
Significance Scenario 1
Scenario 2
Terrestrial habitats
Pressure on forest uses
41%
20%
Medium
Pressure on agricultural land
17.3%
7.4%
Low
5.8 Cultural and religious sites
5.8.1 Baseline status
At the watershed level, there are numerous temples, especially in the middle and lower
parts of the watershed (see Figure 25). Population in the upper part of the watershed are
predominantly Buddhist and do not practice cremation.
As part of the complementary social baseline (see Appendix A), the cultural and religious
sites of the three VDCs affected by the Project were inventoried. Burial places are normally
located in the upper part of the hills.

APPENDIX D Cumulative Impact Assessment- Upper Trishuli-1 Hydropower Project
5 9 |
Figure 5-20: Cultural sites in the Trishuli watershed
5.8.2 Cumulative impact assessment
We anticipate two main potential impacts to cultural sites in the Trishuli watershed
associated to hydropower development. On the one hand, the construction of the different
hydropower projects and their associated infrastructure (i.e. access roads, transmission
lines, working camps, etc.) could interfere with the access and use of cultural sites located
within the projects’ area of influence. This impact is likely to be limited to the construction
phase and would be likely more problematic during festivals or pilgrimage periods when the
affluence to cultural sites is higher.
The other impact that the development of cascading hydropower projects in the Trishuli
basin could bring is the potential affection to water availability and quality required for
religious ceremonies. Cremation sites (“ghats”) require clean water in sufficient quantity and
at chess-high depths, for people to perform their traditional ceremonies and rituals. Pure
and clean flowing water is a pre-requisite to perform these rituals. Minimum depth of water
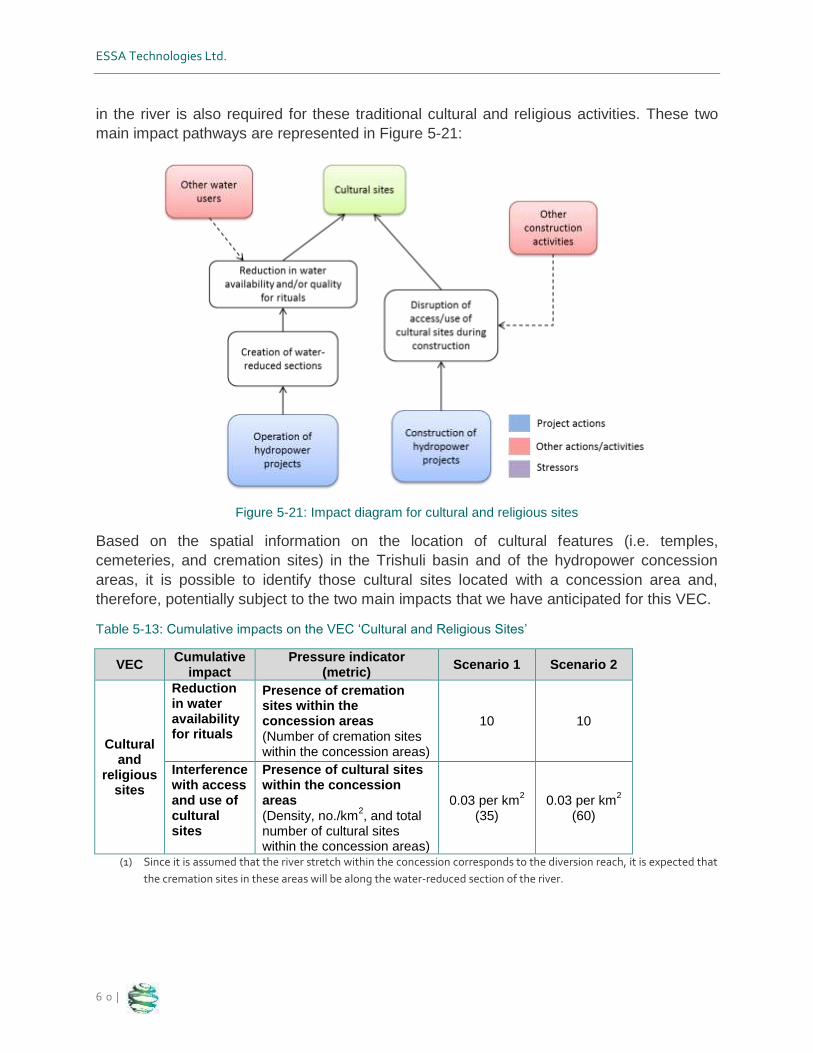
ESSA Technologies Ltd.
6 0 |
in the river is also required for these traditional cultural and religious activities. These two
main impact pathways are represented in Figure 5-21:
Figure 5-21: Impact diagram for cultural and religious sites
Based on the spatial information on the location of cultural features (i.e. temples,
cemeteries, and cremation sites) in the Trishuli basin and of the hydropower concession
areas, it is possible to identify those cultural sites located with a concession area and,
therefore, potentially subject to the two main impacts that we have anticipated for this VEC.
Table 5-13: Cumulative impacts on the VEC ‘Cultural and Religious Sites’
VEC Cumulative
impact Pressure indicator
(metric) Scenario 1 Scenario 2
Cultural and
religious sites
Reduction in water availability for rituals
Presence of cremation sites within the concession areas (Number of cremation sites within the concession areas)
10 10
Interference with access and use of cultural sites
Presence of cultural sites within the concession areas (Density, no./km
2, and total
number of cultural sites within the concession areas)
0.03 per km2
(35) 0.03 per km
2
(60)
(1) Since it is assumed that the river stretch within the concession corresponds to the diversion reach, it is expected that
the cremation sites in these areas will be along the water-reduced section of the river.
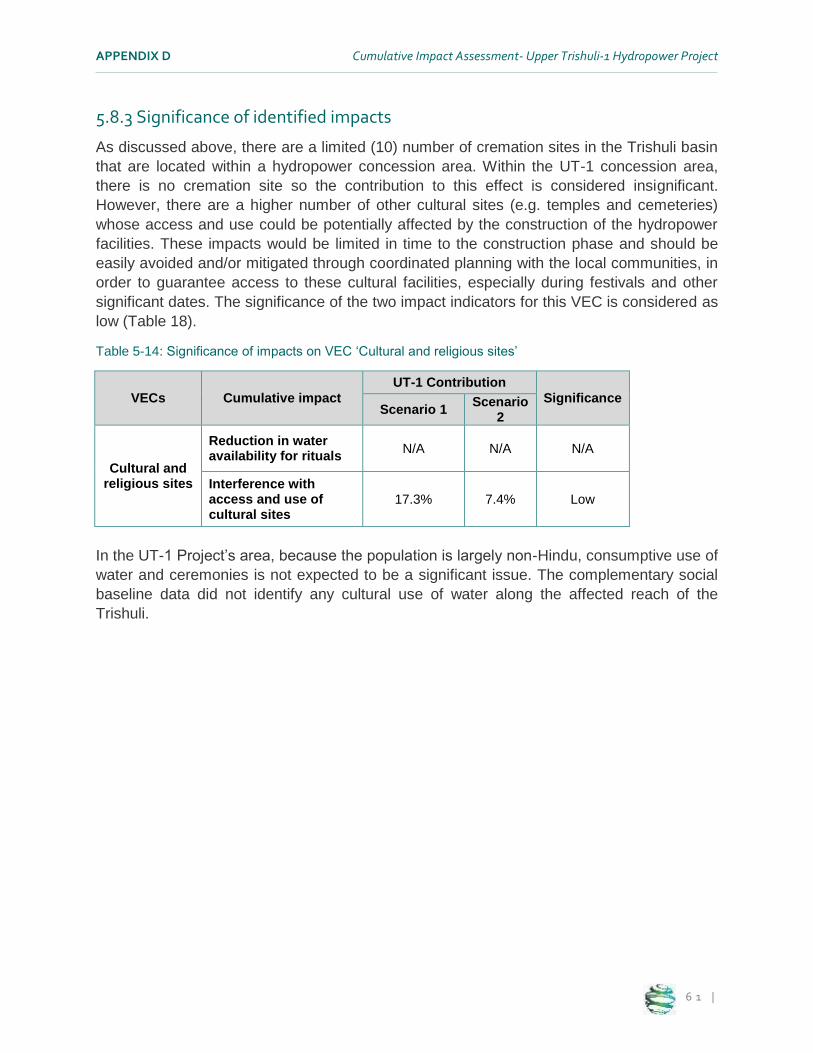
APPENDIX D Cumulative Impact Assessment- Upper Trishuli-1 Hydropower Project
6 1 |
5.8.3 Significance of identified impacts
As discussed above, there are a limited (10) number of cremation sites in the Trishuli basin
that are located within a hydropower concession area. Within the UT-1 concession area,
there is no cremation site so the contribution to this effect is considered insignificant.
However, there are a higher number of other cultural sites (e.g. temples and cemeteries)
whose access and use could be potentially affected by the construction of the hydropower
facilities. These impacts would be limited in time to the construction phase and should be
easily avoided and/or mitigated through coordinated planning with the local communities, in
order to guarantee access to these cultural facilities, especially during festivals and other
significant dates. The significance of the two impact indicators for this VEC is considered as
low (Table 18).
Table 5-14: Significance of impacts on VEC ‘Cultural and religious sites’
VECs Cumulative impact
UT-1 Contribution
Significance Scenario 1
Scenario 2
Cultural and religious sites
Reduction in water availability for rituals
N/A
N/A
N/A
Interference with access and use of cultural sites
17.3%
7.4%
Low
In the UT-1 Project’s area, because the population is largely non-Hindu, consumptive use of
water and ceremonies is not expected to be a significant issue. The complementary social
baseline data did not identify any cultural use of water along the affected reach of the
Trishuli.
ESSA Technologies Ltd.
6 2 |
6 Cumulative Impact Management and Monitoring Framework
This section identifies potential mitigation measures to address the identified cumulative
impacts. We have taken into consideration existing measures or activities proposed in the
original ESIA (Jade Consult 2011) that could play a role in mitigating/minimizing he
cumulative impacts. The proposed measures/actions should be integrated into a
Cumulative Impacts Management Plan.
It should be noted that, since cumulative impacts typically result from the actions of multiple
stakeholders, the responsibility for their management is collective. A distinction between
individual actions within the Proponent’s control and those measures that require
coordination and collaboration with third parties (e.g. other hydropower sponsors) has been
made (Table 6-2) to clearly identify the scope of responsibilities for the cumulative impacts
management framework.
Considering that the Trishuli watershed has already been impacted by hydropower
development, upstream and downstream of the UT-1 Project, NWEDC should focus their
efforts on mitigating those impacts for which a significant contribution of the UT-1 is
expected and on engaging and collaborating on regional coordinated actions to prevent
further degradation of the Trishuli basin.
6.1 Management framework
According to Nepalese Environmental Protection Rules, environmental and social
management of the UT-I Hydroelectric Project is the responsibility of the Proponent. The
Proponent’s Project Management Office (PMO) will have this responsibility during the
construction and operation phase.
A separate Environmental and Social Management Cell (ESMC) will be established,
reporting to the PMO, to address social, environmental and safety issues. The UT-1 Project
recently appointed an Environmental Manager to ensure that the EIA recommended
mitigation and monitoring actions are duly implemented, monitored, assessed, evaluated
and disseminated to project stakeholders for feedback and improvements. The ESMC is led
by the Environmental Manager.
The ESMC (Figure 6-1) will have the responsibility to implement environmental provisions
not included in the contract documents of the Contractor and liaison with the other
governmental and nongovernmental organizations, as well as the responsibility for
monitoring of environmental and social provisions during construction and operation.
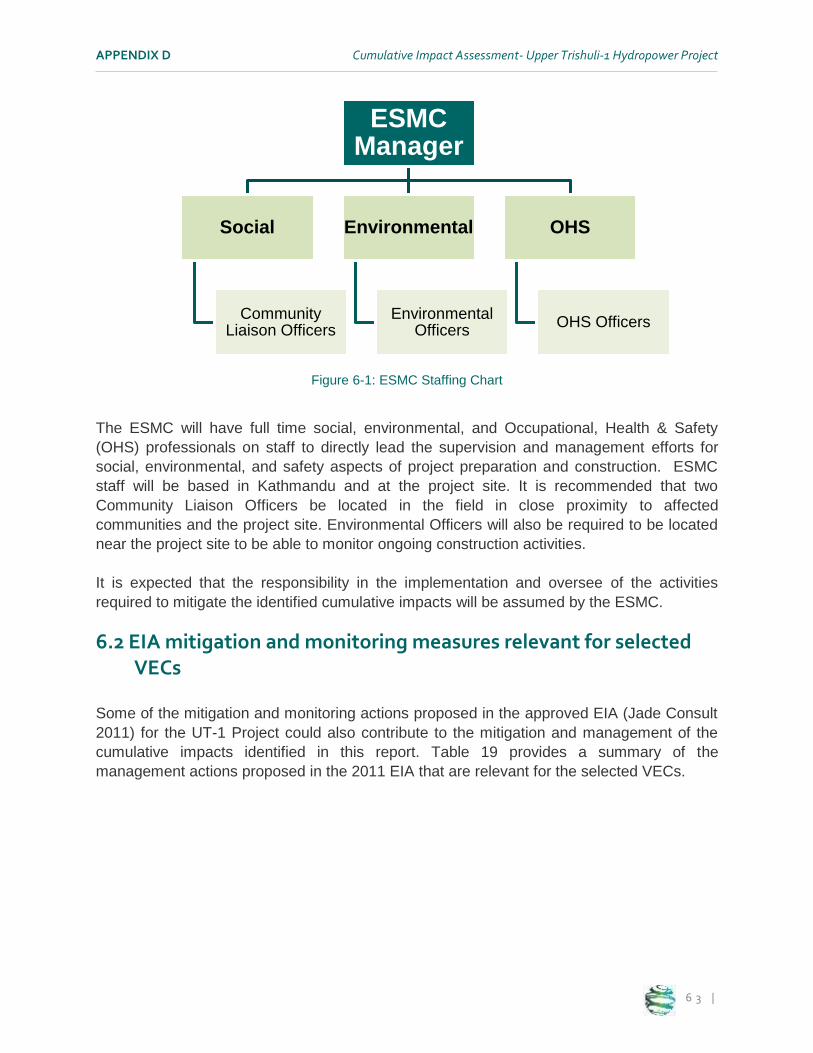
APPENDIX D Cumulative Impact Assessment- Upper Trishuli-1 Hydropower Project
6 3 |
Figure 6-1: ESMC Staffing Chart
The ESMC will have full time social, environmental, and Occupational, Health & Safety
(OHS) professionals on staff to directly lead the supervision and management efforts for
social, environmental, and safety aspects of project preparation and construction. ESMC
staff will be based in Kathmandu and at the project site. It is recommended that two
Community Liaison Officers be located in the field in close proximity to affected
communities and the project site. Environmental Officers will also be required to be located
near the project site to be able to monitor ongoing construction activities.
It is expected that the responsibility in the implementation and oversee of the activities
required to mitigate the identified cumulative impacts will be assumed by the ESMC.
6.2 EIA mitigation and monitoring measures relevant for selected VECs
Some of the mitigation and monitoring actions proposed in the approved EIA (Jade Consult
2011) for the UT-1 Project could also contribute to the mitigation and management of the
cumulative impacts identified in this report. Table 19 provides a summary of the
management actions proposed in the 2011 EIA that are relevant for the selected VECs.
ESMC Manager
Social
Community Liaison Officers
Environmental
Environmental Officers
OHS
OHS Officers

ESSA Technologies Ltd.
6 4 |
Table 6-1: EIA mitigation and monitoring measures relevant for the selected VECs
Mitigation and monitoring measures as proposed in the 2011 EIA
Water resources (quantity, quality and water uses)
Release of the proposed environmental flow (10% of the mean monthly flow) in the diversion reach.
Create an Environmental Flow Stakeholders Committee with representation from local communities, Langtang National Park and government representatives, the operator and independent environmental specialist.
Engage in watershed management activities with other stakeholders.
Monitoring of water quality, springs, and groundwater during construction.
Water Source Protection Programs.
Water supply and irrigation facilities should be monitored (e.g. via interviews with water user groups in the affected communities) as part of the Construction Impact Monitoring Plan
Fish and aquatic habitats
Release of the proposed environmental flow (10% of the mean monthly flow) in the diversion reach.
Develop an Aquatic Ecology Management Plan
Enhancement of fish communities (e.g. opening up of new stretches of river with fish ways, flow control devices, such as artificial riffles, dikes or weirs, stocking of adults or fries, and installation of fish incubators.
There will be a need of installing fish elevators, or the capture and transportation of fish upstream provisions of fish ways and fish ladders.
Explore options for aquaculture and fish hatcheries in the reservoir
Monitoring of fish habitat and population during construction
Erosion and sedimentation
processes
Protection of natural vegetation to minimize erosion (e.g. river banks restoration).
Management of sediments and monitoring of sedimentation.
Stabilization and protection of slopes.
Catchment Area Management and Treatment Plan will be implemented in the reservoir area.
Settlement basins and watering of roads during the dry period to minimize sediments and erosion run-off.
Terrestrial habitats
Protection of land area equivalent or better in ecological value to lost land.
Creation of ecological reserves with rigorous and effective protective measures.
Enhancement of riparian vegetation.
Doing specific inventories and acquiring better knowledge on the fauna, flora and specific habitats within the studied zone.
Enhancement of riparian vegetation.
Establish a Biodiversity Monitoring Unit (BMU) and, at local level, Biodiversity Monitoring and Coordination Committee (BMCC) including representatives from Forest User Groups (FUGs), Village Development Committee (VDC), District Development Committee (DDC), District Forest Office (DFO), District Soil Conservation Office (DSCO), and other concerned stakeholders.
Conservation awareness program on local biodiversity should be conducted for all project field staffs and workforce.
Illegal hunting and poaching of wildlife species from the workforces should be strictly prohibited
Monitoring wildlife habitat during construction
Development of the Terrestrial Ecology Management Plan and the Biodiversity and Wildlife Conservation Management Plan.

APPENDIX D Cumulative Impact Assessment- Upper Trishuli-1 Hydropower Project
6 5 |
Use of natural resources
Involve the different resource users (i.e. farmers, Community Forest groups, fishermen, Langtang National Park, etc.) in a collective mitigation approach.
Compensatory plantation and/or protection of existing degraded forestland should be carried out to compensate the forest area removed during the project implementation.
Comprehensive Land Acquisition and Resettlement Plans.
Develop a Community Forestry Support Program, including establishment of nurseries, and an Agricultural Enhancement Program, including resource inventory and baseline and creation of technical assistance (e.g. soil fertility management, cultivation techniques, demonstration plots, etc.)
Cultural and religious sites
Shifting of the local religious and cultural places that are likely to be demolished during the construction of project with consent of the local people to an appropriate place
6.3 Proposed actions for the mitigation and monitoring of cumulative impacts
Table 6-2 presents the management and monitoring measures that will contribute to
mitigating the cumulative impacts identified in this study. The proposed actions build on the
existing environmental management framework for the UT-1 Project and, following best
practice guidelines (IFC 2013), are structured around two levels of responsibility:
(i) Measures that fall within NWEDC control and could be directly implemented by
the proponent; and
(ii) Actions that require collaboration and coordination of multiple stakeholders (e.g.
Government of Nepal, other hydropower sponsors in the Trishuli basin, etc.)
These measures should be formally developed and implemented within the framework of a
Cumulative Impacts Management Plan, which is one of the action items proposed in
Environmental and Social Action Plan of the Supplemental EIA (ESSA 2014). It is expected
that internal capacity (i.e. staff and resources) on the part of NWEDC will be required to
implement and follow up on the mitigation measures and coordinate as needed with other
regional stakeholders (hydropower operators, NGOs, government, Community Forest
Groups, etc.) to engage in and support regional initiatives.

ESSA Technologies Ltd.
6 6 |
Table 6-2: Management and monitoring actions for cumulative impacts mitigation
Selected VECs Cumulative impacts
(indicator)
Proposed mitigation and management actions
Within NWEDC control Collaborative/regional efforts
Envi
ron
me
nta
l
Water resources (quantity, quality and water uses)
Reduction in water availability (creation of flow-reduced segments)
- Create an Environmental Flow Stakeholders Committee (originally proposed in the 2011 ESIA).
- Monitor environmental flows within the diversion reach (included in the Environmental Flows Management Plan)
- Engage and support watershed management initiatives in the Trishuli basin.
Competition with other users (presence of settlements within the concession areas)
- Engage with water users groups and monitor impacts on water supply as part of Construction Impact Monitoring Plan (originally proposed in the 2011 ESIA).
- Continue water quality monitoring during operations (included in the Environmental Flows Management Plan)
- Develop Water Source Protection Programs (originally proposed in the 2011 ESIA).
- Engage and support watershed management initiatives in the Trishuli basin.
- Support collaboration and exchange of data with relevant stakeholders (e.g. Langtang Park authorities, Water District Offices, etc.)
Fish and aquatic habitats
Aquatic habitat loss/degradation (creation of flow-reduced segments)
- Develop an Environmental Flow Management Plan3 with
Schizothorax richardsonii as key species (included in the Environmental Flows Management Plan)
- Monthly monitoring for 5 years after the start of operations (included in the Environmental Flows Management Plan)
- Engage in coordinated monitoring efforts and explore joint mitigation options with other hydropower sponsors.
Aquatic habitat fragmentation (construction of dams and other physical barriers)
- Integrate the Aquatic Ecology Management Plan (originally proposed in the 2011 ESIA) as part of the Environmental Flow Management Plan.
- Explore and develop mitigation options suggested for the barrier effect (2011 EIA): fish ladder, hatcheries and stocking, etc. (included in the Environmental Flows Management Plan)
- Engage and support initiatives aiming to mitigate/restore aquatic connectivity (e.g. coordinated capture and release, multi-stakeholder fish rearing program, etc.)
Erosion and sedimentation processes
Landslides and other risks (presence of high slide potential areas in the concession areas)
- Develop the Catchment Area Management and Treatment Plan and stabilize slopes (originally proposed in the 2011 ESIA).
- Monitor landslides and other natural risks (i.e. GLOFs) in
- Engage and support soil conservation and erosion reduction initiatives in the Trishuli basin.
3 Refer to the more detailed recommendations in the Environmental Flows Assessment report (Appendix E, ESSA 2014).

APPENDIX D Cumulative Impact Assessment- Upper Trishuli-1 Hydropower Project
6 7 |
Selected VECs Cumulative impacts
(indicator)
Proposed mitigation and management actions
Within NWEDC control Collaborative/regional efforts
the Project area (included in the Catchment Area Management and Treatment Plan)
Increased surface erosion (density of roads within the concession areas)
Protect natural vegetation, provide adequate drainage
retention facilities during construction (included in the
Catchment Area Management and Treatment Plan)
- Engage and support soil conservation and erosion reduction initiatives in the Trishuli basin.
Terrestrial habitats
Encroachment on protected areas (proximity of concession areas to protected areas)
- Develop the Terrestrial Ecology Management and the Biodiversity and Wildlife Conservation Management Plans (originally proposed in the 2011 ESIA)
- Extend wildlife and biodiversity monitoring in selected locations into the operational phase (included in the Biodiversity and Wildlife Conservation Management Plan)
- Develop a Riparian Vegetation Restoration Program (originally proposed in the 2011 ESIA)
- Engage and support stakeholders (e.g. Langtang National Park, WWF-Nepal) working on biodiversity protection initiatives in the Trishuli watershed.
- Explore opportunities for coordinated re-vegetation-reforestation actions with other hydropower sponsors (i.e. maximize terrestrial habitats connectivity).
Pressure on forest habitats (presence of forest habitats within concession areas)
Soci
o-e
con
om
ic
Use of natural resources
Pressure on forest uses (presence of forest land within concession areas)
- Develop the Community Forestry Support Program (originally proposed in the 2011 ESIA)
- Monitor impacts on Community Forests (e.g. impacts on productivity/livelihoods) (included in the Land Acquisition and Livelihood Restoration Plan)
- Coordinate reforestation/re-vegetation actions with existing/future initiatives in the watershed.
Pressure on agricultural land (presence of agricultural land within concession areas)
- Develop Agricultural Enhancement Program (originally proposed in the 2011 ESIA)
- Monitor impacts on livelihoods due to the loss of agricultural land (included in the Land Acquisition and Livelihood Restoration Plan)
- Support farmers in the Project area to participate in agriculture enhancement opportunities at the district or watershed level.
Cultural and religious sites
Reduction in water availability for rituals (cremation sites within the concession areas)
- The few existing cremation sites are located within the concession area of an existing hydropower project. Further disruption is not expected.
- Collaborate with the Government and other stakeholders in cultural-related issues.
Interference with access and use of cultural sites
- Coordinate with local communities to minimize disruption of cultural/religious activities, especially significant dates (included in the Construction ESMP)

ESSA Technologies Ltd.
6 8 |
References
ADB (Asian Development Bank) and ICIMOD. 2006. Environment Assessment of Nepal: Emerging Issues and Challenges [http://lib.icimod.org/record/7410] Anderson, E.P., C.M. Pringle, and M.C. Freeman. 2007. Quantifying the extent of
river fragmentation by hydropower dams in the Sarapiquı́ River Basin, Costa Rica.
Aquatic Conserv: Mar. Freshw. Ecosyst. 18: 408–417.
Bajracharya, T.R., Acharya, S. and B. Ale. 2011. Changing climatic parameters and its
possible impacts in hydropower generation in Nepal (A case study on Gandaki River
basin). Journal of the Institute of Engineering 8:160-173.
Bajracharya, SR; Maharjan, SB; Shrestha, F; Bajracharya, OR; Baidya, S. 2014.
Glacier status in Nepal and decadal change from 1980 to 2010 based on landsat data.
Kathmandu: ICIMOD
Bhatt, R.P. and S.N. Khanal. 2009. Environmental Impact Assessment system in Nepal
- an overview of policy, legal instruments and process. Kathmandu University Journal of
Science, Engineering and Technology (5): 160-170
Bhatt, R.P. and S.N. Khanal. 2011. Impoundment after Damming the Rivers Change in
Flow Regime and Effect in Water Quality of Chilime Hydropower Project in Rasuwa
District Nepal. Advances in Bioresearch (2): 33- 39
Carew-Reid, J., J. Kempinski and A. Clausen. 2010. Biodiversity and Development of the Hydropower Sector: Lessons from the Vietnamese Experience – Volume I: Review of the Effects of Hydropower Development on Biodiversity in Vietnam. ICEM – International Centre for Environmental Management, Prepared for the Critical Ecosystem Partnership Fund, Hanoi, Viet Nam. [http://www.icem.com.au/documents/biodiversity/bioHPdevt/Volume%20I%20Biodiversity%2
0and%20development%20of%20hydropower-Vietnam%20experience.pdf]
Connors, B.M., D.R. Marmorek, E. Olson, A.W. Hall, P. de la Cueva Bueno, A.
Bensen, K. Bryan, C. Perrin, E. Parkinson, D. Abraham, C. Alexander, C. Murray,
R. Smith, L. Grieg, and G. Farrell. 2014. Independent Review of Run-of-River
Hydroelectric Projects and their Impacts on Salmonid Species in British Columbia. 157
pp + xiv.
CEPAD Hydro Consultants (P) Ltd. April 2011. Final Report on Environmental Impact
Assessment of Sanjen (Upper) Hydroelectric Project (SUHEP)
Daelim Kyerong. March 2013. UT-1 HEP Basic Design Report

APPENDIX D Cumulative Impact Assessment- Upper Trishuli-1 Hydropower Project
6 9 |
DOFD (Directorate of Fisheries Development). 2008. Limnological and biological
study report of Tirsuli River. Fiscal Year 2065/2066. Government of Nepal, National
Inland Fisheries and Aquaculture Development Programme. Balaju, Nepal. 14 p.
Fiera (Fiera Biological Consulting Ltd.). 2012. Athabasca State of the Watershed
Report: Phase 2. Report prepared for the Athabasca Watershed Council. Fiera
Biological Consulting Report #1142. Pp. 100.
Greig, L.A., J.K. Pawley, C.H.R. Wedeles, P. Bunnell, and M.J. Rose. 1992.
Hypotheses of effects of development in the Moose River Basin: Workshop summary.
Prepared by ESSA Ltd., Richmond Hill, ON for Department of Fisheries and Oceans,
Burlington, ON. 136 pp.
Gubhaju, S.R. 2002. Impact of damming on the aquatic fauna in Nepalese rivers. p.
129-146. In: Petr, T. and Swar, S.B. (eds.). Cold water fisheries in the Trans-Himalayan
countries, FAO Fisheries Technical Paper 431, Rome, 2002. 376p.
[http://www.fao.org/docrep/005/y3994e/y3994e00.htm]
Hegmann, G., C. Cocklin, R. Creasey, S. Dupuis, A. Kennedy, L. Kingsley, W.
Ross, H. Spaling and D. Stalker. 1999. Cumulative Effects Assessment Practitioners
Guide. Prepared by AXYS Environmental Consulting Ltd. and the CEA Working Group
for the Canadian Environmental Assessment Agency, Hull, Quebec.
Higaki, D., K.K. Karki, and C.S. Gautam. 2005. Soil erosion control measures on
degraded sloping lands: A case study in Midlands of Nepal. Aquatic Ecosystem Health
& Management. 8(3):243–249
IEA (International Energy Agency). 2000. Survey of the environmental and social
impacts and the effectiveness of mitigation measures in hydropower development.
Volume 1 in Implementing Agreement for Hydropower Technologies and Programmes
(Annex III: Hydropower and the Environment), 111 p.
ICIMOD (International Centre for Integrated Mountain Development) .2011. Glacial
lakes and glacial lake outburst floods in Nepal. Kathmandu, 109 p.
IFC (International Financial Corporation). 2013. Good Practice Handbook on Cumulative Impact Assessment and Management: Guidance for the Private Sector in Emerging Markets [http://www.ifc.org/wps/wcm/connect/topics_ext_content/ifc_external_corporate_site/ifc+sustainability/publications/publications_handbook_cumulativeimpactassessment]
Jade Consult. 2011. Upper Trishuli I Hydropower Project: Environmental Impact
Assessment Report.

ESSA Technologies Ltd.
7 0 |
Nepal Environmental and Scientific Services [NESS]. 2010. Environmental Impact
Assessment report; Rasuwagadhi Hydroelectric Project.
NESS (Nepal Environmental & Scientific Services P Ltd.). 2013a. Report on Social Baseline
Data of Upper Trishuli-1 Hydroelectric Project (216 MW)
NESS (Nepal Environmental & Scientific Services P Ltd.). 2013b. Report on Vegetation
Study of Upper Trishuli-I Hydroelectric Project (216MW)
NESS (Nepal Environmental & Scientific Services P Ltd.). 2013c. Report on Wildlife of Upper
Trishuli-1 Hydroelectric Project (216 MW)
Rajbanshi, K.J. 2002. Zoo-geographical distribution and the status of coldwater fish in
Nepal. In: Petr, T. and Swar, S.B. (eds.). Cold water fisheries in the Trans-Himalayan
countries, FAO Fisheries Technical Paper 431, Rome, 2002. 376 p.
[http://www.fao.org/docrep/005/y3994e/y3994e00.htm]
Sharma, U.R. (Ed.). 2013. Chitwan-Annapurna Landscape: Biodiversity Areas and
Linkages. Hariyo Ban Program-WWF Nepal
Swar, D.B. 2002. The status of cold water fish and fisheries in Nepal and prospects of
their utilization for poverty reduction. In Swar, D. B. and Petr, T. (Eds.) Cold water
fisheries in the trans-Himalayan countries. Rome: Food and Agriculture Organization of
the United Nations.
Water and Energy Commission Secretariat (WECS). 2011. Water Resources of
Nepal in the Context of Climate Change. Singha Durbar, Kathmandu, Nepal. 89 p.
WB (World Bank). 2012. Sample Guidelines: Cumulative Environmental Impact
Assessment for Hydropower Projects in Turkey (Report No. 76998). Ankara, 84 p.
WB (World Bank). 2013. Environmental Impact Assessment Study of Kabeli ‘A’
Hydroelectric Project- Chapter VII: Rapid Cumulative Impacts Assessment and
Proposed Management Measures
WWF (World Wildlife Fund) Nepal. 2013. Chitwan Annapurna Landscape (CHAL): A
Rapid Assessment, Nepal, August 2013

APPENDIX D Cumulative Impact Assessment- Upper Trishuli-1 Hydropower Project
7 1 |
Annex 1: Inventory of Hydropower Projects in the Trishuli watershed
# Project Operator Type of Scheme
Capacity (MW)
Design Flow (m
3/s)
Annual energy
generation (GWh/yr)
Start of operations
Length of
penstock (m)
Access roads (km)
Transmission line (km)
1
Trishuli Hydropower Project (THP)
Nepal Electricity Authority
Run-of-River
24 45.3 134.8 1967 4792 72 66 (27.2)1
2 Devighat Hydropower Project (DHP)
Nepal Electricity Authority
Run-of-River
(cascade to THP)
14.1 45.3 105.089 1984 4500 10 66 (5)
3 Chilime Hydropower Project (CHP)
Chilime Hydropower
Co, Ltd.
Run-of-River
(peaking reservoir)
22 15 137.9 2003 2826.5 5 66 (38)
4 Thoppal Khola Thoppal Khola Hydropower Company
Run-of-River
1.65 3.5 10.62 2008 30000 0.5 11 (10)
5 Thadi Khola Hiraratna
hydropower Pvt. Ltd
Run-of-River
5 5.75 34.59 2800 0.4 33 (3)
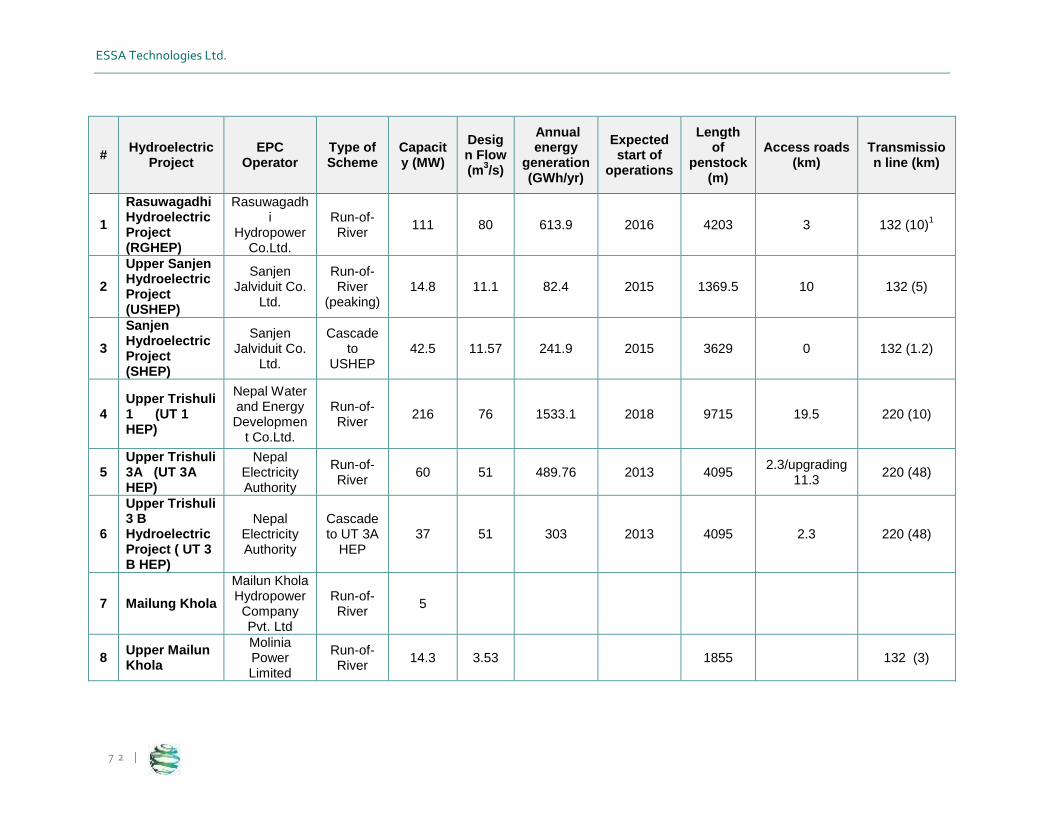
ESSA Technologies Ltd.
7 2 |
# Hydroelectric
Project EPC
Operator Type of Scheme
Capacity (MW)
Design Flow (m
3/s)
Annual energy
generation (GWh/yr)
Expected start of
operations
Length of
penstock (m)
Access roads (km)
Transmission line (km)
1
Rasuwagadhi Hydroelectric Project (RGHEP)
Rasuwagadhi
Hydropower Co.Ltd.
Run-of-River
111 80 613.9 2016 4203 3 132 (10)1
2
Upper Sanjen Hydroelectric Project (USHEP)
Sanjen Jalviduit Co.
Ltd.
Run-of-River
(peaking) 14.8 11.1 82.4 2015 1369.5 10 132 (5)
3
Sanjen Hydroelectric Project (SHEP)
Sanjen Jalviduit Co.
Ltd.
Cascade to
USHEP 42.5 11.57 241.9 2015 3629 0 132 (1.2)
4 Upper Trishuli 1 (UT 1 HEP)
Nepal Water and Energy Developmen
t Co.Ltd.
Run-of-River
216 76 1533.1 2018 9715 19.5 220 (10)
5 Upper Trishuli 3A (UT 3A HEP)
Nepal Electricity Authority
Run-of-River
60 51 489.76 2013 4095 2.3/upgrading
11.3 220 (48)
6
Upper Trishuli 3 B Hydroelectric Project ( UT 3 B HEP)
Nepal Electricity Authority
Cascade to UT 3A
HEP 37 51 303 2013 4095 2.3 220 (48)
7 Mailung Khola
Mailun Khola Hydropower Company Pvt. Ltd
Run-of-River
5
8 Upper Mailun Khola
Molinia Power Limited
Run-of-River
14.3 3.53 1855 132 (3)

APPENDIX D Cumulative Impact Assessment- Upper Trishuli-1 Hydropower Project
7 3 |
# Hydroelectric
Project EPC
Operator Type of Scheme
Capacity (MW)
Design Flow (m
3/s)
Annual energy
generation (GWh/yr)
Expected start of
operations
Length of
penstock (m)
Access roads (km)
Transmission line (km)
9 Super Trishuli Ganga Nadi HPP
River Connect Pvt.
Ltd
Run-of-River
10
10 Upper Mailung -A
Energy Engineering
Pvt. Ltd
Run-of-River
5
11 Tadi Khola (thaprek) (TKHP)
Aadi Shakti Bidhut
Bikash Co. P. Ltd
Run-of-River
4.2 7.2 29.267 2015 2.371 0 33 (8)
12 Third Trishuli Nadi (TTNHEP)
Stef Energy Trishuli Thrird
Hydropower Company Pvt. Ltd
Run-of-River
20.1 115.25 137.43 500/2240 2 132 (0.5)
13 Upper Tadi Hydroelectric Project
Surya Kunda Hydroelectric
Private Limted
Run-of-River
11 6.93 61.479 2416 2 132 (8)

ESSA Technologies Ltd.
7 4 |
#
Hydroelectric Project
EPC Operator
Type of Scheme
Capacity (MW)
Design Flow (m
3/s)
Annual energy
generation (GWh/yr)
Expected start of
operations
Length of
penstock (m)
Access roads (km)
Transmission line (km)
1 Upper Trishui-2 HPP
Hydro China Corporation
Run-of-River
102
2 Sanjen Khola Sala Sungi P
Ltd Run-of-River
78 9.3 423.748 4411.5 25 132 (10)
3
Rasuwa Bhotekoshi Hydroelectric Project
Dipak Khaka Run-of-River
105 86.77 607 5427 3 132 (5)
4
Middle Trishuli Ganga Nadi Hydropower Project
Perfect Energy
Developmnet Pvt. Ltd,
KTM,
Run-of-River
55/65 140 308.37
1320 (tunnel) or 2100 (canal)
3 132 (6)
5 Nyam Nyam Tudi Power Company Pvt.Ltd.
Run-of-River
6 1.9 32.473 2197.6 33 (8)
6 Trishuli Khola
Shahid Diksha
Jalbidhut Ayojana PVT.Ltd.
Run-of-River
1.35 1.45 11.64 1.5 11 (3)
7 Middle Tadi
Dupcheswor Mahadev Hydro Co. Pvt. Ltd.
Run-of-River
5.5 6.349 31.63 1624 7 11 (7)
8 Devighat Cascade HPP
Devighat Hydropower
Pvt Ltd
Cascade to
Devighat 9.6 45.3 56.3 4948.75 66 (5)

APPENDIX D Cumulative Impact Assessment- Upper Trishuli-1 Hydropower Project
7 5 |
#
Hydroelectric Project
EPC Operator
Type of Scheme
Capacity (MW)
Design Flow (m
3/s)
Annual energy
generation (GWh/yr)
Expected start of
operations
Length of
penstock (m)
Access roads (km)
Transmission line (km)
9 Lower Phalaku HPP
Bisham Hydropower Company
Pvt Ltd
Run-of-River
3.35
10 Salankhu Khola
Salankhu Khola
Hydropower P. Ltd.
Run-of-River
2.2 1.95 14.405 3209 33/11 (2)
11 Mahesh Khola Mk
Hydropower Co Pvt Ltd
Run-of-River
2.17
12 Trishuli Galchhi HEP
Siddhakali Power Pvt.Ltd
Run-of-River
75 169.4 465.97 8000 3 132 3)
13 Chake Khola HPP Nobel
Hydropower Pvt Ltd
Run-of-River
1.8
14 Phalakhu Khola HPP
Rasuwa Hydropower Company
Pvt Ltd
Run-of-River
3
15 Phenlun Briddhin Diversion HPP
Public Nepal Hydropower
Pvt Ltd
Run-of-River
4.5
16 Phalakhu Khola HPP
Betrawati Hydroelectric
Co. Ltd
Run-of-River
14.7
17 Saptang Khola HPP
Saptang Hydropower
Pvt Ltd
Run-of-River
2.5 1.87 13.78 1416, 581
6

ESSA Technologies Ltd.
7 6 |
#
Hydroelectric Project
EPC Operator
Type of Scheme
Capacity (MW)
Design Flow (m
3/s)
Annual energy
generation (GWh/yr)
Expected start of
operations
Length of
penstock (m)
Access roads (km)
Transmission line (km)
18 Tadi Khola Cascade
Hira Ratna Hydropower Company Pvt. Ltd
Run-of-River
3
19 Small Likhu Khola HPP
Department of Electricity Development
Run-of-River
1.5
20 Phalakhu HPP Department of Electricity Development
Run-of-River
5.5
21 Chandravati Khola
Public Consulting Engineers, Madhukar Pandey, Durga Prasad
Bhattarai and Rosan
Karki
Run-of-River
4

APPENDIX D Cumulative Impact Assessment- Upper Trishuli-1 Hydropower Project
7 7 |
Annex 2: Stakeholders consultations-Focus Discussion Groups
Objectives of the stakeholders consultations
As required by good practice in the Cumulative Impacts Assessment process (IFC 2013), a
series of public consultations, in the form of Focus Discussion Groups (FDGs), with local
stakeholders were conducted by a team of social experts of Nepal Environmental &
Scientific Services (NESS) during 25-27 January 2013.
The specific goals of these consultations were the following:
1. Facilitate the identification by local stakeholders of Valued Environmental and Social
Components (VECs);
2. Elicit stakeholders views on the importance, state and trends of the identified VECs;
3. Gather any other considerations or concerns relevant for the VECs analysis or the
CIA process.
The figure below shows how consultations with local stakeholder fit within the overall CIA
process:
4.
The consultations took place in the VDCs of Dhunche, Ramche, and Haku; the three
village development committees that will be directly impacted by the Project, and where the
Local
stakeholders
input

ESSA Technologies Ltd.
7 8 |
land and property directly impacted by the development are located. The following table
shows the calendar of activities developed for the consultation process. In total, five FDGs
sessions were conducted.
Activities Date Location
In-house preparation by
experts (team building,
orientation, preparation of
brochure, maps etc.)
21-22 January, 2014 Kathmandu
Information dissemination to
local participants about the
FGD
23-24 January, 2014 Dhunche, Ramche, and Haku VDC
FGD Session 25 January, 2014 Mailung Besi, Haku VDC
FGD Session 25 January, 2014 Thade-1, Dhunche VDC
FGD Session 26 January, 2014 Haku Besi-3, Haku VDC
FGD Session 27 January, 2014 Dhunche VDC
FGD Session 27 January, 2014 Grang, Ramche VDC
The consultations included the views of specific relevant groups, such as vulnerable groups
(e.g. women), and river users (e.g. fisherman, people using it for recreational purposes, etc.
). NGOs, private, public, and government offices and institutions were invited in an
interaction at Dhunche and their feedback was obtained.
Criteria for the selection of local stakeholders
Geographic scope: Prior the consultation exercise, the consultant had in-house
discussion among experts regarding the selection of the site for consultations and
stakeholders. The most affected areas of the project impacted VDCs where majority of
impacted people reside, and people whose land and property falls under such project
influenced areas were selected for FGD consultations. Based on these criteria, the
public consultations and FGDs were conducted in 3 VDCs, namely: Dhunche, Ramche,
and Haku. At Dhunche VDC, public consultations were carried out in 2 places namely at
the district headquarter, and at a place called Thade. Similarly, in Haku VDC, public
consultations were conducted in 2 places namely at Mailung, and at Haku Besi -Sano
Haku. For Ramche VDC, public consultations were carried out in a place called Grang.
The list of pubic attended in consultations is included in annex 1 of this report;
The consultations covered the project influence areas and views of vulnerable groups,
River users (fisherman, people using it for recreational purposes etc )were captured;
and
The NGOs, private, public, and government offices and institutions were invited in an
interaction at Dhunche and their feedback was obtained.

APPENDIX D Cumulative Impact Assessment- Upper Trishuli-1 Hydropower Project
7 9 |
Development of the FDGs
NESS study team had in-house meeting and prepared materials to be disseminated during
the FGDs to provide participants with a general understating of the Project, the anticipated
impacts, and the CIA process. Large size maps of the Project and its area of influence were
also used for disseminations purposes.
The venue, time, and objectives of the meeting were informed a few days prior to the
consultations to the people from each VDC. At each Focus Group, the facilitators ensured
that all participants understood the CIA process and their role within this process, and had
enough knowledge about the Project to allow them to select the VECs.
The identification of key VECs built on the preliminary components that the consulting team
had identified based on our knowledge of the Project and its anticipated impacts, on the
baseline information available for the Project area, and on CIA analysis for hydropower
projects in other parts of Nepal. This information was briefed to the participants.
The participants of the Dhunche VDC FGD, conducted at the district level, included all the
relevant government stakeholders of the district, private and public institutions,
representative of political parties, journalists, project affected people and related
stakeholders.
Outcomes of the FDGs
Common VECs and concerns identified by local stakeholders
Physical Environment
Landslides/erosion
Drying of spring sources along tunnel alignment and vicinity
Scarcity for drinking water and arable land
Land use change and its related impacts (reduction of agricultural land, less
productivity, non-availability of land even for important and for future planning
Issues pollution (air, water, noise, solid waste, )
Issues of improper management of spoil/muck, issues related to siltation and its
impact on private property, forest areas
Impact in dewatered zone ( irrigation water use, water mills), climatic imbalances in
dewatered stretch
Issues related to minimum environmental flow release

ESSA Technologies Ltd.
8 0 |
Biological Environment
Impact on forest, vegetation
Issues of deforestation, harvesting/illegal harvesting of trees, degradation of forest,
loss of forest products including NTFP
Forest fragmentation
Impact on national park, community forest
Issues related to impacts on wildlife and their habitat, habitat fragmentation
Movement of wildlife towards settlements after access over the River and their
impacts on human and properties
Impact on fish due to dam, dewatered stretch, impact on people dependent to fish
Socioeconomic and Cultural Environment
Deterioration of safety and security
Increase in ill social behavior (gambling, alcoholism, prostitution, girl trafficking)
Accidents and casualties
Emergence of new types of diseases
Disputes related to work, contracts, priority hiring etc
Impact on infrastructure due to influx of people
Constrains in local commodities supply and demand
In migration and change in demography
Cross-cultural Sensitivities – tentions and conflicts related to culture and traditions
VECs identified per FGD session
Outcomes of FGDs conducted at Mailung, Haku VDC
CEV
snnenmpmoc CEVCEV-snnenmpmoc Enmspom
lacisyhVCmeionmnpmo
yir aualitA C oiiunitA lealtla hisiiilitAa
eoise CoiiunitA lealtla disturiance to yildlife
yurface yater auantitA ylorta e of yater for yater suoolA ayater iillsa
irri ationa etcl aauatic life/fisla cultural and reli ious ouroose
yurface yater aualitA
oiiunitA lealtla aauatic lifea reli ious and soritual uses
rroundyater Drying of spring water sources lying in tunnel alignment
nandslide/erosion and sediientation
nforied/oiserhed tlat tle ylole area is erosion/landslide oronel rle construction of infrastructure for iaA tri er egistin landslidea and iaA create ney landslides/erosiona t iaA daia e to
infrastructures line roada landa canala lacns safetA of oeoole ylile trahellin a loss of a riculturea lousin structuresa sediient deoosition to eiher etcl
nand nse nand use clan e resultin to loss of oroductihe a ricultural landa landa oasture/ rass land etcl

APPENDIX D Cumulative Impact Assessment- Upper Trishuli-1 Hydropower Project
8 1 |
CEV
snnenmpmoc CEVCEV-snnenmpmoc Enmspom
inhngisyhVCmeionmnpmo
fisl and fisl laiitats ecline in tle fisl oooulationa furtler decline of tle locallA halued fisles due to interhentions
rerrestrial ncosAstei//e etation
noss of olants odue to land acauistiona sooil deoositiona iioact of oollutiiona lacn /inadeauate holuie of irri ation yatera loss of forested ecosAstei ylicl is alreadA dyindlin noss of iedicinal olants ostudA liiiteda
traditinal nnoyled e iase erodin a oher larhestin and ille al larhestin on rise
ildlife and ildlife saiitats
saiitats alreadA fra iented and yildlife are declinin l
Cnsin-psnmnnisVymcVEEhoEoyhVCmeionmnpmoV
yocio-econoiic
noss of land for dehelooient iA oroeects las a serious iiolication on tle local food securitA aoart froi relaiilitation and resettlient of tle affected oeoolel etler concerns are:
nflug of laiors in oroeects and iioact on infras tructuresa iiolication on tle serhice facilities –
yater suoolAa lealtla educationa etc iolication on lay and order iolication on coiiunitA lealtl – occurenace of
unnonyn ney diseases ncrease in ill social oractices/ielahior o aiilii a
alclolisia orosititution etco ncrease orice of coiioditiesl Cross-cultural Sensitivities – tentions and conflicts
related to culture and traditions
Outcomes of FGD conducted at Thade, Ward no 1: Ramche VDC
CEV
snnenmpmoc CEVCEV-snnenmpmoc Enmspom
Physical Environment
yurface yater Reduced flow of water in dewatered section will have climatic effect on people and ecosystem (people won’t get cool breeze)
yurface yater auantitA ylorta e of yater for consuiotihe and non consuiotihe users
rroundyater Drying of spring water sources lying in tunnel alignment and its vicinity
nandslide/erosion and sediientation
rle area is landslide oronea iaA create casulties and daia e to orooertiesl rle construction of roadsa otler oroeect actihitiesa and use of leahA eauioient iaA tri er landslides in tle oroeect influence areasl
Pollution Air, noise, water and soil pollution, impact on agricultural land due to spoil deposit to loss of oroductihe a ricultural land
Water use (D/S) Impact on agricultural land irrigated through Trishuli River in dewatered stretch, impact on water mills
nand nse nand use clan e resultin to loss of oroductihe a ricultural landa landa oasture/ rass land etcl

ESSA Technologies Ltd.
8 2 |
CEVsnnenmpmoc
CEVCEV-snnenmpmoc Enmspom
inhngisyhVCmeionmnpmo
rerrestrial ncosAstei//e etation
- Pressure on forest and more deforestation - Ecological imbalances in d/s of dam - noss of olants odue to land use clan e a sooil
deoositiona iioact of oollutiiona lacn /inadeauate holuie of irri ation yatera loss of forested ecosAstei ylicl is alreadA dyindlin a loss of haluaile olants o line iedicinal )l
- eeduciton of razin landa foddera and iioact on lihestocn oroduction
-
ildlife and ildlife saiitats
saiitats alreadA fra iented and yildlife are declinin a clances of yildlife enterin tle settleient due to construction of oassa e oirid e) oher tle eiher and deforestationl
fisl and fisl laiitats ioact on fisl due to dai construciton and iioact due to deyatered zone
Cnsin-psnmnnisVymcVEEhoEoyhVCmeionmnpmoV
yocio-econoiic
Illegal harvesting and trade of medicinal plants, valuable herbs, contraband items due to accessibility and influx of people.
Likely exploitation of children and women
noss of land for dehelooient iA oroeects las a serious iiolication on tle local food securitA aoart froi relaiilitation and resettlient of tle affected oeoolel
iolication on coiiunitA lealtl – occurenace of unnonyn ney diseases el diseases caused iA iosauito iite and coiiunicatile diseases
nflug of laiors in oroeects and iioact on infrastructuresa iiolication on tle serhice facilities – yater suoolAa lealtla educationa etc
iolication on lay and order
ncrease in ill social oractices/ielahior o aiilii a alclolisia orosititution etc)
• ncrease orice of coiiodities ioact on local infrastructures due to influg of oeoole
froi outsidel eutside effects on traditional oracticesa ieliefa culture of
raiana coiiuitA oiaeore etlinic rouo in tle coiiunitA) and clances of identitA crisis in later sta es
Social conflicts

APPENDIX D Cumulative Impact Assessment- Upper Trishuli-1 Hydropower Project
8 3 |
Outcomes of FGD at Haku Besi, Haku VDC
CEVsnnenmpmoc
CEVCEV-snnenmpmoc Enmspom
Physical Environment
rroundyater Drying of spring water sources lying in tunnel alignment and its vicinity
Landslides/erosion
The project influence area is situated in old landslides; this may trigger due to project related construction activities. There is a possibility of wash out of houses/community structures by landside debris during construction
Drying up of spring sources
Due to construction of tunnel, the spring sources lying in tunnel alignment may dried up
Earthquake This is very uncertain and if occurred, there will be more devastation.
Land
Agricultural and other land use will be reduced resulting in loss of productivity and unavailability of land for future planning and rational use even if required in future. There will be non-availability of land even for graveyard.
nandslide/erosion and sediientation
rle area is landslide oronea ii lt lahe li l risn to luian and orooertAl
Pollution Air, noise, water and soil pollution, impact on agricultural land due to spoil deposit to loss of oroductihe a ricultural land
Water supply As there is limited source of water, the drying of springs and influx of people will have water scarcity in the area
nand nse nand use clan e resultin to loss of oroductihe a ricultural landa landa oasture/ rass land etcl
inhngisyhVCmeionmnpmo
rerrestrial ncosAstei//e etation
- Loss of NTFP and chances of promotion of illegal trading of such items
- Fragmentation of forest, deterioration of forest quality, Pressure on forest and more deforestation,
- noss of olants odue to land use clan e a sooil deoositiona iioact of oollutiiona lacn /inadeauate holuie of irri ation yatera loss of forested ecosAstei ylicl is alreadA dyindlin a loss of haluaile olants o line iedicinal )l
- eeduciton of razin landa foddera and iioact on lihestocn oroduction
ildlife and ildlife saiitats
saiitats alreadA fra iented and yildlife are declinin a clances of yildlife enterin tle settleient due to construction of oassa e oirid e) oher tle eiher and deforestationl
- Risk of attacks by wild animals to humans and domestic animals
- Impacts on crops due to wild animals
fisl and fisl laiitats
ioact on fisl due to dai construciton and iioact due to deyatered zonea non ahailaiilitA of fisl as a suooleientarA foodl
Cnsin-psnmnnisVymcV
yocio-econoiic Possibilities due to casualties (more road accidents and
other casualties) and natural calamities will be high in

ESSA Technologies Ltd.
8 4 |
CEVsnnenmpmoc
CEVCEV-snnenmpmoc Enmspom
EEhoEoyhVCmeionmnpmoV
project influenced area as compared to other region.
Demand for share in hydropower projects for local people like offered by Chilime Hydropower Project.
Shortage of labor, disparity in wages
Shortage of water and create water scarcity and may invite sanitation problems
Illegal harvesting and trade of medicinal plants, valuable herbs, contraband items due to accessibility and influx of people.
Price of locally produced commodities (organic vegetable, crops, livestock )will increase and imported and impure products will dominate the market
Non availability of agricultural land/limited agricultural land will have impact on food security
ncrease in ill social oractices/ielahior o aiilii a alclolisia orosititution etc)
Deteriorate safety and security in hydropower project influenced areas.
Outcomes of FGD Conducted at Office of District Development Committee, Dhunche
VDC
CEVsnnenmpmoc
CEVCEV-snnenmpmoc Enmspom
Physical Environment
Disaster Many types of project induced disasters like landslides, fire etc (with high probability of risk), and associated natural calamities
rroundyater Drying of spring water sources lying in tunnel alignment and its vicinity
D/S release
D/S release must be quantified and ensured. The D/S release during the festivals and special religious days should be enough to meet such religious demands even during dry season.
Muck/Debris
Due to lack of land muck and debris management is a big issue in hydropower projects in Trishuli basin so muck is not managed properly. Improper dumping has caused impact on land, River.
Drying up of spring sources
Due to construction of tunnel, the spring sources lying in tunnel alignment may dry up
Land Availability
Agricultural and other land use will be reduced resulting in loss of productivity and unavailability of land for future planning and rational use even if required in future. There will be non availability of land even for needful purpose in future.
yediientation in eiher ue to oroeect related actihities and landslidesa tle sediient load in eiher iaA increase
Pollution Air, noise, solid waste (including toxic waste) , water and soil pollution, impact on agricultural land due to spoil deposit to loss of oroductihe a ricultural land

APPENDIX D Cumulative Impact Assessment- Upper Trishuli-1 Hydropower Project
8 5 |
CEVsnnenmpmoc
CEVCEV-snnenmpmoc Enmspom
Water supply
As there is limited source of water, the drying of springs and influx of people will have water scarcity in the area and in district headquarter like Dhunche and nearby small towns/settlements
nand nse nand use clan e resultin to loss of oroductihe a ricultural landa landa oasture/ rass land etcl
inhngisyhVCmeionmnpmo
Impact on Langtang National Park (LNP)
- The hydropower projects in vicinity of LNP may have direct impact. Previously the River was protecting the national park, now due to construction of bridges and roads, the people have direct access to the national park and possibility of encroachment and other illegal activities will be high.
- Need more pressure and resources for security due to increased mobility of people and associated risks
Community Forestry
- Due establishment of hydropower project facilities, the resources of community forestry are cleared (trees, NTFPs etc)
- The people dependent to community forestry for the resources will deprive from such facilities, so an alternative means for fuel and fodder should be arranged.
- Deteriorate security of community forest due to mobility of people and vehicles of hydropower projects
rerrestrial ncosAstei//e etation
- Loss of tress and vegetation (huge number of trees needs to be chopped in hydropower projects, in many instances more trees than predicted in EIA were found removed during the construction). Even there is a tendency to show less number of trees to be cut during EIA stage and later during implementation stage actual required is more than that predicted earlier.
- Deforestation due to influx of people, poor monitoring and control by the hydropower project
- Illegal harvesting and trading of forest products
ildlife and ildlife saiitats
saiitats alreadA fra iented and yildlife are declinin a clances of yildlife enterin tle settleient due to construction of oassa e oirid e) oher tle eiher and deforestationl
•
fisl and fisl laiitats
ioact on fisl due to dai construciton and iioact due to deyatered zonea decline/egtinction of certain fisl soeciesl
Cnsin-psnmnnisVymcVEEhoEoyhVCmeionmnpmoV
yocio-econoiic
- Demand for shares in hydropower projects by local affected people of the VDC/district
- Disputes related to contracts, jobs, and associated activities
- Possibilities of more casualties (more road accidents and other casualties) and natural calamities will be high in project influenced area as compared to other region.
- Shortage of labor, disparity in wages
- Shortage of water and create water scarcity and may invite sanitation problems

ESSA Technologies Ltd.
8 6 |
CEVsnnenmpmoc
CEVCEV-snnenmpmoc Enmspom
- Illegal harvesting and trade of medicinal plants, valuable herbs, contraband items due to accessibility and influx of people.
- Price of locally produced commodities (organic vegetable, crops, livestock )will increase and imported and impure products will dominate the market
- Non availability of ag land/limited agricultural land will have impact on food security
ncrease in ill social oractices/ielahior o aiilii a alclolisia orosititutiona irl trafficnin etc)
Deteriorate safety and security in areas
Outcomes of FGD Conducted at Grang-3, Ramche VDC
CEVsnnenmpmoc
CEVCEV-snnenmpmoc Enmspom
Physical Environment
Landslides/Erosions The area is landslide prone, very unstable. The activities associated with hydropower projects may trigger issues related to landside
Drying up of springs The construction of tunnel may dry up spring sources lying in alignment and its vicinity
Land Issues related to less land availability/less land holding, less production, land fragmentation,
Spoil and muck management
Poor management of spoil and its impact on land, water, and forest
Infrastructures Infrastructures like road, buildings will create more disturbance to the natural settings resulting in disasters.
Pollution The hydropower project in region create more air, noise, soil pollutions in nearby settlements, vehicle in route to project and in project influenced areas.
Community Forestry
Due establishment of hydropower project facilities, the resources of community forestry are cleared (trees, NTFPs etc)
- The people dependent to community forestry for the resources will deprive from such facilities, so an alternative means for fuel and fodder should be arranged.
•
inhngisyhVCmeionmnpmo

APPENDIX D Cumulative Impact Assessment- Upper Trishuli-1 Hydropower Project
8 7 |
CEVsnnenmpmoc
CEVCEV-snnenmpmoc Enmspom
rerrestrial ncosAstei//e etation
- Loss of tress and vegetations due to project related activities,
- Forest fire due to increased mobility - Deforestation and illegal harvesting of tress and NTFP
from forest and national parks
ildlife and ildlife saiitats
- Loss of wildlife, habitat fragmentation •
fisl and fisl laiitats ioact on fisl due to dai construciton and non ahailaiiiltA of fisll
Cnsin-psnmnnisVymcVEEhoEoyhVCmeionmnpmoV
yocio-econoiic
Pressure on local infrastructure due to increase of people from outside.
Demand for shares in hydropower projects by local affected people of the VDC/district
Use of more inorganic products, fertilizers and pesticides (introduction of harmful chemicals in environment )to grow more in limited areas and for more production
Disputes related to contracts, jobs, and associated activities
Possibilities of more casualties (more road accidents and other casualties) and natural calamities will be high in project influenced area as compared to other region.
Non availability of ag land/limited agricultural land will have impact on food security
ncrease in ill social oractices/ielahior o aiilii a alclolisia orosititutiona irl trafficnin etc)
More hiolance and unrest in oroeet influenced areas •

ESSA Technologies Ltd.
8 8 |
List of participants in the FGDs
(District): Rasuwa (VDC): Haku (Ward No): 9 (Name o place): Mailung Besi (Date) 2070/10/11 (25 Jan 2014) S.N Name Address Age
1. Eeman Tamang Haku -9 21
2. Bhim Bahadur Kumal Bidur Municipality 5 52
3. Gonda Tamang Haku -2 40
4. Durga Bahadur Tamang Haku -9 35
5. Sunita Tamang Haku -9 27
6. Pancha Bahadur Tamang Haku -9 47
7. Man Bahadur Tamang Dada Gaun 7 45
8. Eenam Tamang Haku -9i 26
9. Bipana Tamang Haku -9 25
10. Shrijana Tamang Haku -9 29
11. Dhan Maya Tamang Haku -9 21
12. Om Bahadur Tamang Haku -9 24
13. Dawa Mingma Tamang Haku -9 24
14. Suku Maya Tamang Haku -9 44
15. Sabina Tamang Haku -7 20
16. Dawa Budhi Tamang Haku -9 23
17. Sherpa Tamang Haku -5 75
18. Birat man Tamang Haku -9 25
19. Bir Tamang Tamang Haku -9 30
20. Kripa Sanga Tamang Haku -9 38
21. Ganga Maya Tamang Haku -9 66
22. Shrijana Tamang Haku -9 25
(District): Rasuwa (VDC): Dhunche (Ward No): 1 and 2 (Name o place): Thade (Date) 2070/10/11 (25 Jan 2014) S.N Name Address Age
1. Kalu Tamang Dhunche-1 Thade 64
2. Dorje Tamang Dhunche-1 Thade 18
3. Dolma Ghale Dhunche-2 Thade 23
4. Lanam Ghale Dhunche -2 Thade 32
5. Nema Ghale Dhunche -2 Thade 30
6. Kamisa Ghale Dhunche -2 Thade 45
7. Mina Shrestha Dhunche -2 Thade 22
8. Ashmita Shrestha Dhunche -2Thade 20
9. Kami shekar Tamang Dhunche -1 Thade 22
10. Dawa Senam Tamang Dhunche -2 Thade 35
11. Santosh Ghale Dhunche -2 Thade 25
12. Rinchen Dawa Tamang Dhunche -1 Thade 45

APPENDIX D Cumulative Impact Assessment- Upper Trishuli-1 Hydropower Project
8 9 |
13. Urpaa Ghale Dhunche -2 Thade 30
14. Suku Ghale Dhunche -1 Thade 35
15. Dawa Gumfu Tamang Dhunche -1 Thade 26
16. Sonam Chiring Tamang Dhunche -1 Thade 28
17. Waisal Ghale Dhunche -1 Thade 60
18. Lama Larkhu Dhunche -1 Thade 22
19. Wang Jalbo Ghale Dhunche -1 Thade 45
20. Santa Bahadur Ghale Dhunche -2 Thade 28
21. Farphu Gyalfu Ghale Dhunche -1 Thade 70
22. Sonam Gyalfu Ghale Dhunche -1 Thade 21
23. Man Bahadur Ghale Dhunche -1 Thade 24
24. Bimal Ghale Dhunche -1 Thade 26
25. Butti Tamang Dhunche -1 Thade 46
26. Suku Tamang Dhunche -1 Thade 44
27. Wangcheng Tamang Dhunche -1 Thade 50
28. Lamanarfu Tamang Dhunche -2 Thade 16
29. Bishal Ghale Dhunche -1 Thade 15
30. Tenjing Ghalmu Ghale Dhunche -2 Thade 60
(District):Rasuwa (VDC): Haku (Ward No):3,2 (Name o place): Haku Besi and Sano Besi (Date) 2070/10/12, 26 Jan, 2014
S.N Name Address Age
1. Som Bahadur Tamang Haku-2 22
2. Nurup Sambo Tamang Haku-4 48
3. Puri Yelmu Haku-3 27
4. Pimba Tamang Haku-3 52
5. Faisam Tamang Haku-2 25
6. Furwa Tamang Haku-3 70
7. Buddha Maya Tamang Haku-3 29
8. Chirinh Devi Tamang Haku-3 22
9. Manjit Tamang Haku-3 24
10. Manmaya Tamang Haku-3 43
11. Buddhiman Tamang Haku-3 19
12. Lama Dorje Tamang Haku-3 28
13. Kep Chiring Tamang Haku-3 34
14. Nim Geljung Tamang Haku-3 60
15. Govinda Tamang Haku-3 14
16. Sherchawanga Tamang Haku-3 18
17. Dawa Tamang Haku-3 48
18. Didtha Tamang Haku-3 54
19. Sangamendo Tamang Haku-3 25
20. Buddha Tamang Haku-3 18
21. Milan Tamang Haku-2 19
22. Falam Tamang Haku-3 50
23. Faichiring Tamang Haku-3 60

ESSA Technologies Ltd.
9 0 |
S.N Name Address Age
24. Sonam Tamang Haku-3 23
25. Kami Tamang Haku-3 60
26. Upendra Tamang Haku-3 38
27. Dawa Kesung Tamang Haku-3 39
28. Nima Kesung Tamang Haku-3 37
29. Nimgel Tamang Haku-3 60
30. Laji Sangwa Tamang Haku-3 48
31. Sonam Tamang Haku-3 33
32. Mendo Tamang Haku-3 42
33. Gyanghing Tamang Haku-3 48
34. Chiring Dolma Tamang Haku-3 30
35. Sangh Buddhi Tamang Haku-3 26
36. Budhi devi Tamang Haku-3 20
37. Chingwangomo Tamang Haku-3 21
38. Kami Dolmo Tamang Haku-3 22
39. Mijong Tamang Haku-3 34
40. Namin Tamang Haku-3 45
41. Mindo sang Tamang Haku-3 41
42. Nima Yangiching Tamang Haku-3 38
43. Dawa sambo Tamang Haku-3 42
44. Chimpu Tamang Haku-3 50
45. Sano Chimpu Haku-3 53
46. Wang Rasi Tamang Haku-3 39
47. Dawa Lama Haku-3 70
48. Sango B.Ka Haku-3 80
49. Suk Bahadur B.Ka Haku-3 35
50. Kamini Tamang Haku-3 20
(District):Rasuwa (VDC): Dhunche (Ward No): 5 (Name o place): Dhunche DDC Building (Date) 2070/10/13, (27 January, 2014)
S.N Name Address Age
1. Punya Prasad Poudel District Forest office 36
2. Keshav Chanda Lal Das 54
3. Binod kumar Poudel FECOFUN-Rasuwa 30
4. Nalraj Adhikari DDC 40
5. Basudev Neuapne Nepal agricultural Council 36
6. Sukdev Gautam Gharelu Samitti 38
7. Mukti Ghimire Nepal Redcross 35
8. Bodhraj Baral Agriculture Investigation
Centre
34
9. Yogendra Yadav 50
10. Bhisma Bahadur Basnet District Agricultural
development Office
Rasuwa
30
11. Sandhu Regmi DDC-Rasuwa 26

APPENDIX D Cumulative Impact Assessment- Upper Trishuli-1 Hydropower Project
9 1 |
S.N Name Address Age
12. Prem Bahadur Basnet District administration
Office
45
13. Sarswoti Neupane Journalist Trishuli
Prabaha
23
14. Sandhya Rajeshwori Singh Women and Children
Office-Rasuwa
50
15. Shiv Kumar Parajuli 35
16. Tir Bahadur Gurung Nepali Congress-Rasuwa
17. Dhurbaraj Paneru Land Revenue office 55
18. Gautam Rimal District Administration 34
19. Shan Raj Pandey District Development
Committee
49
20. Rajendra Prasad Niroula District Forest Office 52
21. Bishnu Prasad Acharya NGO Fed-Rasuwa 35
22. Ramesh Basnet 42
23. Hemshankar Bastola 39
24. Lal Bahadur Aale Dimega-Rasuwa 31
25. Thakindraraj Dahal Saramthali VDC 34
26. Ganga Devi Sunar Ramche and Haku 30
27. Subash Poudel VDC Secretary 32
28. Uttam Kumar Katuwal Chilime VDC Secretary 40
29. Dr.Ramesh kumar kharel District Health Office 50
30. Anurag Trivedi District Administration
Office
31. Deepak Kumar shrestha Brabal Barack 35
32. Om Raj Dhungana District Administration
Office
42
33. Pisang Nupung Tamang 25
34. Dawa Tasi Tamang 37
35. Manoj Bhusal 25
(District): Rasuwa (VDC): Ramche (Ward No): 3 (Name o place): Grang (Date) 2070/10/13 (27 Jan 2014) S.N Name Address Age
1. Sete Tamang Ramche -3 40
2. Risang Lotcheng Ramche-3 56
3. Ralpa Sangwa Ramche-3 30
4. Kami Sedar Tamang Ramche-3 30
5. Mendu Tamang Ramche-3 30
6. Pemba Tamang Ramche-3 27
7. Kancha Tamang Ramche-3 55
8. Lawang Mindro Ramche -3 45
9. Mindir Wang Ramche -3 55
10. Anggi Tamang Ramche -3 35
11. Temba Sherpa Ramche -3 55

ESSA Technologies Ltd.
9 2 |
12. Minam Buchhi Ramche -3 35
13. Sahilee Tamang Ramche -3 50
14. Chesang Tamang Ramche -3 80
15. Nirpu Lopche Tamang Ramche -3 55
16. Asang Kripa Tamang Ramche -3 70
17. Sete Lopchen Tamang Ramche -3 35

APPENDIX D Cumulative Impacts Assessment- Upper Trishuli-1 Hydropower Project
9 3 |
Annex 3: Spatial indicators of cumulative impacts
Pressure Indicators for the VEC ‘Water Resources’
Figure A3-1: River length under reduced flow for Scenarios 1 (above) and 2 (below)

ESSA Technologies Ltd.
9 4 |
Figure A3-2: Presence of settlements (water users) within the concession areas under Scenarios 1 (above) and 2 (below)

APPENDIX D Cumulative Impacts Assessment- Upper Trishuli-1 Hydropower Project
9 5 |
Pressure Indicators for the VEC ‘Fish and Aquatic Habitats’
Figure A3-3: Stream cross density under Scenarios 1 (above) and 2 (below)
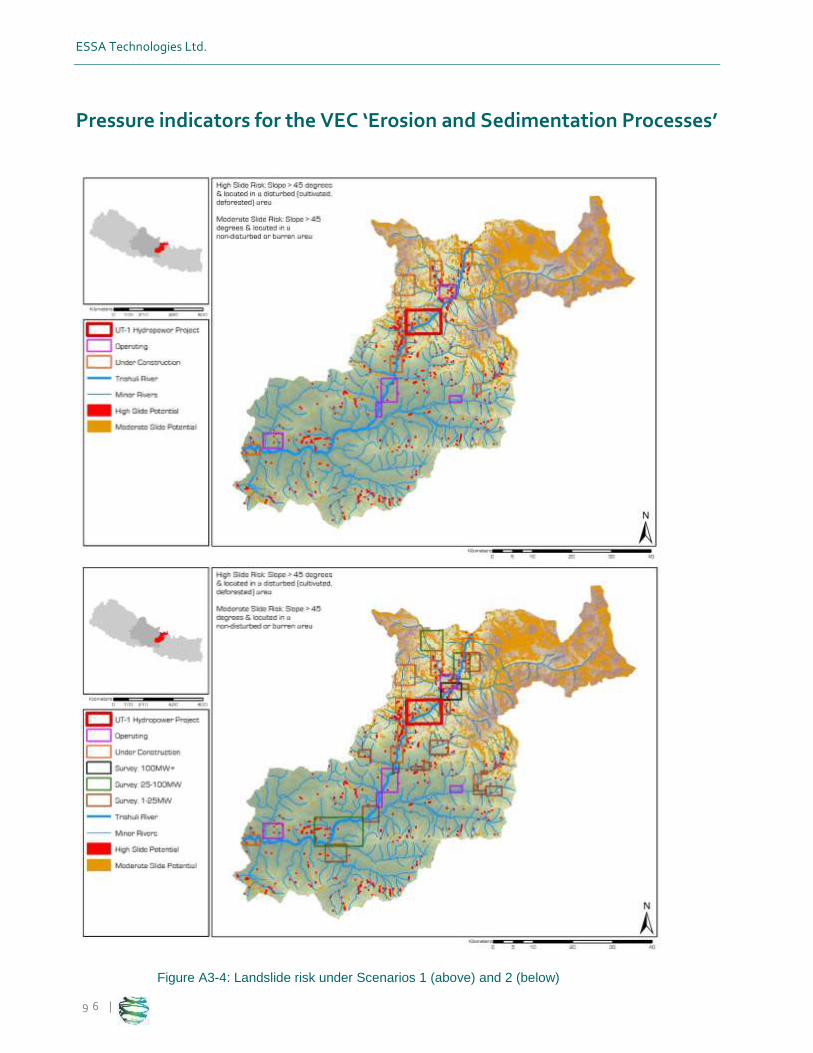
ESSA Technologies Ltd.
9 6 |
Pressure indicators for the VEC ‘Erosion and Sedimentation Processes’
Figure A3-4: Landslide risk under Scenarios 1 (above) and 2 (below)

APPENDIX D Cumulative Impacts Assessment- Upper Trishuli-1 Hydropower Project
9 7 |
Figure A3-5: Roads network and unstable slope under Scenarios 1 (above) and 2 (below)

ESSA Technologies Ltd.
9 8 |
Pressure indicators for the VEC ‘Terrestrial Habitats’
Figure A3-6: Encroachment on protected areas under Scenarios 1 (above) and 2 (below)

APPENDIX D Cumulative Impacts Assessment- Upper Trishuli-1 Hydropower Project
9 9 |
Figure A3-7: Pressure on forest land under Scenario 1 (above) and Scenario 2 (below)

ESSA Technologies Ltd.
1 0 0 |
Pressure indicators for the VEC ‘Use of Natural Resources’
Figure A3-8: Land uses under within concession areas under Scenario 1 (above) and 2 (below).
(Note: Only agricultural and forest land use haven considered for the evaluation of pressures on this VEC)

APPENDIX D Cumulative Impacts Assessment- Upper Trishuli-1 Hydropower Project
1 0 1 |
Pressure indicators for the VEC ‘Cultural and Religious Sites’
Figure A3-9: Presence of cultural/religious sites under Scenarios 1 (above) and 2 (below)
ESSA Technologies Ltd.
1 0 2 |
Appendix D: Final Report
Top Related