


Languages
Pages
Legal


Government of Karnataka
ANNUAL PLAN 2011 – 12
22nd March 2011

Eleventh Plan – Sector‐wise (Rs. crore)
Sector Outlay Anti. Expdr.
%
Water Supply, Housing & UD 21830 18943 86.8
Irrigation 14795 16672 112.7
Transport 12959 15321 118.2
Energy 10051 14498 144.3
Education 8412 9721 115.6
Health 3376 3865 114.5
Rural Development 5200 4648 89.4
Agri.& Allied Sectors 7688 8418 109.5
Total 101664 114005 112.1
2

Eleventh Plan – Overall
Year Outlay ExpenditureCurrent Prices
ConstantPrices
2007‐08 17782.58 17226.89 16352.06
2008‐09 26188.53 22576.75 19995.35
2009‐10 29500.00 26944.00 22981.92
2010‐11 31050.00 31050.00 25223.402011‐12 38070.00 38070.00 29453.41
3
* Likely to achieve Rs.114006 cr. Vs Rs.101664 cr. ‐ 112%
* Achievement ‐ Ninth Plan: 112%, Tenth Plan: 119%
2011‐12: 41.2% increase over 2009‐10 Accts & 22.6% increase over 2010–11
28.9% of 11th Plan Outlay (at 2006 – 07 prices)
(Rs.crore)

Financing of the Annual Plans 2010‐11 and 2011‐12(Rs.crore)
4
1286
1
1003
9
2799
5351
3105
0
1590
6
1247
5
3917
5772
3807
0
0
5000
10000
15000
20000
25000
30000
35000
40000
States Own Resources
State's Borrowings
Central Asiistance
IEBR Total
10‐11' AP
11‐12' BE
+3045(23.7%) +2436
(24.3%)
+1119(39.9%)
+421(7.9%)
+7020(22.6%)

Assumptions and Financing of Annual Plan 2011‐12 Outlay
Plan Revenue Expenditure Rs. 16,821 Cr. (44%)
Plan Capital Expenditure Rs. 21,249 Cr. (56%)
Fiscal Deficit – Rs. 12481 Cr. (2.87% of GSDP)
Revenue Surplus – Rs. 1279 Cr.(0.29% of GSDP)
Tax‐GSDP Ratio‐10.09
B.C.R – Rs.15159 crore
Interest payment to Revenue Receipts – 10.48%.
5
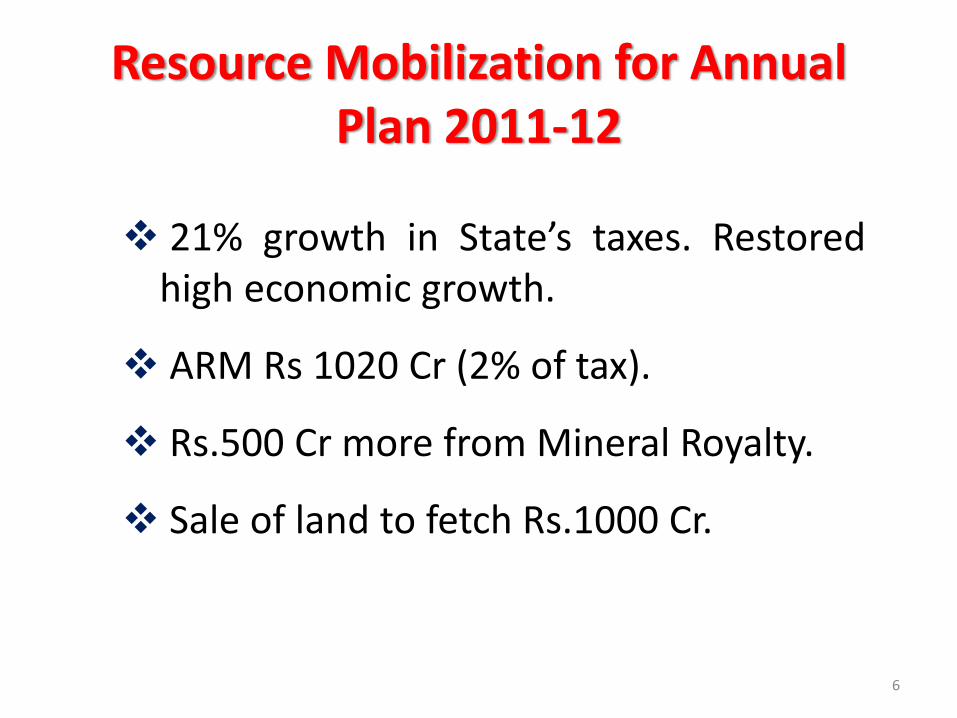
Resource Mobilization for Annual Plan 2011‐12
21% growth in State’s taxes. Restoredhigh economic growth.
ARM Rs 1020 Cr (2% of tax).
Rs.500 Cr more from Mineral Royalty.
Sale of land to fetch Rs.1000 Cr.
6
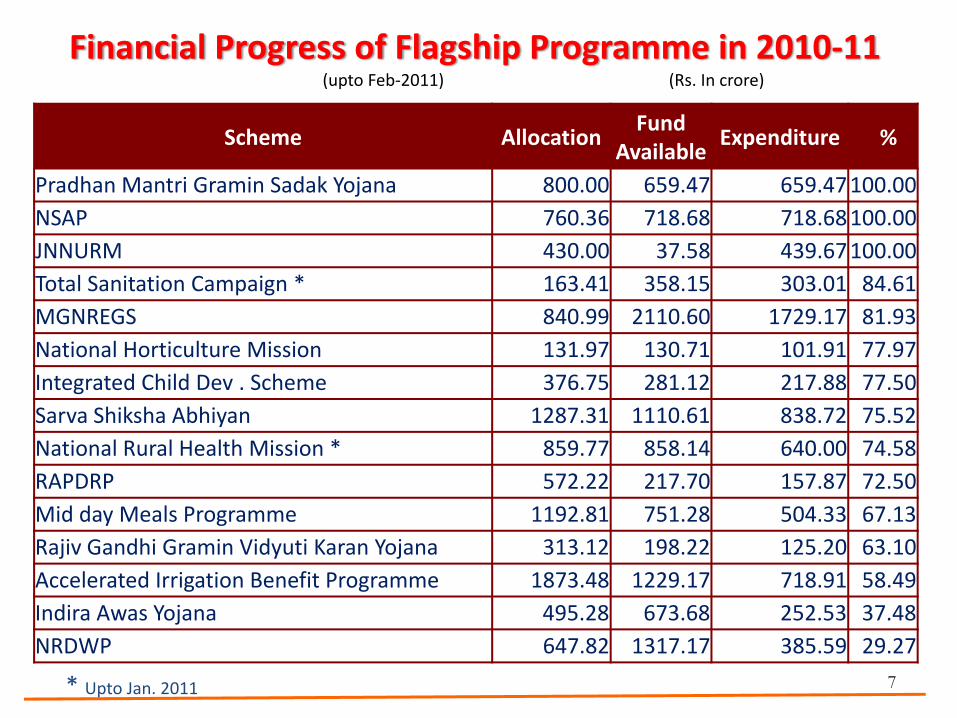
Financial Progress of Flagship Programme in 2010‐11(upto Feb‐2011) (Rs. In crore)
7
Scheme Allocation Fund
AvailableExpenditure %
Pradhan Mantri Gramin Sadak Yojana 800.00 659.47 659.47100.00NSAP 760.36 718.68 718.68100.00JNNURM 430.00 37.58 439.67100.00Total Sanitation Campaign * 163.41 358.15 303.01 84.61MGNREGS 840.99 2110.60 1729.17 81.93National Horticulture Mission 131.97 130.71 101.91 77.97Integrated Child Dev . Scheme 376.75 281.12 217.88 77.50Sarva Shiksha Abhiyan 1287.31 1110.61 838.72 75.52National Rural Health Mission * 859.77 858.14 640.00 74.58RAPDRP 572.22 217.70 157.87 72.50Mid day Meals Programme 1192.81 751.28 504.33 67.13Rajiv Gandhi Gramin Vidyuti Karan Yojana 313.12 198.22 125.20 63.10Accelerated Irrigation Benefit Programme 1873.48 1229.17 718.91 58.49Indira Awas Yojana 495.28 673.68 252.53 37.48NRDWP 647.82 1317.17 385.59 29.27
* Upto Jan. 2011

Agriculture & allied
1st ever separate Agriculture Budget : Rs.17,857 Cr.
Food grain production 125 lakh Tons
Agri loan @ 1%, Micronutrient suppliment (Bhoochethana 30 Lakh Ha.)
Suvarna Bhoomi Rs.1000 Cr (10 Lakh farmers)
Agribusiness policy, Global Agro‐Investor’s meet.
Biofuel Policy, Taskforce, Board.
Seed, fertilizer, power subsidy, Minimum support price
Organic farming & Education loan to farmer’s children
8
Horticulture area extension 19.2 to 25 lakh Ha.
Drip irrigation.
Incentive to milk production.
Qualified technical manpower. University,Diploma courses.
GOI Assistance sought:
Minimum support price: Arecanut, Oilpalm,Copra.
Reconsider import duty: Oilpalm, Silk.
9
Agriculture & allied (contd.)
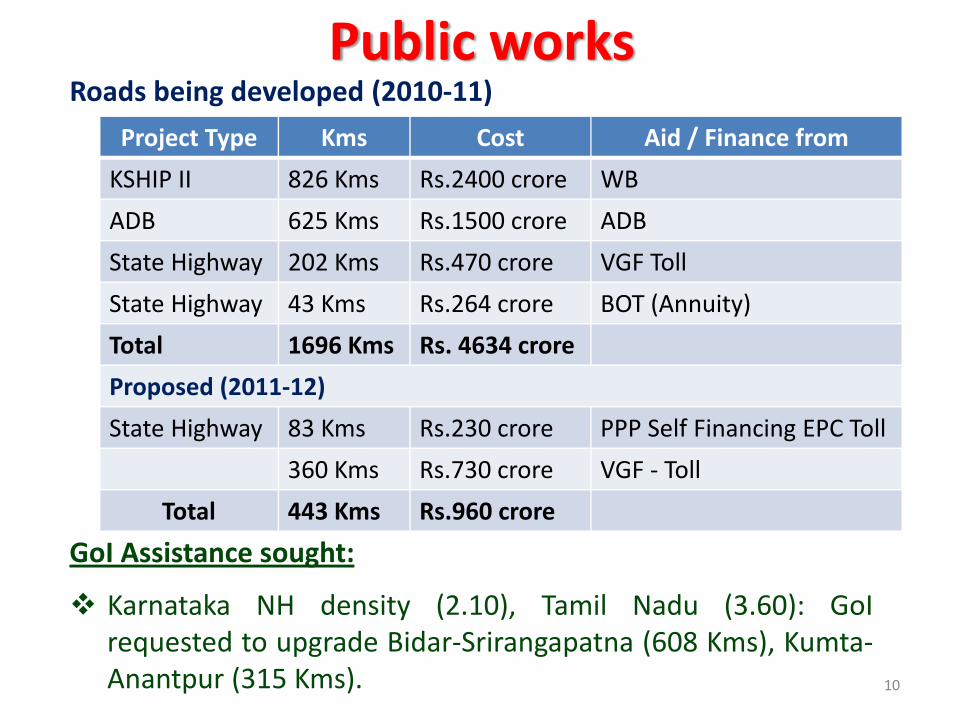
Roads being developed (2010‐11)
GoI Assistance sought:
Karnataka NH density (2.10), Tamil Nadu (3.60): GoIrequested to upgrade Bidar‐Srirangapatna (608 Kms), Kumta‐Anantpur (315 Kms). 10
Public works
Project Type Kms Cost Aid / Finance from
KSHIP II 826 Kms Rs.2400 crore WB
ADB 625 Kms Rs.1500 crore ADB
State Highway 202 Kms Rs.470 crore VGF Toll
State Highway 43 Kms Rs.264 crore BOT (Annuity)
Total 1696 Kms Rs. 4634 crore
Proposed (2011‐12)
State Highway 83 Kms Rs.230 crore PPP Self Financing EPC Toll
360 Kms Rs.730 crore VGF ‐ Toll
Total 443 Kms Rs.960 crore

InfrastructureVision to have 32 Kms. of rail density(presently 16.8 Kms.)
Name of the Project Length‐Km State Govt. Share
1 Bagalkot‐Kudachi 142 50:50
2 Shimoga‐Harihara 84 50:50
3 Whitefield‐Kolar 52 50:50
4 Gadag‐Haveri 84 50:50
5 Tumkur‐Davangere 210 50:50
6 Talaguppa‐Honnavara 83 PPP
7 Bijapur‐Shahabad 140 PPP
8 Dharwad‐Belgaum 97 PPP
9 Hubli‐Ankola 160 PPP
11
PPP projects (Rs.1,00,000 crore) involving monorail,airports, food parks, tourism planned.
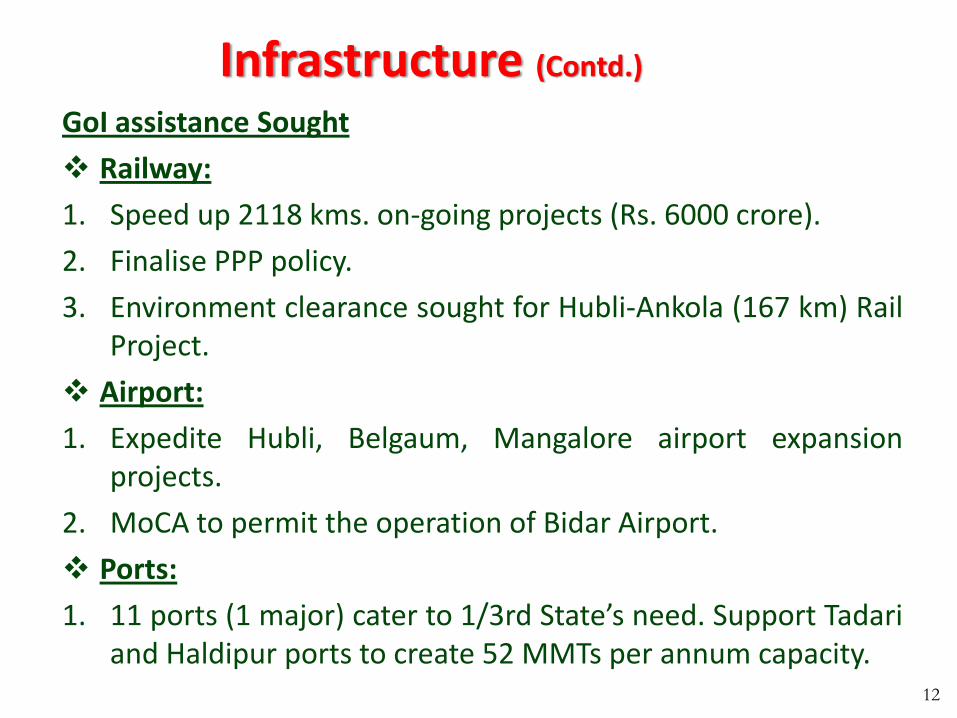
Infrastructure (Contd.)GoI assistance Sought
Railway:
1. Speed up 2118 kms. on‐going projects (Rs. 6000 crore).
2. Finalise PPP policy.
3. Environment clearance sought for Hubli‐Ankola (167 km) RailProject.
Airport:
1. Expedite Hubli, Belgaum, Mangalore airport expansionprojects.
2. MoCA to permit the operation of Bidar Airport.
Ports:
1. 11 ports (1 major) cater to 1/3rd State’s need. Support Tadariand Haldipur ports to create 52 MMTs per annum capacity.
12

Weaker sections provided: Residential School (70,000Students, Hostel (4.5 lakhs) students
Housing & Infrastructure by pooling fund (Rs.1000 Cr.)
5.5 lakhs helped under SCP/TSP allocation: 2011‐12 (Rs.6500crore). Rs.1086 crore provided for BC welfare.
GoI Assistance sought:
Enhance income limit for post metric scholarship for ST &OBC.
Drop committed liability clause in Post metric scholarship
50% assistance to finance irrigation schemes of SC / ST.
100% grant for Boys’ Hostel construction (as for Girls).
13
Social Welfare
14
Action Taken Report on the points made by
Hon’ble Deputy ChairmanPlanning Commission
in his letter to Hon’ble Chief Minister
1515
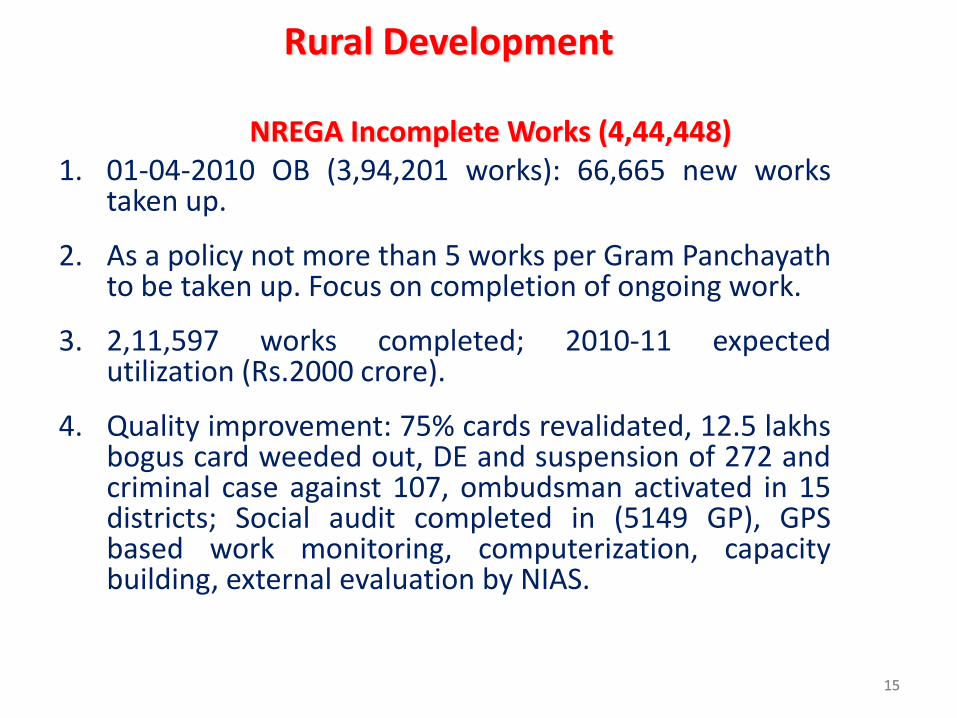
NREGA Incomplete Works (4,44,448)1. 01‐04‐2010 OB (3,94,201 works): 66,665 new works
taken up.
2. As a policy not more than 5 works per Gram Panchayathto be taken up. Focus on completion of ongoing work.
3. 2,11,597 works completed; 2010‐11 expectedutilization (Rs.2000 crore).
4. Quality improvement: 75% cards revalidated, 12.5 lakhsbogus card weeded out, DE and suspension of 272 andcriminal case against 107, ombudsman activated in 15districts; Social audit completed in (5149 GP), GPSbased work monitoring, computerization, capacitybuilding, external evaluation by NIAS.
Rural Development
1616
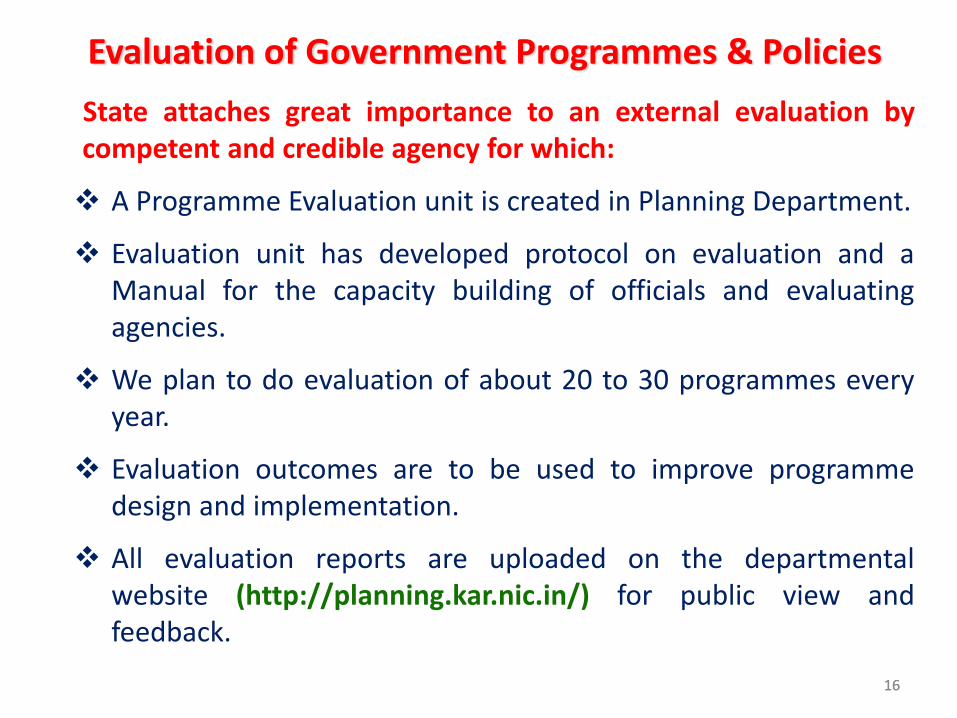
State attaches great importance to an external evaluation bycompetent and credible agency for which:
A Programme Evaluation unit is created in Planning Department.
Evaluation unit has developed protocol on evaluation and aManual for the capacity building of officials and evaluatingagencies.
We plan to do evaluation of about 20 to 30 programmes everyyear.
Evaluation outcomes are to be used to improve programmedesign and implementation.
All evaluation reports are uploaded on the departmentalwebsite (http://planning.kar.nic.in/) for public view andfeedback.
Evaluation of Government Programmes & Policies
1717
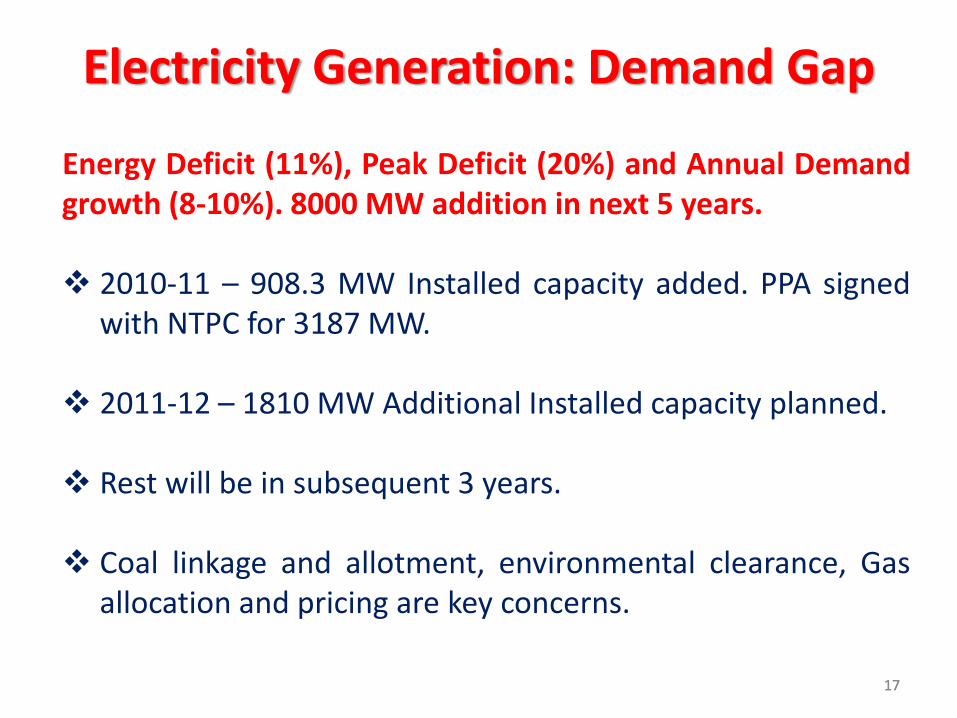
Energy Deficit (11%), Peak Deficit (20%) and Annual Demandgrowth (8‐10%). 8000 MW addition in next 5 years.
2010‐11 – 908.3 MW Installed capacity added. PPA signedwith NTPC for 3187 MW.
2011‐12 – 1810 MW Additional Installed capacity planned.
Rest will be in subsequent 3 years.
Coal linkage and allotment, environmental clearance, Gasallocation and pricing are key concerns.
Electricity Generation: Demand Gap

1818
Not focused on most needy, small and marginal farmers
Power subsidy to upto 10 HP pumps.
National political consensus required on the issue.
High T & D loss and Feeder separation:
Continuous consistent decrease year after year. 23.18%(2009‐10).
Capex 4,241 crore in 2010‐11 focussed on removingsystem constraints.
Agriculture & Rural feeder separation for loss reductionand Energy accounting in 2 phase (Niranthara Jyothi).
Phase‐I ‐ 70 blocks, 927 feeders (Rs.1203 crore)completion March 2011.
Power Subsidy to agriculture

1919
Phase‐II ‐ 56 blocks, 687 feeders (Rs.920 crore) completionMarch 2012.
Improved metering, Intensive energy audit, remotereading, census of unmetered & subsidized installation.
Vigorous implementation of Anti theft law.
RAPDRP Part A (Rs.469.00 crore): IT initiative to detecttheft (energy audit), Computerized billing, Part BRenovation, modernization and strengthening network byreconductoring 11 KV lines.
Bangalore Distribution upgradation (Rs.563 crore) JBICautomation and system strengthening.
Power Subsidy to agriculture (contd.)
2020
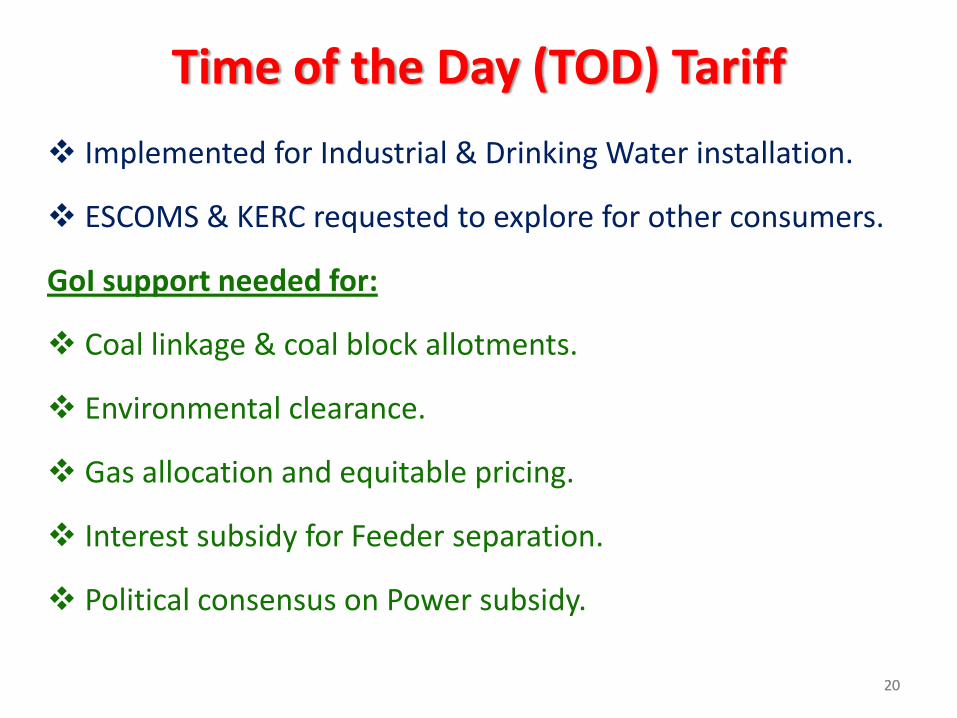
Implemented for Industrial & Drinking Water installation.
ESCOMS & KERC requested to explore for other consumers.
GoI support needed for:
Coal linkage & coal block allotments.
Environmental clearance.
Gas allocation and equitable pricing.
Interest subsidy for Feeder separation.
Political consensus on Power subsidy.
Time of the Day (TOD) Tariff
2121
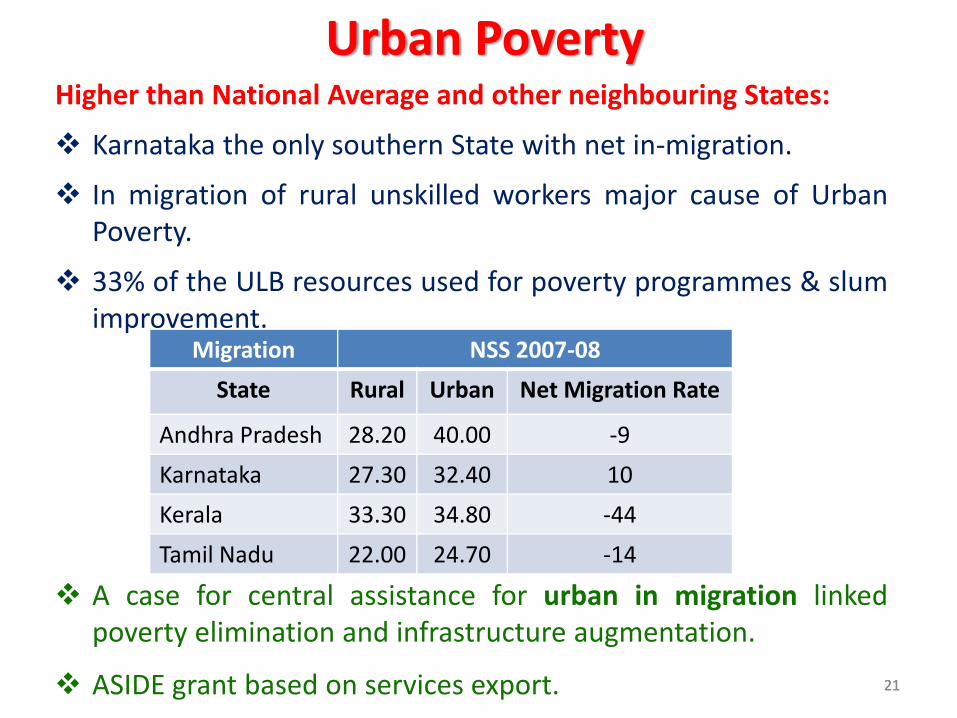
Higher than National Average and other neighbouring States:
Karnataka the only southern State with net in‐migration.
In migration of rural unskilled workers major cause of UrbanPoverty.
33% of the ULB resources used for poverty programmes & slumimprovement.
A case for central assistance for urban in migration linkedpoverty elimination and infrastructure augmentation.
ASIDE grant based on services export.
Urban Poverty
Migration NSS 2007‐08
State Rural Urban Net Migration Rate
Andhra Pradesh 28.20 40.00 ‐9
Karnataka 27.30 32.40 10
Kerala 33.30 34.80 ‐44
Tamil Nadu 22.00 24.70 ‐14

2222
Poverty reduction measures unsuccessful, 60% State’s poor inNorth Karnataka, 48 Talukas (30 in North Karnataka) havingabject poverty. Regional variance per capita income Rs.7861 ‐Bidar, Rs.24623 – Kodagu (1997‐98).
Beneficiary oriented programmes reached to 1.84 croreindividuals spending Rs.7,449 crore in 2010‐11.
Includes BPL food subsidy, Social Security Pensions, Agriculturesubsidy.
NREG benefits reached to 33.10 lakh families in 2009‐10.Average Agri wage increased and wage gender differentialdecreased.
No social or economic unrest. Naxalism under control,surrenders indicate absence of discontent & abject poverty.
Poverty in Karnataka

2323
Employment exchange registration decreased by 9.41% in last1 year. Employable Skill development intensified.
971.05 lakh mandays generated under different programmesin 2009‐10.
Higher SCP / TSP pooling & utilization focussed on weakersections. 70,000 students in Residential School, 4.5 lakh inhostel.
SDP and other policy like differential incentives to industry forRegional balance.
Increased agriculture and infrastructure investments plannedwill propel GSDP growth to 9 to 10% and have mitigatingimpact on poverty.
Poverty in Karnataka (contd.)
2424
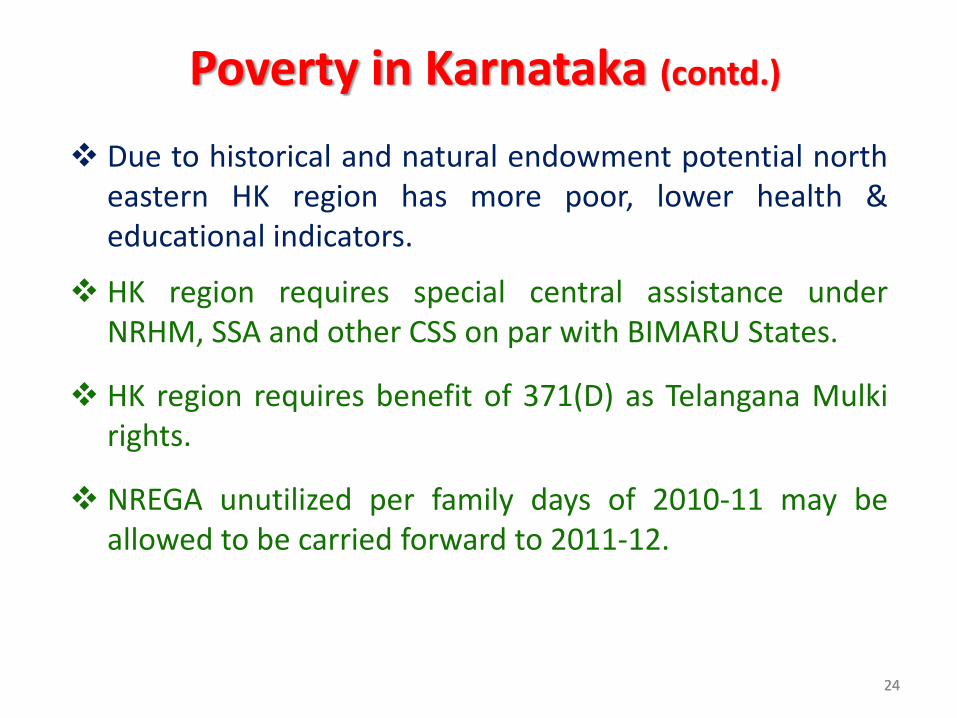
Due to historical and natural endowment potential northeastern HK region has more poor, lower health &educational indicators.
HK region requires special central assistance underNRHM, SSA and other CSS on par with BIMARU States.
HK region requires benefit of 371(D) as Telangana Mulkirights.
NREGA unutilized per family days of 2010‐11 may beallowed to be carried forward to 2011‐12.
Poverty in Karnataka (contd.)

25
2001Dr.Nanjundappa Committee recommendation:identified 114 Backward blocks (39 MostBackward).
Recommended Rs.31,000 crore package (8 years);Rs.15000 crore as additionality.
Since 2007‐08 SDP launched, Rs.6000 crore spent,2011‐12 Rs.2,975 crore earmarked.
GoK is re‐evaluating backwardness based on 2009value of indicators and planning to augment focuson 20% of the most backward blocks.
Regional Balance

2626
71.2% below National 71.7%, Rural 64.9% (below National 67%).Gender gap high (16.4%), Rural Urban Gap (20%) higher thanNational average (17.3%).
Survey based on very small sample size we may await 2011census results.
Intensifying our ‘Saakshar Bharat’ programme focussed on (40lakhs) illiterate women as per IIM (A) Video song based strategy.
School Education:
Access 100% provided. Enrolment (100%) & Retention (95% LPS &89% HPS) encouraging. Quality outcomes a concern: Averageattainment (III / V / VII) 60%.
Quality Measures:
Nalikali (Joyful learning) I to III standard: 90000 teachers trained.
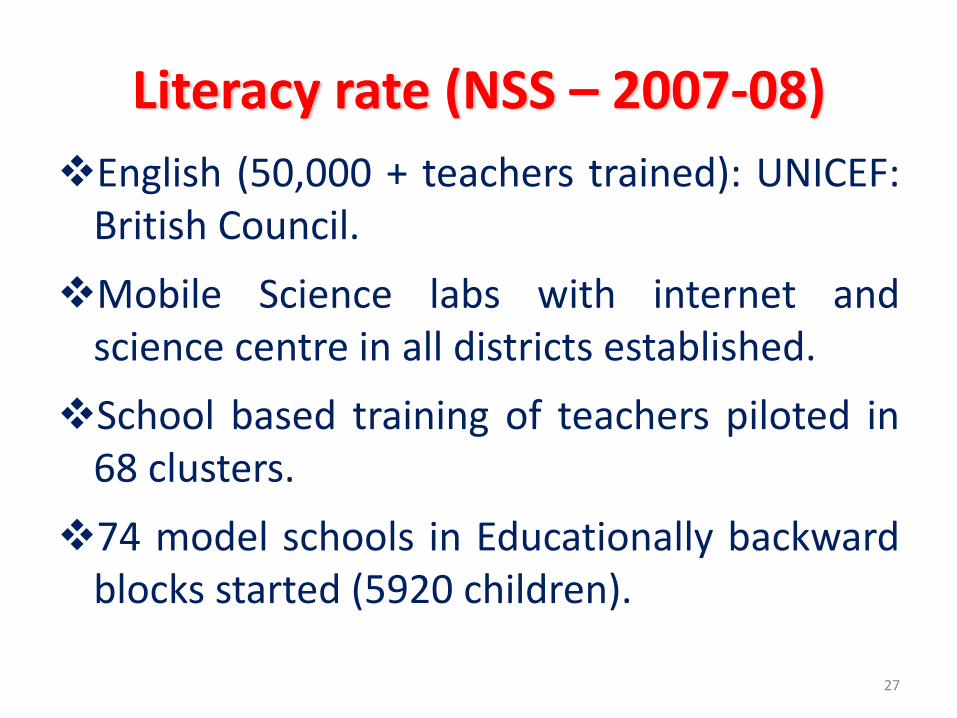
Literacy rate (NSS – 2007‐08)
27
Literacy rate (NSS – 2007‐08)English (50,000 + teachers trained): UNICEF:British Council.
Mobile Science labs with internet andscience centre in all districts established.
School based training of teachers piloted in68 clusters.
74 model schools in Educationally backwardblocks started (5920 children).
28
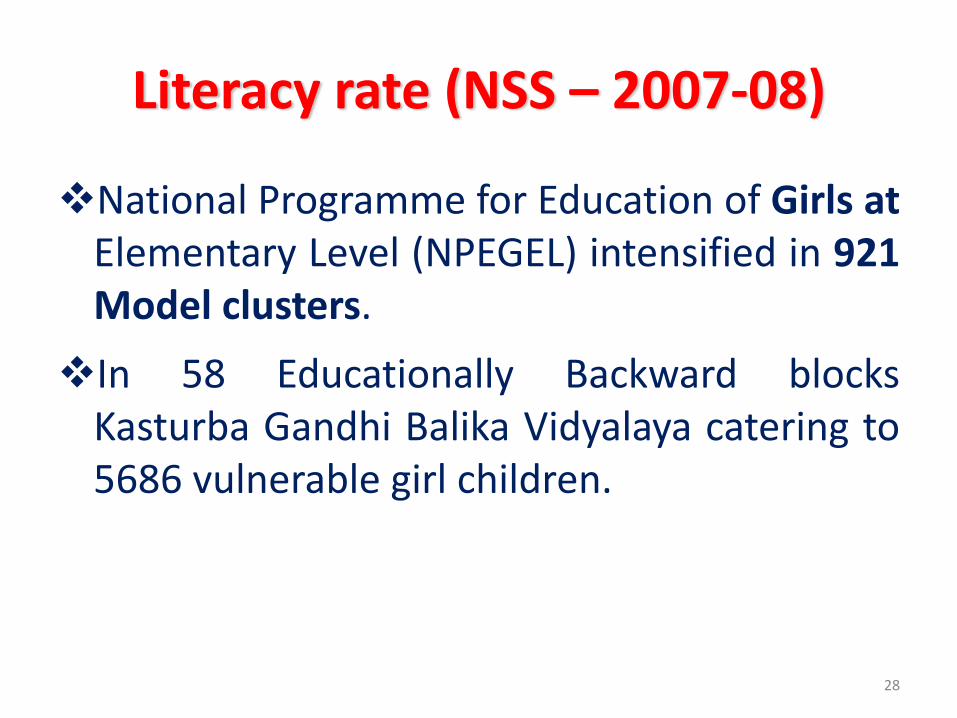
Literacy rate (NSS – 2007‐08)
National Programme for Education of Girls atElementary Level (NPEGEL) intensified in 921Model clusters.
In 58 Educationally Backward blocksKasturba Gandhi Balika Vidyalaya catering to5686 vulnerable girl children.

2929
This is NSSO 2007‐08 Data but in 2010‐11:
LPS: 3560 habitations unserved but only 135 are eligible, allthe children in these habitations covered by transport / escortservice.
HPS: Without (4919) but eligible as per norms 330 andconditional eligibility for 1855 with HPS within 3 Kms.
We will cover these by 2011‐12.
7832 Unserved habitation at Upper Primary and 5473 habitation at primary no school within 1 Kms.
3030
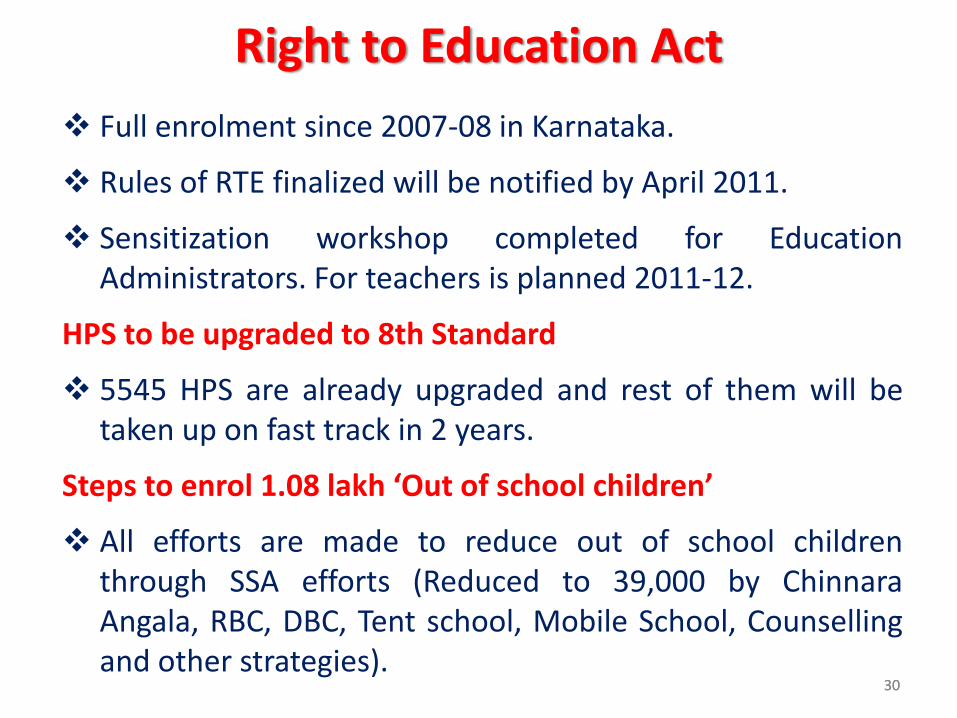
Full enrolment since 2007‐08 in Karnataka.
Rules of RTE finalized will be notified by April 2011.
Sensitization workshop completed for EducationAdministrators. For teachers is planned 2011‐12.
HPS to be upgraded to 8th Standard
5545 HPS are already upgraded and rest of them will betaken up on fast track in 2 years.
Steps to enrol 1.08 lakh ‘Out of school children’
All efforts are made to reduce out of school childrenthrough SSA efforts (Reduced to 39,000 by ChinnaraAngala, RBC, DBC, Tent school, Mobile School, Counsellingand other strategies).
Right to Education Act

3131
In 2008‐09 it was 6.52% and 2010‐11 it is 7.8% and furtherefforts are being made to increase it to the proportion ofMinority Community.
Backlog of 2424 teachers vacancy (SSA)
Backlog of 2249 cleared in 2008‐09, 2009‐10, 2010‐11.
5000 single teacher schools need to be addressed
Eligible children are less than 15 in each hence scale andeconomy interfere with plans.
Enrolling Muslim Girls in KGBV(7.8% ‐ 2010‐11)
3232
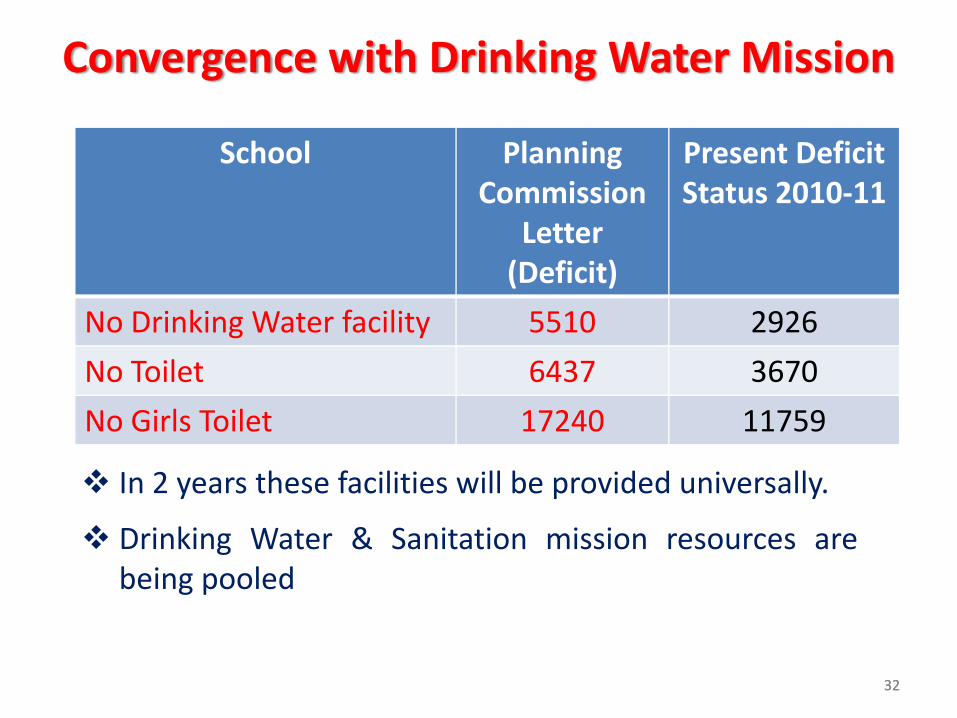
In 2 years these facilities will be provided universally.
Drinking Water & Sanitation mission resources arebeing pooled
Convergence with Drinking Water Mission
School Planning Commission
Letter (Deficit)
Present DeficitStatus 2010‐11
No Drinking Water facility 5510 2926
No Toilet 6437 3670
No Girls Toilet 17240 11759
3333
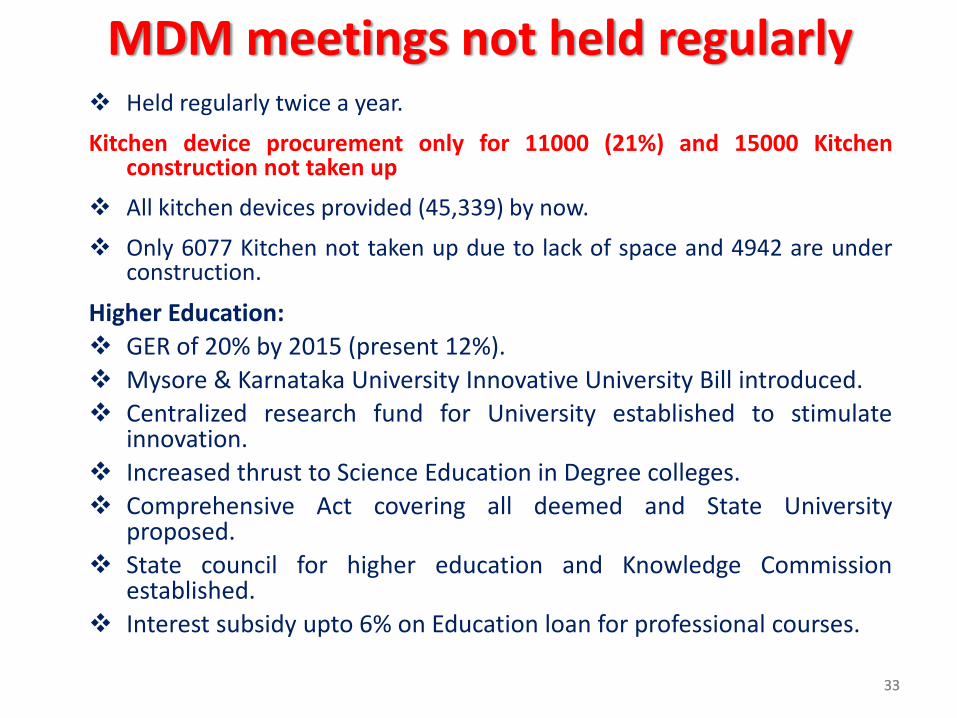
Held regularly twice a year.
Kitchen device procurement only for 11000 (21%) and 15000 Kitchenconstruction not taken up
All kitchen devices provided (45,339) by now.
Only 6077 Kitchen not taken up due to lack of space and 4942 are underconstruction.
Higher Education:GER of 20% by 2015 (present 12%).Mysore & Karnataka University Innovative University Bill introduced.Centralized research fund for University established to stimulateinnovation.Increased thrust to Science Education in Degree colleges.Comprehensive Act covering all deemed and State Universityproposed.State council for higher education and Knowledge Commissionestablished.Interest subsidy upto 6% on Education loan for professional courses.
MDM meetings not held regularly

34
Education• GoI Assistance sought:
Extend MDM for class IX & X.Central aid under RMSA to be extended to grant in aidinstitutions.Funds in the ratio of 75:25 on lines of RMSA to be provided(instead 65:35) to implement RTE.Provision to pay honorarium to volunteers under ShaksharBharat (Last mile connectivity).New IIT sanction in Karnataka.New IIIT for Dharwad.Central Package for Hyderabad‐Karnataka Backward regionand relaxing committed liability clauses under SSA / RMSAfor text book, uniform etc.
3535
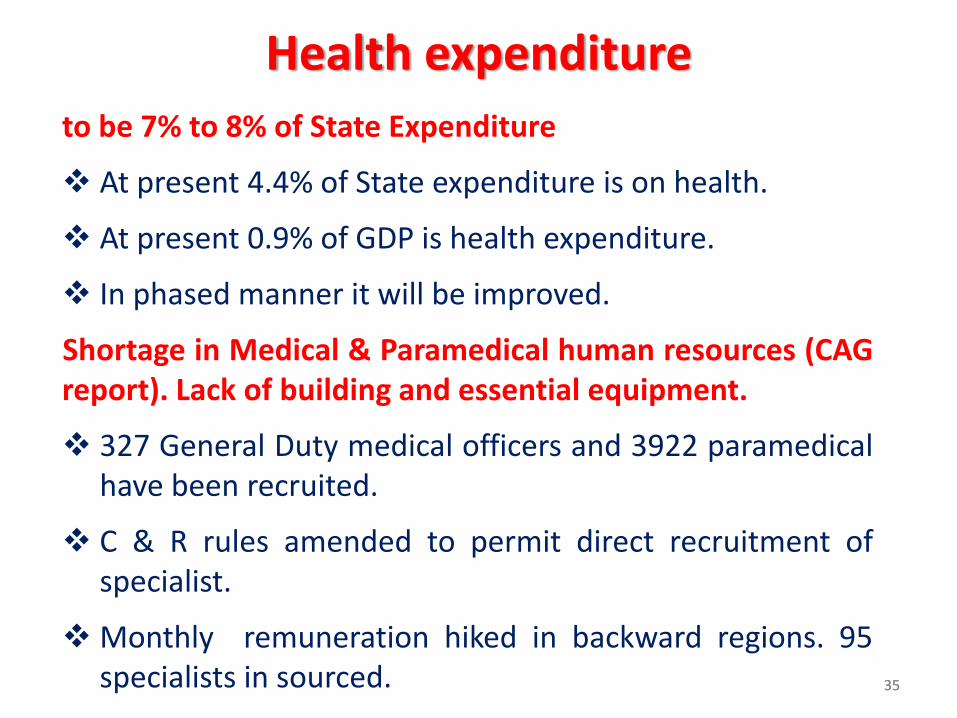
to be 7% to 8% of State Expenditure
At present 4.4% of State expenditure is on health.
At present 0.9% of GDP is health expenditure.
In phased manner it will be improved.
Shortage in Medical & Paramedical human resources (CAGreport). Lack of building and essential equipment.
327 General Duty medical officers and 3922 paramedicalhave been recruited.
C & R rules amended to permit direct recruitment ofspecialist.
Monthly remuneration hiked in backward regions. 95specialists in sourced.
Health expenditure
3636
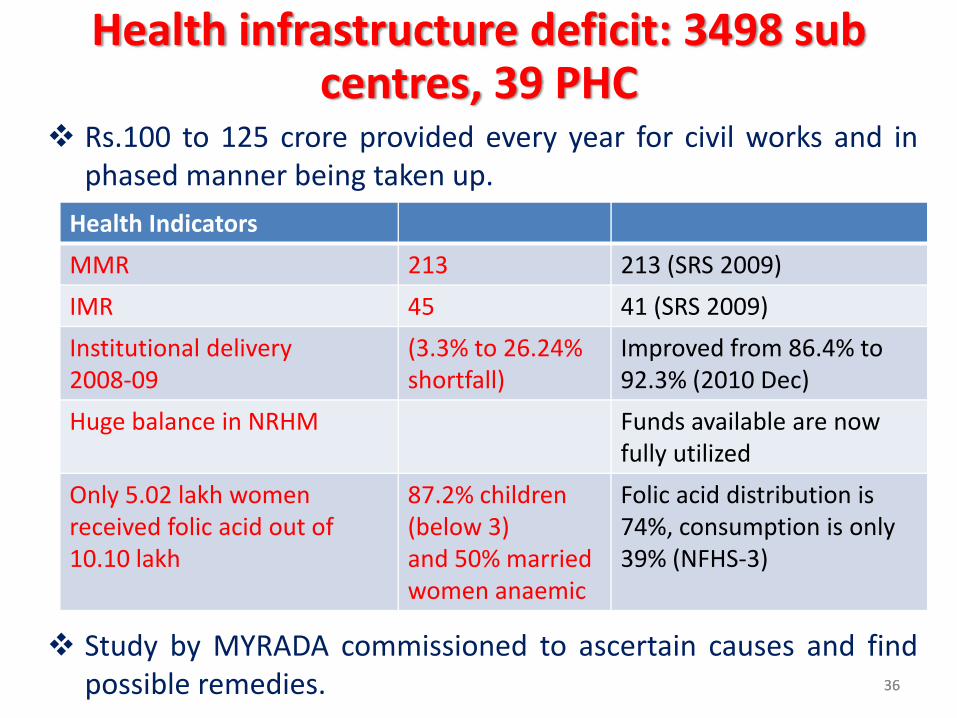
Rs.100 to 125 crore provided every year for civil works and inphased manner being taken up.
Health infrastructure deficit: 3498 sub centres, 39 PHC
Health Indicators
MMR 213 213 (SRS 2009)
IMR 45 41 (SRS 2009)
Institutional delivery2008‐09
(3.3% to 26.24% shortfall)
Improved from 86.4% to 92.3% (2010 Dec)
Huge balance in NRHM Funds available are now fully utilized
Only 5.02 lakh women received folic acid out of 10.10 lakh
87.2% children (below 3)and 50% married women anaemic
Folic acid distribution is 74%, consumption is only 39% (NFHS‐3)
Study by MYRADA commissioned to ascertain causes and findpossible remedies.

3737
Health infrastructureHealth Indicators
24x7 PHC in high focus districts.Strengthen institutional setup foraddressing neonatal / infant mortality.
All high focused districts:24x7 PHC provided.
550/1003 24x7 PHCstrengthened with newborn care corners.
32.15 lakh families provided health insurance. 24x7Ambulance services benefitted 1.93 cr. Callers saving 9.84lakh lives.
Planning Commission assistance required to considerHyderabad‐Karnataka region for special assistance underNRHM (as high focus states).

3838
Ground Water Act enacted.
Water rates not revised since 2001: recover O &M cost at least
National political consensus may be evolved on this issue.
Water User Association: may retain part of tariff
Tanks being improved through Jala Samvardhana Yojane.Water user association being formed and empowered.
Minor Irrigation maintenance may be handed over to thebeneficiaries to avoid it being deficient.
13th Finance Commission grants will be used to renovate thedeficient works, maintenance will be handed over to users inphased manner as piloted in Jalasamvardhana Yojane.
Ground Water Management Bill
3939
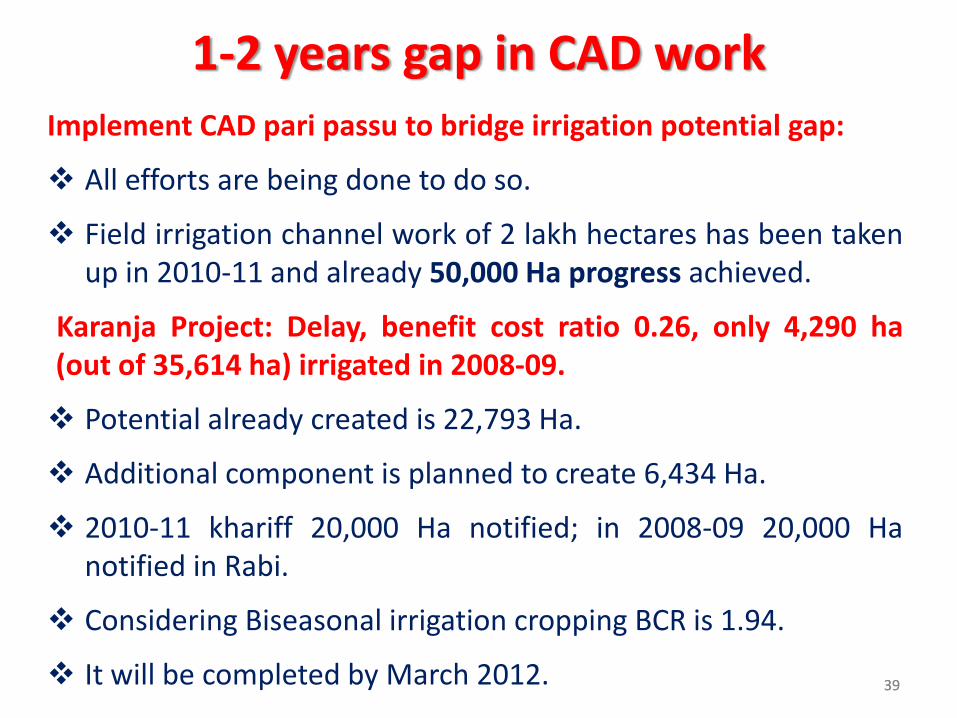
Implement CAD pari passu to bridge irrigation potential gap:
All efforts are being done to do so.
Field irrigation channel work of 2 lakh hectares has been takenup in 2010‐11 and already 50,000 Ha progress achieved.
Karanja Project: Delay, benefit cost ratio 0.26, only 4,290 ha(out of 35,614 ha) irrigated in 2008‐09.
Potential already created is 22,793 Ha.
Additional component is planned to create 6,434 Ha.
2010‐11 khariff 20,000 Ha notified; in 2008‐09 20,000 Hanotified in Rabi.
Considering Biseasonal irrigation cropping BCR is 1.94.
It will be completed by March 2012.
1‐2 years gap in CAD work

4040
Lower Tree cover (2.96%) & Loss of 1000 ha of green cover:
Decrease due to eucalyptus plantation utilization.
State assures to utilize 13th Finance Commission Forest grants (Rs.221cr.) and other resources (CAMPA, NREG, EAP) to augment forest cover.
Massive afforestation on private land initiated to improve forest cover.(2011‐12 will be intensified.
2009‐10 about 637 lakh seedlings planted in 83,641 ha. 110 lakhseedlings distributed for farm land plantation. 2010‐11, 820 lakhseedlings planted in 93,579 ha.
Existence of 290 Tigers, 6000 Elephant population (highest density inIndia) indicate a healthy State of Forest.
Man Animal Conflict increasing. HC directed GOI to support ElephantConservation Programme. Rs.20 cr. requested may be recommended.
State of Forest & Environment

4141
State 12th in Environmental performance index and air quality:
All efforts being taken to improve Environmental monitoringcapacity and resource mobilization for checking pollution,waste management.
Air quality in Bangalore monitored by KPCB – 13 manual, 5continuous Ambient Air Quality Monitoring Stations. Plan toset up in other cities in 2011‐12.
Vehicles major pollutant:
14 point Action Plan drawn up: monitored by ACS.
LPG conversion of Autorickshaw completed.
Checking fuel adulteration.
Air Pollution

4242
Promoting bio fuel in Bus / Auto (5% in 150KSRTC Buses)
Promoting use of public transport bus, metro,BRTS.
Developing 2nd & 3rd tier city through CMNagarothana Yojane to decongest CityCorporations.
Greening of City Programme.
Air Pollution (contd.)
4343
219 ULBs generate 6,513 Ton/day (Solid Waste,Bangalore (3500 Ton/day).
About 40% safely disposed at present.
KPCB improving its monitoring and advisory capacity.
All 219 ULB initiated LAQ. 6 established functionaldisposal, 190 possession taken, 29 ULBs in the process ofAcquiring.
Protracted LAQ and litigation a constraint.
Recycling is being explored: 25.59 MW Waste to EnergyProject by BBMP (3000 Ton/day) initiated.
By March 2012 ULBs committed to complete andCommence Scientific Solid Waste Management.
Resource intensive: Support of GoI requested (50%).
Municipal Solid Waste Management
4444
In 219 ULB 2073 MLD sewage generated.
27 ULBs have Sewage Treatment Plant (STP), 22 ULBsunder process. 169 ULBs constrained by resources.
Bangalore generates 900 MLD: 14 STP with capacity of721 MLD in place. 365 MLD treated due to unsewerednetwork.
UGD & STP require huge capital. Support of GoIrequested.
National River conservation Plan implemented in 8towns.
Sewerage Treatment in ULBs
4545
11,248 identified health establishments (3569 veterinary); 62 Ton BMWgenerated per day.
Presently about 75% Biomedical Waste safely attended.
Health, Ayush, Veterinary Departments: drew comprehensive action plan totreat 90% BMW by 31‐12‐2011.
Action initiated to setup 14 common Biomedical waste Treatment facility.
Awareness programme & capacity building undertaken.
Hazardous Waste Management
KPCB with GTZ established (2008) hazardous waste disposed pits atDobaspet: 357 member industries using facility.
KPCB enhancing its monitoring and advisory capacity. 7771 pollutingindustries has been closed.
KPCB identified 2292 hazardous waste generating industries for closemonitoring.
Central assistance needed to support ULBs to handle waste disposal andrecycling.
Biomedical Waste Management (BMW)

4646
20 districts have developed their comprehensive plan with thehelp of nodal agencies, and are implementing the same.
Mid term appraisal of 11th Plan by the Planning Commission:Identifies Karnataka as the 2nd most decentralised State with aDevolution Index (D) of 69.43.
ZPs having technical planning support services at the District andBlock level.
Regional & Socio economic sustainability Key focused programmes:
SDP for regional balance in 2011‐12: RS.2975 crore earmarked.Renewed focus on 20% most backward blocks identified based on2009 indicators.
SCP, TSP for Social justice in 2011‐12 Rs.4633 crore SCP andRs.1867 crore TSP earmarked. Larger pooling (Rs.1000 crore) in2011‐12 with renewed focus on beneficiary oriented programmes(5.5 lakhs SC beneficiaries benefitted during 2010‐11).
District Planning

4747
Ms. Wipro Infotech & Ms. Comat India selected asenrolment agencies in Tumkur, Mysore respectively(Sept. 2010).
50 lakhs+ residents will get covered by June 2011.
22 lakhs residents (highest in the country) enrolled inAADHAAR till January end. Will be Universalized by July2012.
Embedding in departmental database started.
SWAN, Bangalore one,Nemmadi, HRMS, E‐procurement.
AADHAAR for efficient delivery of Public Service and financial inclusion
4848
State Planning Board is initiating a series ofconsultation workshops on the 12 key areasidentified.
State proposes to work out innovative and crediblemeasures
To attract PPP.
Increase efficiency of State enterprises.
Raise additional resources.
Improve financial management.
Approach Paper to 12th Five Year Plan

49
Thank You
Top Related