


Languages
Pages
Legal


© OECD/IEA 2015
Annual Oil
Questionnaire
Overview
IEA/APERC/Viet Nam Workshop on the Legal Basis for Energy Data Collection
Hanoi, 02 December 2015
Emmanouil Christinakis, IEA
Remi Gigoux, IEA
© OECD/IEA 2015
• WHY are oil statistics important?
• HOW are oil statistics collected?
An overview of the IEA annual oil questionnaire
• How to CHECK oil data?
© OECD/IEA 2015
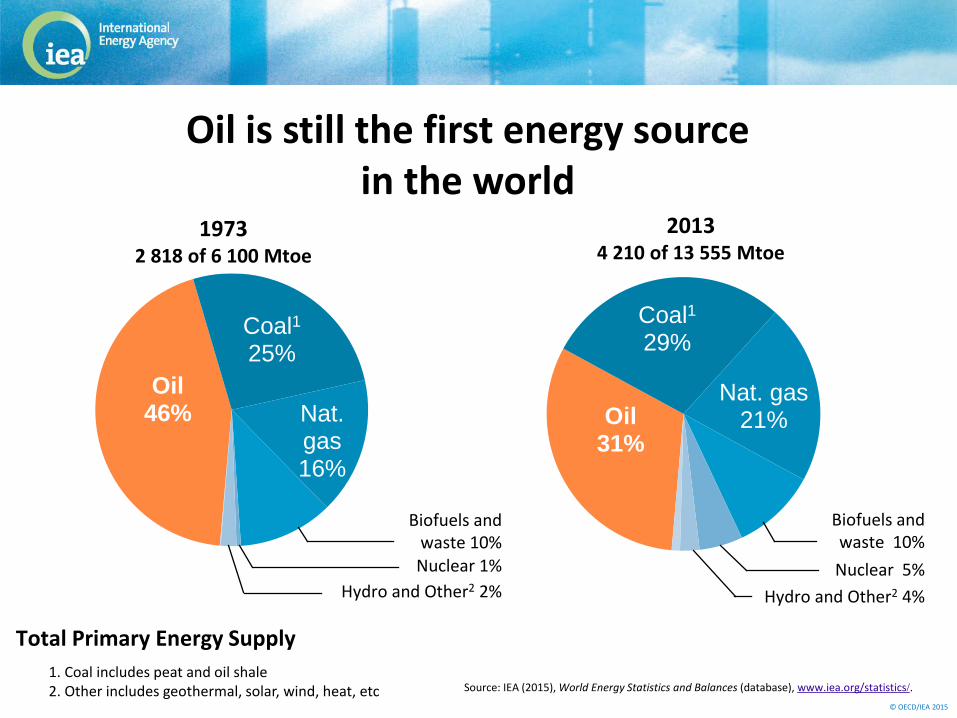
Oil 46%
Coal1
25%
Nat. gas 16%
1% 2%
Biofuels and waste 10% Nuclear 1%
Hydro and Other2 2%
Oil 31%
Coal1 29%
Nat. gas 21%
5% 2% 1%
Biofuels and waste 10%
Nuclear 5%
Hydro and Other2 4%
1. Coal includes peat and oil shale 2. Other includes geothermal, solar, wind, heat, etc
2013 4 210 of 13 555 Mtoe
Source: IEA (2015), World Energy Statistics and Balances (database), www.iea.org/statistics/.
Total Primary Energy Supply
Oil is still the first energy source in the world
1973 2 818 of 6 100 Mtoe
© OECD/IEA 2015
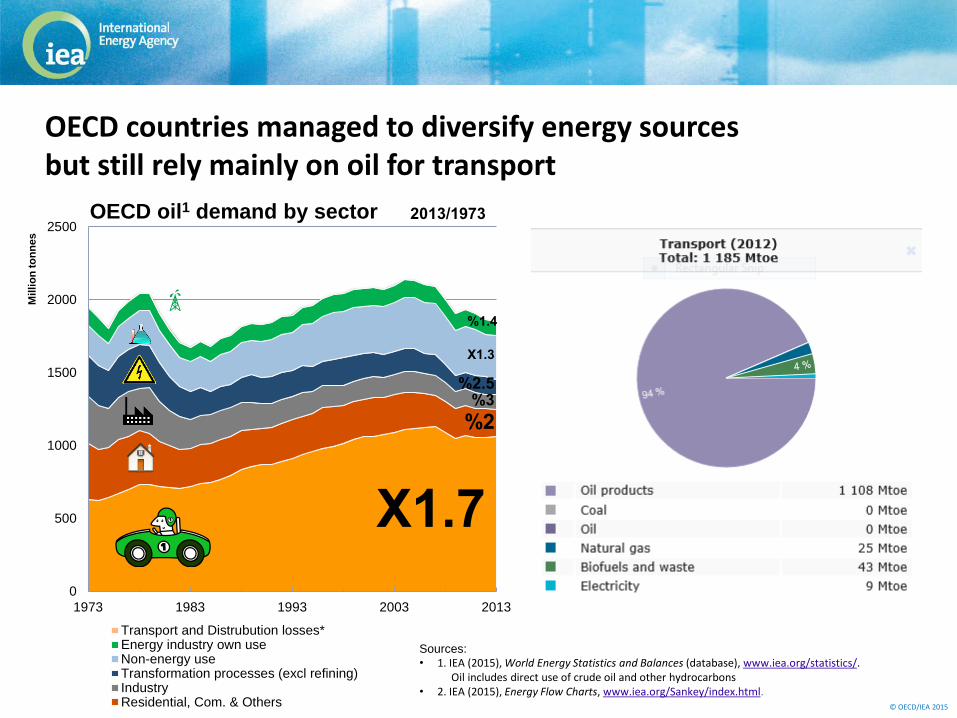
2013/1973
0
500
1000
1500
2000
2500
1973 1983 1993 2003 2013
Mil
lio
n t
on
ne
s
OECD oil1 demand by sector
Transport and Distrubution losses*Energy industry own useNon-energy useTransformation processes (excl refining)IndustryResidential, Com. & Others
OECD countries managed to diversify energy sources but still rely mainly on oil for transport
X1.7
%2 %3
%2.5
X1.3
%1.4
Sources: • 1. IEA (2015), World Energy Statistics and Balances (database), www.iea.org/statistics/. Oil includes direct use of crude oil and other hydrocarbons • 2. IEA (2015), Energy Flow Charts, www.iea.org/Sankey/index.html.

© OECD/IEA 2015
Demand from non-OECD surged
Sources: 1 - IEA (2015), World Energy Statistics and Balances (database), www.iea.org/statistics/. International marine and aviation bunkers are included in each country 2 - IEA (2014), IEA Energy Atlas, www.tellmaps.com/iea/. International marine and aviation bunkers are excluded
World Oil Consumption2, 2012
0
500
1,000
1,500
2,000
2,500
3,000
3,500
4,000
4,500
19
73
19
83
19
93
20
03
20
13
Millio
n t
on
nes
World Oil Demand1
Non-OECD OECD Total
26% in 1973
51%
in
2013

© OECD/IEA 2015
Sound oil statistics: essential for accurate energy analysis and forecasts
Sources:
1 IEA (2015), Oil Market Report, www.iea.org/oilmarketreport/omrpublic/, (accessed on 25 September 2015).
2 IEA (2014), World Energy Outlook 2014.

© OECD/IEA 2015
• WHY are oil statistics important?
• HOW are oil statistics collected?
An overview of the IEA annual oil questionnaire
• How to CHECK oil data?

© OECD/IEA 2015
How do we collect oil statistics?
© OECD/IEA 2015
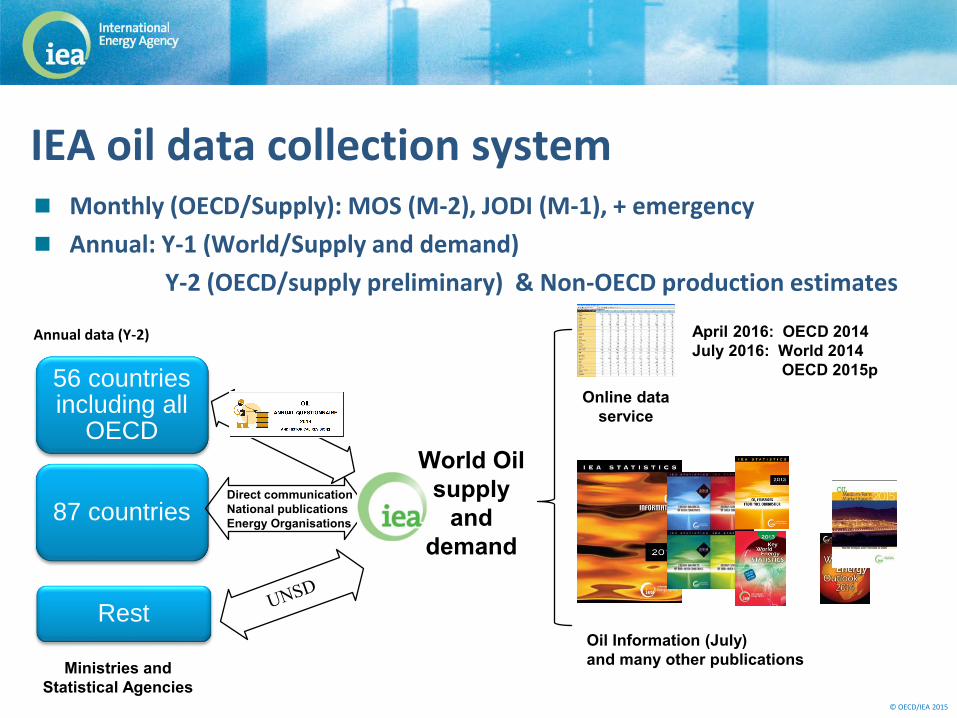
Monthly (OECD/Supply): MOS (M-2), JODI (M-1), + emergency
Annual: Y-1 (World/Supply and demand)
Y-2 (OECD/supply preliminary) & Non-OECD production estimates
Annual data (Y-2)
IEA oil data collection system
56 countries including all
OECD
87 countries
Rest
World Oil
supply
and
demand
Ministries and
Statistical Agencies
Online data
service
April 2016: OECD 2014
July 2016: World 2014
OECD 2015p
Oil Information (July)
and many other publications
Direct communication
National publications
Energy Organisations

© OECD/IEA 2015
Oil statistics structure
Table 1 Table 2
Secondary Oil Products
Ex: Diesel
Table 3
REFINERY Primary Oil Products Ex: Crude oil
Table4 – Imports by country
Table5 –Exports by country

© OECD/IEA 2015
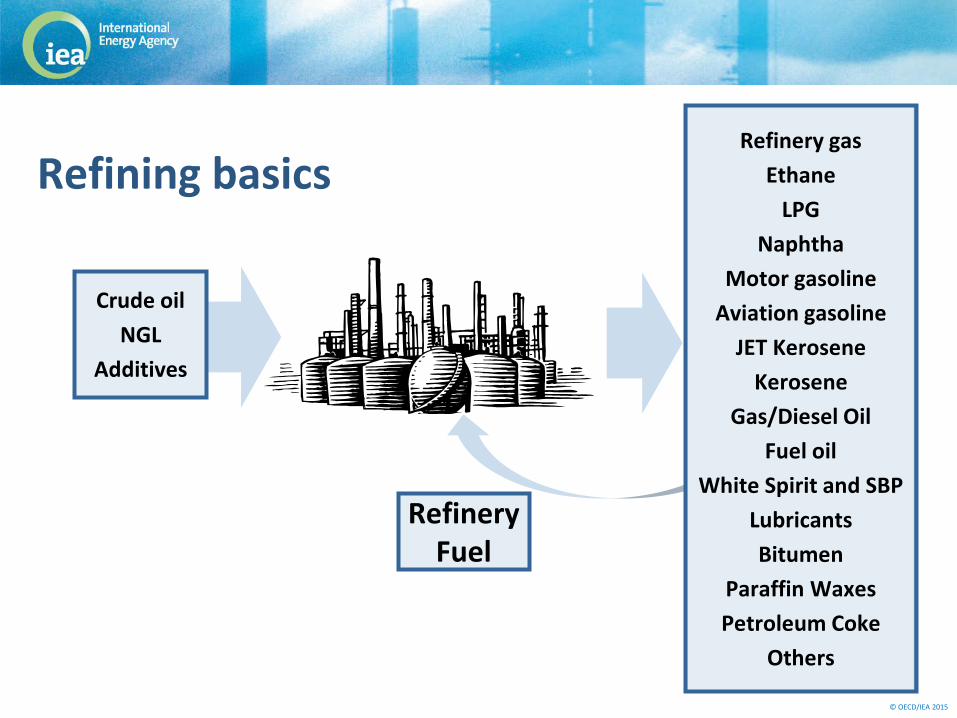
Refining basics
Refinery Fuel
Input Output
© OECD/IEA 2015
Crude oil
NGL
Additives
Refinery gas
Ethane
LPG
Naphtha
Motor gasoline
Aviation gasoline
JET Kerosene
Kerosene
Gas/Diesel Oil
Fuel oil
White Spirit and SBP
Lubricants
Bitumen
Paraffin Waxes
Petroleum Coke
Others
Refinery Fuel
Refining basics
© OECD/IEA 2015
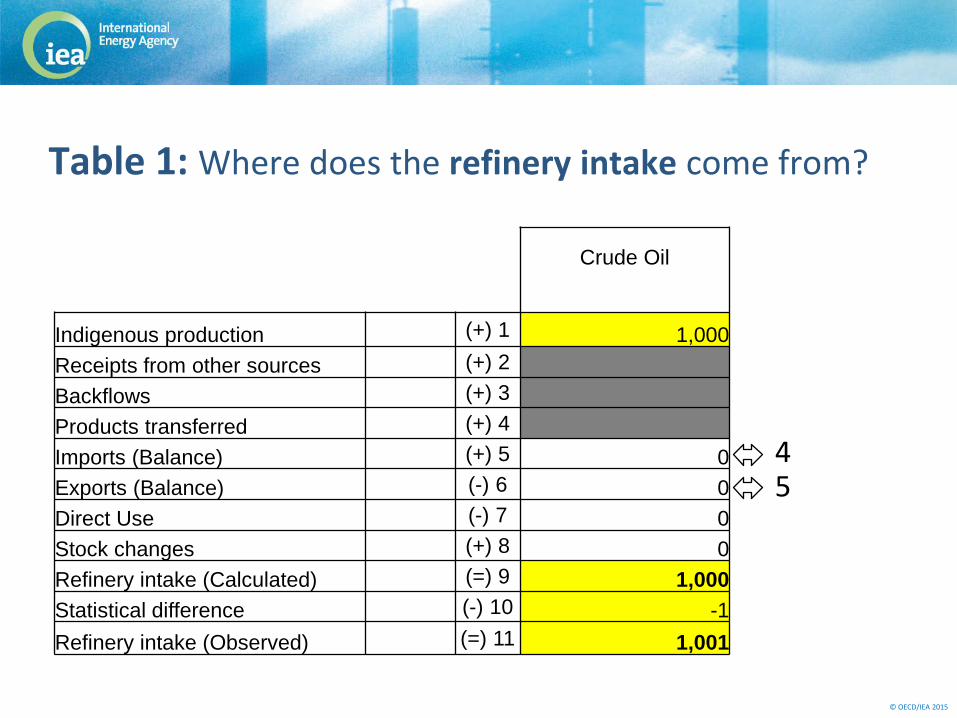
Table 1: Where does the refinery intake come from?
4 5
Crude Oil
Indigenous production (+) 1 1,000
Receipts from other sources (+) 2
Backflows (+) 3
Products transferred (+) 4
Imports (Balance) (+) 5 0
Exports (Balance) (-) 6 0
Direct Use (-) 7 0
Stock changes (+) 8 0
Refinery intake (Calculated) (=) 9 1,000
Statistical difference (-) 10 -1
Refinery intake (Observed) (=) 11 1,001
© OECD/IEA 2015
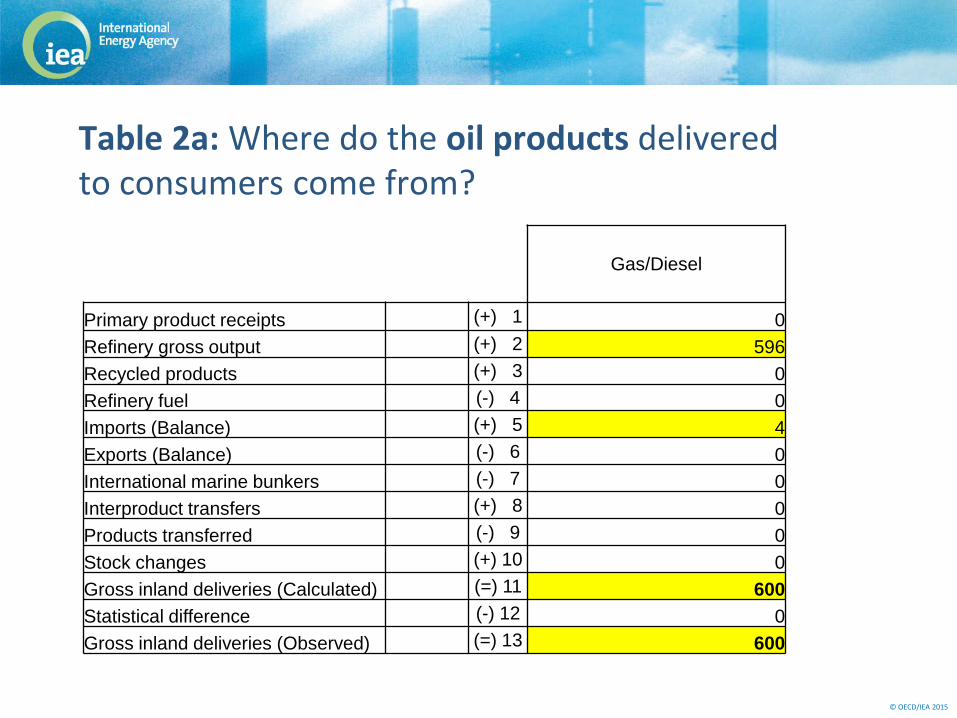
Table 2a: Where do the oil products delivered to consumers come from?
Gas/Diesel
Primary product receipts (+) 1 0
Refinery gross output (+) 2 596
Recycled products (+) 3 0
Refinery fuel (-) 4 0
Imports (Balance) (+) 5 4
Exports (Balance) (-) 6 0
International marine bunkers (-) 7 0
Interproduct transfers (+) 8 0
Products transferred (-) 9 0
Stock changes (+) 10 0
Gross inland deliveries (Calculated) (=) 11 600
Statistical difference (-) 12 0
Gross inland deliveries (Observed) (=) 13 600
© OECD/IEA 2015
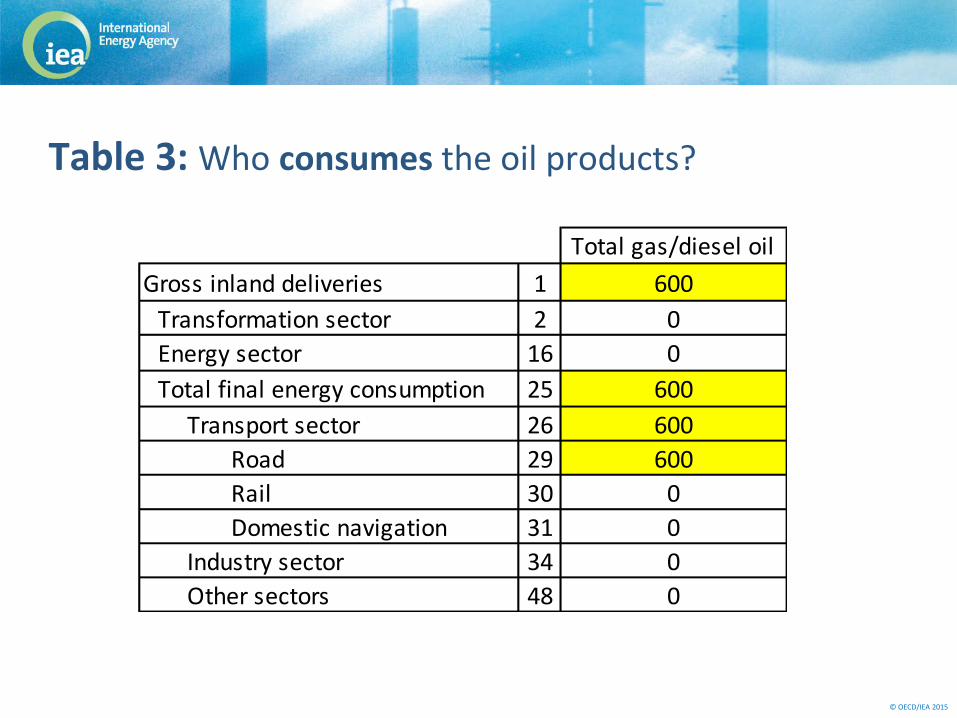
Table 3: Who consumes the oil products?
Total gas/diesel oil
Gross inland deliveries 1 600
Transformation sector 2 0
Energy sector 16 0
Total final energy consumption 25 600
Transport sector 26 600
Road 29 600
Rail 30 0
Domestic navigation 31 0
Industry sector 34 0
Other sectors 48 0
© OECD/IEA 2015
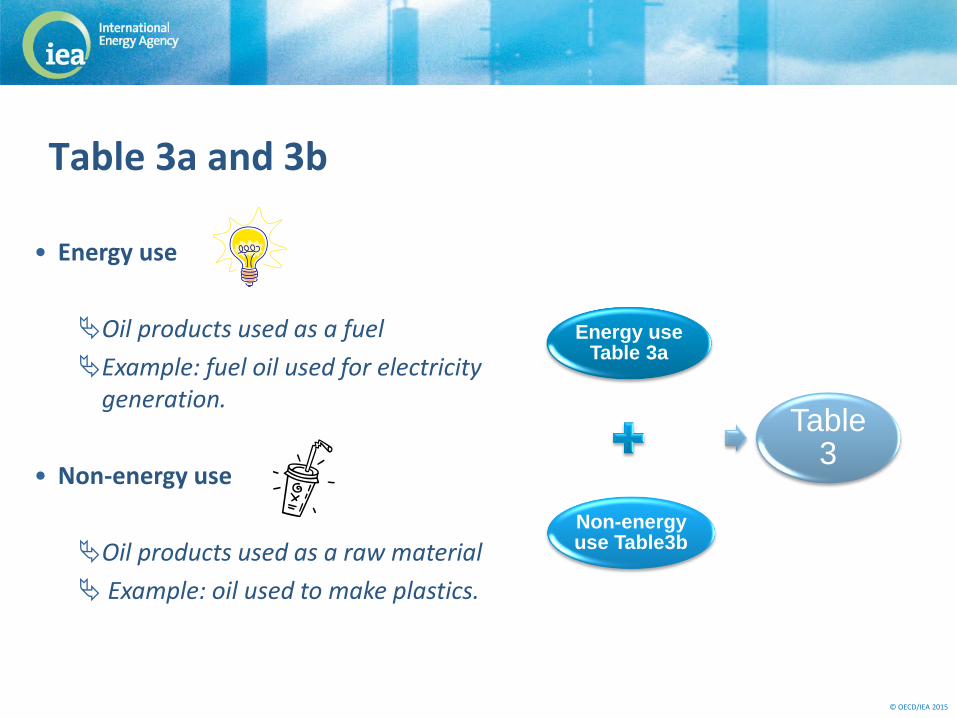
• Energy use
Oil products used as a fuel
Example: fuel oil used for electricity generation.
• Non-energy use
Oil products used as a raw material
Example: oil used to make plastics.
Table 3a and 3b
Energy use Table 3a
Non-energy use Table3b
Table 3

© OECD/IEA 2015
Table 4 and 5: trade
Physical flow (not customs flows) Crude Oil, NGL: country of origin Oil products: country of last
consignment Transit trade not included
© OECD/IEA 2015
• WHY are oil statistics important?
• HOW are oil statistics collected?
An overview of the IEA annual oil questionnaire
• How to CHECK oil data?
© OECD/IEA 2015
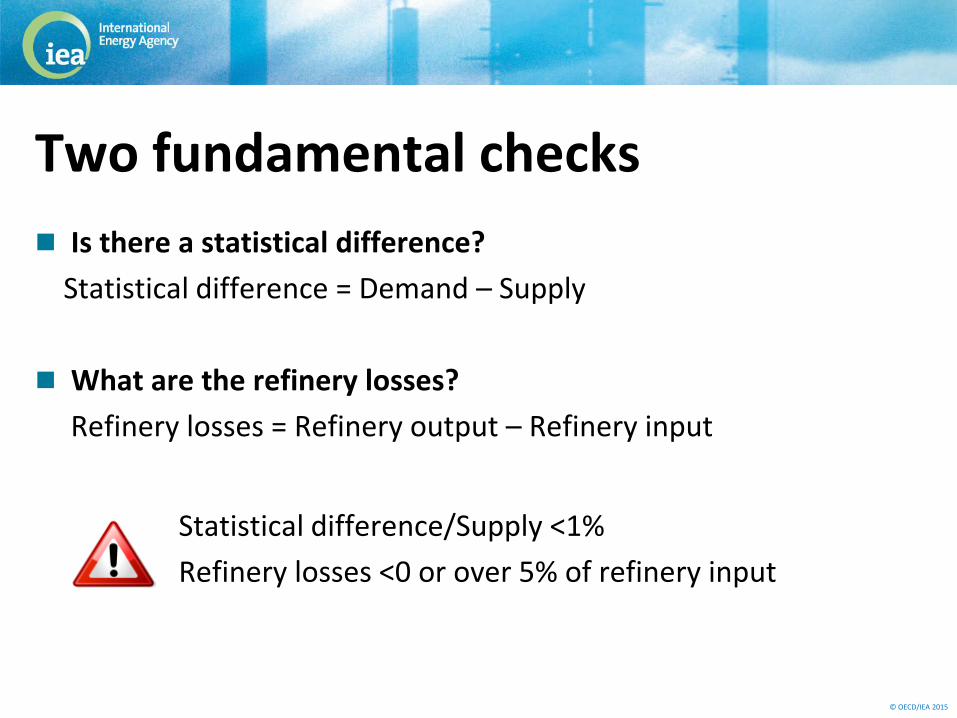
Two fundamental checks
Is there a statistical difference?
Statistical difference = Demand – Supply
What are the refinery losses?
Refinery losses = Refinery output – Refinery input
Statistical difference/Supply <1%
Refinery losses <0 or over 5% of refinery input

© OECD/IEA 2015
Consistency checks: internal and external
DATA ENTRY MENU
Control the integrity and coherence of
your entries:
Run the "Check data" program.
Message
Stock Change should = Opening Stock - Closing Stock
Total Imports (Row 14) should = Total Imports (Row 101)
Crude Oil
Total Imports (Balance) (+) 5 100
Total Exports (Balance) (-) 6 0
Direct Use (-) 7 0
Stock Changes (National Territory) (+) 8 5
MEMO ITEMS:
Refinery Losses 12 0
STOCK LEVELS: Opening Stock Level (National Territory) 13 30 Closing Stock Level (National Territory) 14 10
No data on imports by Origin in table 4
Stock change = 30 -10 ≠ 5

© OECD/IEA 2015
Other checks on time series
Source: IEA World Energy Balances 2015, *Includes international bunkers. LPG: LPG, NGL, ethane and naphtha. Other also includes direct use of crude oil and other hydrocarbons.
By use By fuel
Example Cuba - Oil products demand*
0
2
4
6
8
10
12
14
1971 1975 1979 1983 1987 1991 1995 1999 2003 2007 2011
Mil
lio
n t
on
ne
s
Transformation processes Energy industry own use
Losses Industry
Transport Other
Non-energy use
0
2
4
6
8
10
12
14
1971 1975 1979 1983 1987 1991 1995 1999 2003 2007 2011
Mil
lio
n t
on
ne
s
HFO Mid. dist. Av. fuels Mogas LPG Other
© OECD/IEA 2015
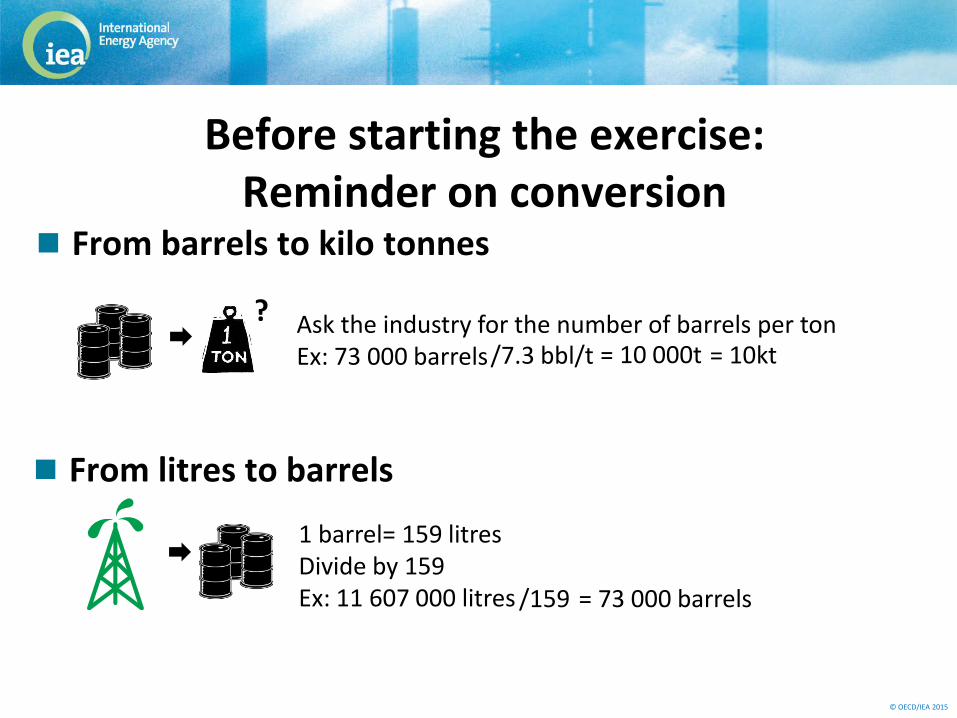
Before starting the exercise: Reminder on conversion
From barrels to kilo tonnes Ask the industry for the number of barrels per ton Ex: 73 000 barrels
1 barrel= 159 litres Divide by 159 Ex: 11 607 000 litres
From litres to barrels
?
/7.3 bbl/t = 10 000t = 10kt
/159 = 73 000 barrels
© OECD/IEA 2015
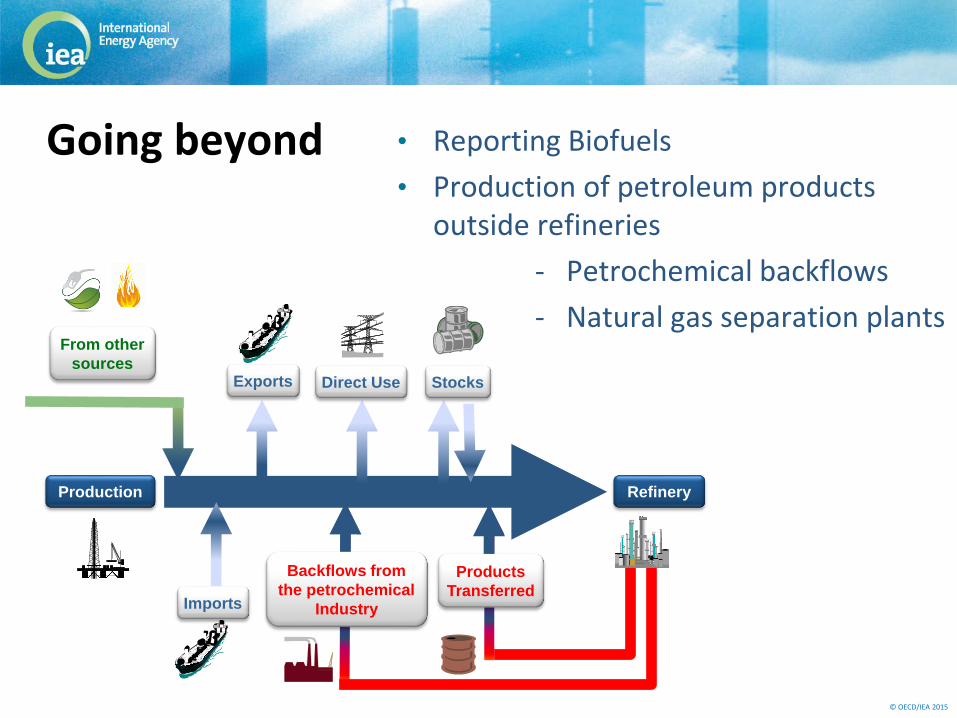
Going beyond • Reporting Biofuels
• Production of petroleum products outside refineries
- Petrochemical backflows
- Natural gas separation plants
Direct Use Exports
Imports
Refinery Production
Backflows from
the petrochemical
Industry
Products
Transferred
From other
sources
Stocks
© OECD/IEA 2015
Resources and contacts
www.iea.org/stats
Top Related