


Languages
Pages
Legal


Annual General Meeting
August 2011
3 August 2011
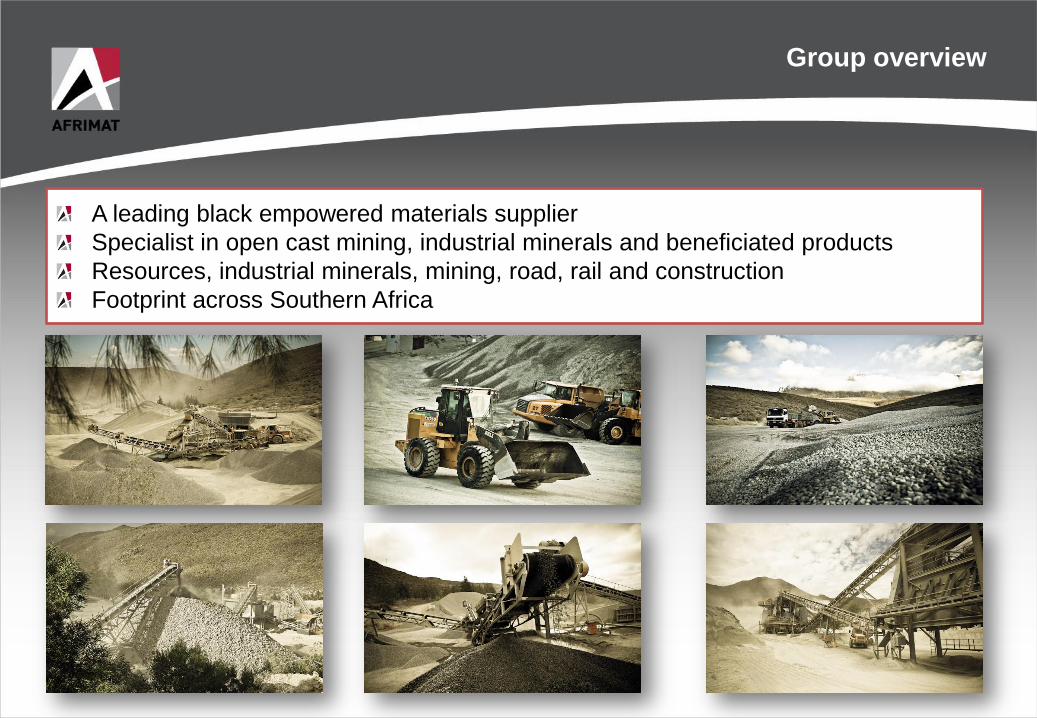
Group overview
A leading black empowered materials supplier
Specialist in open cast mining, industrial minerals and beneficiated products
Resources, industrial minerals, mining, road, rail and construction
Footprint across Southern Africa

Diversified
… portfolio … and footprint
CONCRETE PRODUCTS
Concrete brick & block factories (8)
READYMIX
Batching sites (18)
MINING & AGGREGATES
Commercial quarries (25)
Sand mines (6)
Dolomite mine (1)
… which generates a balanced consistent income stream
CONTRACTING
Mobile Crushing
Drilling and Blasting

What differentiates us?
Strong balance sheet
Strong cash flow
Wide spread geographic footprint across sub-continent
Nimble, astute operator
Flexible
Good market intelligence and expertise
Now one of the largest suppliers of aggregates in South Africa 7.1 million tons for the year

Aggregates and Readymix industry overview
Aggregates– Many competitors remain in financial crisis
– Trend towards smaller more dispersed contracts
– Work moving to rural areas
Readymix:
– Volumes declining further in urban markets
– Severe price competition
– Cost pressure
CMP
– Stable volumes
– Pricing slightly stronger
– Small contracts
Afrimat will continue to exploit opportunities that offer good value

Construction industry overview
Large scale projects tapering off
– Gautrain, GFIP, World Cup stadia
Increased tender activity but severe competition
Most listed players warn on lower profits
Serious infrastructure backlog
– Roads (SANRAL, provinces)
– Medupi & Kusile
– Water
– Housing (R16.3 billion budget)
– Renewable energy
Commodity boom
– Copper, iron ore, coal, etc
– South Africa, Namibia, Zambia, Tanzania, Mozambique, (Zimbabwe?)
– Driven by China, India
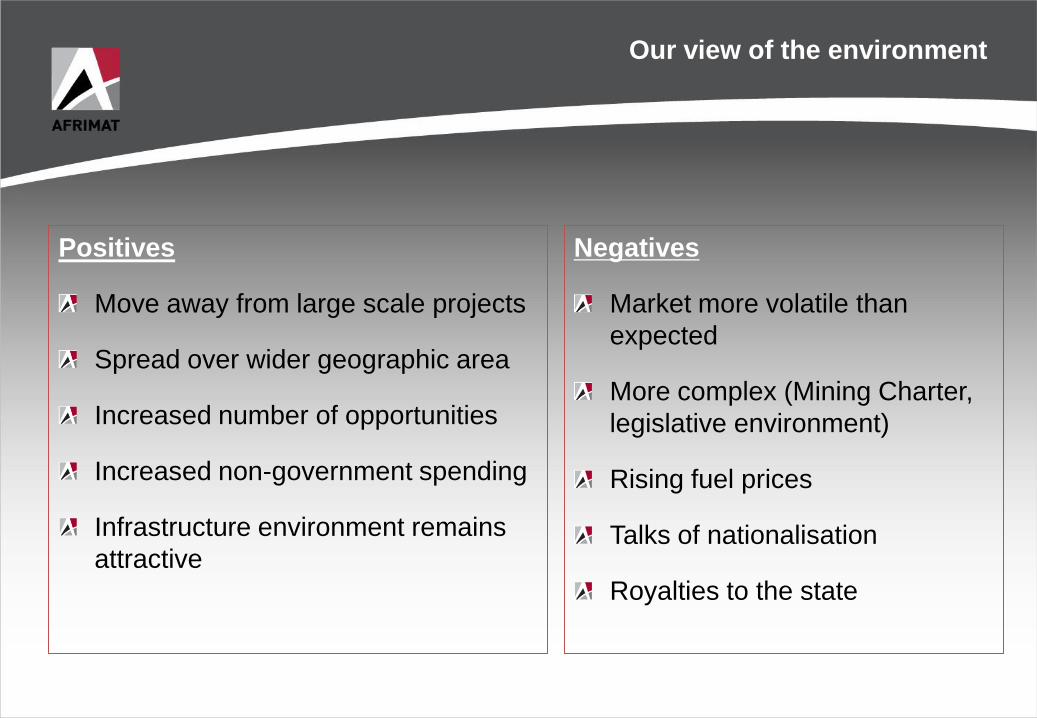
Our view of the environment
Positives
Move away from large scale projects
Spread over wider geographic area
Increased number of opportunities
Increased non-government spending
Infrastructure environment remains
attractive
Negatives
Market more volatile than
expected
More complex (Mining Charter,
legislative environment)
Rising fuel prices
Talks of nationalisation
Royalties to the state

FINANCIAL OVERVIEW

Financial overview
Revenue 9.8%
Headline earnings 4.9%
Net asset value 9.1% to 430 cps (NTAV 350 cps)
Net debt : equity ratio 5.2%
Final dividend 10% to 11 cps
“Mining & Aggregates” showing further growth
All quarries & mines contributing positively to profits
“Readymix” is extremely small contributor
Gross profit margins contained

Headline earnings per share
58 5
70 4
40 5
51 3 53 3
0
10
20
30
40
50
60
70
80
2007 2008 2009 2010 2011
Ce
nts
pe
r sh
are

Mining & Aggregates
R’000
12 months
Feb 2011
12 months
Feb 2010
%
change
External revenue 581 878 487 387 19.4%
Operating profit 98 968 83 633 18.3%
Operating profit margin 17.0% 17.2%
90%
Operating profit
Mining & Aggregates
Performance:
Volumes increased
Solid contracting activities
Glen Douglas revenue of R17.1m and operating profit R4.5m (2 months)
R110m

Concrete Products
Performance:
Volumes increased
Operational efficiencies improved
Geographic footprint
Refurbishments of plants gaining momentum
R’000
12 months
Feb 2011
12 months
Feb 2010
%
change
External revenue 105 630 102 334 3.2%
Operating profit 11 003 12 347 (10.9)%
Operating profit margin 10.4% 12.1%
90%
10%
Operating profit
Mining & Aggregates
Concrete Products
R110m

Readymix
R’000
12 months
Feb 2011
12 months
Feb 2010
%
change
External revenue 166 988 188 295 (11.3)%
Operating profit 2 428 11 736 (79.3)%
Operating profit margin 1.5% 6.2%
90%
10%2%
Operating profit
Mining & Aggregates
Concrete Products
Readymix
Performance:
Weak volumes - frail market conditions
Average selling price marginally better
R110m

Statement of financial position - assets
R’000 Feb 2011 Feb 2010 % change
Property, plant and equipment 403 980 385 261 4.9 %
Mining licenses and goodwill 114 662 115 811 (1.0)%
Inventories 75 548 68 862 9.7 %
Trade and other receivables 157 121 130 956 19.9 %
Cash 87 316 52 914 65.0 %
Other assets 44 222 24 198 82.7 %
BEE funding 70 032 65 284 7.3 %
952 881 843 286
Performance:
Glen Douglas impact on total assets R68 738
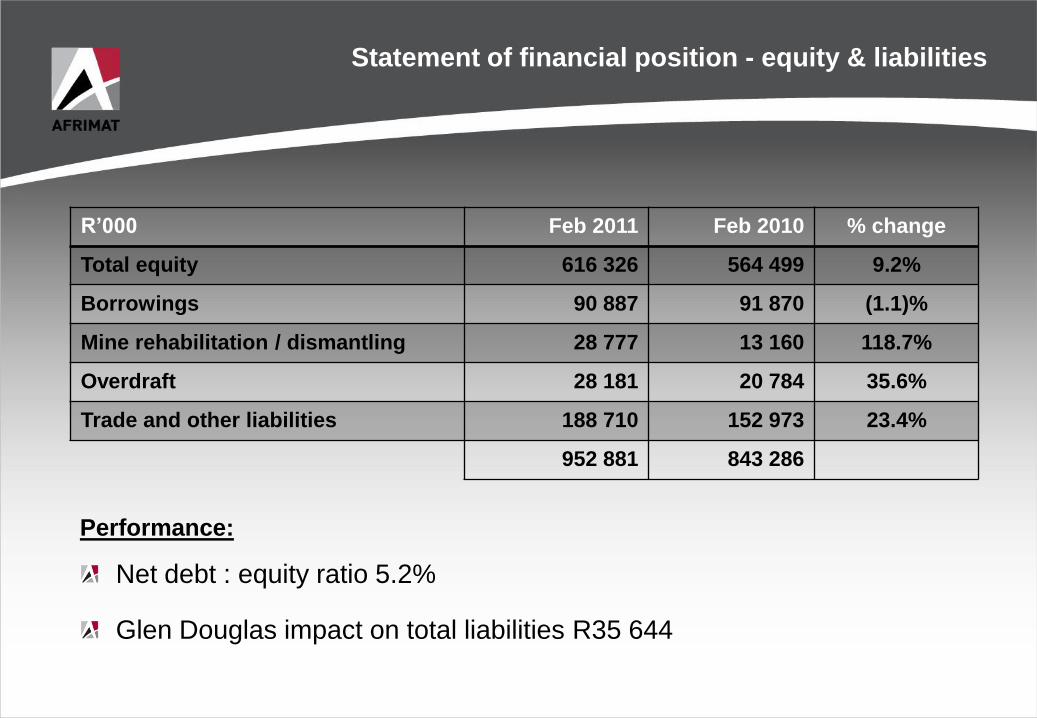
Statement of financial position - equity & liabilities
R’000 Feb 2011 Feb 2010 % change
Total equity 616 326 564 499 9.2%
Borrowings 90 887 91 870 (1.1)%
Mine rehabilitation / dismantling 28 777 13 160 118.7%
Overdraft 28 181 20 784 35.6%
Trade and other liabilities 188 710 152 973 23.4%
952 881 843 286
Performance:
Net debt : equity ratio 5.2%
Glen Douglas impact on total liabilities R35 644
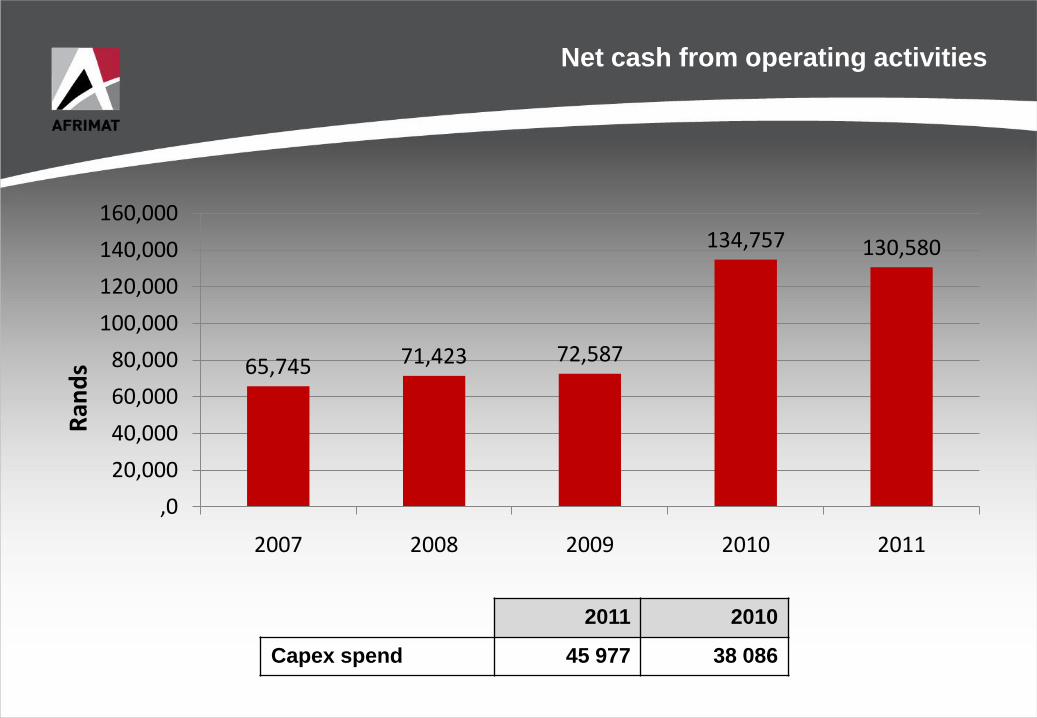
Net cash from operating activities
65,745 71,423 72,587
134,757 130,580
,0
20,000
40,000
60,000
80,000
100,000
120,000
140,000
160,000
2007 2008 2009 2010 2011
Ran
ds
2011 2010
Capex spend 45 977 38 086

Dividends
23
1316 17
0
5
10
15
20
25
2008 2009 2010 2011
Total dividend (cents per share)
Group dividend remains at
3x cover
Afrimat remains intent on
maintaining this policy
Ce
nts
pe
r sh
are

WHAT LIES AHEAD?

N1 N2 Winelands Toll Road

Prospects
Short term outlook:
– Glen Douglas exciting
– Remainder of the market conditions: difficult
Infrastructure
– N1/N2 Winelands– Power stations– Housing– Roads – SANRAL, provinces – Renewable energy
Commodity boom
Afrimat will pursue a conservative growth strategy preserving the status of the balance sheet

Q&A
Thank you for your attendance and participation
www.afrimat.co.za
For any further Investor Relations questions please contact:
Andries van Heerden (CEO): 021-917-8840 or
Vanessa Rech (Keyter Rech Investor Solutions): 011-447-8656
Top Related