


Languages
Pages
Legal


Animation and Data Visualization
in JavaScriptby Kyle Scholz
for The Ajax ExperienceOctober 24th, 2006

10/23/3006 Animation and Data Visualization in JavaScript 2
Overview
Data Visualization and Animation• Data Visualization Examples• Popular Layout Algorithms• Why JavaScript? / Challenges• Developer’s Toolbox
Tutorials• Modeling Static Data• Modeling Music Recommendations
In the WildData Visualization by Example
10/23/3006 Animation and Data Visualization in JavaScript 4
10/23/3006 Animation and Data Visualization in JavaScript 5
10/23/3006 Animation and Data Visualization in JavaScript 6

10/23/3006 Animation and Data Visualization in JavaScript 7
10/23/3006 Animation and Data Visualization in JavaScript 8

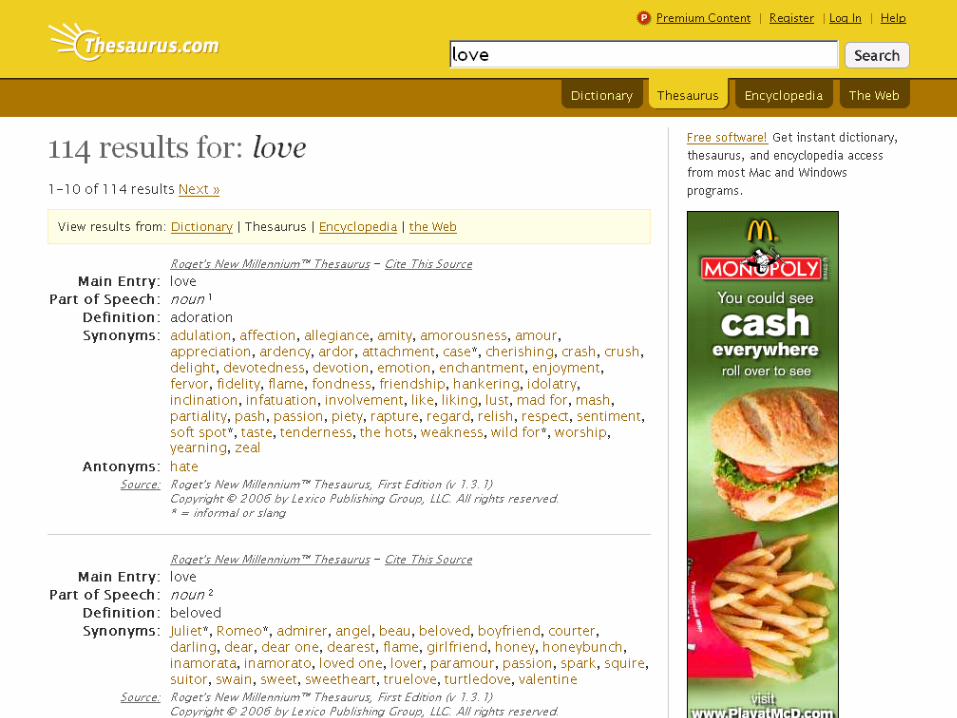
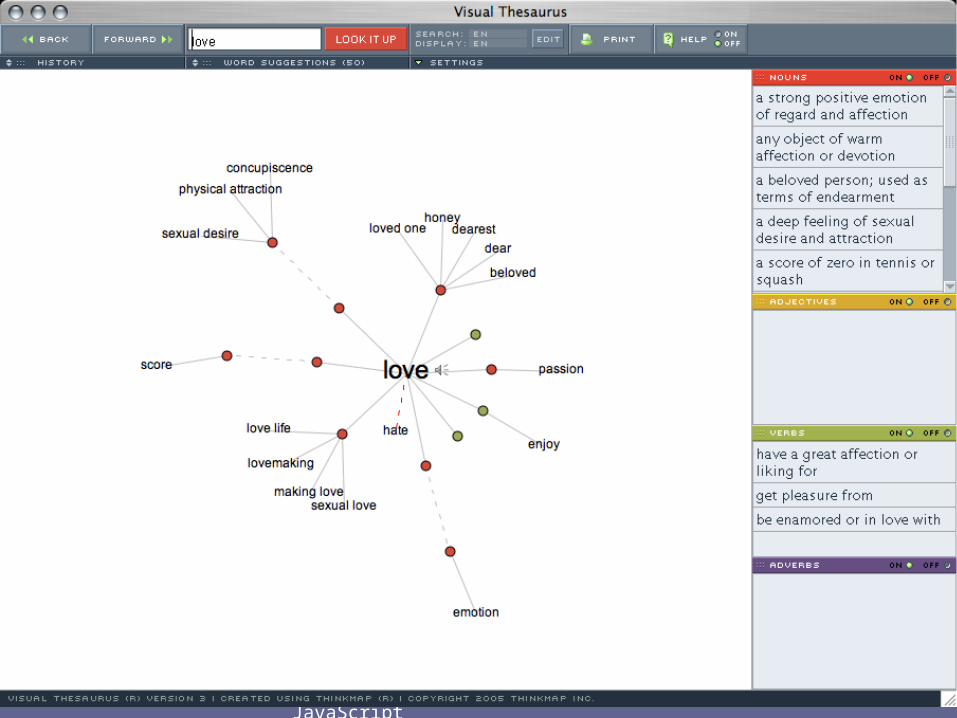
Resourcehttp://www.visualcomplexity.com/
Beautifully maintained catalog of “complex network” visualization.
LayoutGenerating Visualizations
from Dynamic Data

10/23/3006 Animation and Data Visualization in JavaScript 11
Layout with Connected Graphs
• Graphs are visually accessibleConvey meaning by visually expressing relationships with connections, colors, and proximity.
• Graphs are dynamicA single layout algorithm can service variable data sets.

10/23/3006 Animation and Data Visualization in JavaScript 12

10/23/3006 Animation and Data Visualization in JavaScript 13
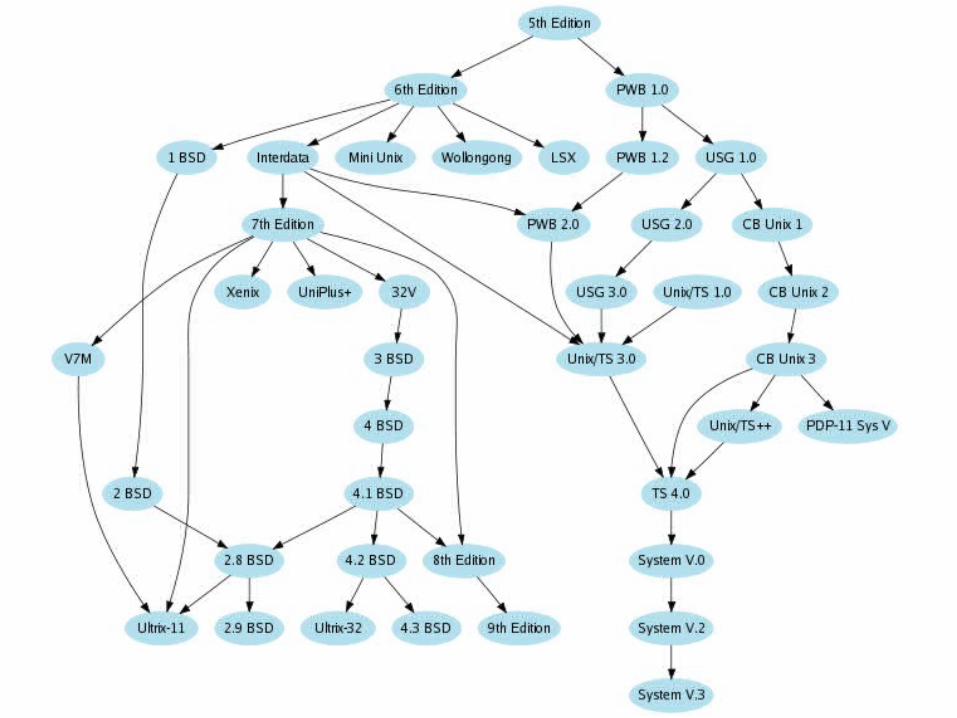
Tree Layouts
The Good• Familiar metaphor – lot’s of data is
structured in trees (hierarchies)• Low computational complexity
The Bad• Organized using geometry – May result
in a lot of overlap – Can balance.• Can’t Support Circuits

10/23/3006 Animation and Data Visualization in JavaScript 14
So … What’s a Circuit??
A
D
E
C
B

10/23/3006 Animation and Data Visualization in JavaScript 15

10/23/3006 Animation and Data Visualization in JavaScript 16
Force Directed (or “Spring”) Layouts
• Based on a physical model: How electrons organize in space.
• Particles are the nodes in our graph.
• Attractive (“Spring”) Forces are our edges.
• Repulsive Forces exist between each node in the model.

10/23/3006 Animation and Data Visualization in JavaScript 17
Particles and Forces
P2
P3
P4
P1
P ParticleSpring ForceRepulsive Force
Key:

10/23/3006 Animation and Data Visualization in JavaScript 18
Why Force Directed Layouts?
The Good• Produce graphs with or without circuits• Draw as few crossing edges as possible• Neat to look at and fun to use• Animated and interactive
The Bad• High Computational Complexity: On2

10/23/3006 Animation and Data Visualization in JavaScript 19
Why Animate?
Problem• Rendering takes time. How do we know
when we’re done?
• Complete data set may not be immediately available.
Solution• We show the user intermediate states
so they can begin interacting sooner.

Why JavaScript?

10/23/3006 Animation and Data Visualization in JavaScript 21
Why use JavaScript?
• Flash, Java, ActiveX alternatives require plug-ins – Slow load time / Limited audience.
• HTML offers rich, familiar presentation elements.
• A JavaScript-powered graph can interact with the rest of your JavaScript application.

ChallengesWe aren’t seriously going to do this in JavaScript are we?

10/23/3006 Animation and Data Visualization in JavaScript 23
Performance
We’re breaking from tradition, asking JavaScript to do some pretty intense stuff.
Can JavaScript handle this?
“JavaScript was designed for simple little web pages…”
--(paraphrasing) IEBlog
10/23/3006 Animation and Data Visualization in JavaScript 24
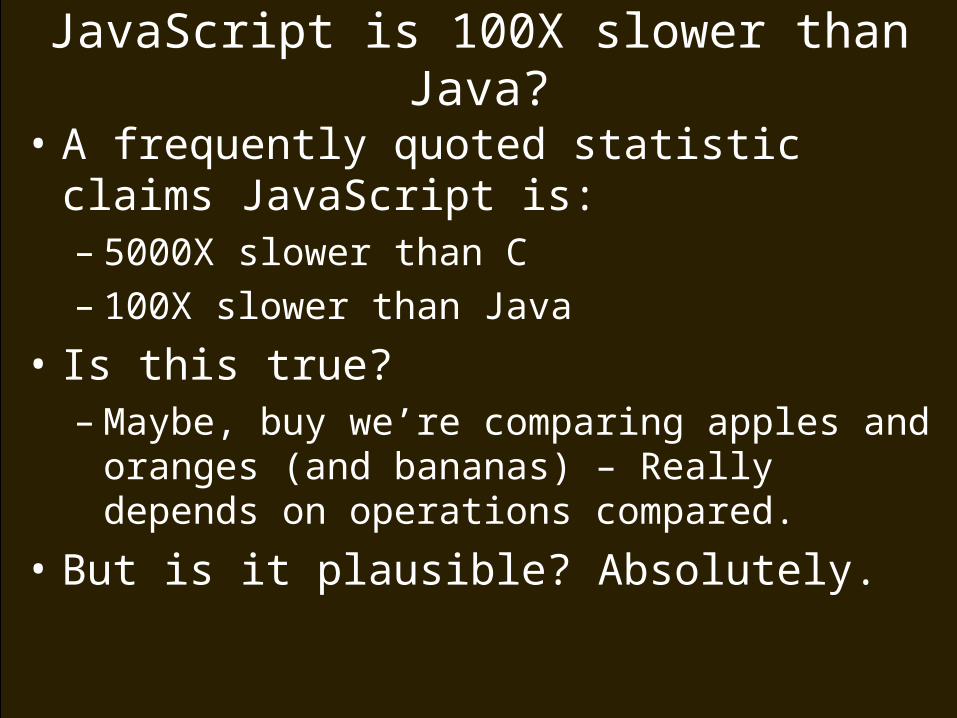
JavaScript is 100X slower than Java?
• A frequently quoted statistic claims JavaScript is:– 5000X slower than C– 100X slower than Java
• Is this true?– Maybe, buy we’re comparing apples and
oranges (and bananas) – Really depends on operations compared.
• But is it plausible? Absolutely.

10/23/3006 Animation and Data Visualization in JavaScript 25
Why is JavaScript Slow?
• Symbol lookupJavaScript uses late binding – Any time we use a variable, we have to search through the scope chain to find it.
• No typesThe meaning of an operator (like “+”) depends on whether arguments can be parsed as Strings or Numbers.
• Closures, Garbage Collection, etc…
10/23/3006 Animation and Data Visualization in JavaScript 26
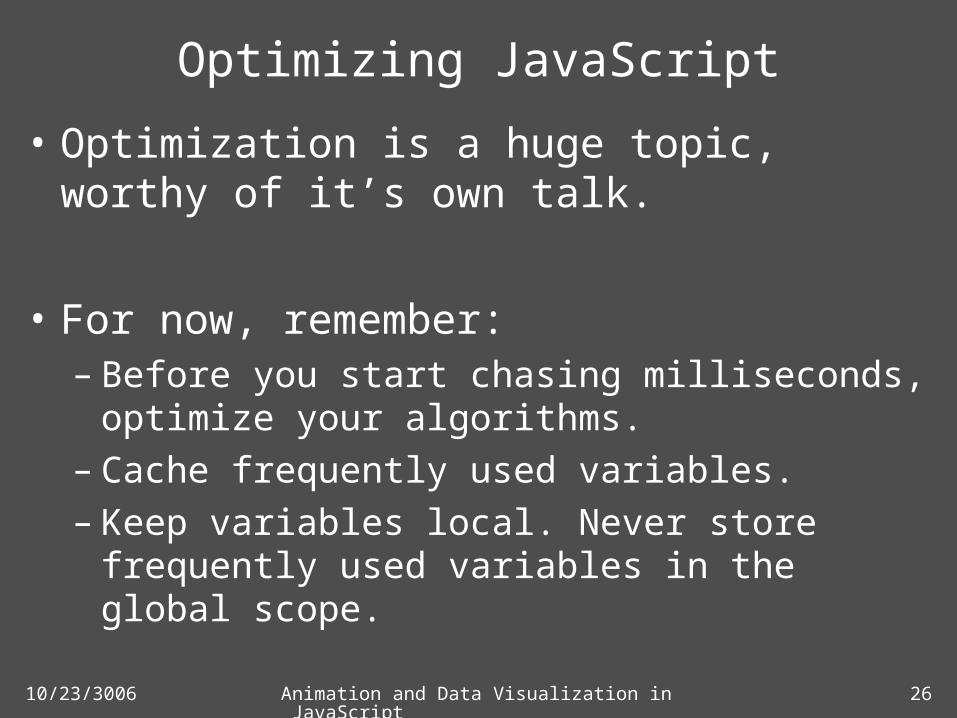
Optimizing JavaScript
• Optimization is a huge topic, worthy of it’s own talk.
• For now, remember:– Before you start chasing milliseconds,
optimize your algorithms.– Cache frequently used variables.– Keep variables local. Never store frequently
used variables in the global scope.

JavaScript Visualization Toolbox
…HTML doesn’t have a <line> element
10/23/3006 Animation and Data Visualization in JavaScript 28
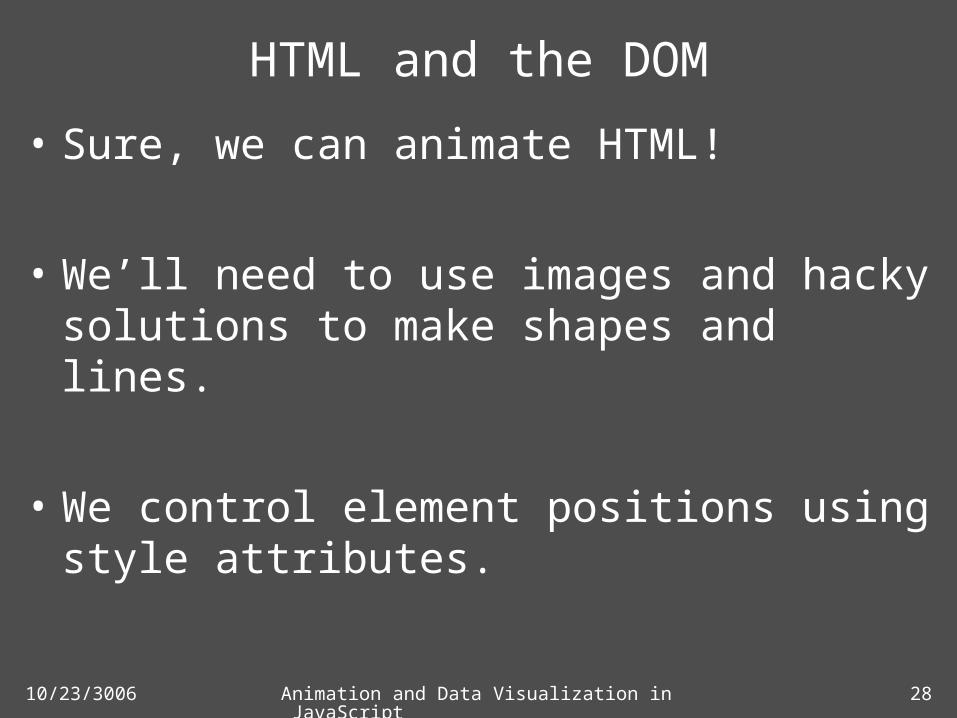
HTML and the DOM
• Sure, we can animate HTML!
• We’ll need to use images and hacky solutions to make shapes and lines.
• We control element positions using style attributes.
10/23/3006 Animation and Data Visualization in JavaScript 29
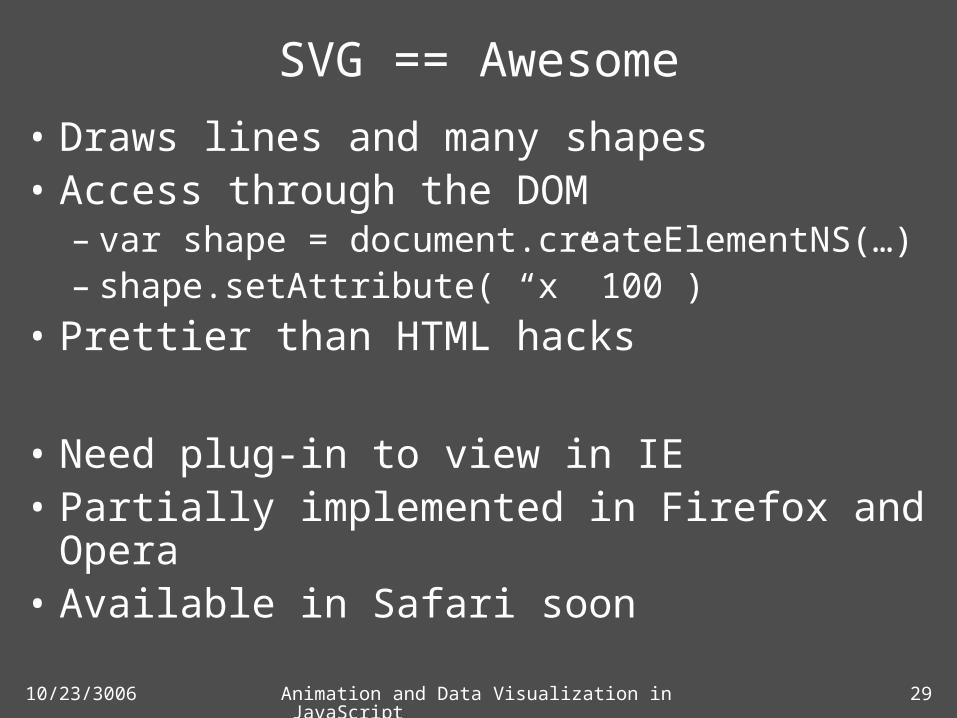
SVG == Awesome
• Draws lines and many shapes• Access through the DOM
– var shape = document.createElementNS(…)– shape.setAttribute( “x” 100 )
• Prettier than HTML hacks
• Need plug-in to view in IE• Partially implemented in Firefox and
Opera• Available in Safari soon
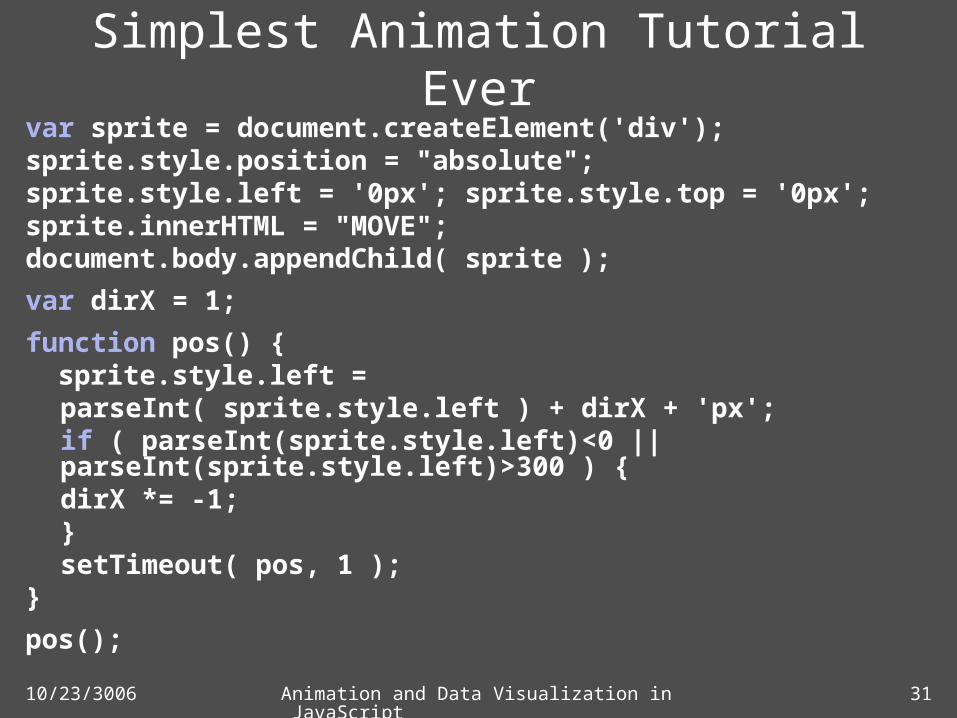
Tutorial #1Using Timers to Animate
HTML
10/23/3006 Animation and Data Visualization in JavaScript 31
Simplest Animation Tutorial Evervar sprite = document.createElement('div');sprite.style.position = "absolute";sprite.style.left = '0px'; sprite.style.top = '0px';sprite.innerHTML = "MOVE";document.body.appendChild( sprite );
var dirX = 1;
function pos() { sprite.style.left =
parseInt( sprite.style.left ) + dirX + 'px';if ( parseInt(sprite.style.left)<0 || parseInt(sprite.style.left)>300 ) {
dirX *= -1;}setTimeout( pos, 1 );
}
pos();

10/23/3006 Animation and Data Visualization in JavaScript 32

Tutorial #2Animating XML Data
with JSViz
10/23/3006 Animation and Data Visualization in JavaScript 34
What’s JSViz?
• A JavaScript library for generating animated connected graphs.
• Currently supports Tree and Force Directed layouts.
• Provides extendable architecture that can support additional layouts.

10/23/3006 Animation and Data Visualization in JavaScript 35
What does JSViz do?
• Implements a time-controlled model that dictates positions of nodes.
• Implements a view that controls display of nodes and relationships.

10/23/3006 Animation and Data Visualization in JavaScript 36
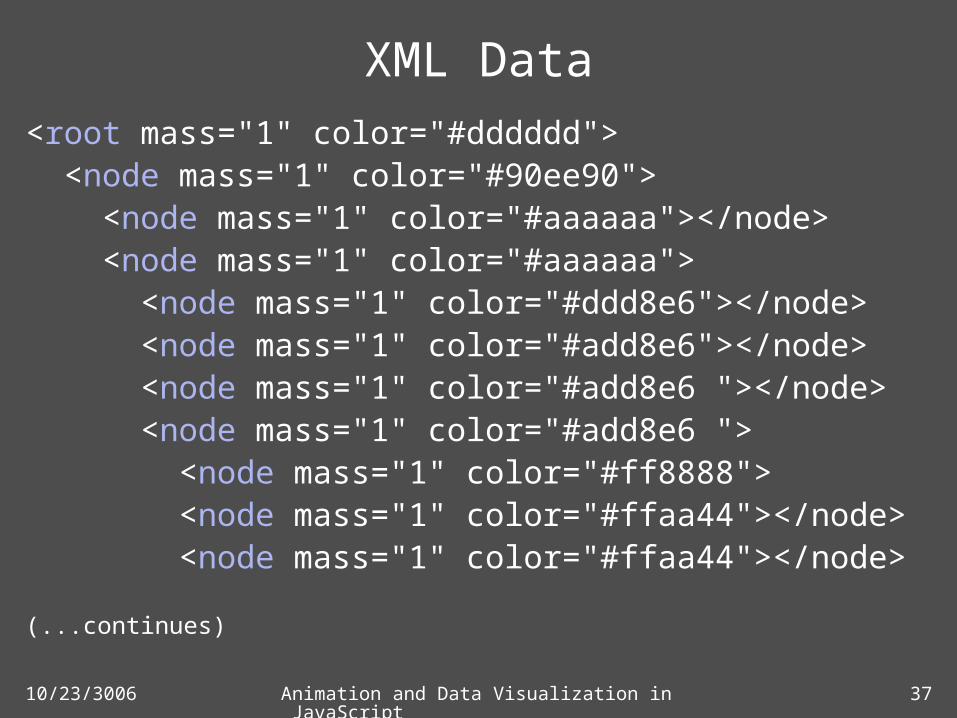
So What are We Building?
• A Force directed Graph that models the contents of an XML file.
10/23/3006 Animation and Data Visualization in JavaScript 37
XML Data<root mass="1" color="#dddddd"> <node mass="1" color="#90ee90"> <node mass="1" color="#aaaaaa"></node> <node mass="1" color="#aaaaaa"> <node mass="1" color="#ddd8e6"></node> <node mass="1" color="#add8e6"></node> <node mass="1" color="#add8e6 "></node> <node mass="1" color="#add8e6 "> <node mass="1" color="#ff8888"> <node mass="1" color="#ffaa44"></node> <node mass="1" color="#ffaa44"></node>
(...continues)

10/23/3006 Animation and Data Visualization in JavaScript 38
Model of our Data
10/23/3006 Animation and Data Visualization in JavaScript 39
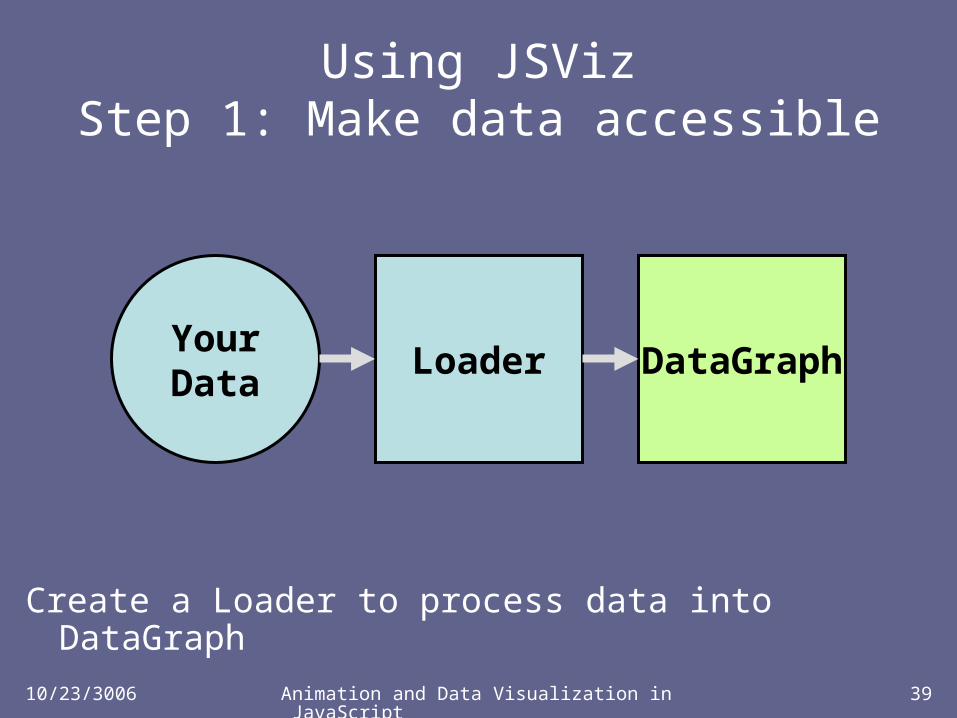
Create a Loader to process data into DataGraph
Using JSVizStep 1: Make data accessible
LoaderYourData
DataGraph

10/23/3006 Animation and Data Visualization in JavaScript 40
XMLLoader.jsvar XMLLoader = function( dataGraph ) {this.init( dataGraph );
}XMLLoader.prototype = {init: function( dataGraph ) {
this.http = new HTTP();this.dataGraph = dataGraph;
},load: function( url ) {
this.http.get( url, this, this.handle );}
}

10/23/3006 Animation and Data Visualization in JavaScript 41
XMLLoader.js (2)handle: function( request ) { var xmlDoc = request.responseXML; var root = xmlDoc.getElementsByTagName("root")[0];
// add Root Node var rootNode = new DataGraphNode( true );var mass = root.getAttribute("mass");rootNode.mass = mass;var color = root.getAttribute("color");rootNode.color = color;
this.dataGraph.addNode( rootNode );
// add childrenthis.branch( root, rootNode );
},
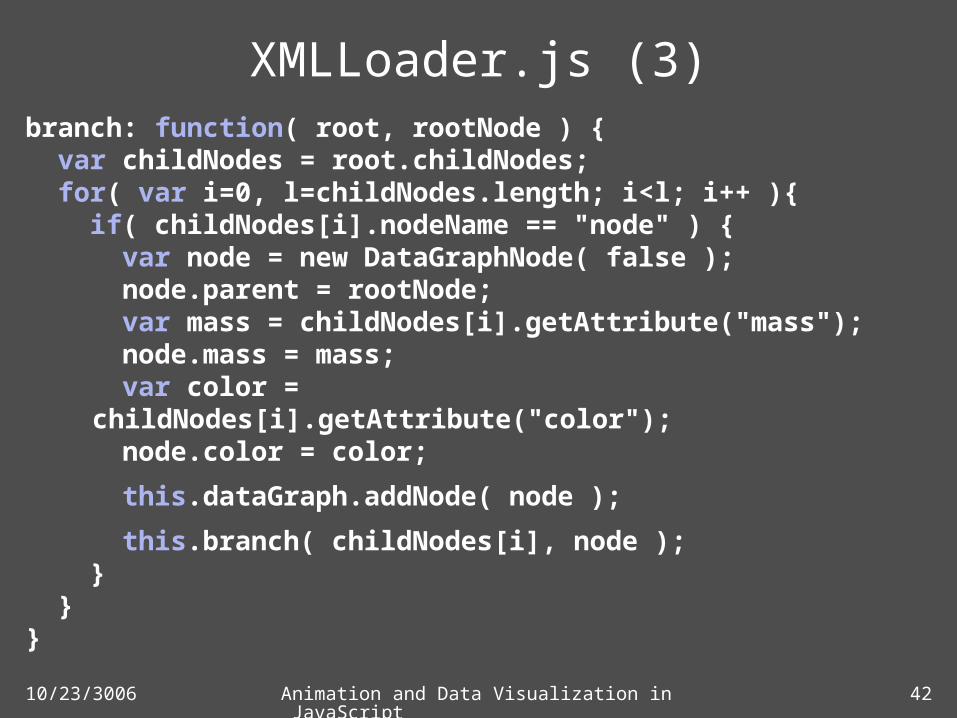
10/23/3006 Animation and Data Visualization in JavaScript 42
XMLLoader.js (3)branch: function( root, rootNode ) { var childNodes = root.childNodes; for( var i=0, l=childNodes.length; i<l; i++ ){ if( childNodes[i].nodeName == "node" ) { var node = new DataGraphNode( false ); node.parent = rootNode; var mass = childNodes[i].getAttribute("mass"); node.mass = mass; var color =
childNodes[i].getAttribute("color"); node.color = color;
this.dataGraph.addNode( node );
this.branch( childNodes[i], node ); } }}

10/23/3006 Animation and Data Visualization in JavaScript 43
Using JSVizStep 2: Initialize Components
DataGraphParticleModel
View Control

10/23/3006 Animation and Data Visualization in JavaScript 44
Set up the HTML<html><head> <script> function init() {} </script> <style type="text/css"> html { filter: expression( document.execCommand( "BackgroundImageCache", false, true)); } body { margin: 0; padding: 0; } </style></head><body onload="init()"></body></html>
10/23/3006 Animation and Data Visualization in JavaScript 45
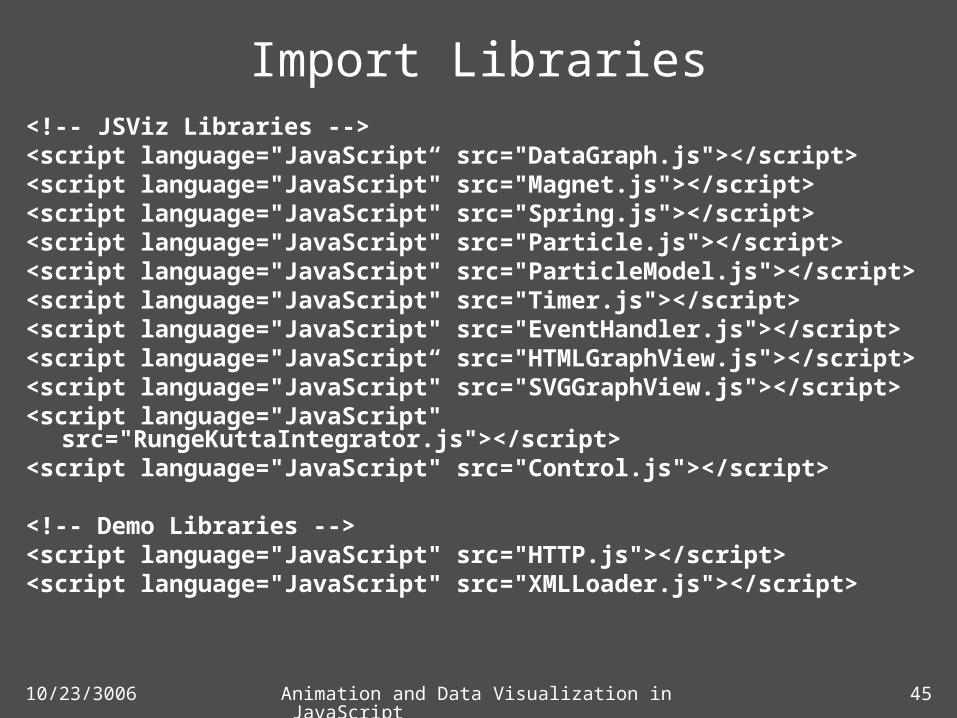
Import Libraries<!-- JSViz Libraries --><script language="JavaScript“ src="DataGraph.js"></script><script language="JavaScript" src="Magnet.js"></script><script language="JavaScript" src="Spring.js"></script><script language="JavaScript" src="Particle.js"></script><script language="JavaScript" src="ParticleModel.js"></script><script language="JavaScript" src="Timer.js"></script><script language="JavaScript" src="EventHandler.js"></script><script language="JavaScript“
src="HTMLGraphView.js"></script><script language="JavaScript" src="SVGGraphView.js"></script><script language="JavaScript"
src="RungeKuttaIntegrator.js"></script><script language="JavaScript" src="Control.js"></script>
<!-- Demo Libraries --><script language="JavaScript" src="HTTP.js"></script><script language="JavaScript" src="XMLLoader.js"></script>
10/23/3006 Animation and Data Visualization in JavaScript 46
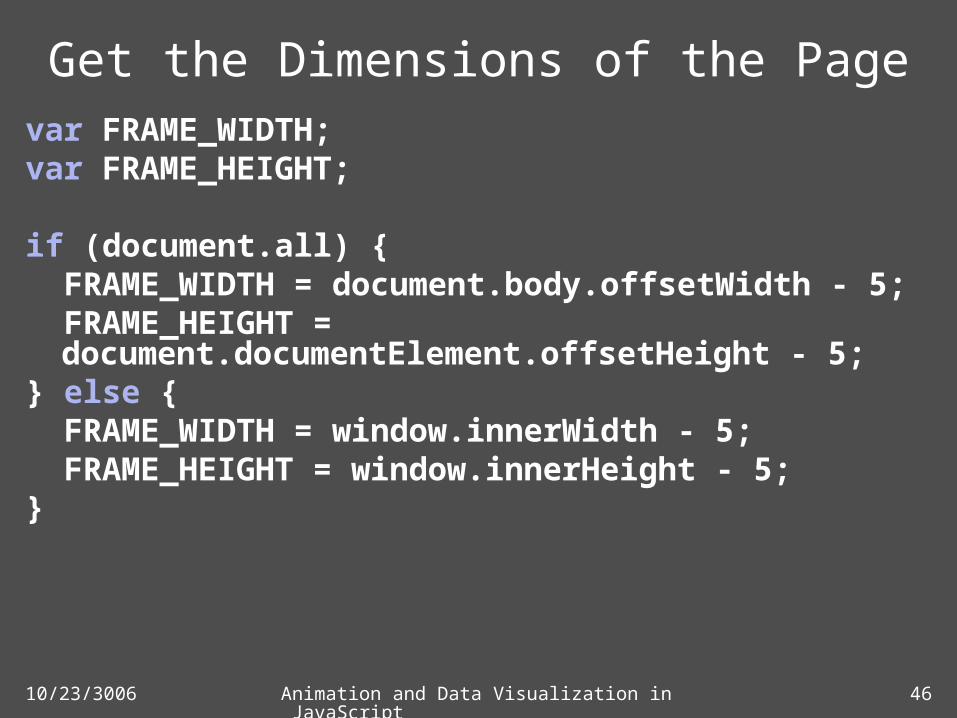
Get the Dimensions of the Pagevar FRAME_WIDTH;var FRAME_HEIGHT;
if (document.all) { FRAME_WIDTH = document.body.offsetWidth - 5; FRAME_HEIGHT = document.documentElement.offsetHeight - 5;
} else { FRAME_WIDTH = window.innerWidth - 5; FRAME_HEIGHT = window.innerHeight - 5;}

10/23/3006 Animation and Data Visualization in JavaScript 47
Initialize Componentsvar view;if ( document.implementation.hasFeature(
"org.w3c.dom.svg", '1.1') ) { view = new SVGGraphView( 0, 0,
FRAME_WIDTH, FRAME_HEIGHT );} else {
view = new HTMLGraphView( 0, 0,FRAME_WIDTH, FRAME_HEIGHT );
}
var particleModel = new ParticleModel( view );particleModel.start();
var control = new Control( particleModel, view );
var dataGraph = new DataGraph();var nodeHandler = new NodeHandler(
dataGraph, particleModel, view, control );dataGraph.subscribe( nodeHandler );

10/23/3006 Animation and Data Visualization in JavaScript 48
Initialize Components (2)
Initialize our XMLLoader
var xmlLoader = new XMLLoader( dataGraph );xmlLoader.load( "nodes.xml" );
Also, we want to add particles to the model over time, enabling the model to organize under less entropy.
var buildTimer = new Timer( 150 ); buildTimer.subscribe( nodeHandler ); buildTimer.start();

10/23/3006 Animation and Data Visualization in JavaScript 49
Using JSVizStep 3: Interpret Data into Model & View
DataGraphNode
Handler
ParticleModel
View

10/23/3006 Animation and Data Visualization in JavaScript 50
Interpreting the Datavar NodeHandler = function( dataGraph, particleModel,
view, control ) {this.dataGraph = dataGraph;this.particleModel = particleModel;this.view = view;this.control = control;this.queue = new Array();
this['newDataGraphNode'] = function( dataGraphNode ) {
this.enqueueNode( dataGraphNode );}
this['newDataGraphEdge'] = function( nodeA, nodeB ) { // Empty. We learn everything we need from // newDataGraphNode()}
}

10/23/3006 Animation and Data Visualization in JavaScript 51
Interpreting the Data (2)this['enqueueNode'] = function( dataGraphNode ) { this.queue.push( dataGraphNode );}
this['dequeueNode'] = function() { var node = this.queue.shift(); if ( node ) { this.addParticle( node ); }}
this.update = function() { this.dequeueNode();}

10/23/3006 Animation and Data Visualization in JavaScript 52
Adding Particles to the Modelthis['addParticle'] = function( dataGraphNode ) { particle = this.particleModel.makeParticle( dataGraphNode.mass, 0, 0 );
// Make a “view node” in SVG if we can if ( document.implementation.hasFeature( "org.w3c.dom.svg", '1.1') ) {
var bubble = document.createElementNS( "http://www.w3.org/2000/svg", "circle"); bubble.setAttribute('stroke', '#888888'); bubble.setAttribute('stroke-width', '.25px'); bubble.setAttribute('fill', dataGraphNode.color); bubble.setAttribute('r', 6 + 'px'); bubble.onmousedown = new EventHandler( control, control.handleMouseDownEvent, particle.id ) var viewNode = this.view.addNode(particle, bubble);

10/23/3006 Animation and Data Visualization in JavaScript 53
Adding Particles to the Model (2) } else { // Otherwise, make the view node in HTML var bubble = document.createElement( 'div' ); bubble.style.position = "absolute"; bubble.style.width = "12px"; bubble.style.height = "12px";
var color = dataGraphNode.color.replace( "#", "" ); bubble.style.backgroundImage = "url( /cgi-bin/bubble.pl?title=&r=12&pt=8&b=888888&c=" + color + ")";
bubble.innerHTML = ''; bubble.onmousedown = new EventHandler( control, control.handleMouseDownEvent, particle.id ) var viewNode = this.view.addNode(particle, bubble); }

10/23/3006 Animation and Data Visualization in JavaScript 54
Adding Particles to the Model (2) // Determine if this particle's position // should be fixed. if ( dataGraphNode.fixed ) { particle.fixed = true; }
// Assign a random position to the particle. var rx = Math.random()*2-1; var ry = Math.random()*2-1; particle.positionX = rx; particle.positionY = ry;
10/23/3006 Animation and Data Visualization in JavaScript 55
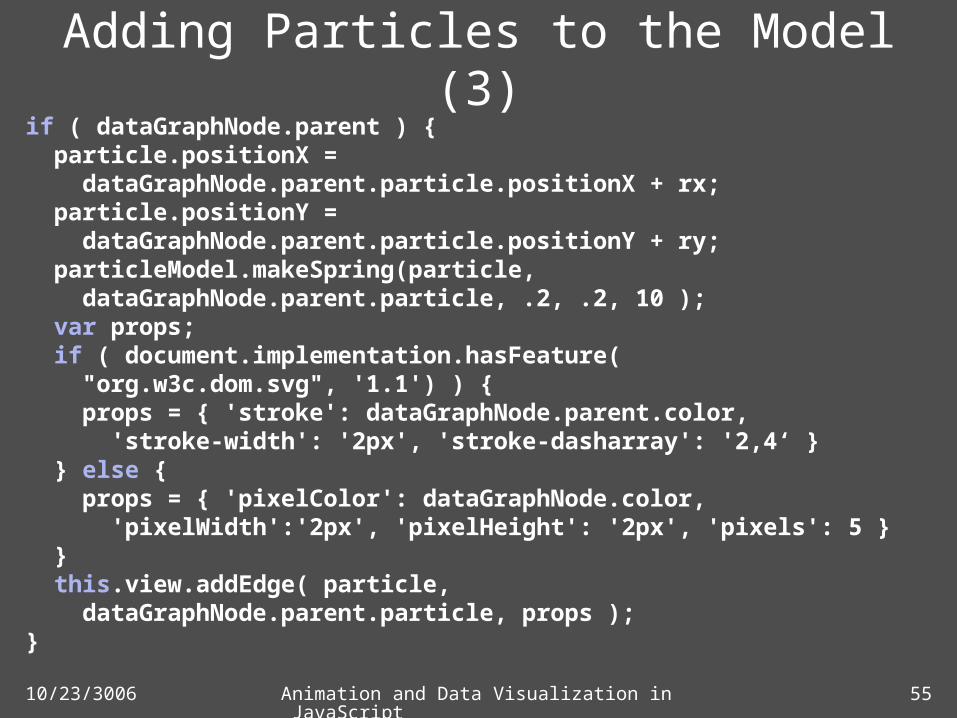
Adding Particles to the Model (3)if ( dataGraphNode.parent ) { particle.positionX = dataGraphNode.parent.particle.positionX + rx; particle.positionY = dataGraphNode.parent.particle.positionY + ry; particleModel.makeSpring(particle, dataGraphNode.parent.particle, .2, .2, 10 ); var props; if ( document.implementation.hasFeature( "org.w3c.dom.svg", '1.1') ) { props = { 'stroke': dataGraphNode.parent.color, 'stroke-width': '2px', 'stroke-dasharray': '2,4‘ } } else { props = { 'pixelColor': dataGraphNode.color, 'pixelWidth':'2px', 'pixelHeight': '2px', 'pixels': 5 } } this.view.addEdge( particle, dataGraphNode.parent.particle, props );}
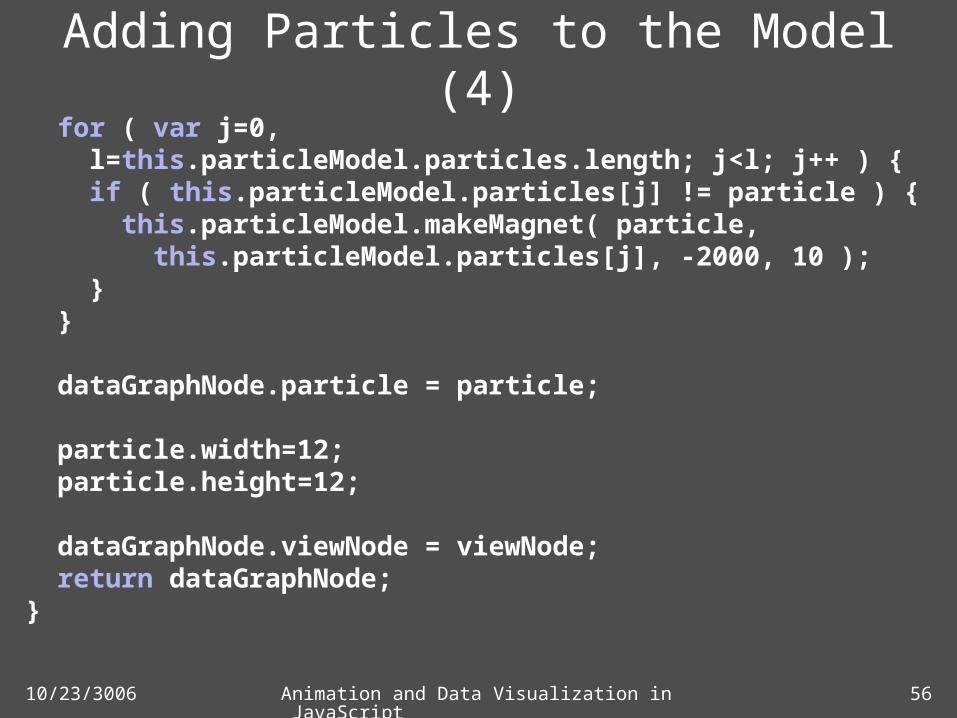
10/23/3006 Animation and Data Visualization in JavaScript 56
Adding Particles to the Model (4) for ( var j=0, l=this.particleModel.particles.length; j<l; j++ ) { if ( this.particleModel.particles[j] != particle ) { this.particleModel.makeMagnet( particle, this.particleModel.particles[j], -2000, 10 ); } }
dataGraphNode.particle = particle;
particle.width=12; particle.height=12;
dataGraphNode.viewNode = viewNode; return dataGraphNode;}

10/23/3006 Animation and Data Visualization in JavaScript 57
Model of our Data

Tutorial #3Mashing Up Web Services
with JSViz

10/23/3006 Animation and Data Visualization in JavaScript 59
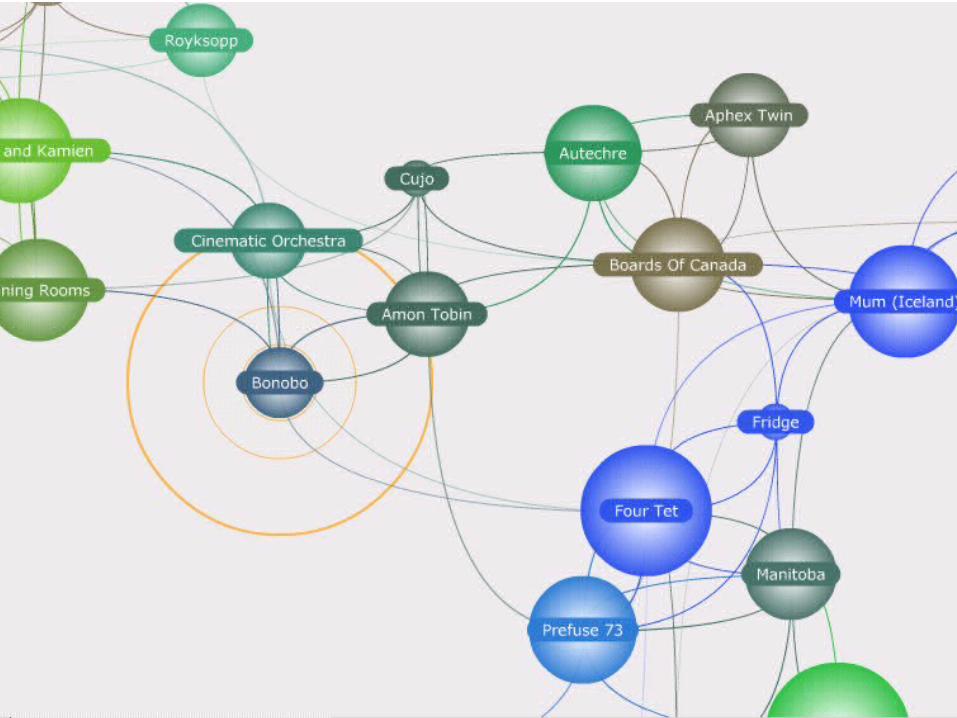
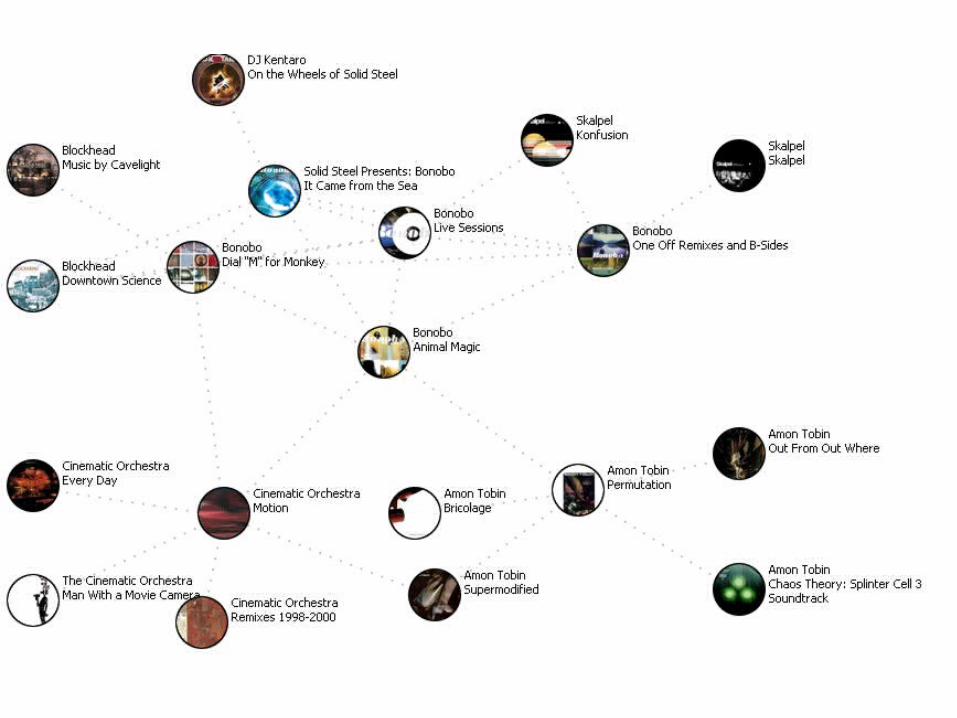
So What are We Building?
• Let’s create an interactive application for finding music recommendations using Amazon.com’s Similarity API.

10/23/3006 Animation and Data Visualization in JavaScript 60

10/23/3006 Animation and Data Visualization in JavaScript 61
Getting Started
• We’re going to use Tutorial #2 as a base, so most of the work is done.
• First, we’ll need to make a Loader for Amazon data.

10/23/3006 Animation and Data Visualization in JavaScript 62
Amazon.jsvar Amazon = function( dataGraph, particleModel ) {
this.init( dataGraph, particleModel );}Amazon.prototype = { init: function( dataGraph, particleModel ) { this.http = new HTTP();
this.dataGraph = dataGraph; this.particleModel = particleModel;
this.TRAVERSE_DEPTH = 1; this.MAX_SIMILAR = 6; this.MAX_NODES = 18;
this.nodesByName = {}; this.nodesCount = 0;
}}

10/23/3006 Animation and Data Visualization in JavaScript 63
Amazon.js (2) search: function( productId, artist, title, image ) {
document.getElementById('artistResults') .style.display="none";
var node = new DataGraphNode( true, 2 ); node.label = productId; node.artist = artist; node.title = title; node.image = image; this.dataGraph.addNode( node );
this.nodesByName[productId] = node;
this.getSimilar( productId, 0 ); },

10/23/3006 Animation and Data Visualization in JavaScript 64
Amazon.js (3) getSimilar: function( productId, ordinal ) { var similarityURL = "http://ecs.amazonaws.com..." +
productId + “…"; this.http.get( PROXY_BASE + escape(similarityURL); this, this.handleSimilar, productId, ordinal ); },

10/23/3006 Animation and Data Visualization in JavaScript 65
Amazon.js (4)handleSimilar: function( request, parentId, ordinal ) { var xmlDoc = request.responseXML; var amzItem = xmlDoc.documentElement. getElementsByTagName(“Items")[0]. getElementsByTagName("Item");
for ( var i=0, l=amzItem.length; i<l && i<this.MAX_SIMILAR && this.nodesCount < this.MAX_NODES; i++ ) {
var amzArtist = amzItem[i]. getElementsByTagName("Artist")[0]; var productId = getTextFromNode( amzItem[i].getElementsByTagName("ASIN")[0] ); var amzTitle = getTextFromNode( amzItem[i].getElementsByTagName("Title")[0] );

10/23/3006 Animation and Data Visualization in JavaScript 66
Amazon.js (5) var smallImage = amzItem[i]. getElementsByTagName("SmallImage")[0]; var smallImageURL = null; if ( smallImage ) { smallImageURL = getTextFromNode( smallImage.getElementsByTagName("URL")[0] ); }
if ( !this.nodesByName[productId] ) { var node = new DataGraphNode( false, 1); node.label = productId; node.artist = getTextFromNode( amzArtist ); node.title = amzTitle;
if ( smallImageURL ) { smallImageURL = 'http://kylescholz.com/cgi-
bin/img_circle50.cgi?x=0&url=' + smallImageURL; }

10/23/3006 Animation and Data Visualization in JavaScript 67
Amazon.js (6) node.image = smallImageURL; node.addEdge( this.nodesByName[parentProductId], 1 ); this.dataGraph.addNode( node ); this.nodesCount++;
this.nodesByName[productId] = node; if ( ordinal < this.TRAVERSE_DEPTH ) { this.getSimilar( productId, ordinal+1 ); } } else { var node = this.nodesByName[productId]; this.dataGraph.addEdge( node, this.nodesByName[parentProductId] ); } }}

10/23/3006 Animation and Data Visualization in JavaScript 68
Interpreting the Data
• We can start with the NodeHandler we used in Tutorial #2.
• We’ll add some additional functionality to queue up relationships.
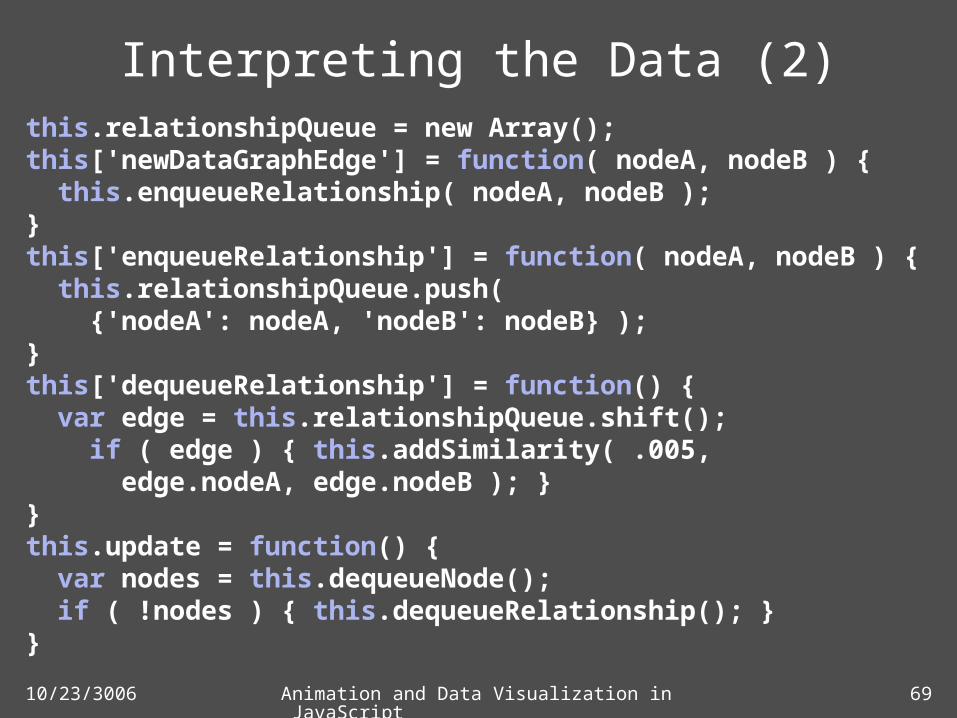
10/23/3006 Animation and Data Visualization in JavaScript 69
Interpreting the Data (2)this.relationshipQueue = new Array();this['newDataGraphEdge'] = function( nodeA, nodeB ) { this.enqueueRelationship( nodeA, nodeB );}this['enqueueRelationship'] = function( nodeA, nodeB ) { this.relationshipQueue.push( {'nodeA': nodeA, 'nodeB': nodeB} );}this['dequeueRelationship'] = function() { var edge = this.relationshipQueue.shift(); if ( edge ) { this.addSimilarity( .005, edge.nodeA, edge.nodeB ); }}this.update = function() { var nodes = this.dequeueNode(); if ( !nodes ) { this.dequeueRelationship(); }}

10/23/3006 Animation and Data Visualization in JavaScript 70
Interpreting the Data (3)this['addSimilarity'] = function( springConstant, nodeA,
nodeB ) { particleModel.makeSpring( nodeA.particle,
nodeB.particle, springConstant, .2, 80 ); var props; if ( document.implementation.hasFeature( "org.w3c.dom.svg", '1.1') ) { props = {'stroke': "#bbbbbb", 'stroke-width': '2px', 'stroke-dasharray': '2,8‘ } } else { props = {'pixelColor': "#aaaaaa", 'pixelWidth': '2px','pixelHeight': '2px', 'pixels': 15 } } this.view.addEdge( nodeA.particle, nodeB.particle, props );}
10/23/3006 Animation and Data Visualization in JavaScript 71
Adding Particles to the Model
• addParticle() only differs in they way we construct the view.

10/23/3006 Animation and Data Visualization in JavaScript 72
Adding Particles to the Model (2)if ( dataGraphNode.image ) { var imgNode = document.createElement('div'); imgNode.style.position = "absolute"; imgNode.className = "artist"; imgNode.style.backgroundImage = "url('" + dataGraphNode.image + "')"; imgNode.innerHTML = '<div style="padding-left:52px;" class="artist" onclick="' + "amazon.search('" + dataGraphNode.label + "', '" + dataGraphNode.artist + "', '" + dataGraphNode.title + "', '" + dataGraphNode.image + "')" + '">' + dataGraphNode.artist + '<br>' + dataGraphNode.title + '</div>'; imgNode.onmousedown = new EventHandler( control, control.handleMouseDownEvent, particle.id ) var viewNode = this.view.addNode( particle, imgNode, 25, 25 );

10/23/3006 Animation and Data Visualization in JavaScript 73
Adding Particles to the Model (3)// If no image is available, create a view node from// the available text.} else { var txtNode = document.createElement('div'); txtNode.style.width = "200px"; txtNode.style.position = "absolute"; txtNode.className = "artist"; txtNode.innerHTML = '<div class="artist" style="text- align:center;" onclick="' + "amazon.search('" + dataGraphNode.label + "', '" + dataGraphNode.artist + "', '" + dataGraphNode.title + "', '" + dataGraphNode.image + "')" + '">' + dataGraphNode.artist + '<br>' + dataGraphNode.title + '</div>'; txtNode.onmousedown = new EventHandler( control, control.handleMouseDownEvent, particle.id ) var viewNode = this.view.addNode( particle, txtNode );}
10/23/3006 Animation and Data Visualization in JavaScript 74
10/23/3006 Animation and Data Visualization in JavaScript 75
Extending this Example
• Use node size to convey meaning: “SalesRank” or other popularity
• Add extended information: Prices, checkout links, etc.

Resourcehttp://kylescholz.com/blog
JSViz and all other source code used in this presentation is available under
Creative Commons license.
Photo Credits
Photos in this presentation are used under a Creative Commons Attribution License. The original photo and license can be viewed at the URLs indicated.
13 – http://www.flickr.com/photo_zoom.gne?id=202201824&size=o16 – http://www.flickr.com/photo_zoom.gne?id=131063667&size=l24 – http://www.flickr.com/photo_zoom.gne?id=55300449&size=l
Top Related